Article

Blunt Notch Strength of AA2024 3-3/2-0.4 Fibre Metal Laminate Under Biaxial Tensile Loading

1
German Aerospace Center, Institute of Materials Research, 51147 Cologne, Germany
2
Airbus Operations GmbH, 21129 Hamburg, Germany
3
Metallic Structures and Materials Systems for Aerospace Engineering, RWTH Aachen University, 52062 Aachen, Germany
*
Author to whom correspondence should be addressed.
Metals 2019, 9(4), 413; https://doi.org/10.3390/met9040413
Submission received: 18 March 2019 / Revised: 28 March 2019 / Accepted: 1 April 2019 / Published: 5 April 2019
(This article belongs to the Special Issue Modern Aerospace Materials)

Abstract

:
Fibre metal laminates are utilized in lightweight structures, such as aircraft fuselages, as fibre metal laminates provide outstanding fatigue and damage tolerance capabilities, together with a reduced weight compared to monolithic metallic structures. One critical feature of fuselage structures is their strength reduction that owes to riveting, i.e., a state-of-the-art joining technique in aircrafts. In the present work, the blunt notch strength of fibre-laminate panels with rivet holes is investigated under service-relevant biaxial loading conditions. To this purpose, cruciform specimens with a five-hole pattern were produced. These specimens were tested under various biaxiality ratios and fibre orientations. All tests were supported by three-dimensional digital image correlation to obtain the deformation field in the gauge area. Moreover, the displacement fields obtained during deformation were used in an elasto-plastic finite element model as boundary conditions to determine the maximum strains in the vicinity of the blunt notch holes and thus extend the application of the experimental results. The asymmetric strain fields obtained by digital image correlation reveal the interaction of the fibres with the blunt notch holes. Finally, it is shown that the biaxial loading conditions do not significantly influence the blunt notch strength.

1. Introduction

Fibre metal laminates (FML) are made of multiple layers of metallic foils and fibre reinforced polymers. They were introduced as high-performance materials with improved fatigue and damage tolerance properties as a competitor for metallic airplane structures [1]. The most successful FML is known under the trade name Standard-GLARE, an FML that combines thin AA2024 (aluminium alloy 2024) sheets (0.2 to 0.5 mm) and a glass fibre reinforced polymer. The first extended application of GLARE is as skin material in the fuselage of the Airbus A380 aircraft [2]. The main drivers for the application in the A380 were superior fatigue and damage tolerance compared to monolithic aluminium alloys [3,4]. Owing to fibre bridging, the fatigue crack growth rate remains slow and at an almost constant level, which—as a side benefit—simplifies the dimensioning of structures [5]. Additionally, the residual strength of GLARE, in case of a crack in the aluminium alloy layer (initiated by fatigue), is much higher compared to aluminium alloys, as the fibres can carry most of the load [5,6]. The design targets for the A380 GLARE shells, given by Airbus, are: damage arrest capability (“two bay crack”), no scheduled fatigue inspections, and ≈15% weight saving for the stiffened GLARE shells, compared with monolithic AA2024 structures.
Riveting is a state-of-the-art joining technique in aircraft structures. The presence of rivet holes can lead to local stress redistribution and stress concentration at the rivet holes. Holes or blunt notches, in general, decrease a material’s strength, especially for the application of riveted/bolted repairs. The following details concerning blunt notch strength have to be considered during the design process of FML structures [1]:
(1)
Failure mode: ultimate tensile strength (no notch in laminate) in fibre direction. At similar thickness, the yield strength of AA2024-FML is reached earlier than in the monolithic alloy, owing to residual stresses provoked by the polymer curing process and the effective Young’s modulus that results from the combination of the aluminium alloy foils and the prepregs. Above the yield strength of the FML, the fibres start to bare a significant part of the load and a second linear stress/strain behaviour develops. Failure of the laminate occurs when the maximum strength of the fibres is reached. The ultimate tensile strength of Standard-GLARE3-3/2-0.4 is about 680 MPa in the fibre direction [1].
(2)
Blunt notch failure mode. Drilling holes in GLARE leads to the sectioning of glass fibres, i.e., the main load carrying component of the laminate is damaged. Stress concentrations appear in the vicinity of the holes, e.g., in riveted joints, and high shear stresses form between undamaged fibres. This phenomenon is called “fibre splitting” [1]. Following fibre splitting, the fibres adjacent to the drilled hole (undamaged) must bear additional loads from the sectioned fibres. However, delamination between aluminium alloy foils and prepreg goes along with the previously explained process, influencing the local load distribution and hence the failure load. The complex sequence of failure modes relates to the local strains and stresses, and, therefore, blunt notch failure must be related to net section stresses (see Equation (1)):
σ net = W W D · σ nominal
where W is the width of the specimen and D is the sum of the diameter of the holes. This leads to a situation where the blunt notch strength depends on the size of the specimen. This means that the wider the specimen, the more the blunt notch strength decreases [7]. Finally, the blunt notch strength always provides a design value. The demand to relate blunt notch failure stresses under off-axis conditions to the net section is one of the challenges during the sizing of FML panes. The typical blunt notch stress (net stress) of Standard-GLARE3-3/2-4 is about 480 MPa in the L-direction (fibre orientation 0°) [1].
Researchers from the TU Delft and the NLR [5,7] focused on the blunt notch behaviour under uniaxial tensile loading for various GLARE types.
In order to extend the understanding of Standard-GLARE failure modes, and to exploit the material’s full capability, precise knowledge of the material’s limits is needed. Hence, in the present study, biaxial tensile test experiments were conducted on Standard-GLARE3-3/2-4 (= 2024-FML3-3/2-4) under various biaxiality ratios and off-axis fibre orientation angles. This paper presents the specimen design for the biaxial tests, gives experimental results, and features a finite element simulation for profound analysis of the experiments.

2. Material and Specimen Design

2.1. Material

All experiments were conducted on AA2024-FML 3-3/2-0.4 mm (also known as Standard-GLARE3-3/2-0.4) provided by Premium Aerotec (Nordenham, Germany). The layup of FML-3 is intended for biaxially loaded structures with biaxial stress ratio of 1:1, which is a typical loading situation in the pressurized fuselage of airplanes [5]. Both the outer and the centre layers consist of AA2024-T3 aluminium alloy sheets with a thickness of 0.4 mm, as shown in Figure 1. Prepreg layers with unidirectional glass fibres (S2-glass), embedded at 0° and 90° orientation with respect to the rolling direction (RD), are glued in between the Al-alloy layers using an adhesive film (FM 94 by CYTEC, Woodland Park, NJ, USA). Hence, the FML layup is symmetrical to the central plane after curing in an autoclave.

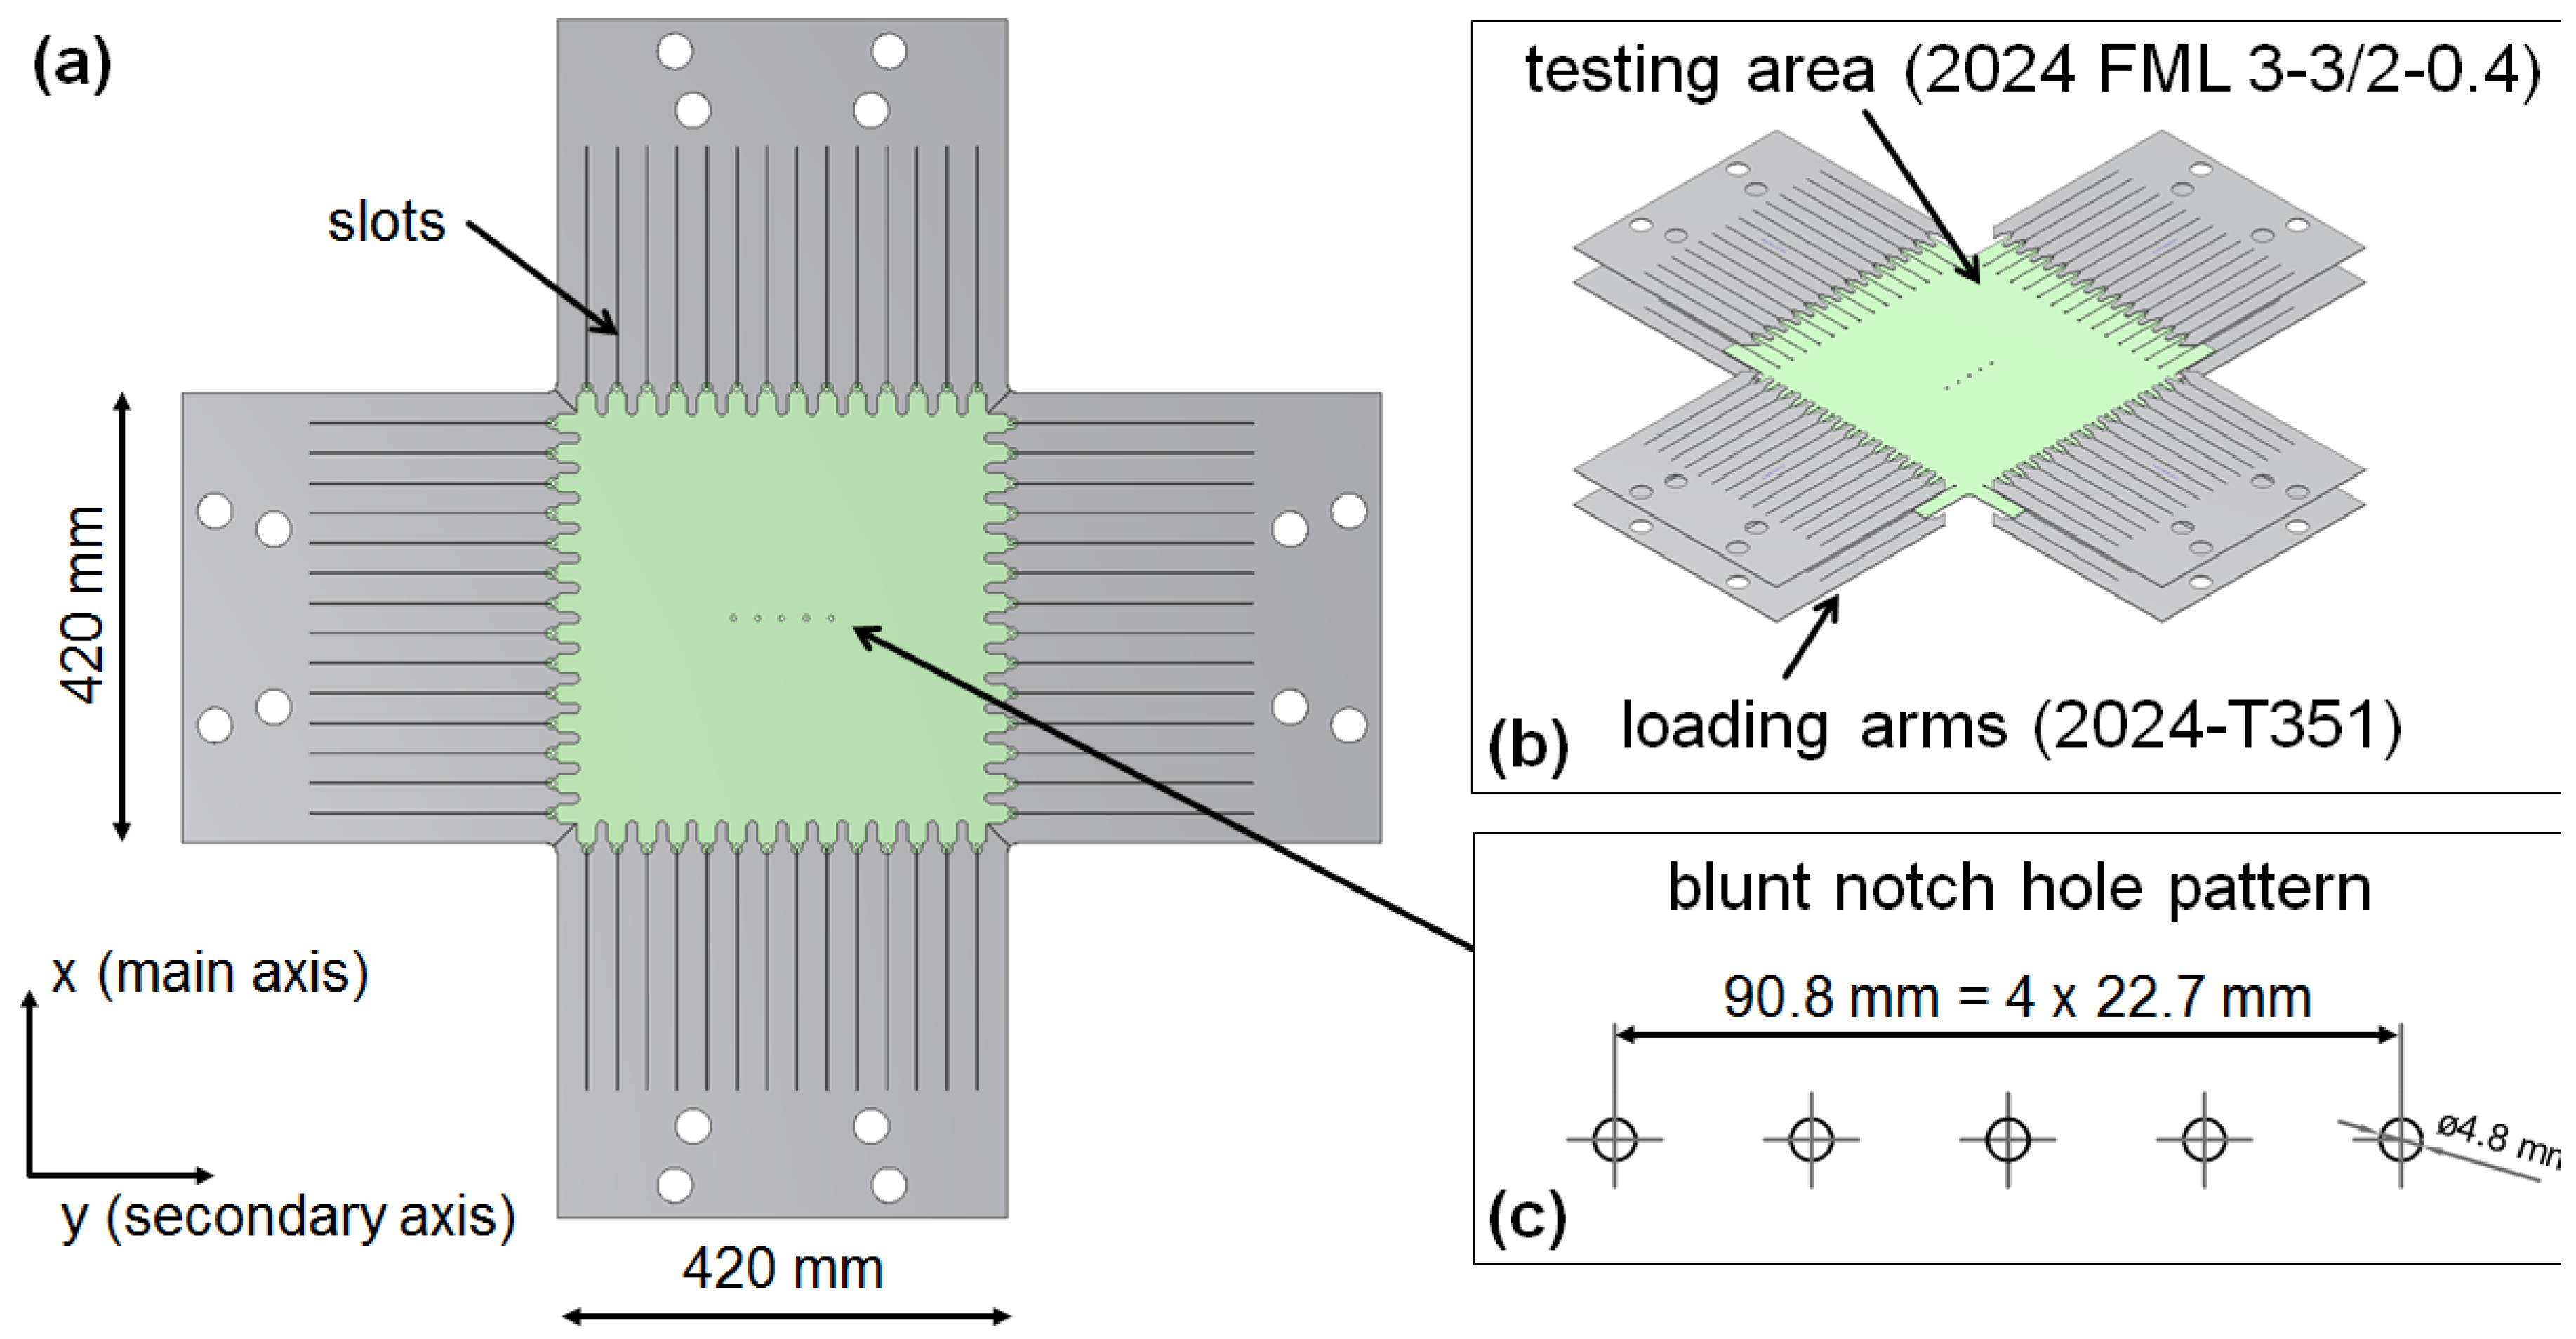
2.2. Design of Specimen for Biaxial Tests

Testing materials under biaxial loading conditions requires rather complex and elaborate specimen designs and experimental equipment. In particular, avoiding stress concentration at the corners of cruciform specimens while obtaining homogenous stress fields in the testing area are crucial points [8,9,10].
The specimen design for the present experiments is shown in Figure 2. A testing area of 420 × 420 mm2 is bonded to eight loading arms of AA2024-T3 with 2.5 mm thickness (see Figure 2b). Separation slots are introduced into the loading arms by water jet cutting to allow deformation in the directions transversal to the applied load. The specimen geometry has already been applied successfully for fatigue crack propagation experiments in aluminium alloys under cyclic loading [11,12].
Aligned holes were introduced in the centre of the specimen’s testing area (Figure 2). The pattern of alignment was chosen according to design aspects of an aircraft. Since rivets are placed in rows in fuselage structures, a pattern of five holes with a typical diameter of 4.8 mm and a spacing of 22.7 mm was realized (see Figure 2c). The holes were filled with rivets to mimic actual service conditions during the experiment. These rivets do not carry any load during the experiments. De Vries [5] reported that the results between open and filled blunt notch strength is negligible for GLARE 3 and 4. Besides the aspect aiming at a scenario close to reality, the pattern of holes must be large enough to reduce the strength of the testing area significantly in order to avoid premature failure outside the testing area. On the other hand, the pattern of holes should lie in a homogenous region of stresses. The pattern of holes is aligned perpendicular to the main loading axis (x direction, see Figure 2). Drilling of the holes was performed according to process instructions from Airbus/Premium Aerotec with a drill for monolithic aluminium with 5000 rpm and a forward speed of 800 mm/min.
Specimens were prepared with three different off-axis angles (α = 0°/30°/45°), corresponding to the angle between the loading axis and the fibre orientation, as illustrated in Figure 3. The resulting configurations of the blunt notch pattern and the biaxial loading conditions under the different off-axis angles are shown as well in Figure 3. Note that the blunt notch pattern remains perpendicular to the main loading axis.

3. Biaxial Tensile Tests

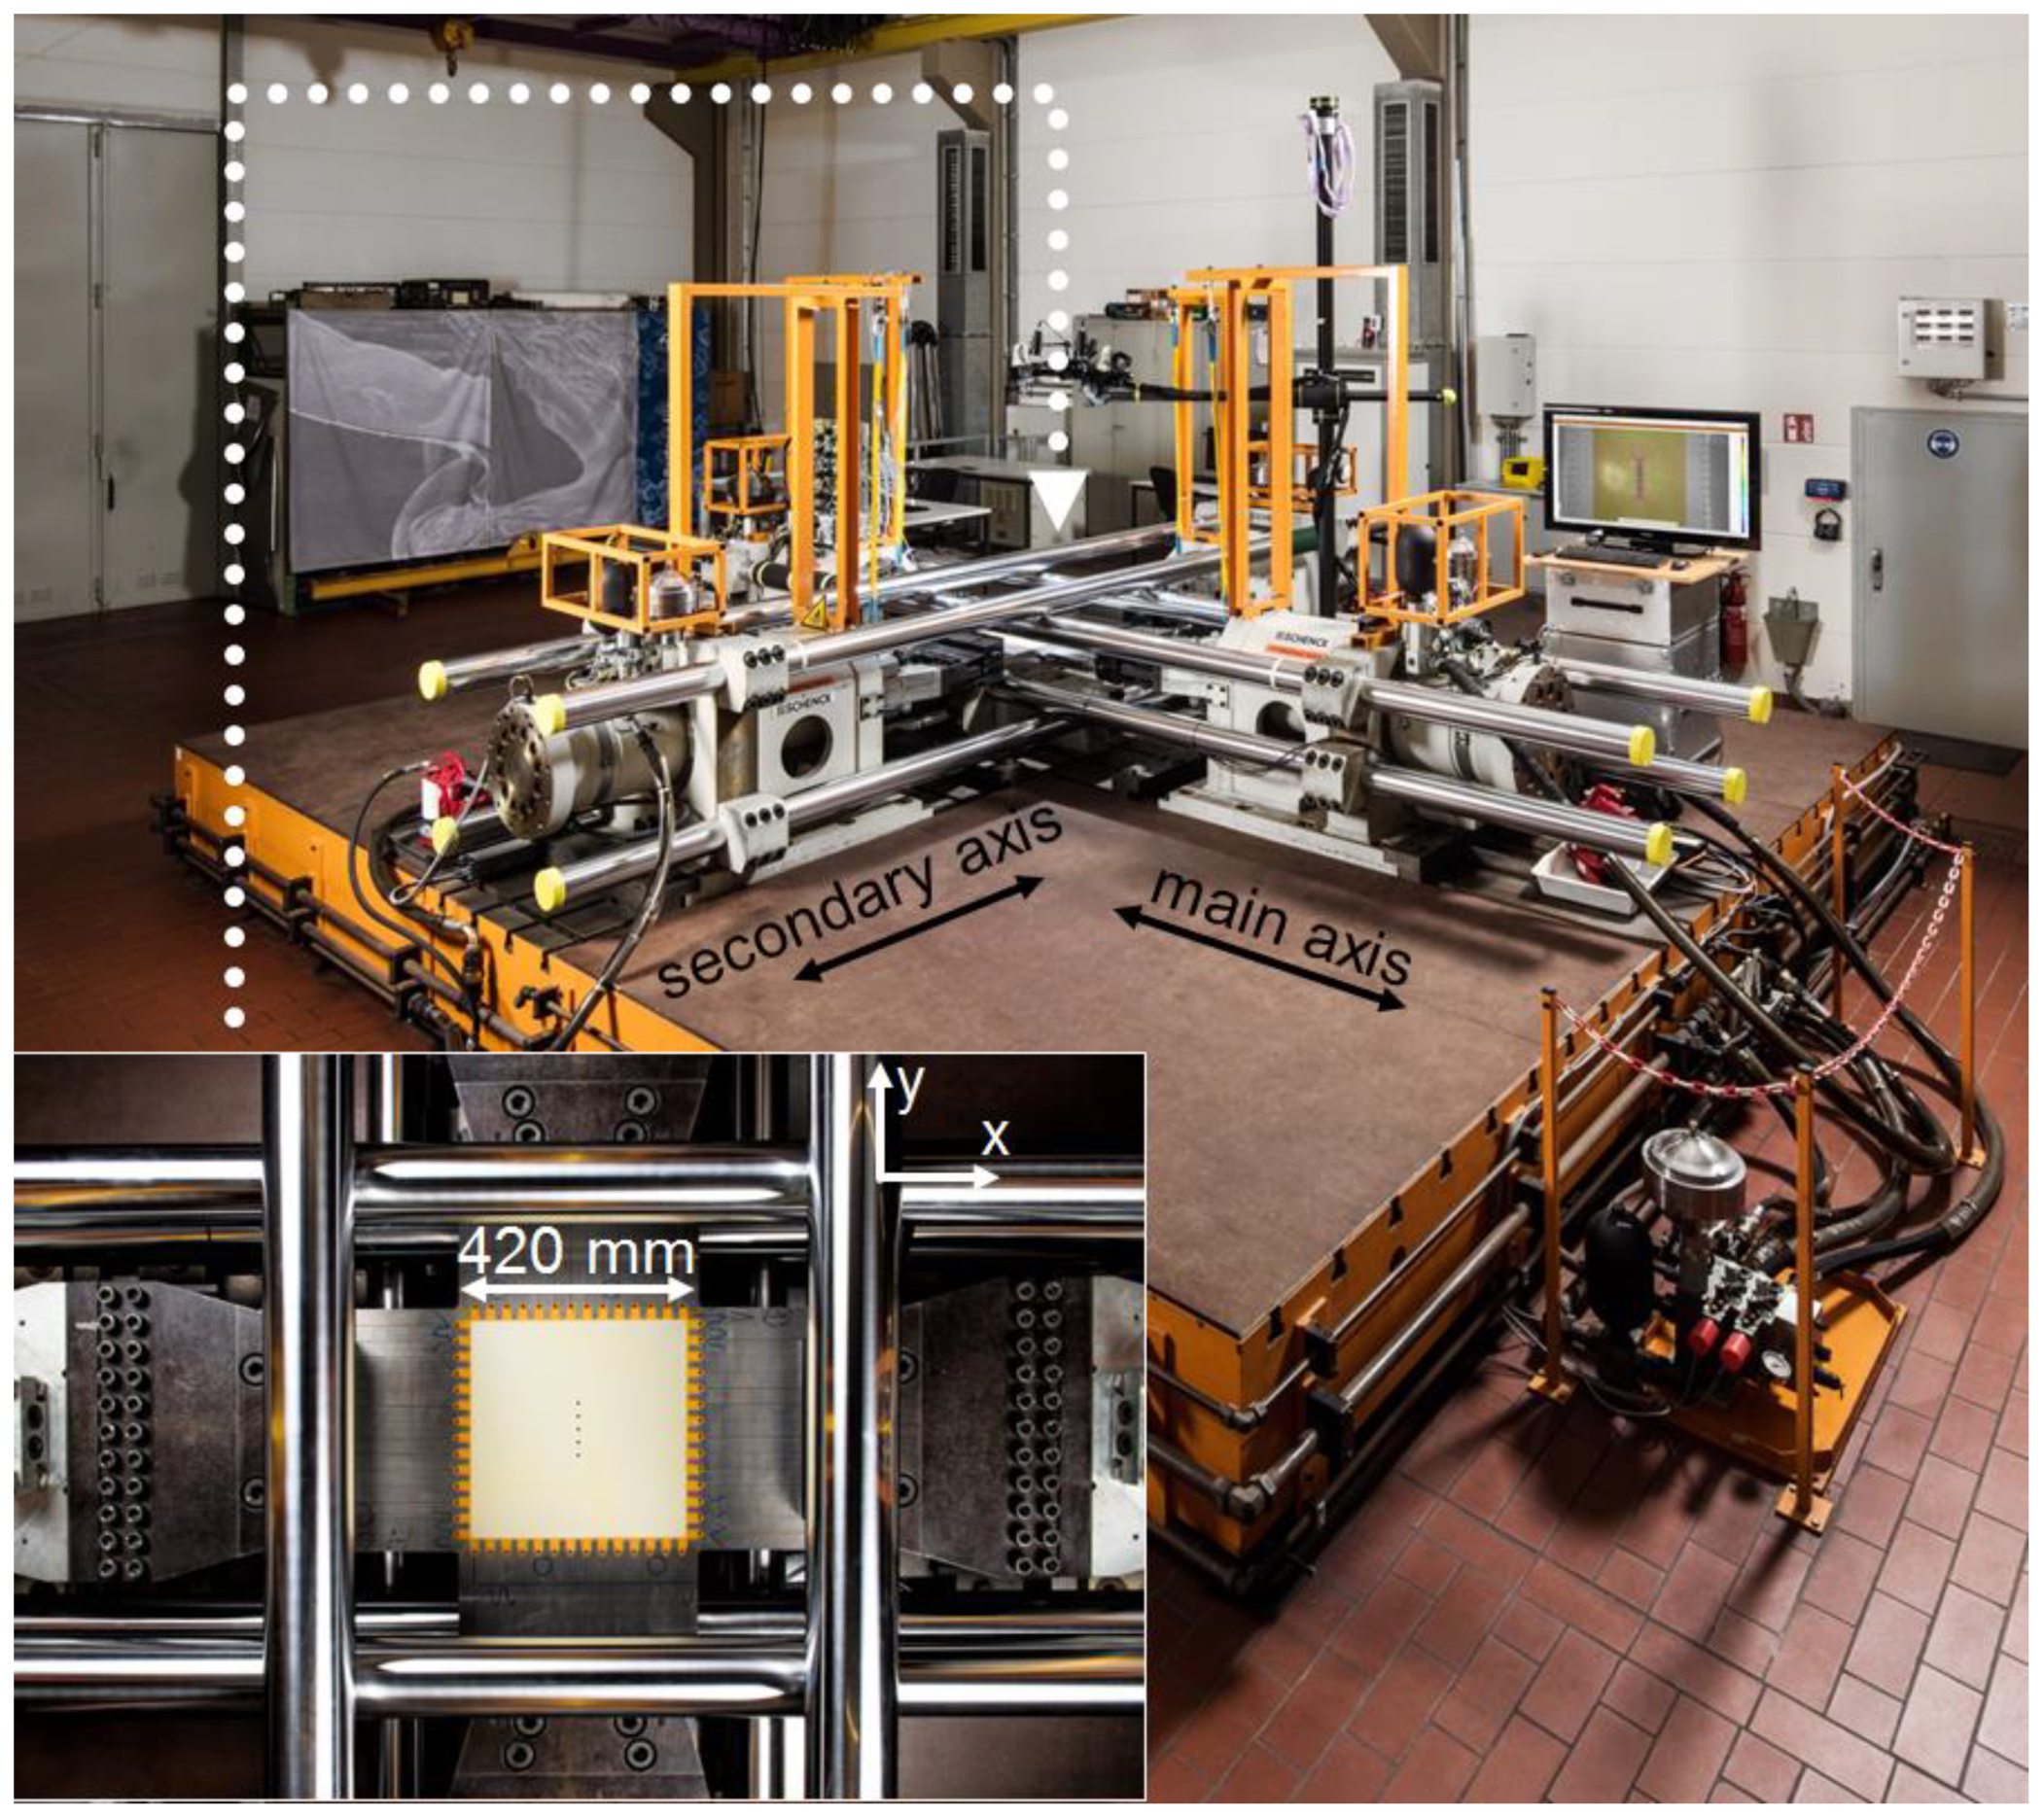
3.1. Experimental Setup

The Hydropuls Biax (Carl Schenck AG, Darmstadt, Germany) testing machine, shown in Figure 4, consists of four hydraulic cylinders. The two loading axes are formed by two opposing cylinders. The main axis and the orthogonally arranged secondary axis have static load capabilities of 1000 kN and 630 kN, respectively. Each cylinder is equipped with a load cell and a displacement sensor. Table 1 summarizes the details of the experimental setup.
A GOM Aramis 12M (GOM GmbH, Braunschweig, Germany) 3D digital image correlation system (DIC) was used to determine the displacement and strain fields in the specimen’s testing area. Both cameras of the stereo DIC system were positioned above the biaxial testing machine pointing at the specimen’s upper surface. For details regarding the DIC system and the gauge area, see Table 1. The cruciform specimens were prepared with a stochastic black & white pattern for the determination of the strain fields using the described DIC system. The testing area (green section in Figure 2) was first sprayed with a white ground coat and then speckled with black points. The DIC system was set to take images automatically during loading of the specimen. A stack of 300 to 400 images were recorded for each experiment.
The loading of the specimen was carried out by controlling the displacement of the main axis at a rate of 1 mm/min, while the force in the secondary axis was controlled following the force signal of the main axis to achieve the planned biaxiality ratio for the experiment.
The nominal stress was calculated by means of the force signal of the load cells per axis divided by the area of the gross cross-section of the biaxial specimens (σx = Fx/A, with A = 420 · 1.7 mm2).
The biaxiality ratio λ (Equation (2)) is defined as the ratio between the stress in the direction of the secondary axis (σy) and the stress in the direction of the main axis (σx):
λ = σ y / σ x
Thus, a uniaxial stress state emerges for λ = 0, while λ = 1 results in equal tensile stresses for the main and the secondary axes. Note that the stresses in this work always refer to the gross cross-sectional area without the aligned holes, namely the nominal stresses (with W = 420 mm) [13].

3.2. Results

Table 2 gives an overview of all tested specimens with the maximum nominal stresses reached and the locations of failure. Blunt notch (BN) failure indicates that the sample’s failure occurred in the form of a crack passing through the blunt notch holes. Most samples showed BN failure, as illustrated strongly in Figure 5a. The failure occurred abruptly through all holes. Four experiments had to be aborted because cracks began in the corner between the loading arms, as indicated by the red arrow in Figure 5b, owing to the stress concentration in this area.
Note that the stresses shown in Table 2 are gross or nominal stresses (see Equation (1)), which explains the difference of about 70 MPa between the nominal stress of 408 MPa at λ = 1 with the typical net stress of 481 MPa reported for uniaxial tensile tests with similar blunt notch hole configurations [1]. Figure 6a shows the characteristic stress-strain curves obtained for λ = 0.5 and the three off-axis-angles α = 0°/30°/45. The strains were determined at the surface of the sample using the DIC system. The local stresses in the different layers of the FML are not considered for the analysis, since only the nominal stresses are used in the aircraft design process. The average strains ϵ ¯ x , ϵ ¯ y were calculated for each loading stage. The area used for the determination of the strains is shown in Figure 6b. This area excluded the blunt notch pattern to avoid the consideration of the strain concentrations in the vicinity of the holes.
The location of failure is also indicated for each sample in Figure 6a. While for the specimens with off-axis angles of 0° and 30° failure occurred at the blunt notches, a crack originated outside the testing area for α = 45° (indicated by a red arrow). As the experiment was aborted prior to failure in the hole pattern, the actual blunt notch strength should be higher than the one shown for α = 45°. All stress-strain-curves begin with a linear elastic response, see insert in Figure 6a. Then, a strain hardening behaviour, analogous to monolithic metals, follows. This inelastic response is usually attributed to plasticity of the aluminium alloy layers [14,15,16,17,18], while the fibres are expected to behave linearly until reaching their failure strain [1].
The following observations can be made from the stress-strain-curves in Figure 6.
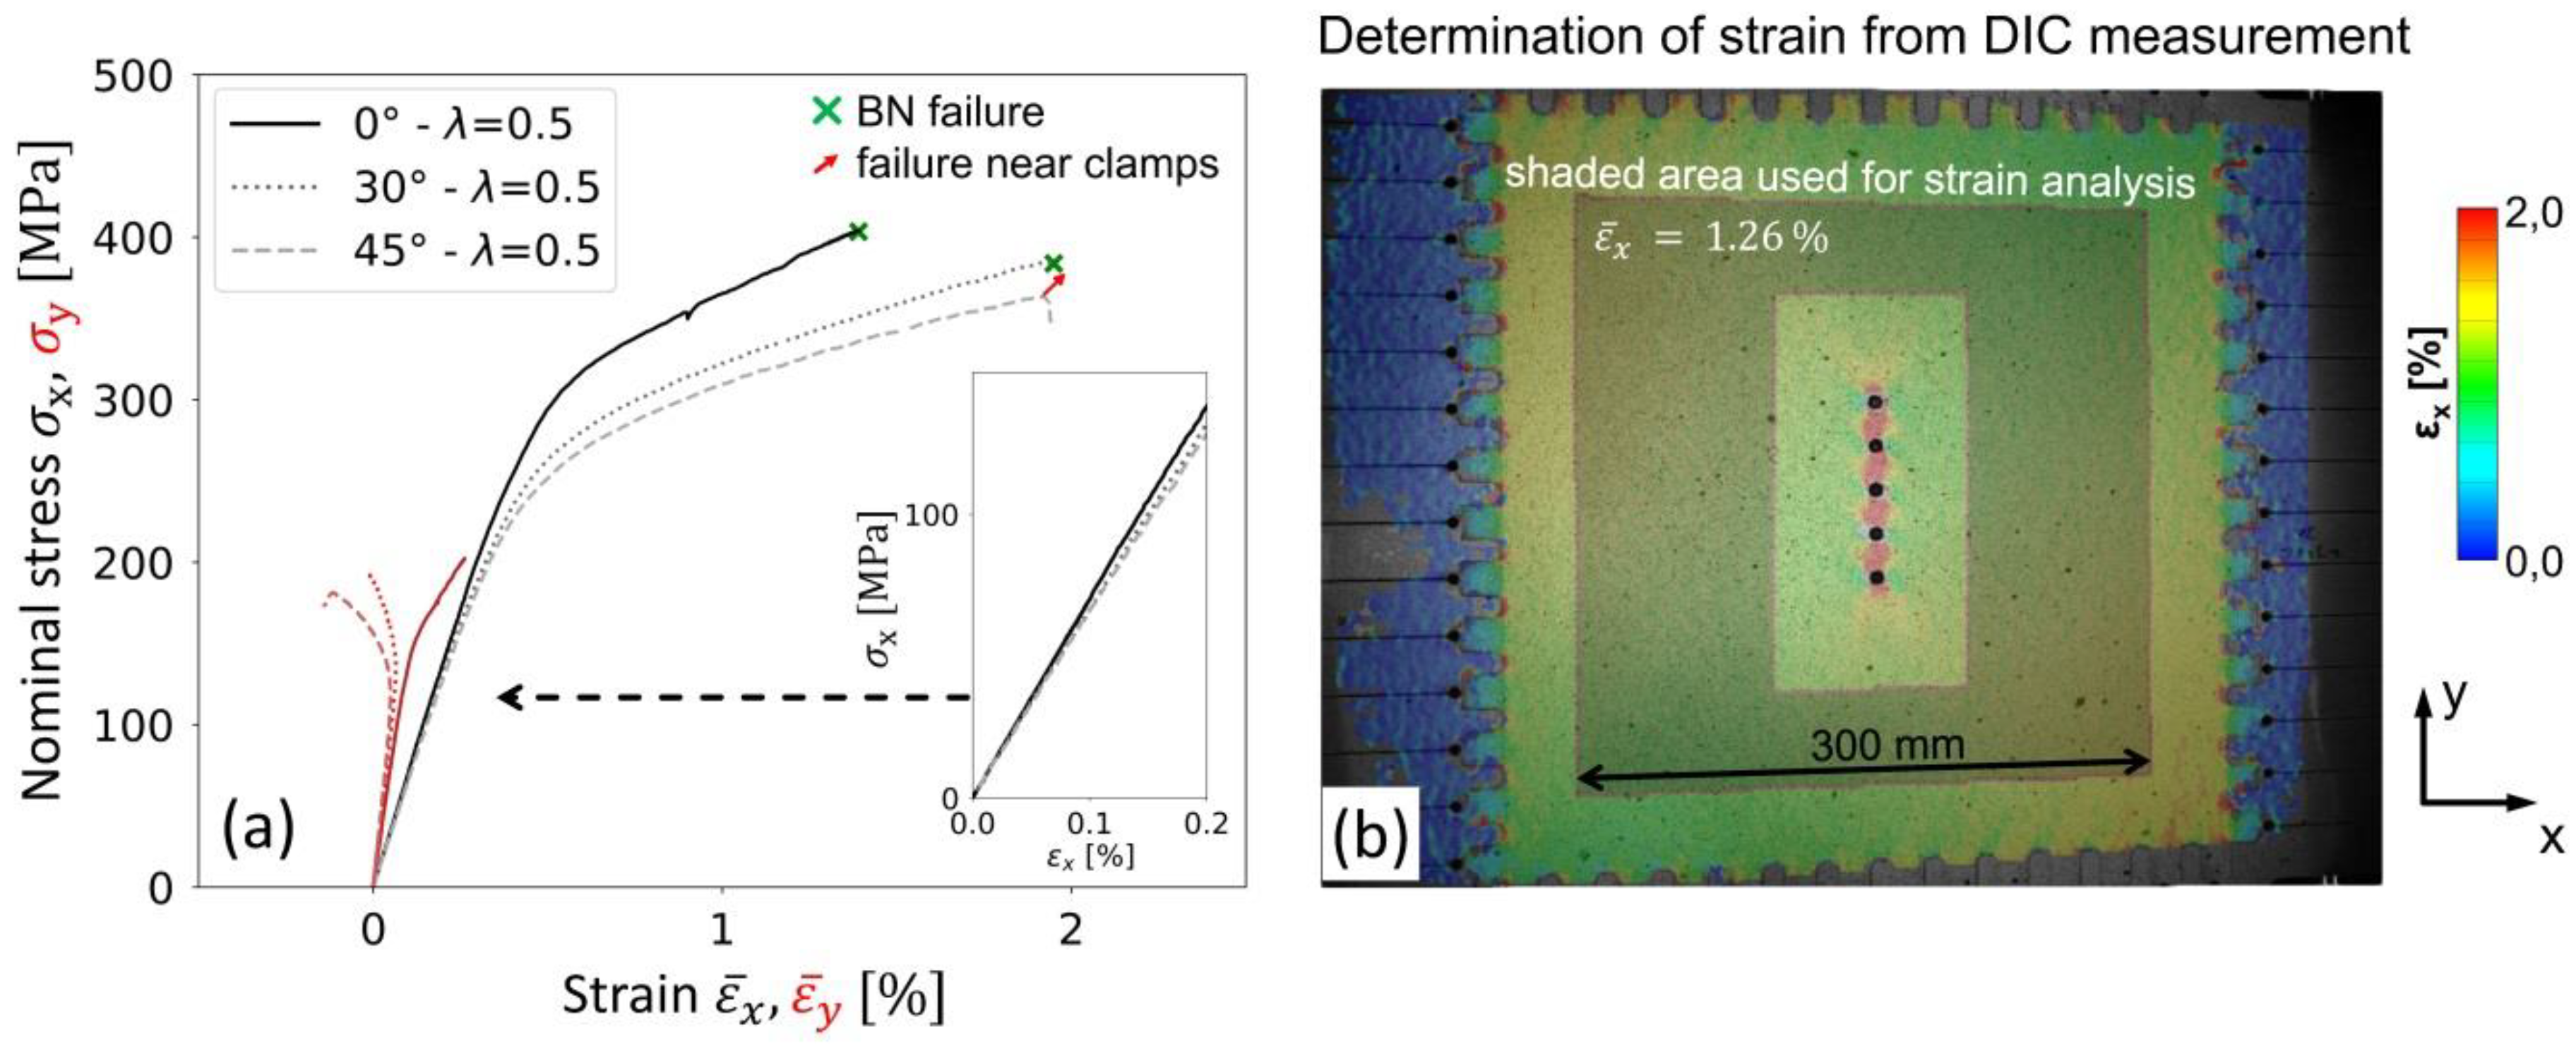
  • For α = 0°, the linear-to-nonlinear transition takes places at the highest stress level compared to 30° and 45°.
  • The slope of the linear range decreases with off-axis angle (insert in Figure 6a).
  • The tangent modulus, i.e., the slope of the stress-strain curve in the inelastic regime, for α = 0° is higher compared to α = 30° and 45°.
  • The strain ϵ ¯ y for α = 0° (red solid line in Figure 6a) shows positive values with a continuous positive slope throughout the test, while for α = 30° and 45° (dashed and dotted red lines in Figure 6a) the slope is positive until the inelastic range is reached. Subsequently, the slope becomes negative, and even negative strains ϵ ¯ y are reached. This behaviour can be explained by a change of the Poisson’s ratio ν from the elastic to plastic regime, due to shearing between the polymeric matrix and the fibers. While the Poisson’s ratio of the FML remains almost constant at about 0.3 for α = 0°, ν increases from ν = 0.35 (α = 30°) and ν = 0.37 (α = 45°) to above 0.5 in the linear-to-nonlinear transition. This effect has also been reported by other authors [16]. A Poisson’s ratio ν > 0.5 induces negative strains ε ¯ y for λ = 0.5 and results in the unusual trend of the stress-strain curve σ y - ε ¯ y .
The dominating effect of the fibres on the stress-strain response is clearly revealed by the strain field maps determined by DIC. The stress concentrations resulting from the presence of the holes are mainly carried by the fibres, as can easily be observed in the characteristic strain map in Figure 7 for λ = 0 and off-axis angle of 45°.
The specimens with α = 30° experienced severe strain inhomogeneity after the transition to the nonlinear regime. A characteristic example is shown in Figure 8 for the sample tested at λ = 0. While the strains in the linear region were distributed symmetrically along the centre axis of the specimen, the strain field became asymmetric in the nonlinear regime, when the fibres begin to dominate the materials’ behaviours. The strain asymmetry leads to two consequences:
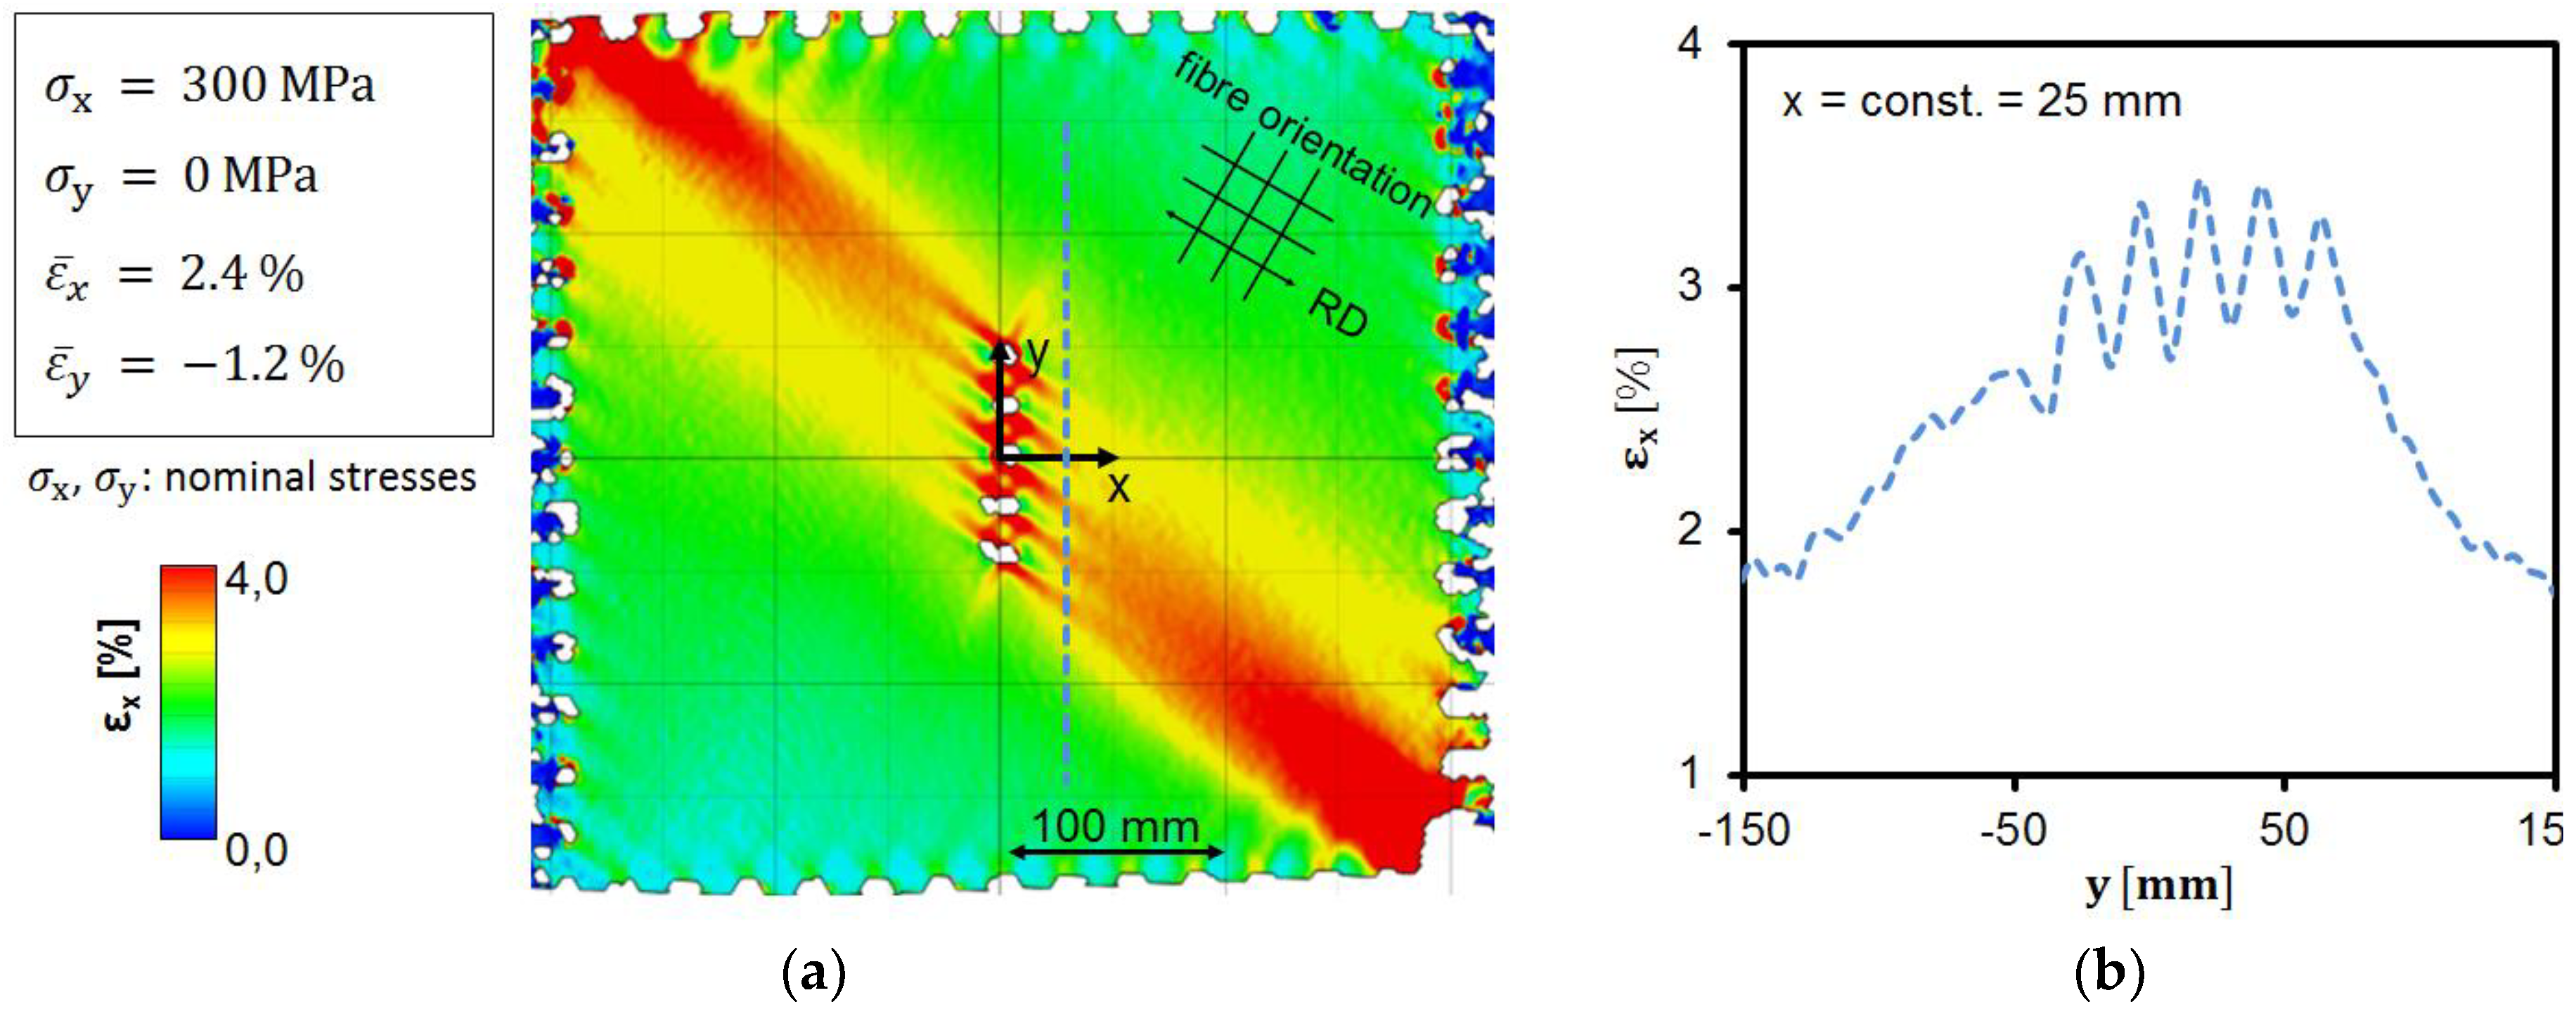
  • The corners of the specimen undergo increased strain concentrations (see left upper edge and right lower edge in Figure 8a), which raises the probability of failure outside the BN pattern.
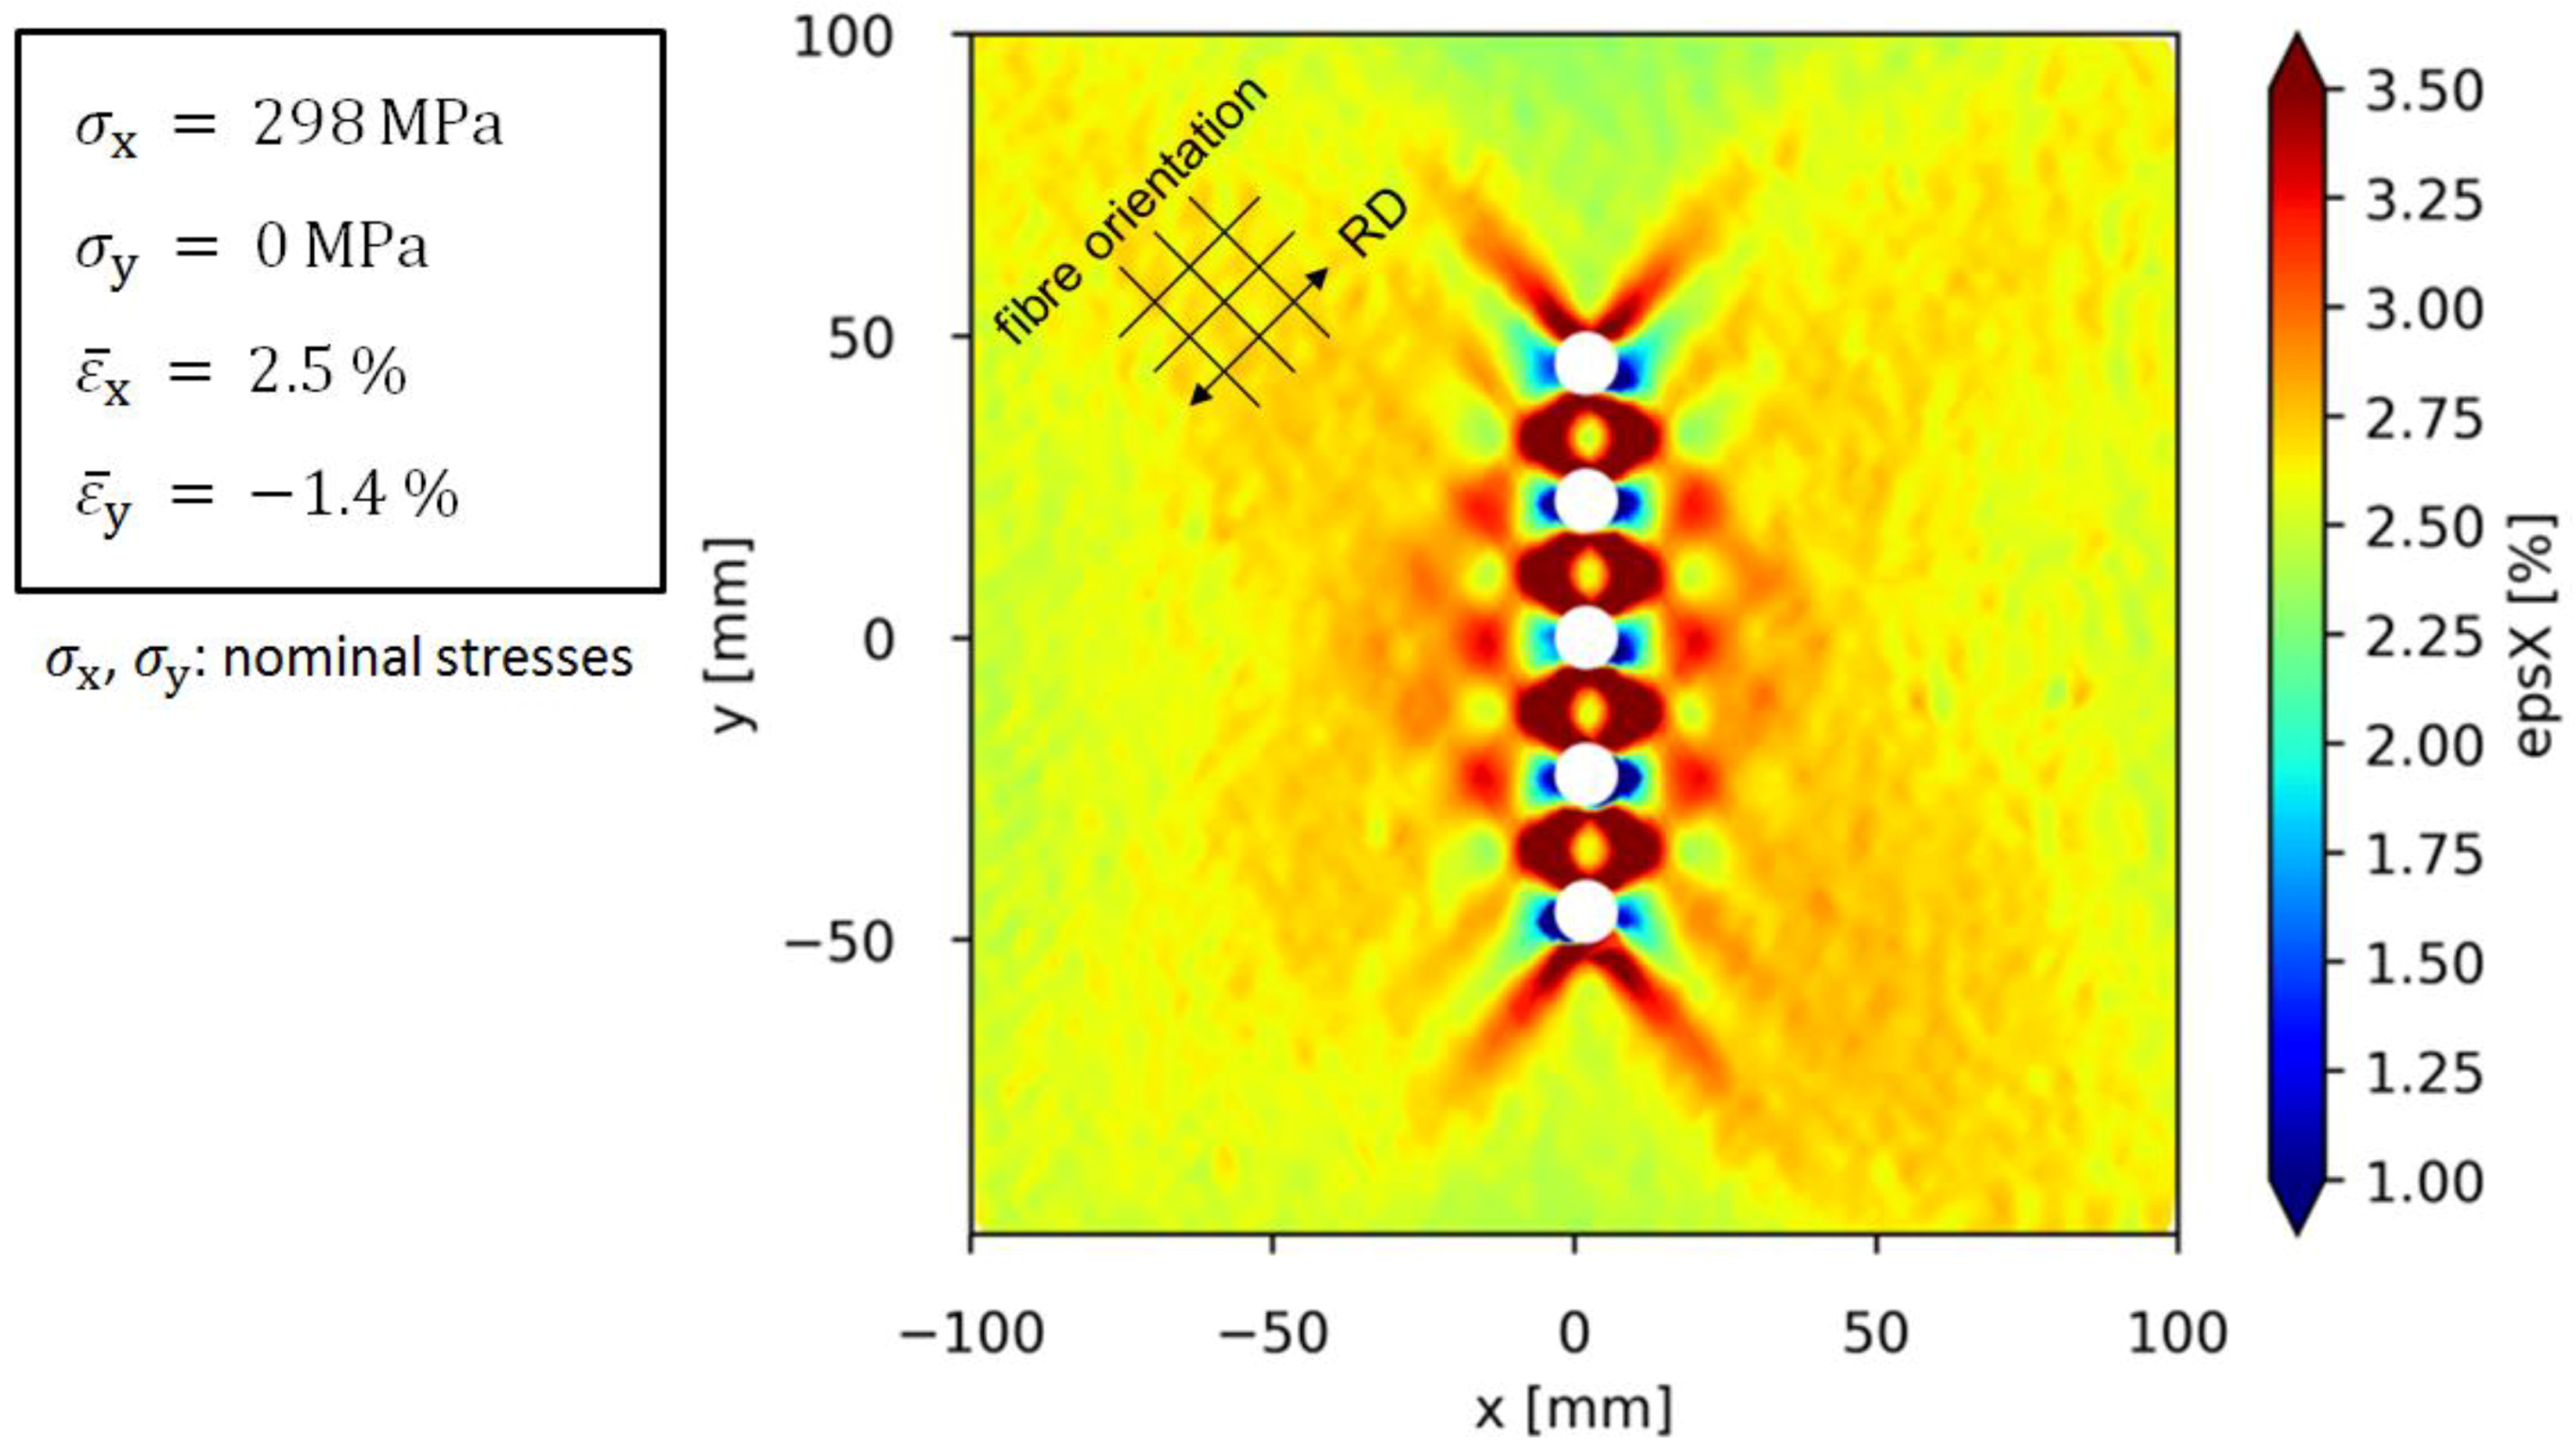
  • The holes are not loaded equally, as it can be seen in Figure 8b. Thus, the strain profile close to the BN pattern shows a distinct asymmetry.
The inhomogeneous deformation and strain field can be attributed to the tensile-shear coupling effect of composites loaded under off-axis angle and has been reported in other experimental studies [16,19].

4. Finite-Element-Simulation

A finite element (FE) model was set up for further analysis of the experimental results. This section provides the description of the model, details how the boundary conditions of each experiment were used for the simulations, and how the analysis of the blunt notch strength was characterized. As the experiments with α = 30° showed large strain inhomogeneity (see the previous section), and for α = 45° just one specimen failed in the blunt notch pattern, we focus on the experimental results for α = 0°.

4.1. Description of Model

The finite element model was built in ANSYS. Quadratic shell elements with midside nodes (SHELL281) were used to model the FML. In order to account for the different layers of the FML, sections were defined for the elements, with the thicknesses for each layer as shown in Figure 1. The prepreg layers were modelled unidirectionally with orthotropic linear material properties, while the Al alloy layers were modelled with isotropic material properties (see Table 3). Moreover, a multi-linear isotropic hardening material behaviour (von Mises yield criterion) with an ideal plastic stress-strain-relation (Table 4) was applied for the aluminium layers. All material properties are adopted from the study of Bosker [20], where finite element simulations were used to predict the blunt notch strength of different GLARE types under uniaxial loading.
The model consisted of about 11,000 layered shell elements with 33,500 nodes. Shell elements are used for thin structures, as each node has 6 degrees of freedom (3 translations and 3 rotations) for effective modelling of their three-dimensional behaviour. The mesh was refined in the vicinity of the holes. A study with different mesh sizes—especially at the hole where the highest strain gradients emerge—was carried out to guarantee convergence. In the convergence study, the mesh around the holes was refined stepwise. As a result, the element size here was chosen to be about 0.4 mm (40 elements around each hole) in order to ensure that the error in stresses remained below 3%.
The experimental displacement fields were utilized as inputs for the FE model to set the boundary conditions of the simulation according to the following procedure: The experimental displacements UX, UY, and UZ in the x, y, and z directions were mapped into the mesh of nodes of the FE model for an area with a 25 mm width around the blunt notch pattern. The procedure is illustrated in Figure 9. The mapping of the displacements as node constraints was conducted for 15–20 time-steps per experiment, resulting in 15–20 load-steps for the elastic-plastic simulations.

4.2. FE Simulation Results
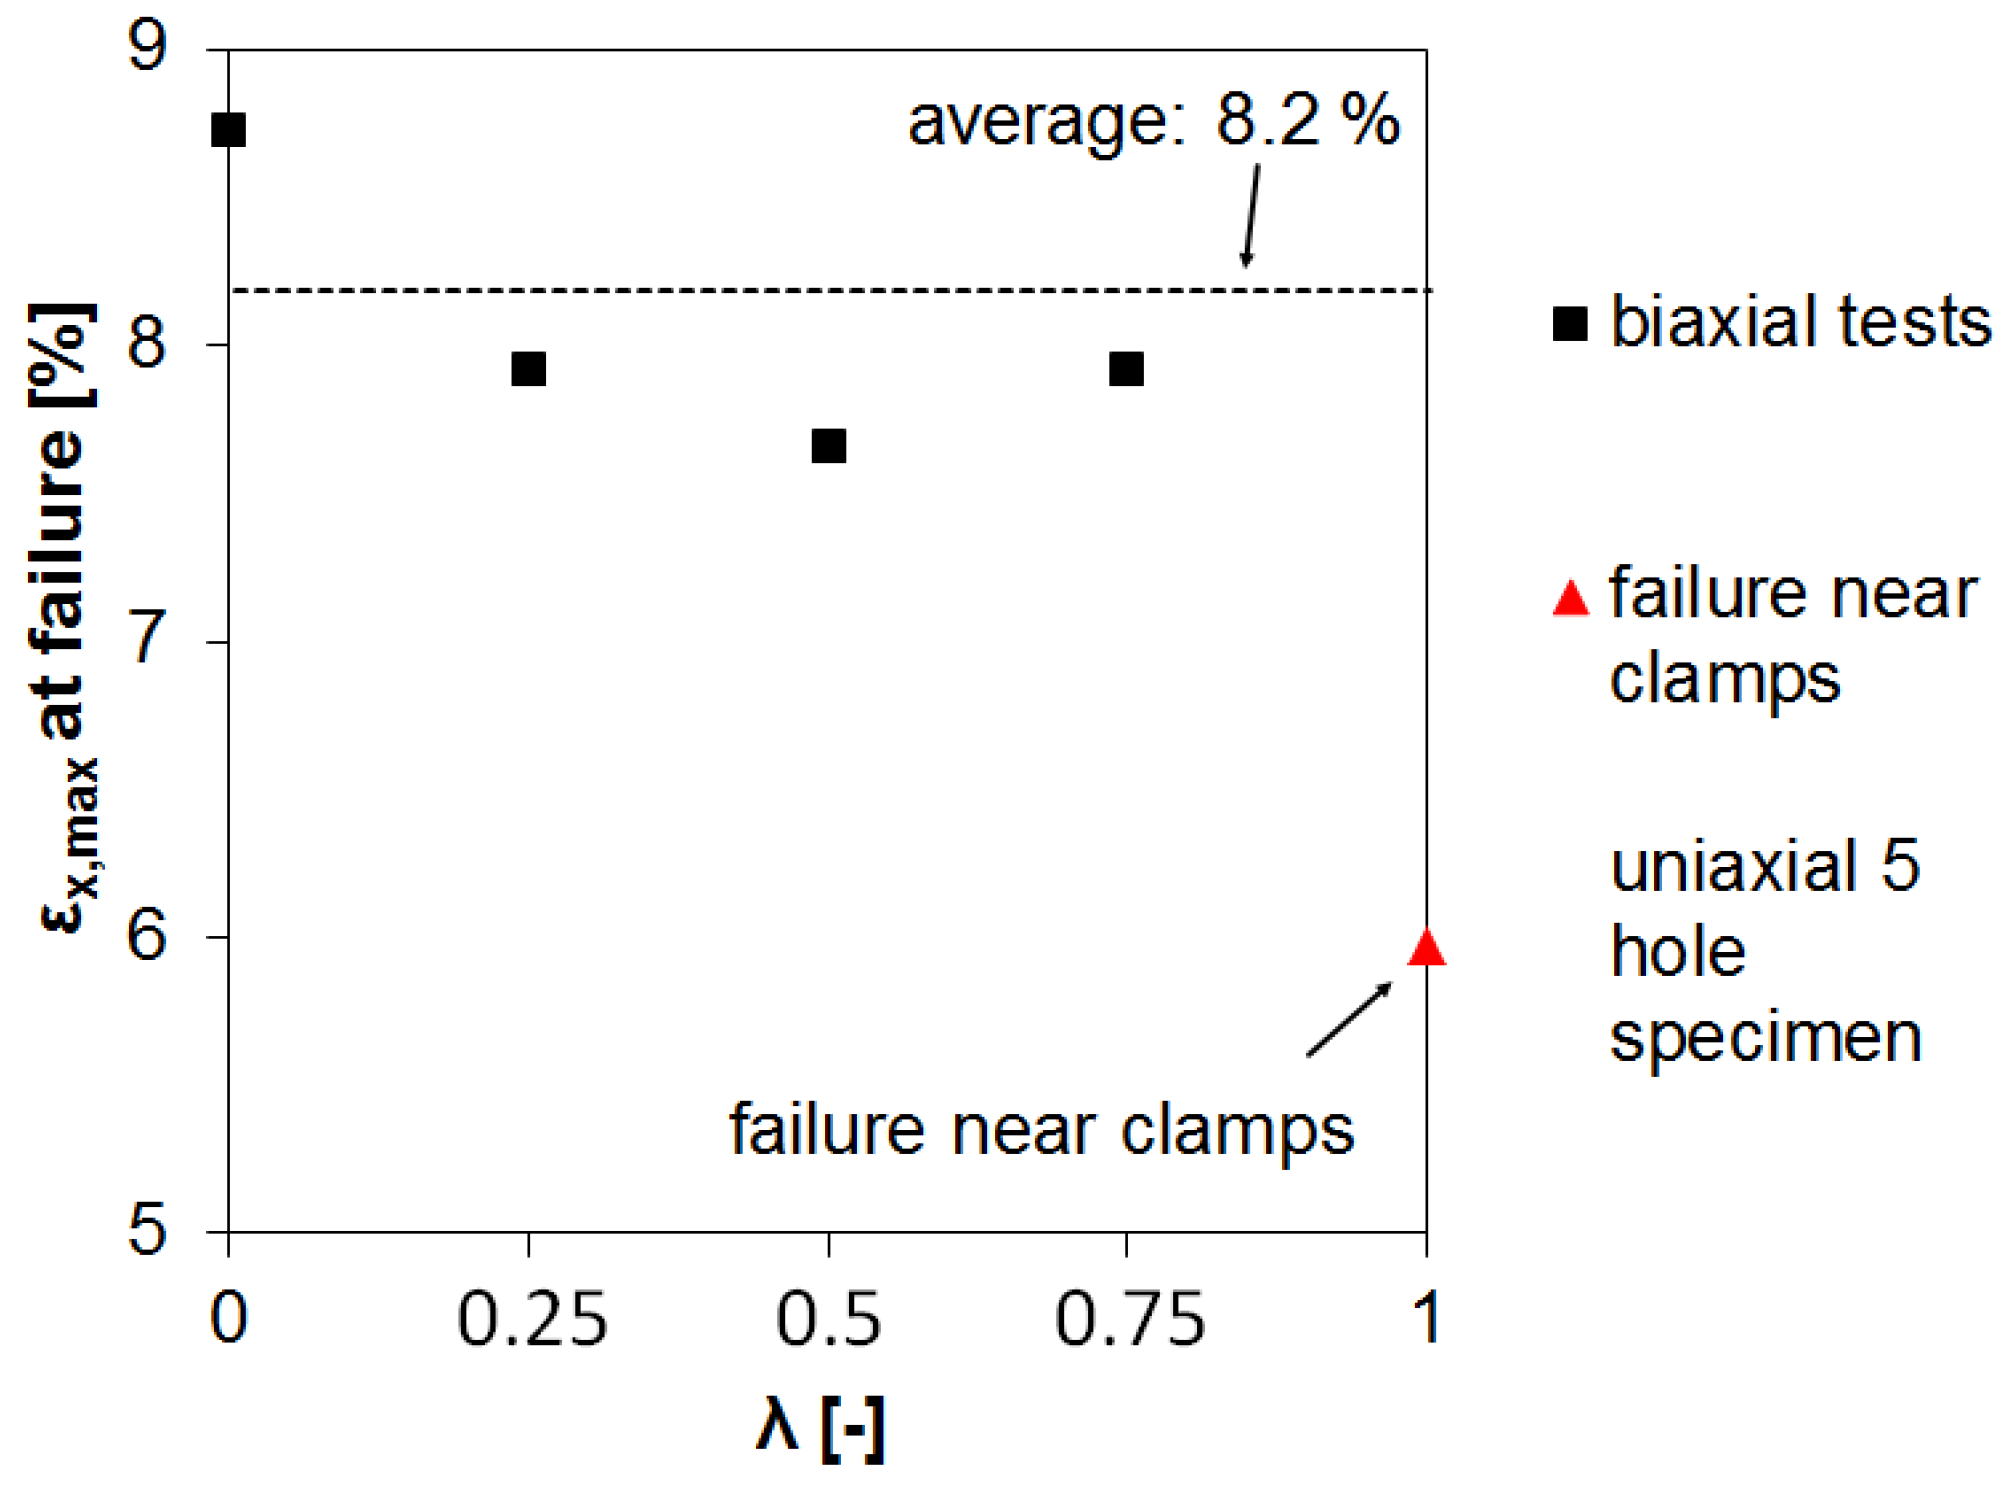
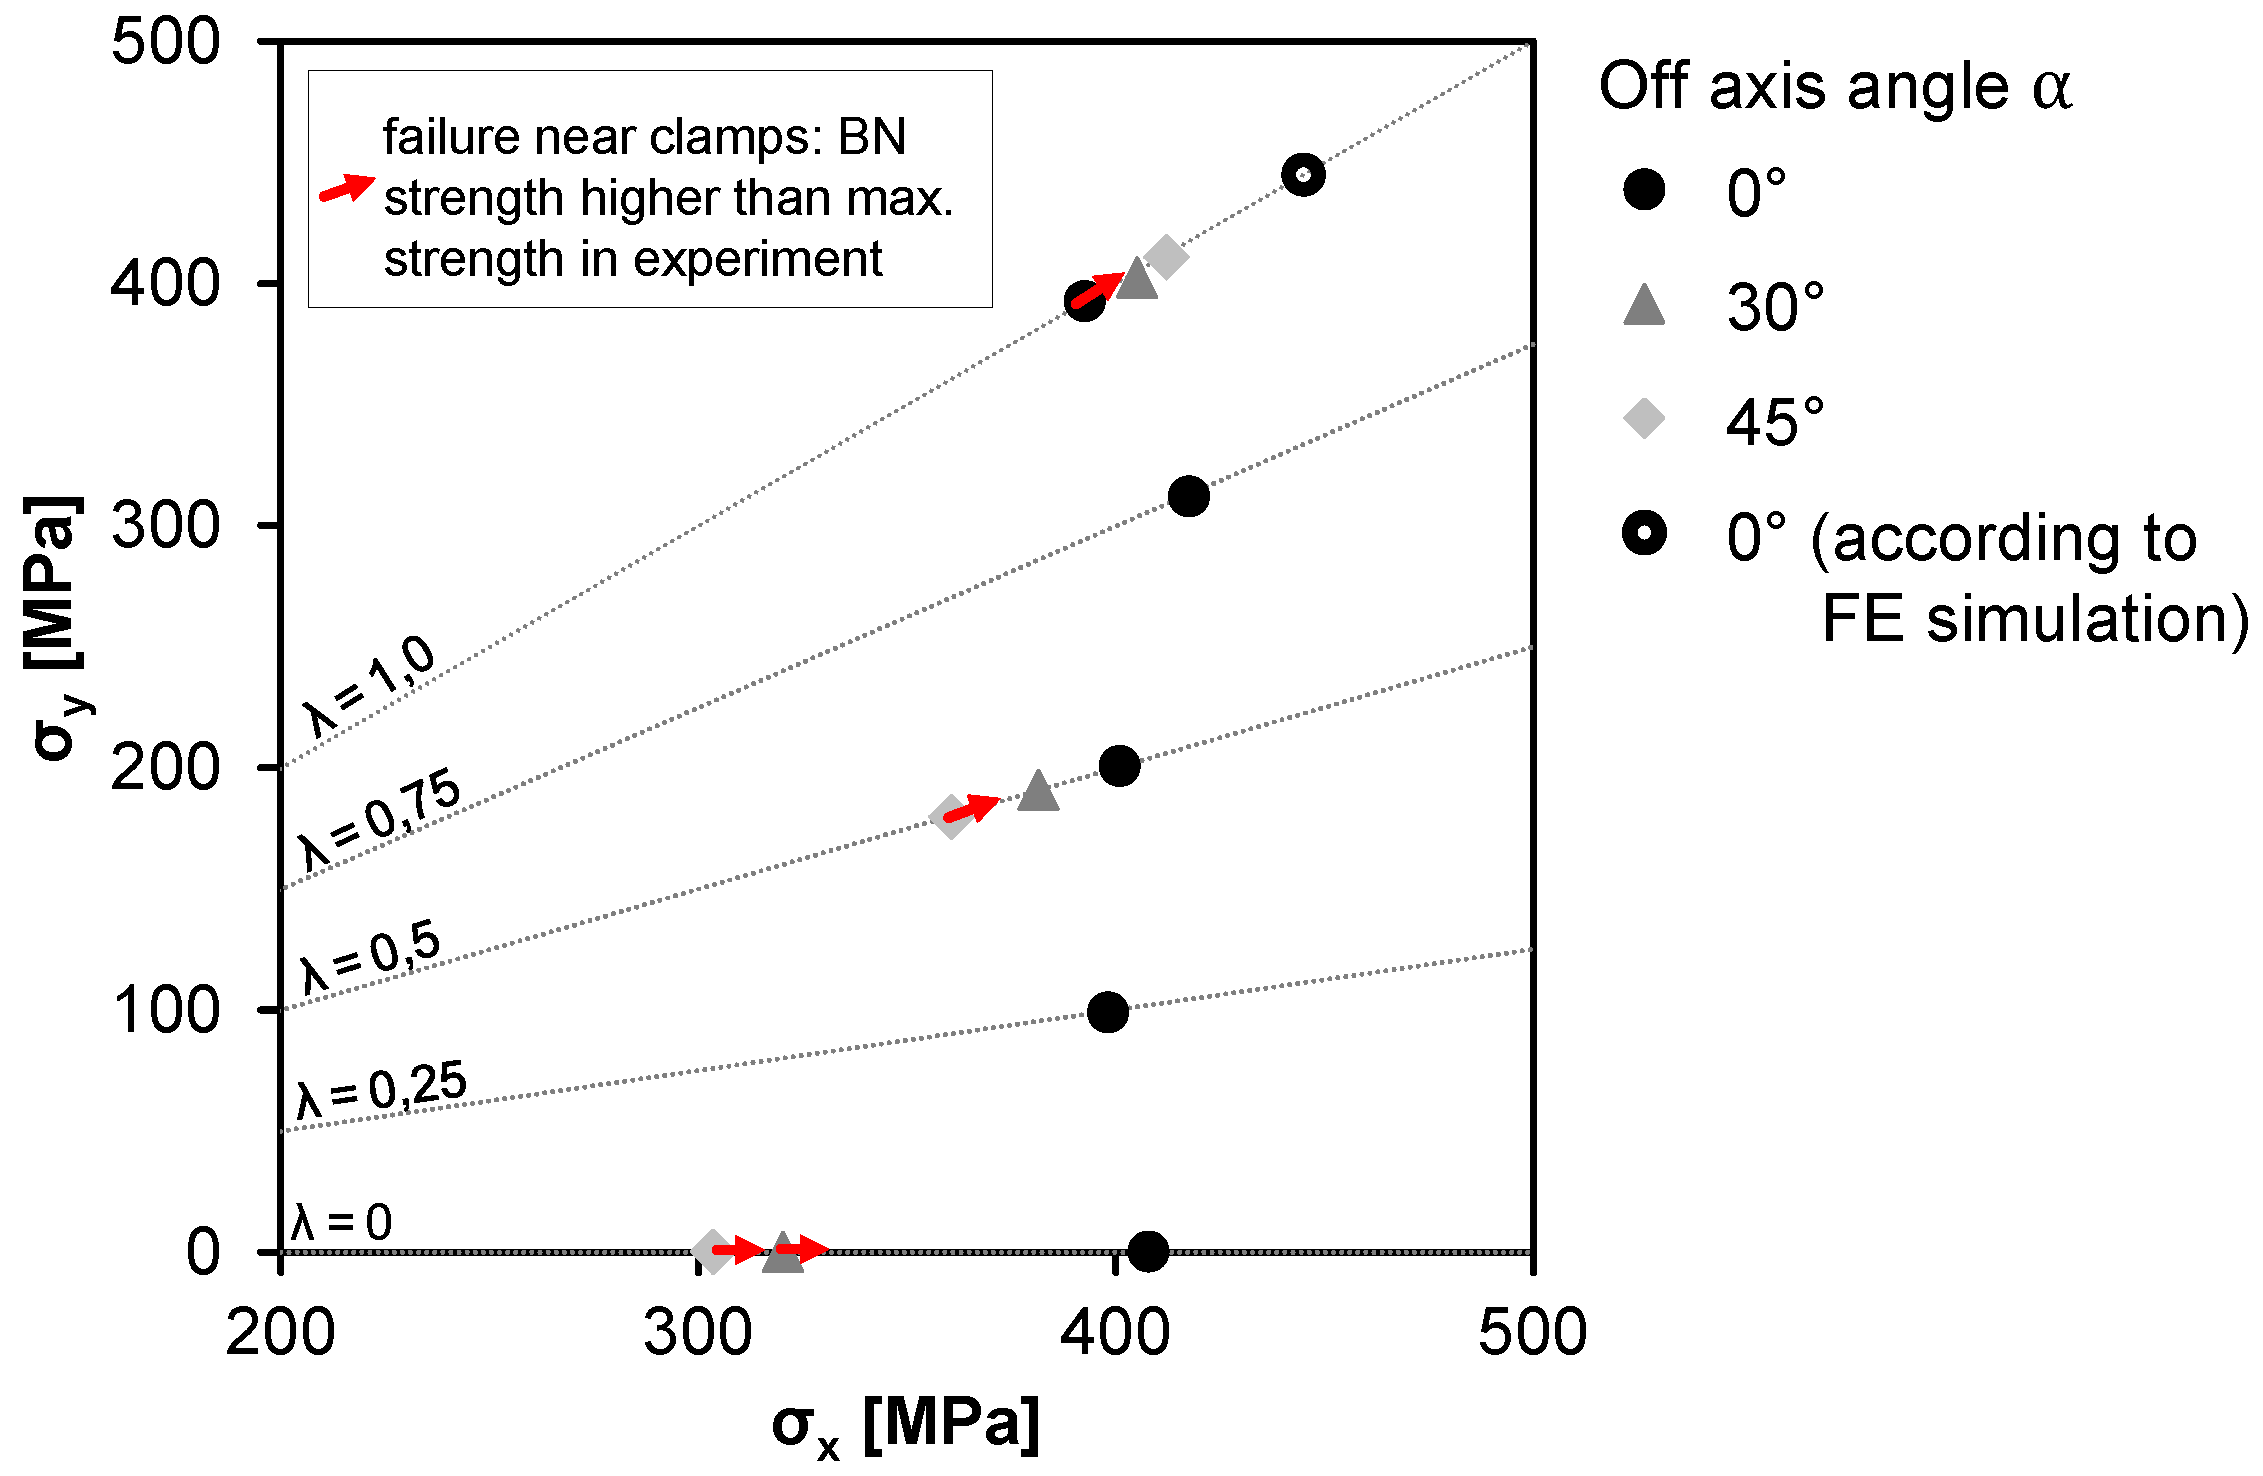
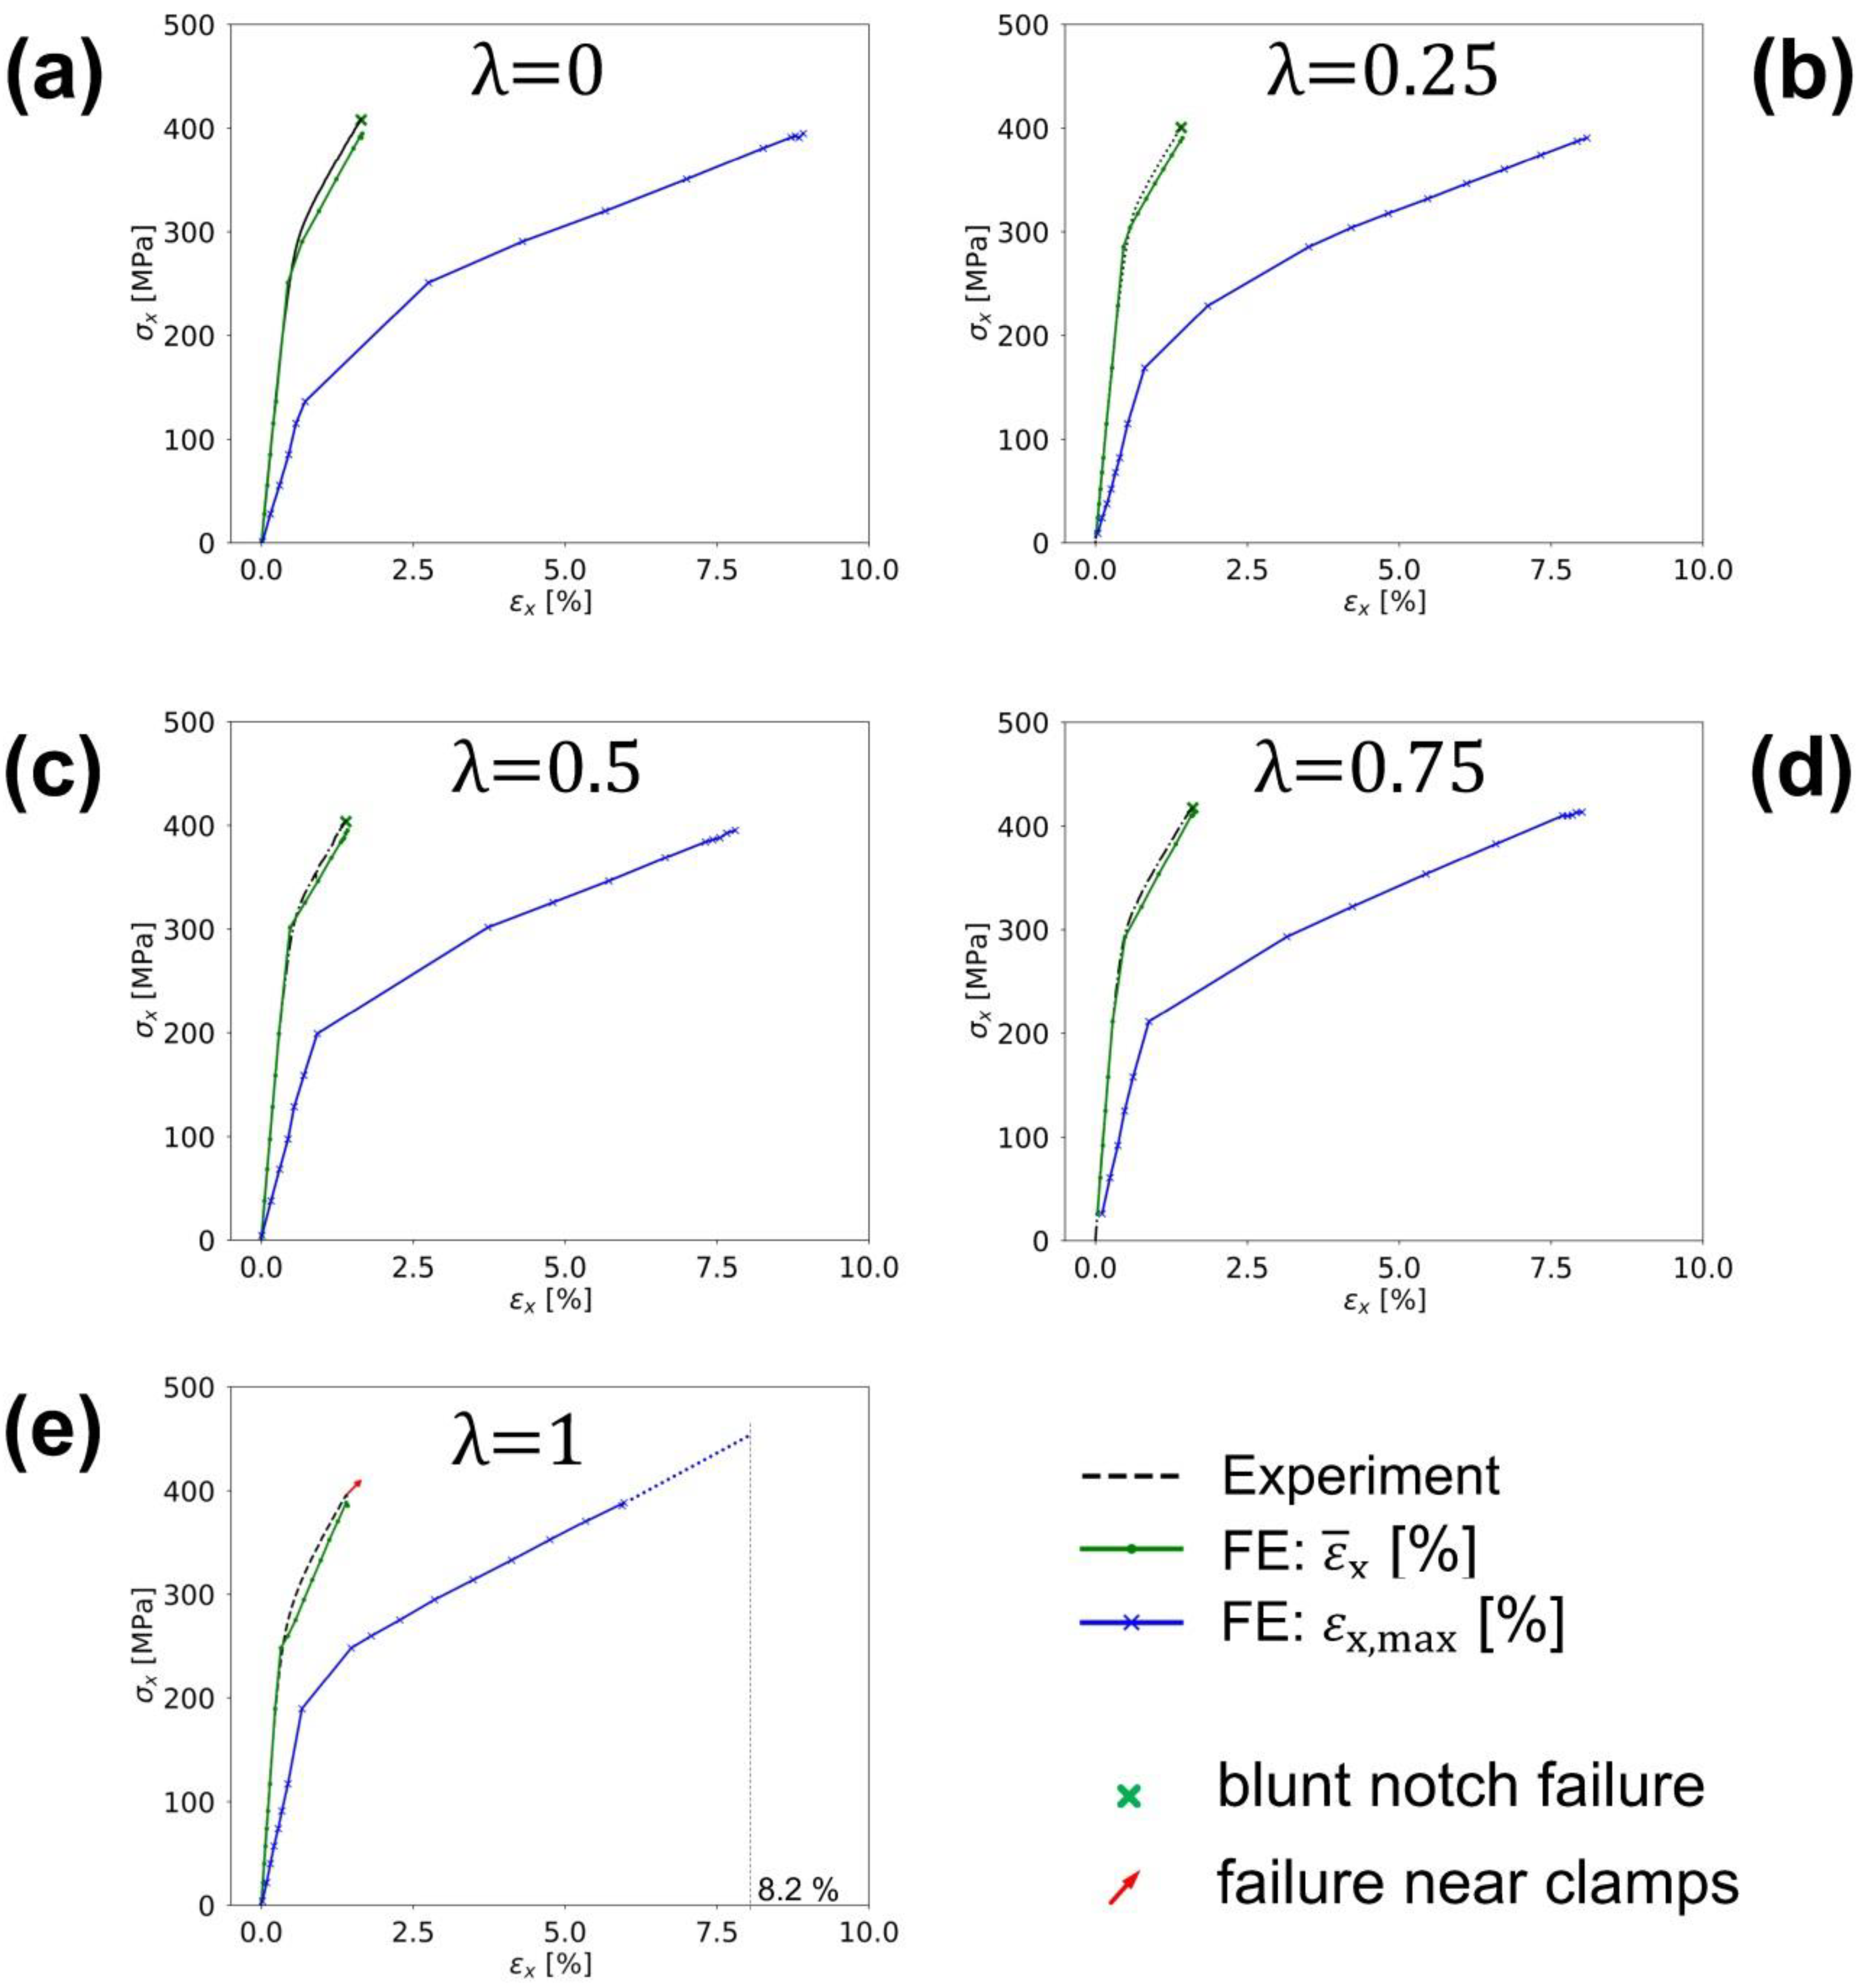
The determination of strains in the FE simulation was analogous in the FE code to the procedure described in Section 3.2 and illustrated in Figure 6: The averaged strains ϵ ¯ x , ϵ ¯ y are computed for an area of 300 × 300 mm2 without the nodal strains in the vicinity of the blunt notch pattern. The stress at each load-step is calculated with the resulting forces of the simulation in the main (x) and secondary (y) axes and related to the gross cross section of the modelled section. It is, therefore, a nominal stress and does not differentiate between the various stress levels in the layers of the FML.
The resulting stress-strain curves from the experiments and the FE simulations are shown in Figure 10 for the five biaxiality ratios tested at α = 0°. The stress-strain curves from the simulation (green lines) are in good agreement with the experimental results (black lines). In particular, the nominal stresses σx computed with the reaction forces from the simulations match those from the experiments for all biaxiality ratios. It can, therefore, be concluded that the FE model is able to describe the global material behaviour of the FML under various biaxial loads for an off-axis angle of 0°.
In addition to the averaged strains, Figure 10 shows the maximum strains εx,max obtained by the FE simulation at the edge of the blunt notches (blue lines). The maximum strains are considerably higher than the average strains as a result of the holes and the related stress concentrations. Accordingly, the transition from the linear to nonlinear regime takes place at lower nominal stress levels.
A maximum strain εx,max of about 8% is obtained just before failure for all studied conditions (Figure 11). Only the ultimate strain for λ = 1 reaches a lower εx,max of around 6%. Note, however, that this sample failed near the clamps and not at the blunt notches. An average maximum strain of 8.2 ± 0.4% can be extracted from the data shown in Figure 11 and was assumed to be the maximum strain in the simulations. Based on this assumption, the blunt notch failure of the unsuccessful experiment (α = 0°, λ = 1) can be predicted. As shown in Figure 10e (dashed blue line), the slope of the plastic region of εx,max can be extrapolated up to a maximum strain of 8.2%. Following this approach, a blunt notch failure of 445 MPa can be expected.
The maximum strain of 8.2%, computed with the FE analysis, exceeds the maximum strain of the glass fibres, which is approximately 4.5% [1,5]. De Vries [5] studied the blunt notch failure mechanisms for GLARE 3-3/2-0.4 mm and showed that a maximum strain criterion of 4.5% is too conservative when applying an ultimate strain criterion in FE analysis. In fact, in blunt notch experiments, the local strains at the root of the holes exceeded 4.5% strain and no indication of fibre breakage prior to failure was found. Instead, fibre splitting within the matrix was observed at about 75% of the failure load. Furthermore, delamination at the interface between the resin and fibre rich layers was noticed shortly before failure [5]. Delamination delays fibre failure and thus enables failure strains in FMLs higher than the ultimate strain of the fibres [1].
The biaxial blunt notch strength obtained for all tested conditions are summarized in Figure 12. The following observations can be made for the different off-axis angles α:
  • α = 0°:
    The BN strength for λ = 1 was adjusted by means of the FE simulation, considering that the maximum strain at the holes prior to failure was about 8.2%. Biaxial loading can be marked as slightly beneficial for the BN strength, as there was an increase of strength from λ = 0.25 (σx,BN = 398 MPa) to λ = 1 (σx,BN = 445 MPa). The BN strength for λ = 0 reached about 408 MPa.
  • α = 30°:
    Two experiments with failure in the BN pattern could be conducted successfully. Again, the BN strength seems to increase with an increasing biaxiality ratio from λ = 0.5 (σx,BN = 382 MPa) to λ = 1 (σx,BN = 405 MPa). As described in Section 3.2, the specimens, and hence the BN pattern, underwent severe strain asymmetry during testing.
  • α = 45°:
    Only one experiment (for λ = 1, σx,BN = 412 MPa) could be tested with the failure of the BN pattern. This BN strength is only 7% lower than the corresponding estimated value for α = 0°.

5. Summary and Conclusions

Biaxial tensile tests were carried out on FML-AA2024-3-3/2-0.4 with a blunt notch pattern of five filled holes with a diameter of 4.8 mm and a spacing of 22.7 mm. Biaxial tensile tests with a failure at the blunt notch patterns were attained for the first time under different biaxiality ratios λ between 0 to 1 and off-axis angles α = 0°/30°/45°. The following conclusions can be drawn from the results obtained in this work:
  • The blunt notch strength is not significantly affected by multiaxial stresses. In the conducted biaxial experiments, the specimens failed at nominal stresses σx of about 400 MPa independent of the biaxiality ratios λ.
  • Digital image correlation is able to capture the strain field in the gauge area and locally in the vicinity of the blunt notches to compute the average strain and to observe local effects caused by damage in the laminate.
  • Asymmetric off-axis angles of 30° relative to the loading direction also cause asymmetric strain fields. Consequently, stress concentrations occur in the corners of the gauge area, and some experiments failed early.
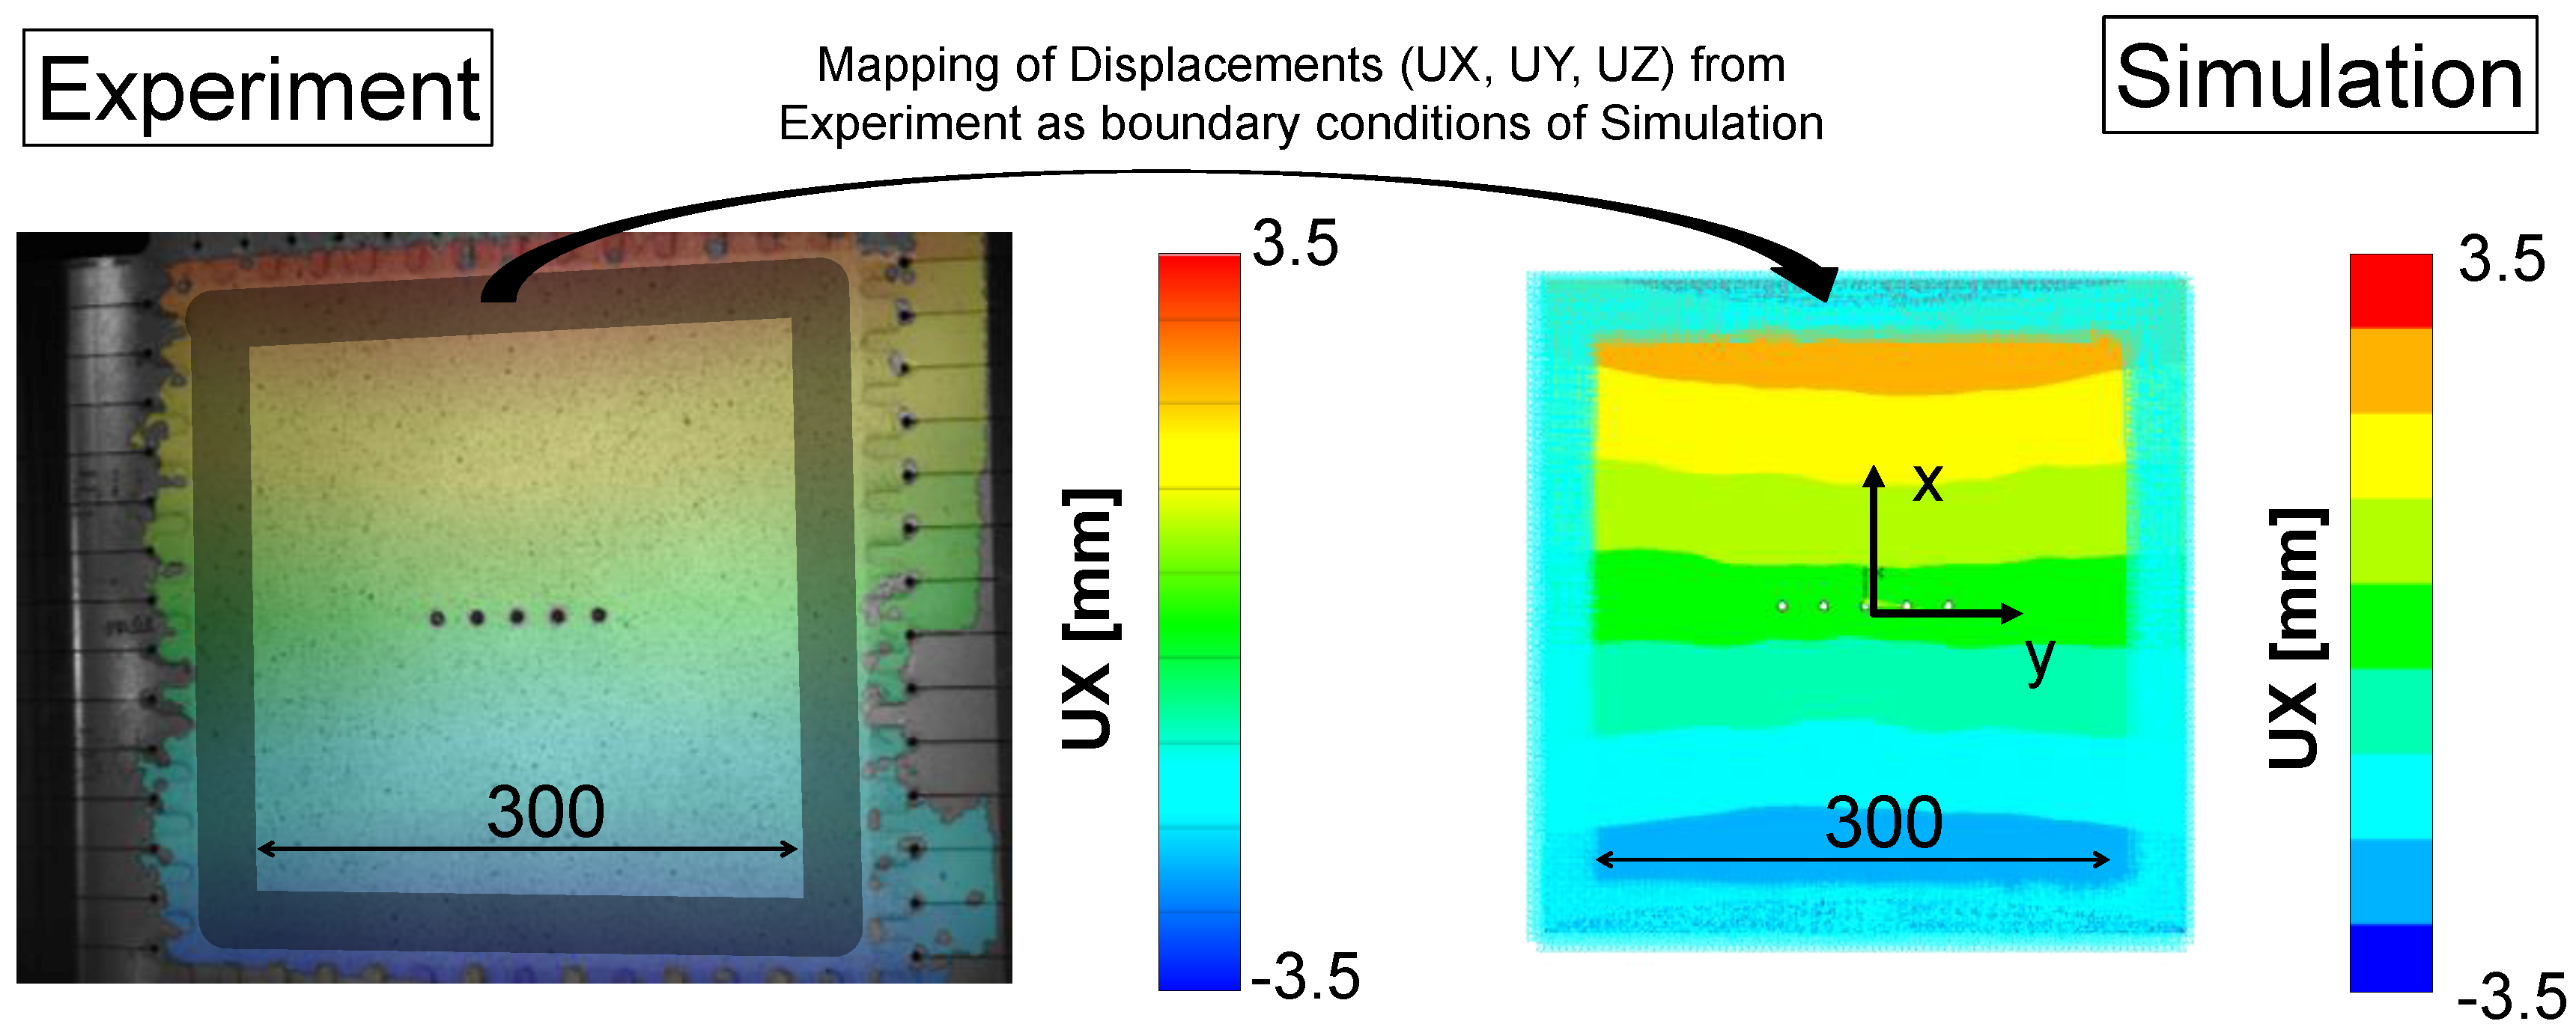
  • An FE model for α = 0° with orthotropic linear-elastic material properties for the unidirectional prepreg layers and ideal plastic isotropic hardening for the Al alloy layers was utilized. Mapping of displacements, as measured with the DIC system during the experiments, served as boundary conditions for the simulation. Good agreement of the experimental and simulated stress-strain-curves indicates the general applicability of the used FE model.
  • With the help of the FE model, maximum strains at the holes prior to failure were determined to be in the order of 8.2% (averaged) for the experiments with α = 0°. Based on this finding, the BN strength of the experiment with λ = 0 that failed outside the blunt notch pattern could be estimated.
A modification of the specimen design might be helpful to avoid early failure in the loading arms. Therefore, an additional frame could be glued around the gauge area to reduce stress concentrations there.

Author Contributions

J.S. designed and performed the experiments, analysed the data and wrote the paper. E.B. provided methodologies for data extraction and simulation. E.B., T.B. and G.R. contributed to the interpretation and discussion of the data and the writing of the paper.

Funding

This work has been supported by the German Federal Ministry for Economic Affairs and Energy (BMWi) through the project Profi-Rumpf, embedded in the German aeronautic research fund, LuFo 2016-2020 (code 20W1517C).

Acknowledgments

The authors would like to thank C. Sick for preparation of the specimens and for support during the biaxial test experiments.

Conflicts of Interest

The authors declare no conflict of interest.

References

  1. Alderliesten, R.C. Fatigue and Fracture of Fibre Metal Laminates; Springer International Publishing: Delft, The Netherlands, 2017. [Google Scholar]
  2. Wu, G.; Yang, J.M. The mechanical behavior of GLARE laminates for aircraft structures. JOM 2005, 57, 72–79. [Google Scholar] [CrossRef]
  3. Sinmazcelik, T.; Avcu, E.; Bora, M.Ö.; Çoban, O. A review: Fibre metal laminates, background, bonding types and applied test methods. Mater. Des. 2011, 32, 3671–3685. [Google Scholar] [CrossRef]
  4. Ritchie, R.O.; Yu, W.; Bucci, R.J. Fatigue crack propagation in ARALL® LAMINATES: Measurement of the effect of crack-tip shielding from crack bridging. Eng. Fract. Mech. 1989, 32, 361–377. [Google Scholar] [CrossRef]
  5. Vries, D.; Johan, T. Blunt and Sharp Notch Behaviour of Glare Laminates. Ph.D. Thesis, Delft University of Technology, Delft, The Netherlands, 2001. [Google Scholar]
  6. Vermeeren, C.A.J.R. An Historic Overview of the Development of Fibre Metal Laminates. Appl. Compos. Mater. 2003, 10, 189–205. [Google Scholar] [CrossRef]
  7. Vermeeren, C.A.J.R. The Blunt Notch Behaviour of Metal Laminates: ARALL and GLARE; Delft University of Technology: Delft, The Netherlands, 1990. [Google Scholar]
  8. Mönch, E.; Galster, D. A method for producing a defined uniform biaxial tensile stress field. Br. J. Appl. Phys. 1963, 14, 810–812. [Google Scholar] [CrossRef]
  9. Demmerle, S.; Boehler, J.P. Optimal design of biaxial tensile cruciform specimens. J. Mech. Phys. Solids 1993, 41, 143–181. [Google Scholar] [CrossRef]
  10. Dalle Donne, C.; Trautmann, K.H.; Amstutz, H. Cruciform specimens for in-plane biaxial fracture, deformation, and fatigue testing. In Multiaxial Fatigue and Deformation: Testing and Prediction; ASTM STP: West Conshohocken, PA, USA, 2000; Volume 1387, pp. 405–422. [Google Scholar]
  11. Breitbarth, E.; Besel, M.; Reh, S. Biaxial testing of cruciform specimens representing characteristics of a metallic airplane fuselage section. Int. J. Fatigue 2018, 108, 116–126. [Google Scholar] [CrossRef]
  12. Breitbarth, E.; Besel, M. Fatigue crack deflection in cruciform specimens subjected to biaxial loading conditions. Int. J. Fatigue 2018, 113, 345–350. [Google Scholar] [CrossRef]
  13. Pilkey, W.D.; Pilkey, D.F. Petersonś Stress Concentration Factors; John Wiley & Sons: Hoboken, NJ, USA, 2008. [Google Scholar]
  14. Kawai, M.; Arai, Y. Off-axis notched strength of fiber–metal laminates and a formula for predicting anisotropic size effect. Compos. Part A: Appl. Sci. Manuf. 2009, 40, 1900–1910. [Google Scholar] [CrossRef]
  15. Beumler, T. Flying GLARE-A Contribution to Aircraft Certification Issues on Strength Properties in Non-Damaged and Fatiguedamaged GLARE Structures; TU Delft: Delft, The Netherlands, 2004. [Google Scholar]
  16. Kawai, M.; Morishita, M.; Tomura, S.; Takumida, K. Inelastic Behavior and Strength of Fiber-Metal Hybrid Composite: GLARE. Int. J. Mech. Sci. 1998, 40, 183–198. [Google Scholar] [CrossRef]
  17. Soltani, P.; Keikhosravy, M.; Oskouei, R.H.; Soutis, C. Studying the Tensile Behaviour of GLARE Laminates: A Finite Element Modelling Approach. Appl. Compos. Mater. 2011, 18, 271–282. [Google Scholar] [CrossRef]
  18. Yeh, P.-C.; Chang, P.Y.; Yang, J.M.; Wu, P.H.; Liu, M.C. Blunt notch strength of hybrid boron/glass/aluminum fiber metal laminates. Mater. Sci. Eng. A 2011, 528, 2164–2173. [Google Scholar] [CrossRef]
  19. Pagano, N.; Halpin, J. Influence of end constraint in the testing of anisotropic bodies. J. Compos. Mater. 1968, 2, 18–31. [Google Scholar] [CrossRef]
  20. Bosker, O.J. Finite Element Calculations to Predict the Uni-Axial on-Axis and off-Axis Blunt Notch Strength of Glare and Comparison with Test Results; Report; TU Delft: Delft, The Netherlands, 1999. [Google Scholar]
Figure 1. Layup of aluminium alloy 2024-fibre metal laminate (AA2024-FML) 3-3/2-0.4 mm.
Metals 09 00413 g001
Figure 2. Biaxial specimen design and pattern of blunt notches. (a) Biaxial specimen design, (b) loading arms and testing area, (c) pattern of blunt notch holes.
Metals 09 00413 g002
Figure 3. Off-axis angle for the biaxial test specimens with respect to the rolling direction of the aluminium alloy sheets and the fibre directions.
Metals 09 00413 g003
Figure 4. Biaxial testing machine. The insert in the lower left corner shows a cruciform specimen mounted for testing.
Metals 09 00413 g004
Figure 5. (a) Failure at blunt notch pattern, (b) crack near loading arms (red arrow), no failure of blunt notches.
Metals 09 00413 g005
Figure 6. (a) Stress-strain curve for λ = 0.5, and (b) area considered for determination of stress and strains.
Metals 09 00413 g006
Figure 7. Strain field near blunt notch pattern obtained by DIC for off-axis angle of 45° and λ = 0.
Metals 09 00413 g007
Figure 8. (a) Strain field for biaxial specimen with off-axis angle of α = 30° tested with a biaxiality ratio of λ = 0. (b) Strain profile for x = 25 mm through cut from (a) (dashed blue line).
Metals 09 00413 g008
Figure 9. Procedure to map the experimental displacements determined by DIC into the FE model to set the boundary conditions of the simulation.
Metals 09 00413 g009
Figure 10. Comparison of the stress-strain curves obtained from the experiments and the FE simulation.
Metals 09 00413 g010
Figure 11. Maximum strains at holes just before failure computed by the FE simulation for all specimens with α = 0°.
Metals 09 00413 g011
Figure 12. Maximum nominal stresses (BN strength) for all biaxial tensile tests of FML-2024-T3-3/2-0.4.
Metals 09 00413 g012
Table 1. Experimental setup; DIC, digital image correlation system.
Biaxial testing machine
  • Carl Schenck AG–Hydropuls Biax with Instron 8800 controller
  • Load capacity of main axis: 1000 kN
  • Load capacity of secondary axis: 630 kN
  • Displacement sensor and load cell for each of the 4 cylinders
  • Main axis in distance control (1 mm/min)
  • Secondary axis force controlled following the force signal of main axis to achieve constant biaxiality ratio λ
3D DIC system
  • GOM Aramis 12M (4096 × 3072 pixel2)
  • Lens: 50 mm
  • Slider distance: 478 mm (Distance between cameras)
  • Camera angle: 22°
  • Measuring distance: 1165 mm
  • Measuring area: 525 × 405 mm2
  • Depth of field: 405 mm
  • Facet size: 19 × 19 pixel2/2.4 × 2.4mm2
  • Facet distance: 15 pixel/1.9 mm
  • Camera’s aperture: 8
  • Exposure time: 20 ms
  • Pixels/mm: 7.8
Table 2. Maximum nominal loads and location of failure obtained for all tested specimens.
Off-Axis Angle αNo.Biaxiality Ratio λMax Nominal Stress
σx [MPa] σy [MPa]
Location of Failure
104080Blunt notch failure
20.2539890Blunt notch failure
30.5401201Blunt notch failure
40.75418312Blunt notch failure
51.0393393crack in loading arms
30°603130crack in loading arms followed by blunt notch failure
70.5382191Blunt notch failure
81.0291289Blunt notch failure
45°903040crack in loading arms
100.5361180crack in loading arms
111.0412411Blunt notch failure
Table 3. Material properties for the Al alloy layers and the unidirectional prepreg layers used in the FE simulations [20].
Elastic ConstantsAluminium Layer 2024-T3Unidirectional (UD) Prepreg
Ex72,400 MPa54,000 MPa
Ey1 MPa
Ez1 MPa
νxy0.330.33
νyz0.0575
νxz0.33
Gxycalculated automatically by FE software5,55 MPa
Gyz0.47 MPa
Gxz5548 MPa
Table 4. Stress-strain data for AA2024-T3 layer used in the elastic-plastic FE simulations [20].
Strain [%]Stress [MPa]
0.00.0
0.465330
2.85400
16.5400

