Article

Physical Modelling of Splashing Triggered by the Gas Jet of an Oxygen Lance in a Converter

1
Key Laboratory for Ecological Metallurgy of Multimetallic Ores (Ministry of Education), Northeastern University, Shenyang 110819, China
2
School of Metallurgy, Northeastern University, Shenyang 110819, China
*
Authors to whom correspondence should be addressed.
Metals 2019, 9(4), 409; https://doi.org/10.3390/met9040409
Submission received: 15 March 2019 / Revised: 1 April 2019 / Accepted: 1 April 2019 / Published: 3 April 2019
(This article belongs to the Special Issue Advanced Simulation Technologies of Metallurgical Processing)

Abstract

:
To characterize the splashing behavior under the impact of the top-blown gas jet in converter, in this paper a physical model is developed with the prototype of a 200 t converter in China. We captured the impact cavity morphology triggered by the top-blown gas jet of the oxygen lance, and found that the impact cavity shape gradually changed following the sequence of “disc” → “bowl” → “cone” with the increase in the gas flow, leading to the variation of the splashing modes. Moreover, the splashing inside and outside the converter was characterized quantitatively under the different top-blown gas jet conditions. The results showed that the splashing on the furnace inner wall concentrated at the region adjacent to the molten bath surface, implying severe flushing of the furnace lining of this region. The critical gas flow of splashing outside the converter is 32.3 Nm3·h−1, corresponding to a gas flow of 39,000 Nm3·h−1 in the prototype. In addition, the foaming slag can suppress the splashing during the smelting process. The statistics of the splashing flux provide a reference for maintaining the safety of the workers and the converter equipment.

1. Introduction

During the steelmaking process in the converter, the splashing of the slag and liquid metal is a common phenomenon caused by the impingement of the top-blown gas jet on the molten bath and the escape of CO gas produced by the violent carbon-oxygen reaction. Splashing results in the loss of the metal and slag. According to the statistics [1], the metal loss caused by the splashing is about 2.8%. The slag loss reduces the capability for dephosphorization and desulfurization. Splashing can also lead to heat loss. For example, the physical heat carried out by splashing can reach 938.7 kJ per 100 kg metal, accounting for 0.7% of the total heat expenditure [2]. The splashed slag and metal may stick on the furnace mouth, gas flue, oxygen lance, and slag channel, causing difficulties in slag transportation and continuous production [3,4,5]. Moreover, a large amount of smoke generated by splashing is harmful to the furnace lining and the production environment. More importantly, the splashing slag and metal at high temperatures can cause great harm to the furnace operators. Scalding caused by splashing accounted for more than 80% of all scalding accidents [6]. In short, splashing in the converter is explosive, dangerous, and difficult to control.
A lot of investigations on the forming reason, influencing factor, and controlling measure of splashing have been carried out. Sabah et al. [7] found that the splashing was induced by the splashing sheets and droplets torn off from the impact cavity edge through physical modelling for a 6 t BOS converter. Flinn et al. [8], Meidani et al. [9], and McGee et al. [10] established the prediction model of the impact cavity depth, respectively, and analyzed the effects of oxygen flow, oxygen lance height, operating pressure, and number and angle of the nozzles. Molloy [11] found three kinds of splashing modes including the “dimpling” mode, the “splashing” mode and the “penetrating” mode under different oxygen flows and oxygen lance heights, and the splashing intensity corresponding to these three modes is increased in turn. Further, the “blowing number” (NB), a dimensionless parameter, was proposed to explore quantitatively the generation rate of droplets under this three splashing modes [7,12,13]. The above investigations showed that the impact of the top-blown gas jet on the molten bath is the key reason for splashing formation. However, due to the complexity of material movement and hyperthermal chemical reactions in the converter, the formation mechanism and the control method of splashing are still not clear. Thus, it is urgent to characterize the splashing behavior under the impact of the top-blown gas jet in a converter.
In this investigation, a physical model of a converter was developed to simulate and characterize the splashing behavior, and the splashing distribution was investigated under different top-blown gas jet conditions.

2. Experimental Section
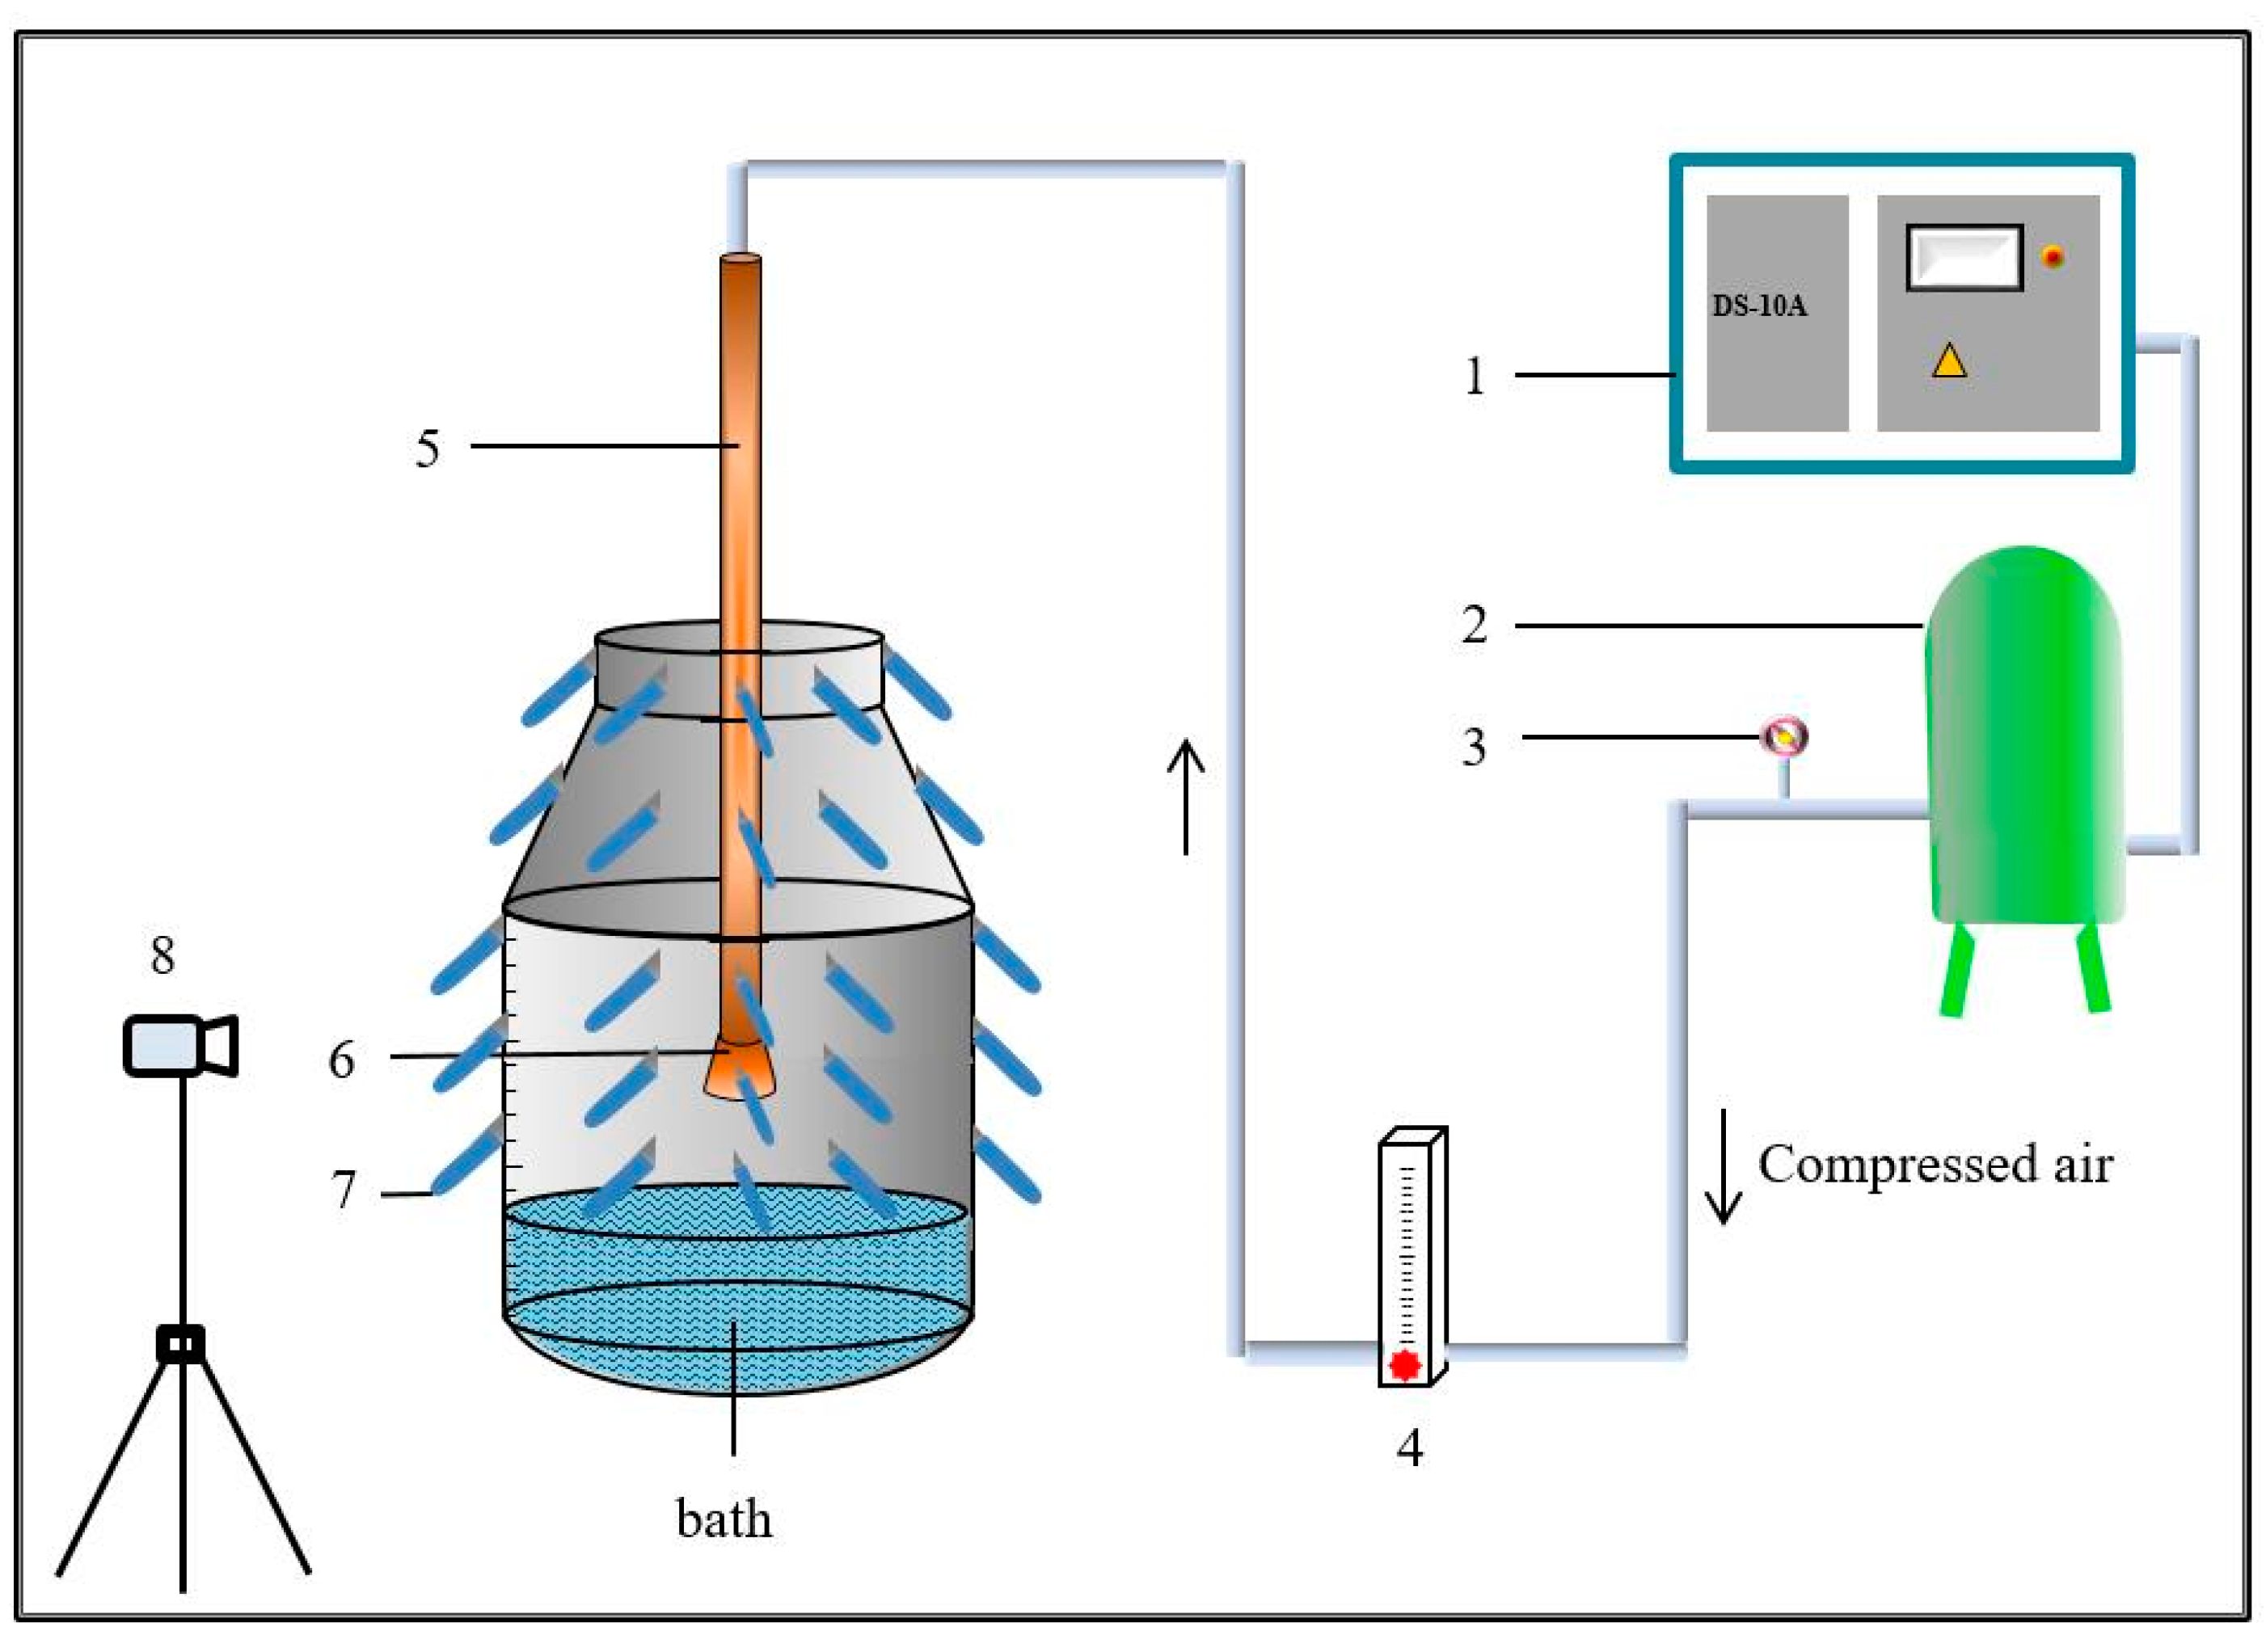
2.1. Physical Model

The geometric similarity and dynamic similarity were followed to model a converter. The compressed air, the water, and the heat transfer oil were used to simulate the oxygen, the molten steel, and the slag, respectively. The physical properties of the materials are listed in Table 1.
With the prototype of a 200 t converter in China, a physical model was designed to ensure geometric similarity of 1:12. Due to the highly turbulent state of the molten bath in the converter, the major factors governing splashing were not viscosity and surface tension of the liquid, but the inertial force of the top-blown gas jet. The Froude number criterion indicates the influence of gravity on the flow. However, for the flow behavior in the gas-liquid two-phase system in this model, it is necessary to add a correction item ρ g / ( ρ l ρ g ) to modify the Frude number. Therefore, the modified Froude number (Fr’) was chosen as the main similarity criteria [14].
F r m = F r p
where, subscripts m and p represent the model and the prototype, respectively.
u m 2 g L m × ρ m , g ρ m , l ρ m , g = u p 2 g L 2 × ρ p , g ρ p , l ρ p , g
where, u is the superficial gas velocity (m·s−1), L is the characteristic length (m), g is the acceleration due to gravity (m·s−2), and ρg and ρl are the density of gas and liquid (kg·m−3), respectively.
Q m = [ ( L m L p ) 5 2 ( ρ p , g ρ m , g ) 1 2 ( ρ m , l ρ m , g ρ p , l ρ p , g ) 1 2 ] Q p
where, Q is the gas flow (Nm3·h−1).
The corresponding parameters of the model and the prototype, calculated with the geometric similarity and the dynamic similarity, are shown in Table 2.
The experimental device is composed of the gas supply system, the sampling system, and the model of converter, as shown in Figure 1.

2.2. Experimental Method

Under different blowing parameters of the oxygen lance (oxygen lance height and gas flow), the instantaneous shapes of the cavities were captured by a Nikon D3400 digital camera (Nikon Corporation, Tokyo, Japan) during the splashing process.
In order to measure the distribution of splashing droplets on the inner wall of the converter, the tubes with the diameter of 20 mm were installed at different positions on the wall to collect the splashing droplets, at the heights of 192 mm, 288 mm, 384 mm, 480 mm, and 606 mm above the bath surface. The interval of the five sampling positions on the half circumference at the same height was 45°, and the angles between the sampling positions and the nearest oxygen lance nozzle were 0°, 9°, 18°, 27°, and 36°, respectively, as shown in Figure 2A. The amount of splashing droplets at intervals of 9° can be derived from the symmetry, as shown in Figure 2B.
The sponges covering the furnace mouth were used to absorb the droplets splashed outside the converter. As shown in Figure 3, in order to compare the amount of splashing droplets in different areas at the furnace mouth, the inner area of furnace mouth was divided into five ring areas, D1 (radius: 12.5 mm–25.0 mm), D2 (radius: 25.0 mm–50.0 mm), D3 (radius: 50.0 mm–75.0 mm), D4 (radius: 75.0 mm–100.0 mm), and D5 (radius: 100.0 mm–150.0 mm). Meanwhile, the outside area of furnace mouth was divided into six ring areas, D6 (radius: 160.0 mm–210.0 mm), D7 (radius: 210.0 mm–260.0 mm), D8 (radius: 260.0 mm–310.0 mm), D9 (radius: 310.0 mm–360.0 mm), D10 (radius: 360.0 mm–410.0 mm), and D11 (radius: 410.0 mm–460.0 mm). In order to measure the amount of splashing droplets at different heights above the furnace mouth, the water-absorbing sponge was located at the heights of 50.0 mm, 100.0 mm, 150.0 mm, 200.0 mm, 250.0 mm, 300.0 mm, 350.0 mm, 400.0 mm, and 450.0 mm above the furnace mouth. The mass of dispersed droplets during the experiment time (≤180 s) was no more than 800 g, implying that the change of the bath height was no more 4.0 mm and the ratio change of the bath diameter to its height could be negligible.

3. Results and Discussion

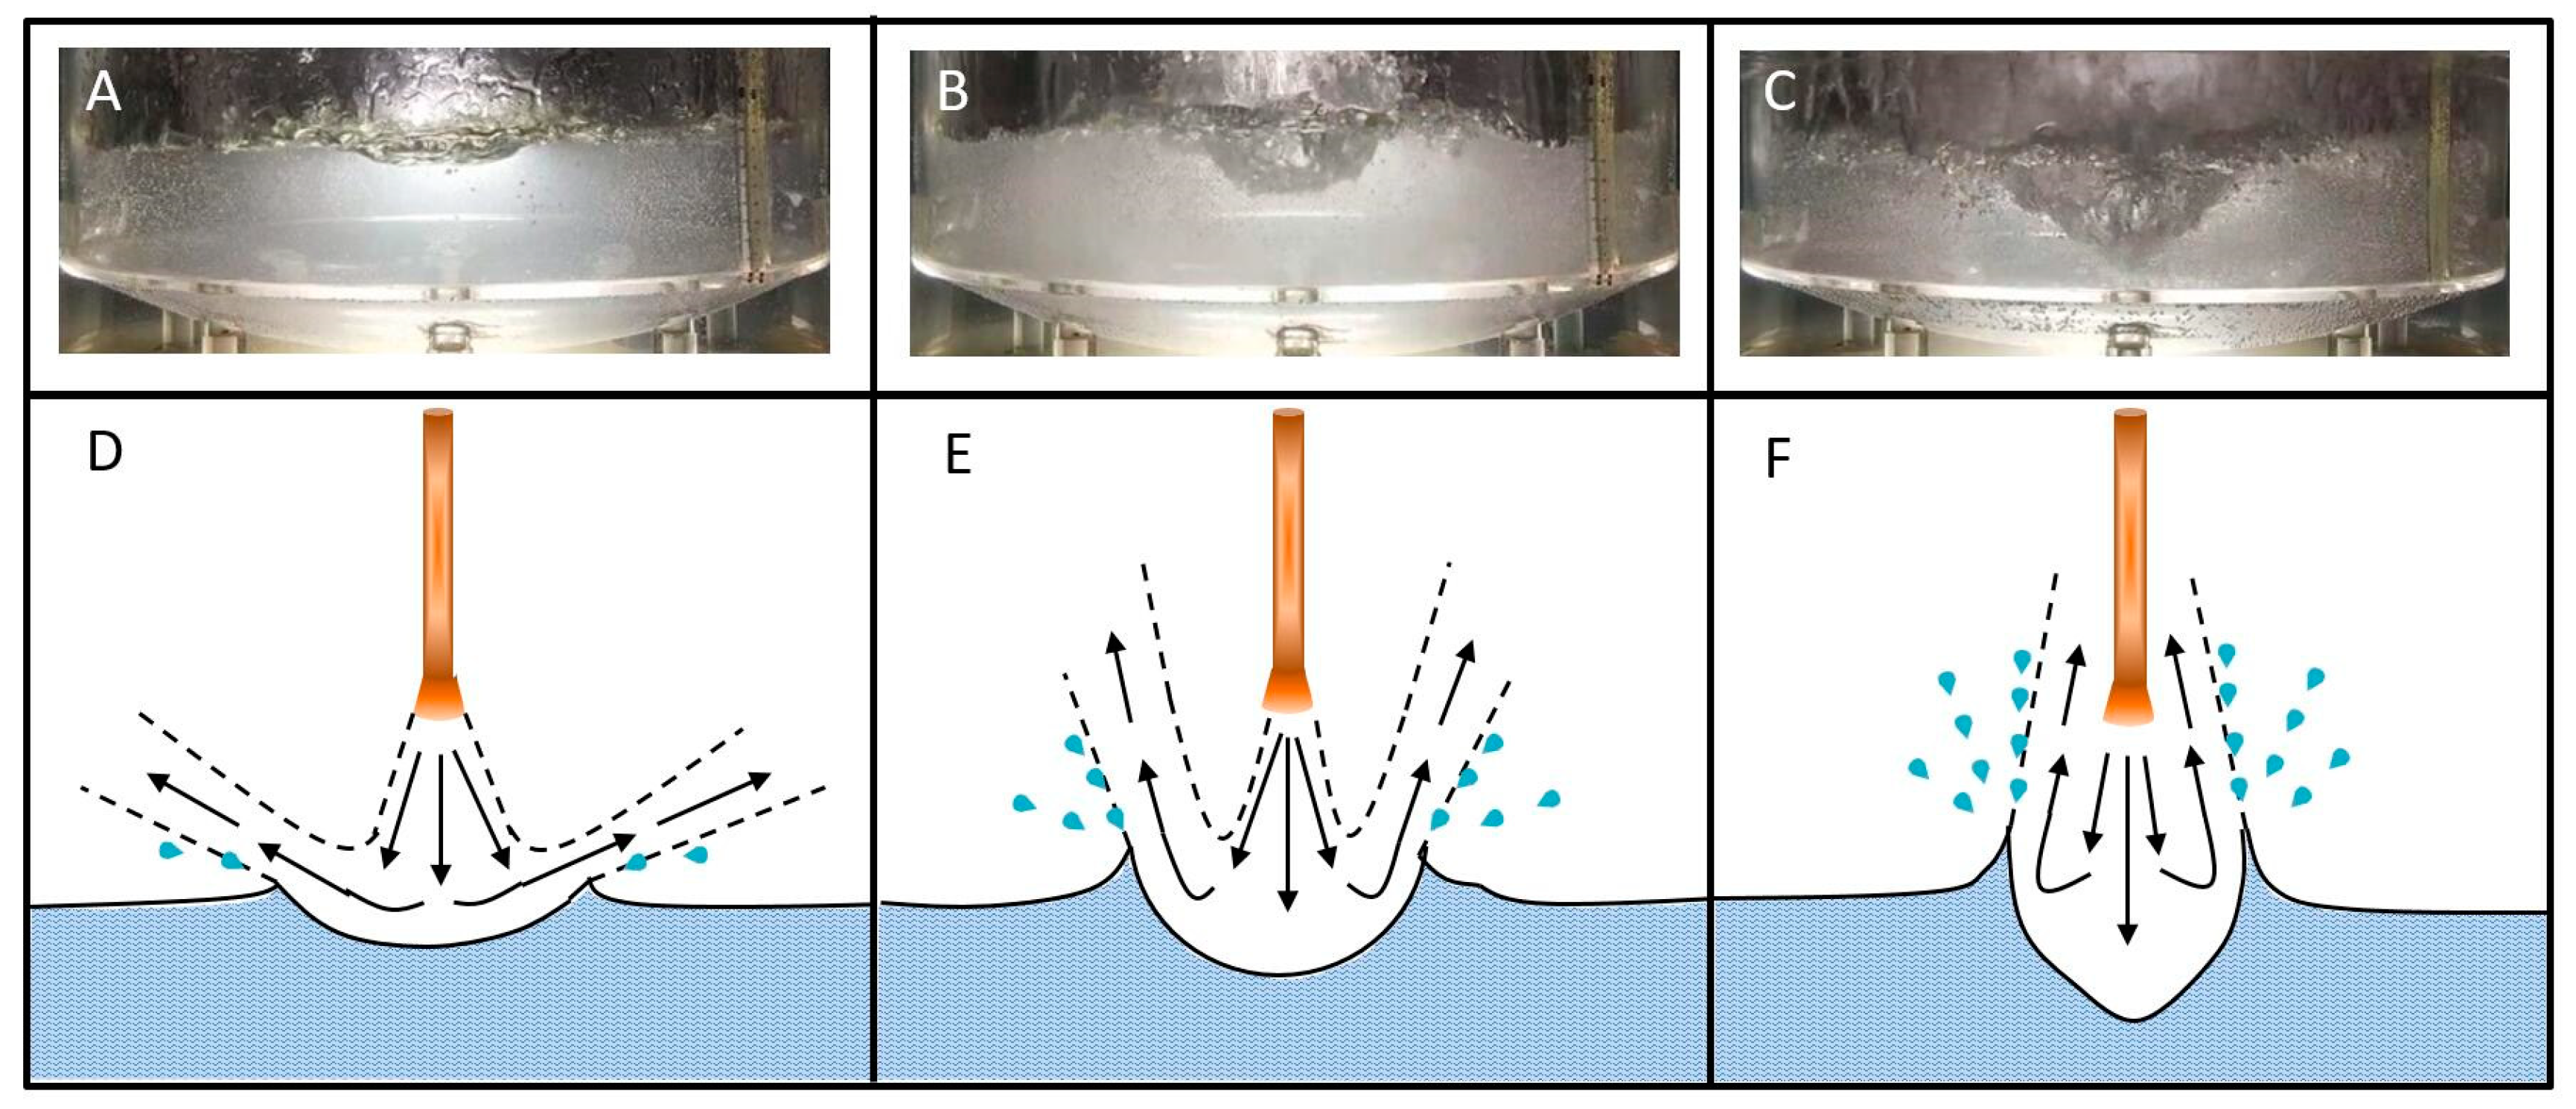
3.1. Impact Cavity Shapes Under the Different Top-Blown Gas Jet Conditions

With the increase in the gas flow of the oxygen jet, the change of impact cavity shape at the oxygen lance height of 120.0 mm is shown in Figure 4. When the gas flow was 19.9 Nm3·h−1, 24.0 Nm3·h−1, and 28.1 Nm3·h−1, the cavity is shallow and flat, called the “disc” shape, as shown in Figure 4A. With the gas flow increasing, the cavity became deeper and sharper. When the gas flow was 32.3 Nm3·h−1, the cavity shape was the “bowl” shape, as shown in Figure 4B, and then transformed to the inverted “cone” shape at a gas flow of 36.4 Nm3·h−1 and 40.5 Nm3·h−1, as shown in Figure 4C. It can be seen that the cavity shape changed following the sequence of “disc” → “bowl” → “cone” with the increase in the gas flow.
As stated in the Kelvin-Helmholtz instability theory [12], if there is a shear force in the continuous fluid or a velocity difference between two parallel moving fluids, instability can be caused on the fluid surface or the interface of two fluids. This theory can be used to explain the splashing formation. When the reflected gas flow of top-blown oxygen moved along the cavity surface, the cavity instability was caused by the shear effect of the gas flow and the velocity difference between gas and liquid steel. The molten steel was torn off from the cavity edge, resulting in a splashing. The starting point, direction, and velocity of the splashing droplets were determined by the shape and the size of the impact cavity. The three shapes of cavity (“disc”, “bowl”, and “cone”) observed in this experiment correspond to the three splashing modes (“dimpling”, “splashing”, and “penetrating”) proposed by Molloy [11]. In the “dimpling” mode, a pit was formed on the liquid surface, but no splashing droplet was generated, as shown in Figure 4D; in the “splashing” mode, the cavity depth was increased and droplets were torn off outside the cavity edge; in the “penetrating” mode, the splashing of droplets was increased and torn off inside the cavity. As a result, the change of cavity shape can reflect the change of splashing mode. The cavity shapes under the different top-blown oxygen jet conditions, including the oxygen lance height and the gas flow, are listed in Table 3.

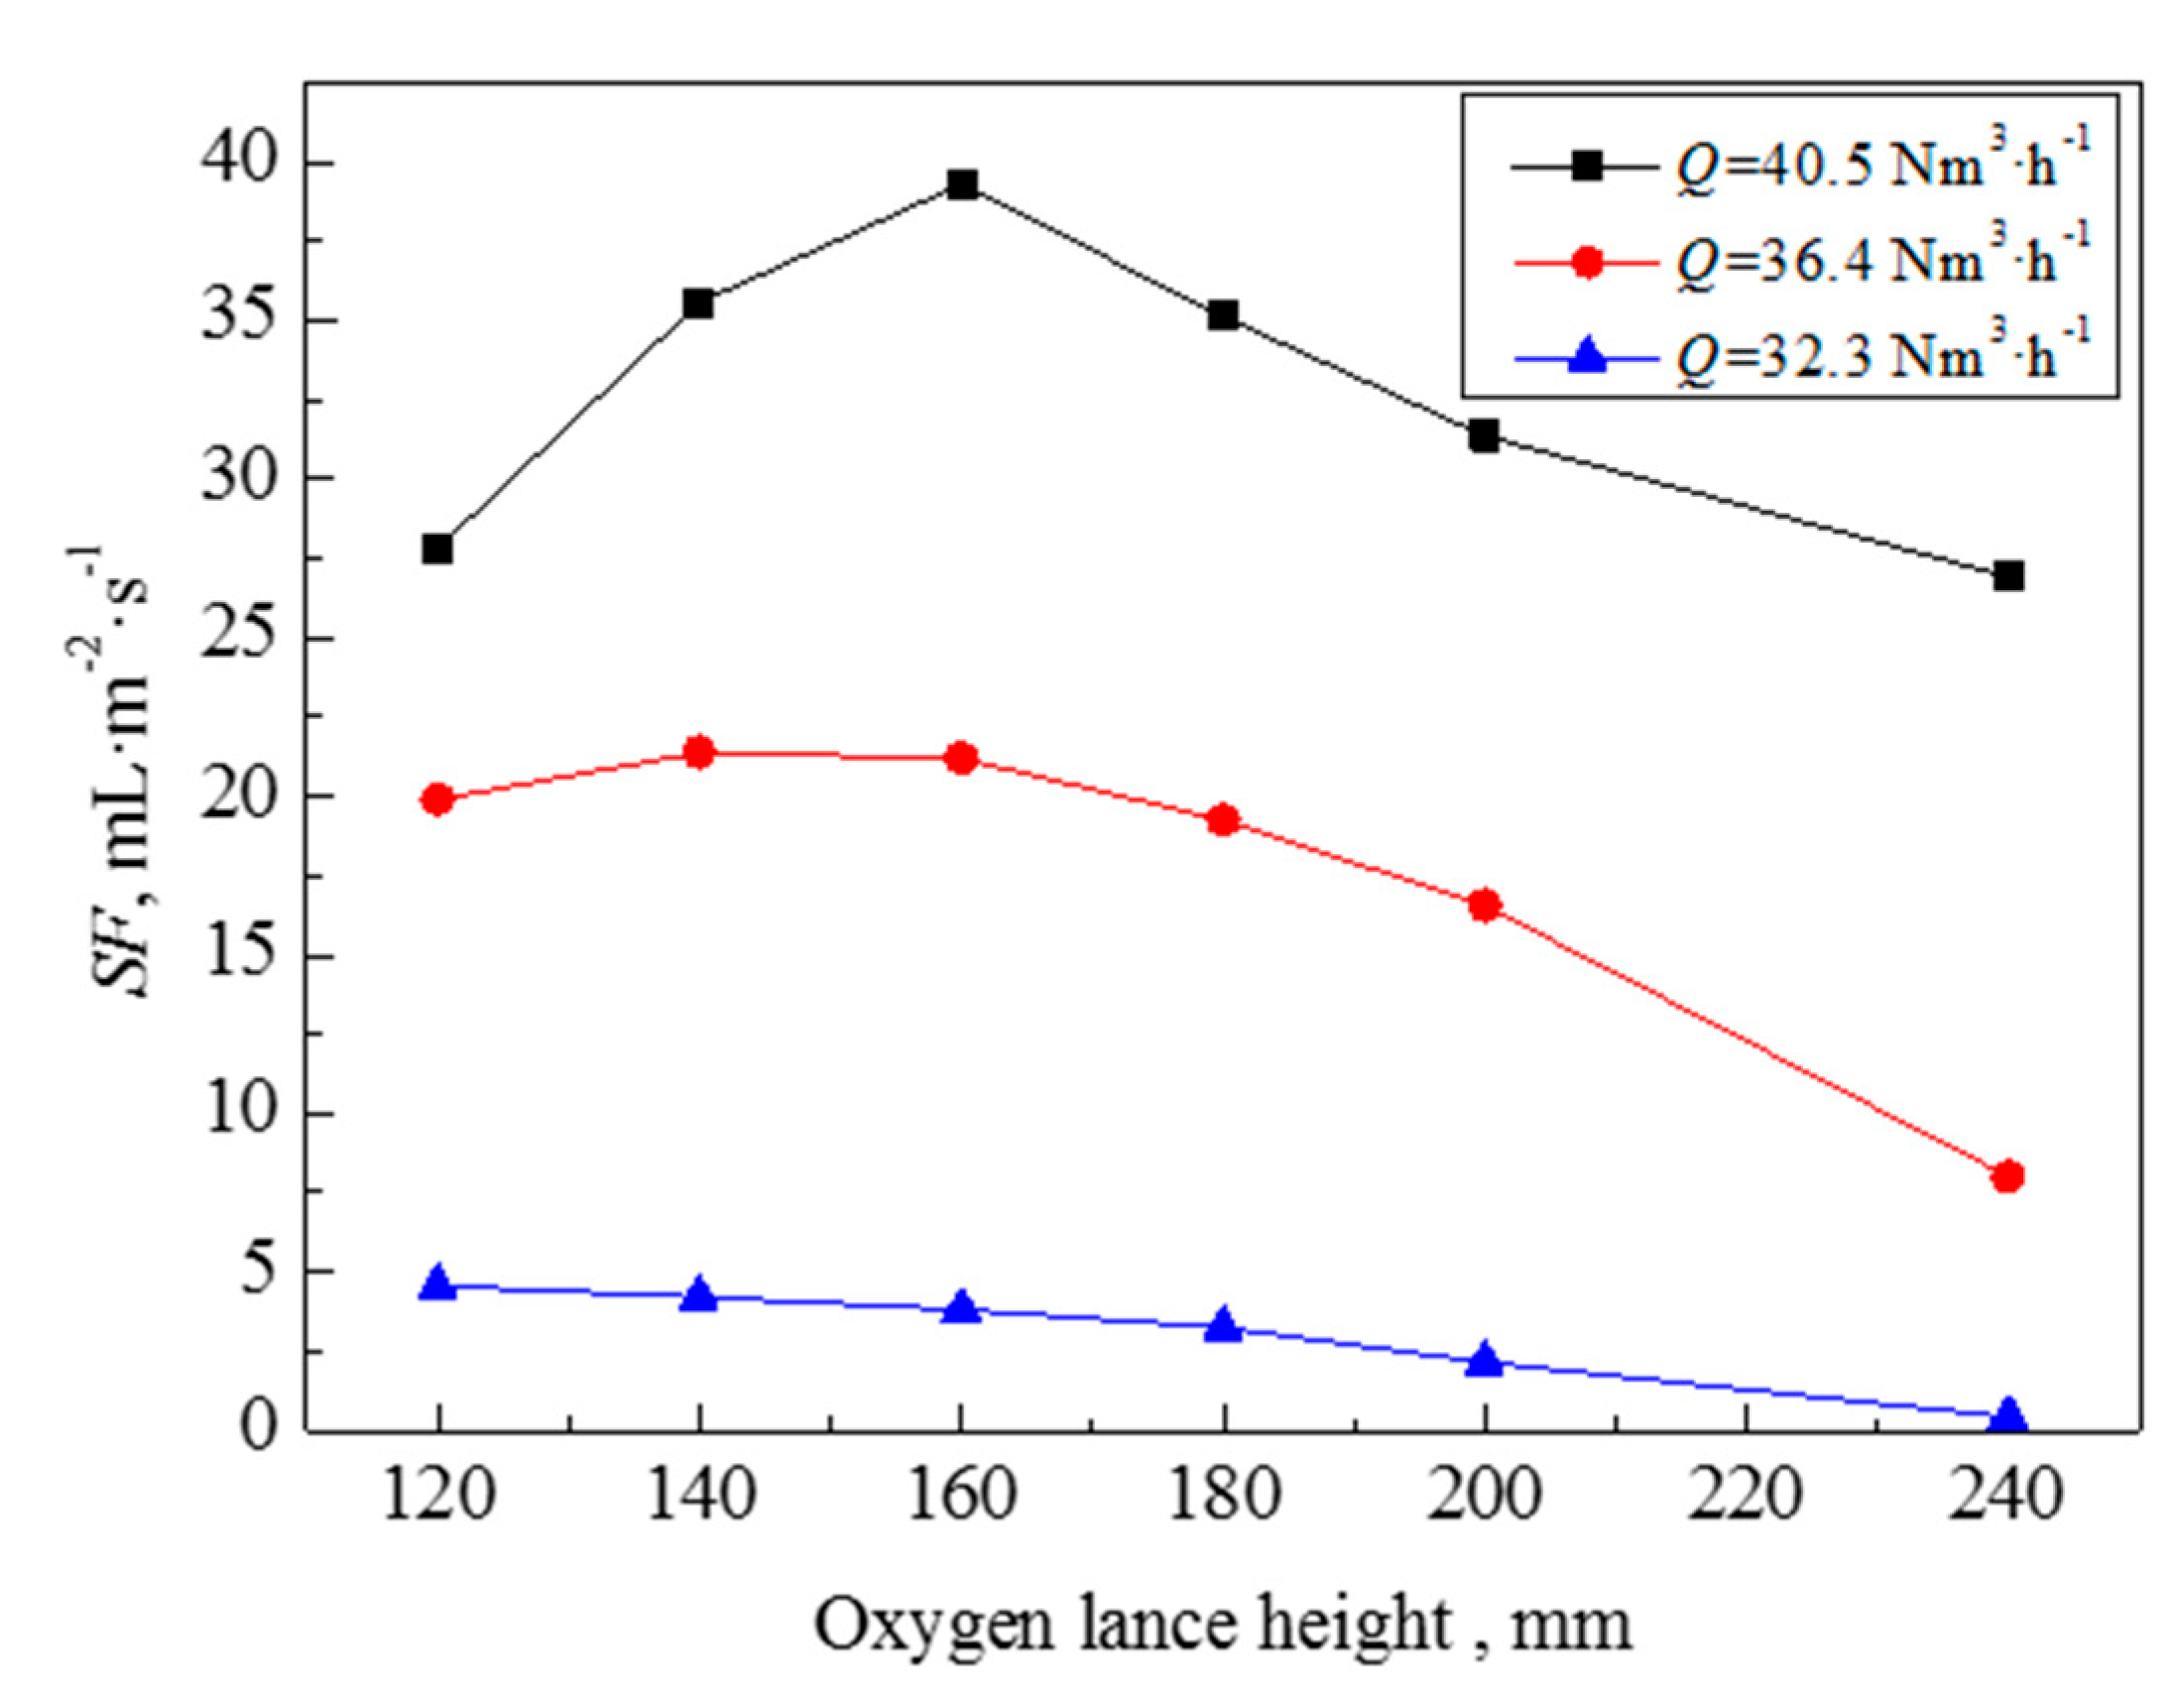
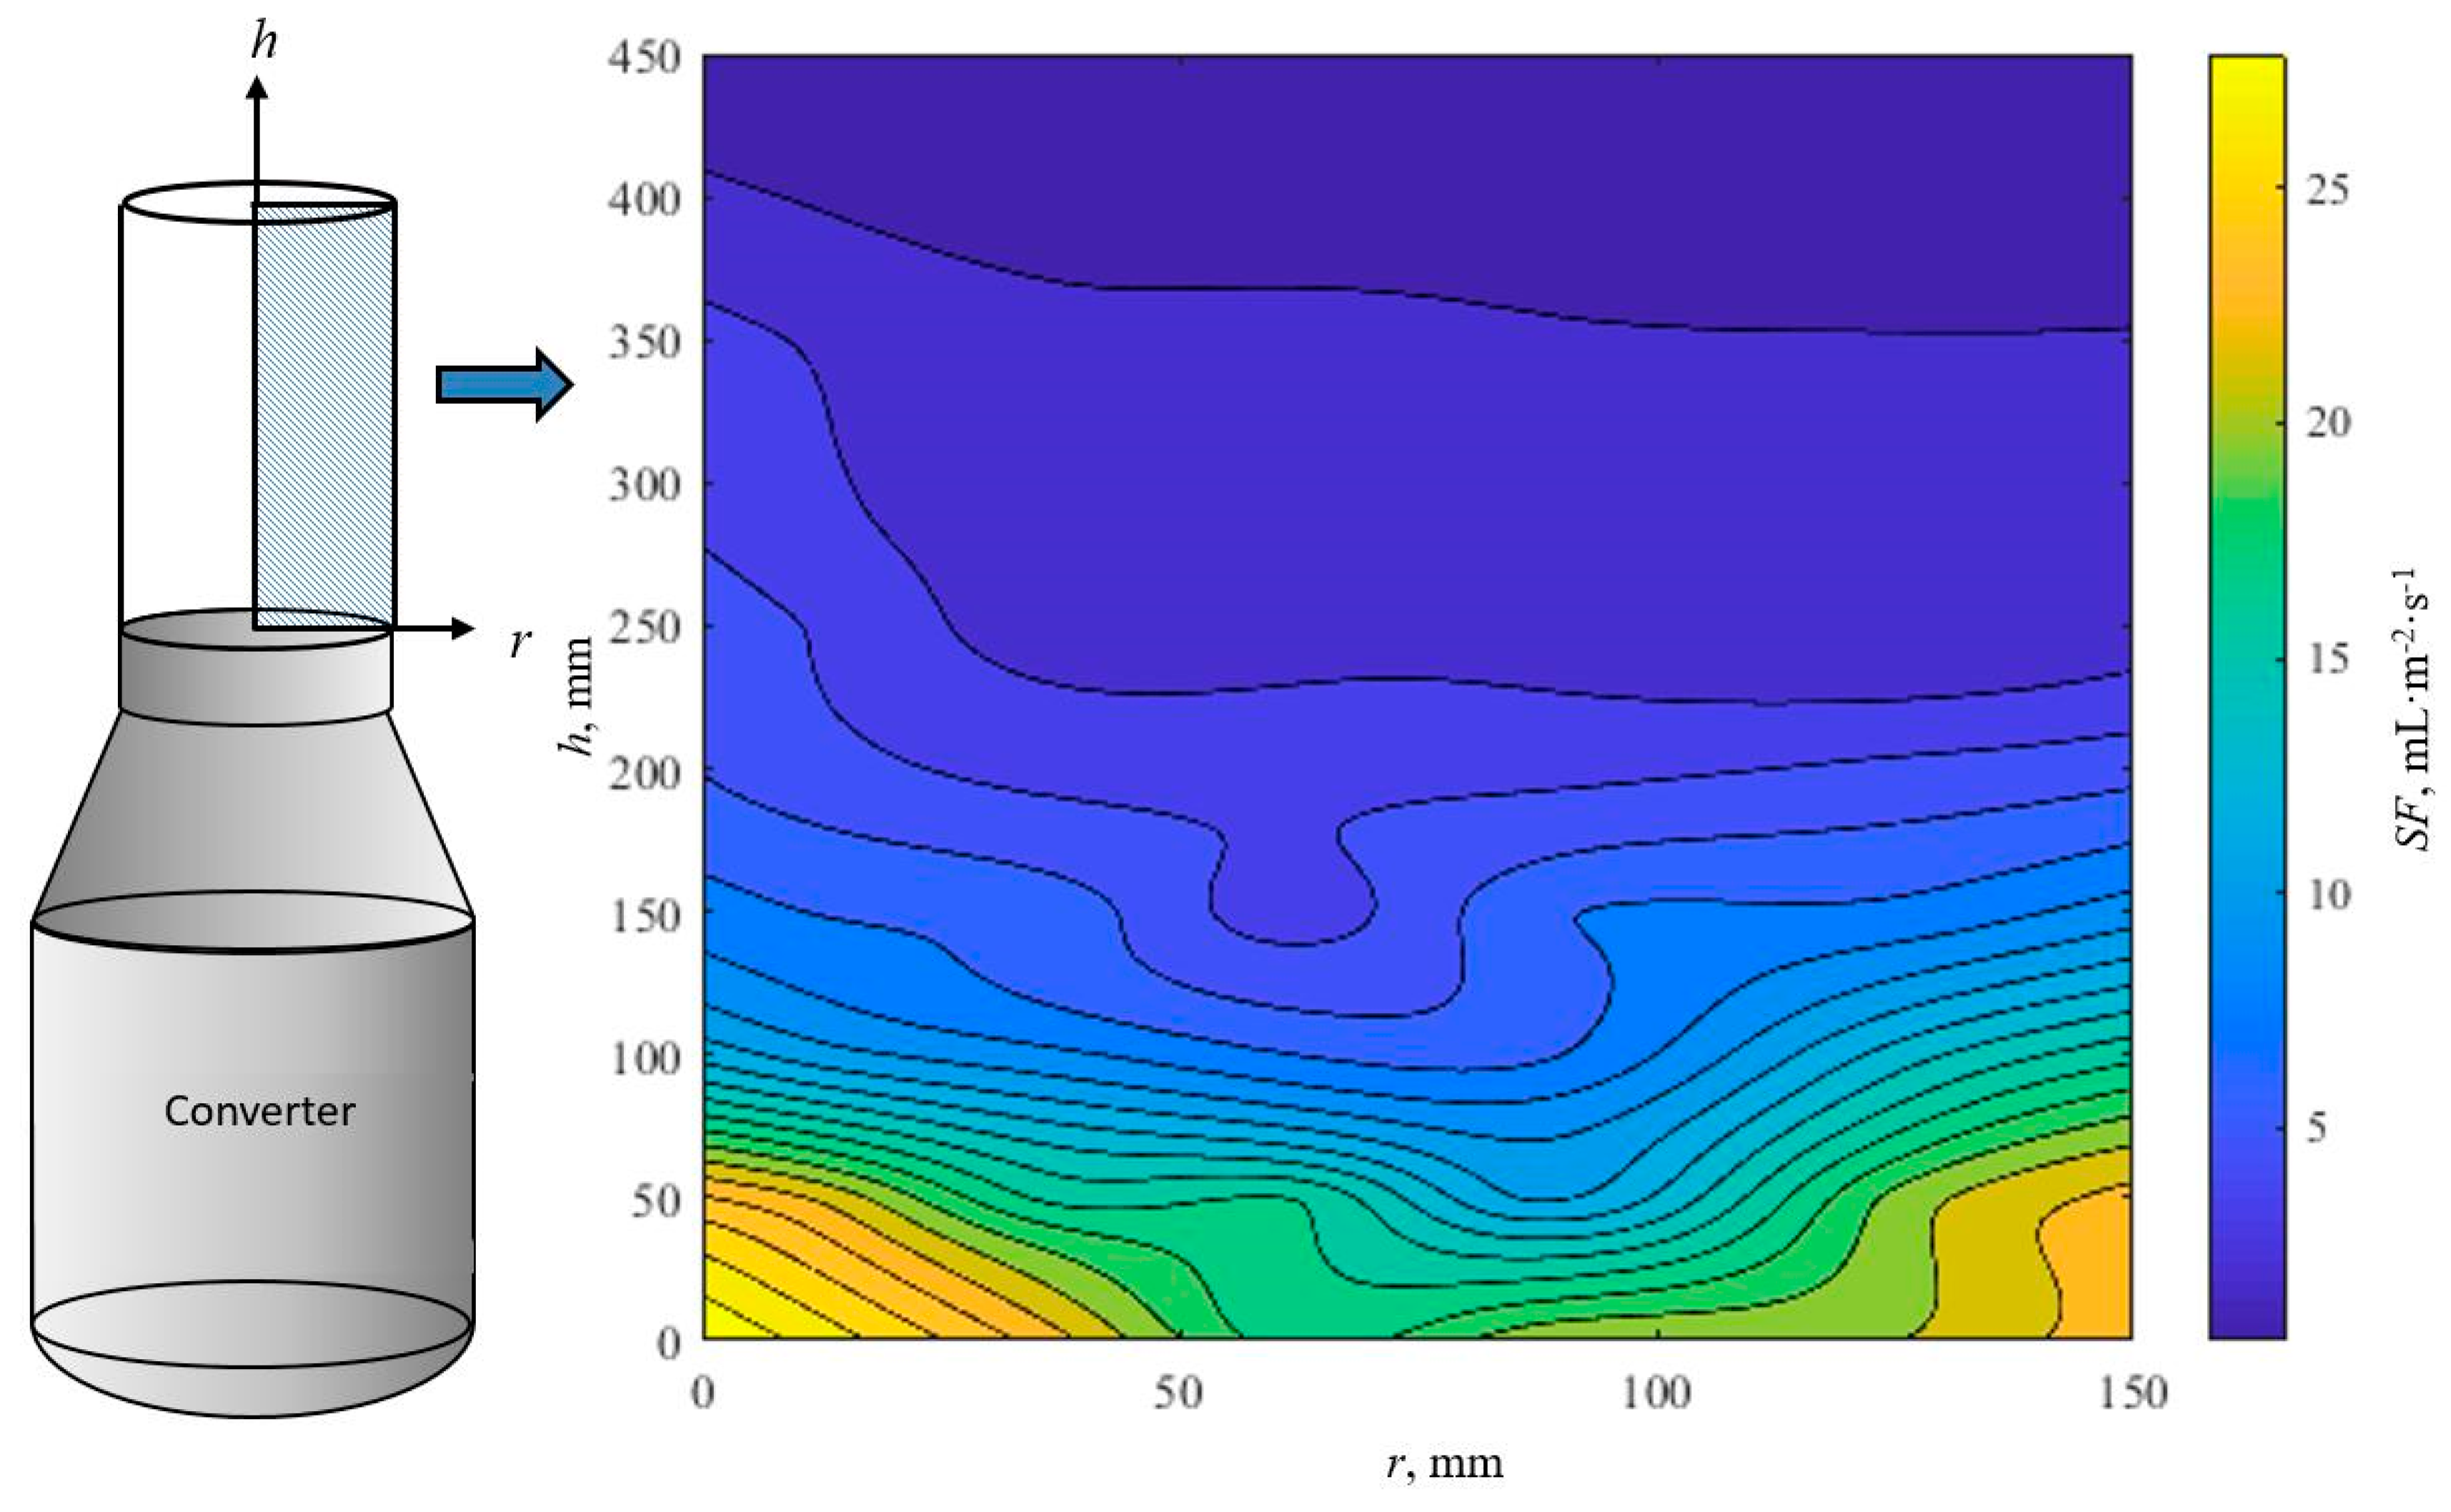
3.2. Splashing Distribution on the Inner Wall of the Converter

In this investigation, the splashing flux (SF) is used to quantitatively characterize the splashing intensity. The SF is defined as the volume of liquid splashed into the unit area per unit time (mL·m−2·s−1). The calculation method of SF is shown in Equation (4).
S F = V t A
where, V is the volume of droplets collected in the sampling tubes (mL), t is the splashing time (s), and A is the area of the sampling holes (m2).
The frequently-used gas flow of the top-blown oxygen lance is 44,000 Nm3·h−1 in the prototype converter, and the corresponding gas flow is 36.4 Nm3·h−1 in the physical model. Under the top-blown gas jet condition (L = 120.0 mm and Q = 36.4 Nm3·h−1), the SF on the furnace inner wall at the height of 192.0 mm above bath surface is shown in Figure 5. It can be observed that the SF of each sampling point is different due to the difference in angles between the nearest nozzles and sampling points. The SF reached its maximum of 560 mL·m−2·s−1 at the angles of 36°, 108°, 180°, 252°, and 324°, which are on the angular bisector of the adjacent oxygen lance nozzles. It is obvious that the impact effect of the top blow gas jet on these five positions is the largest, resulting in the largest SF.
Under the top-blown gas jet condition (L = 120.0–240.0 mm and Q = 36.4 Nm3·h−1), the SF on the furnace inner wall at the heights of 192.0 mm, 288.0 mm, 384.0 mm, 480.0 mm, and 606.0 mm above the bath surface are shown in Figure 6A–E. The SF decreased sharply with the sampling height rising. It can be inferred that the splashing on the furnace inner wall concentrated at the region adjacent to the molten bath surface, implying severe flushing the furnace lining of this region. Therefore, this area should be paid more attention in furnace maintenance.

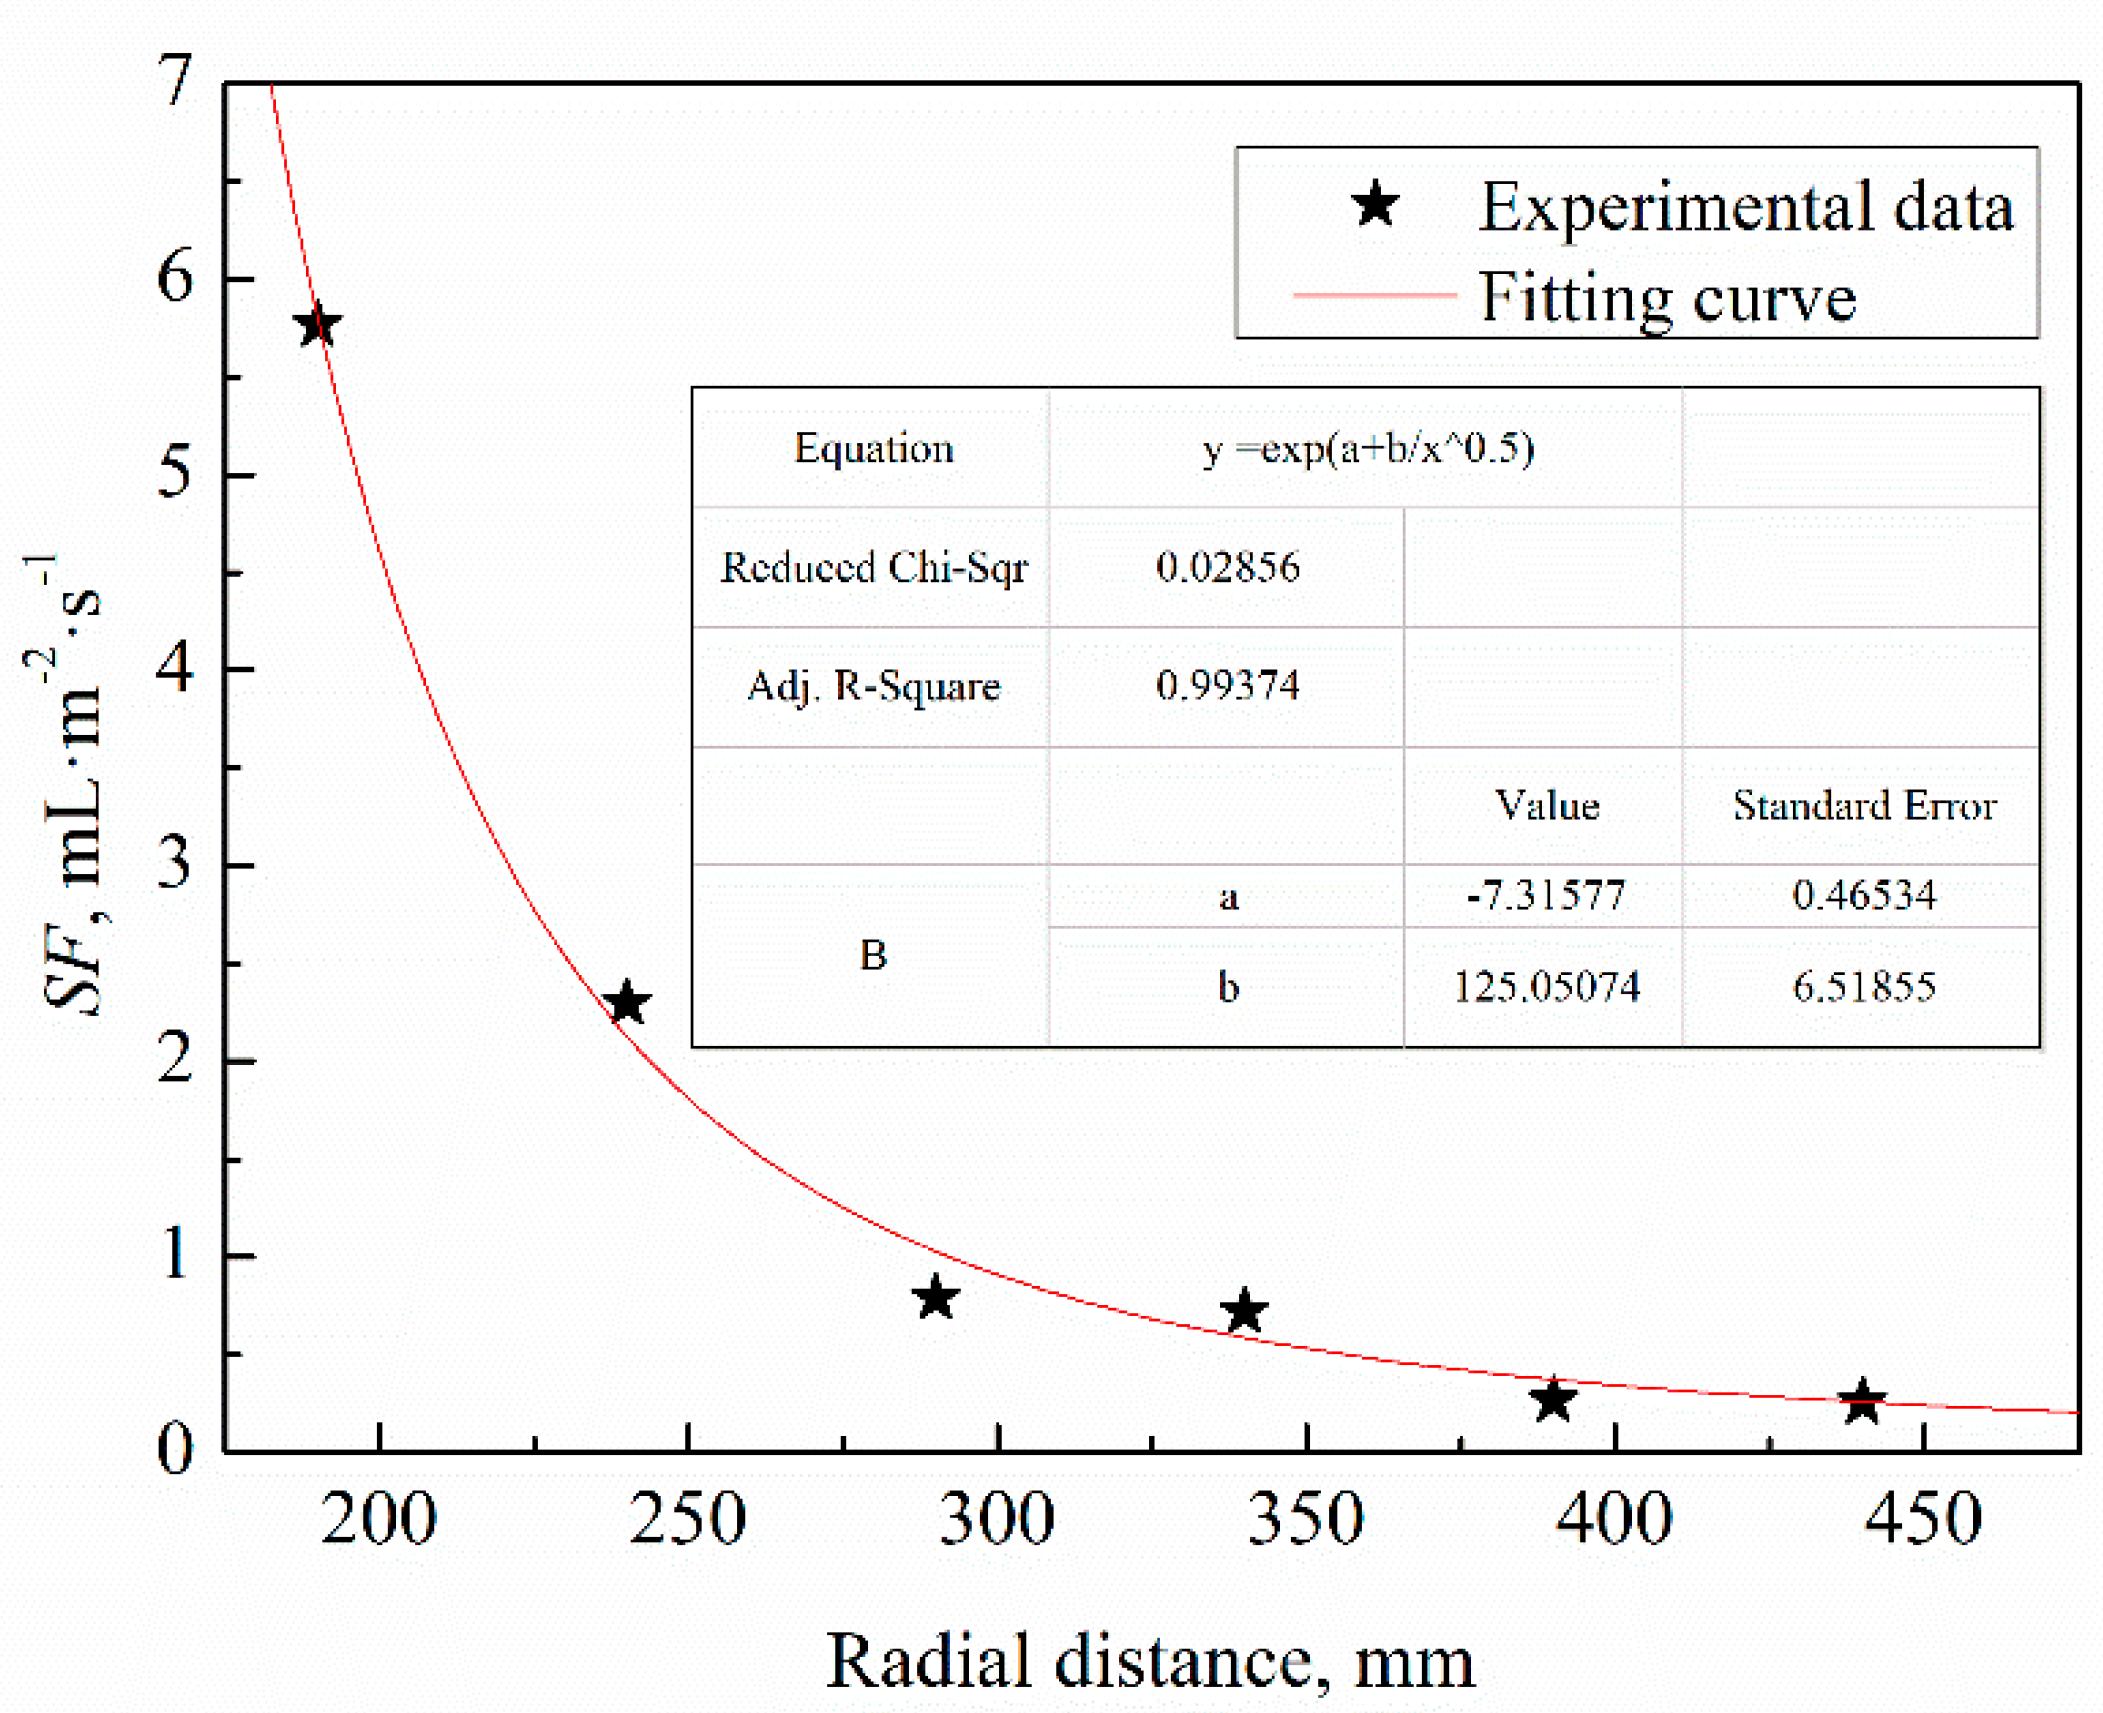
3.3. Splashing Distribution near the Furnace Mouth

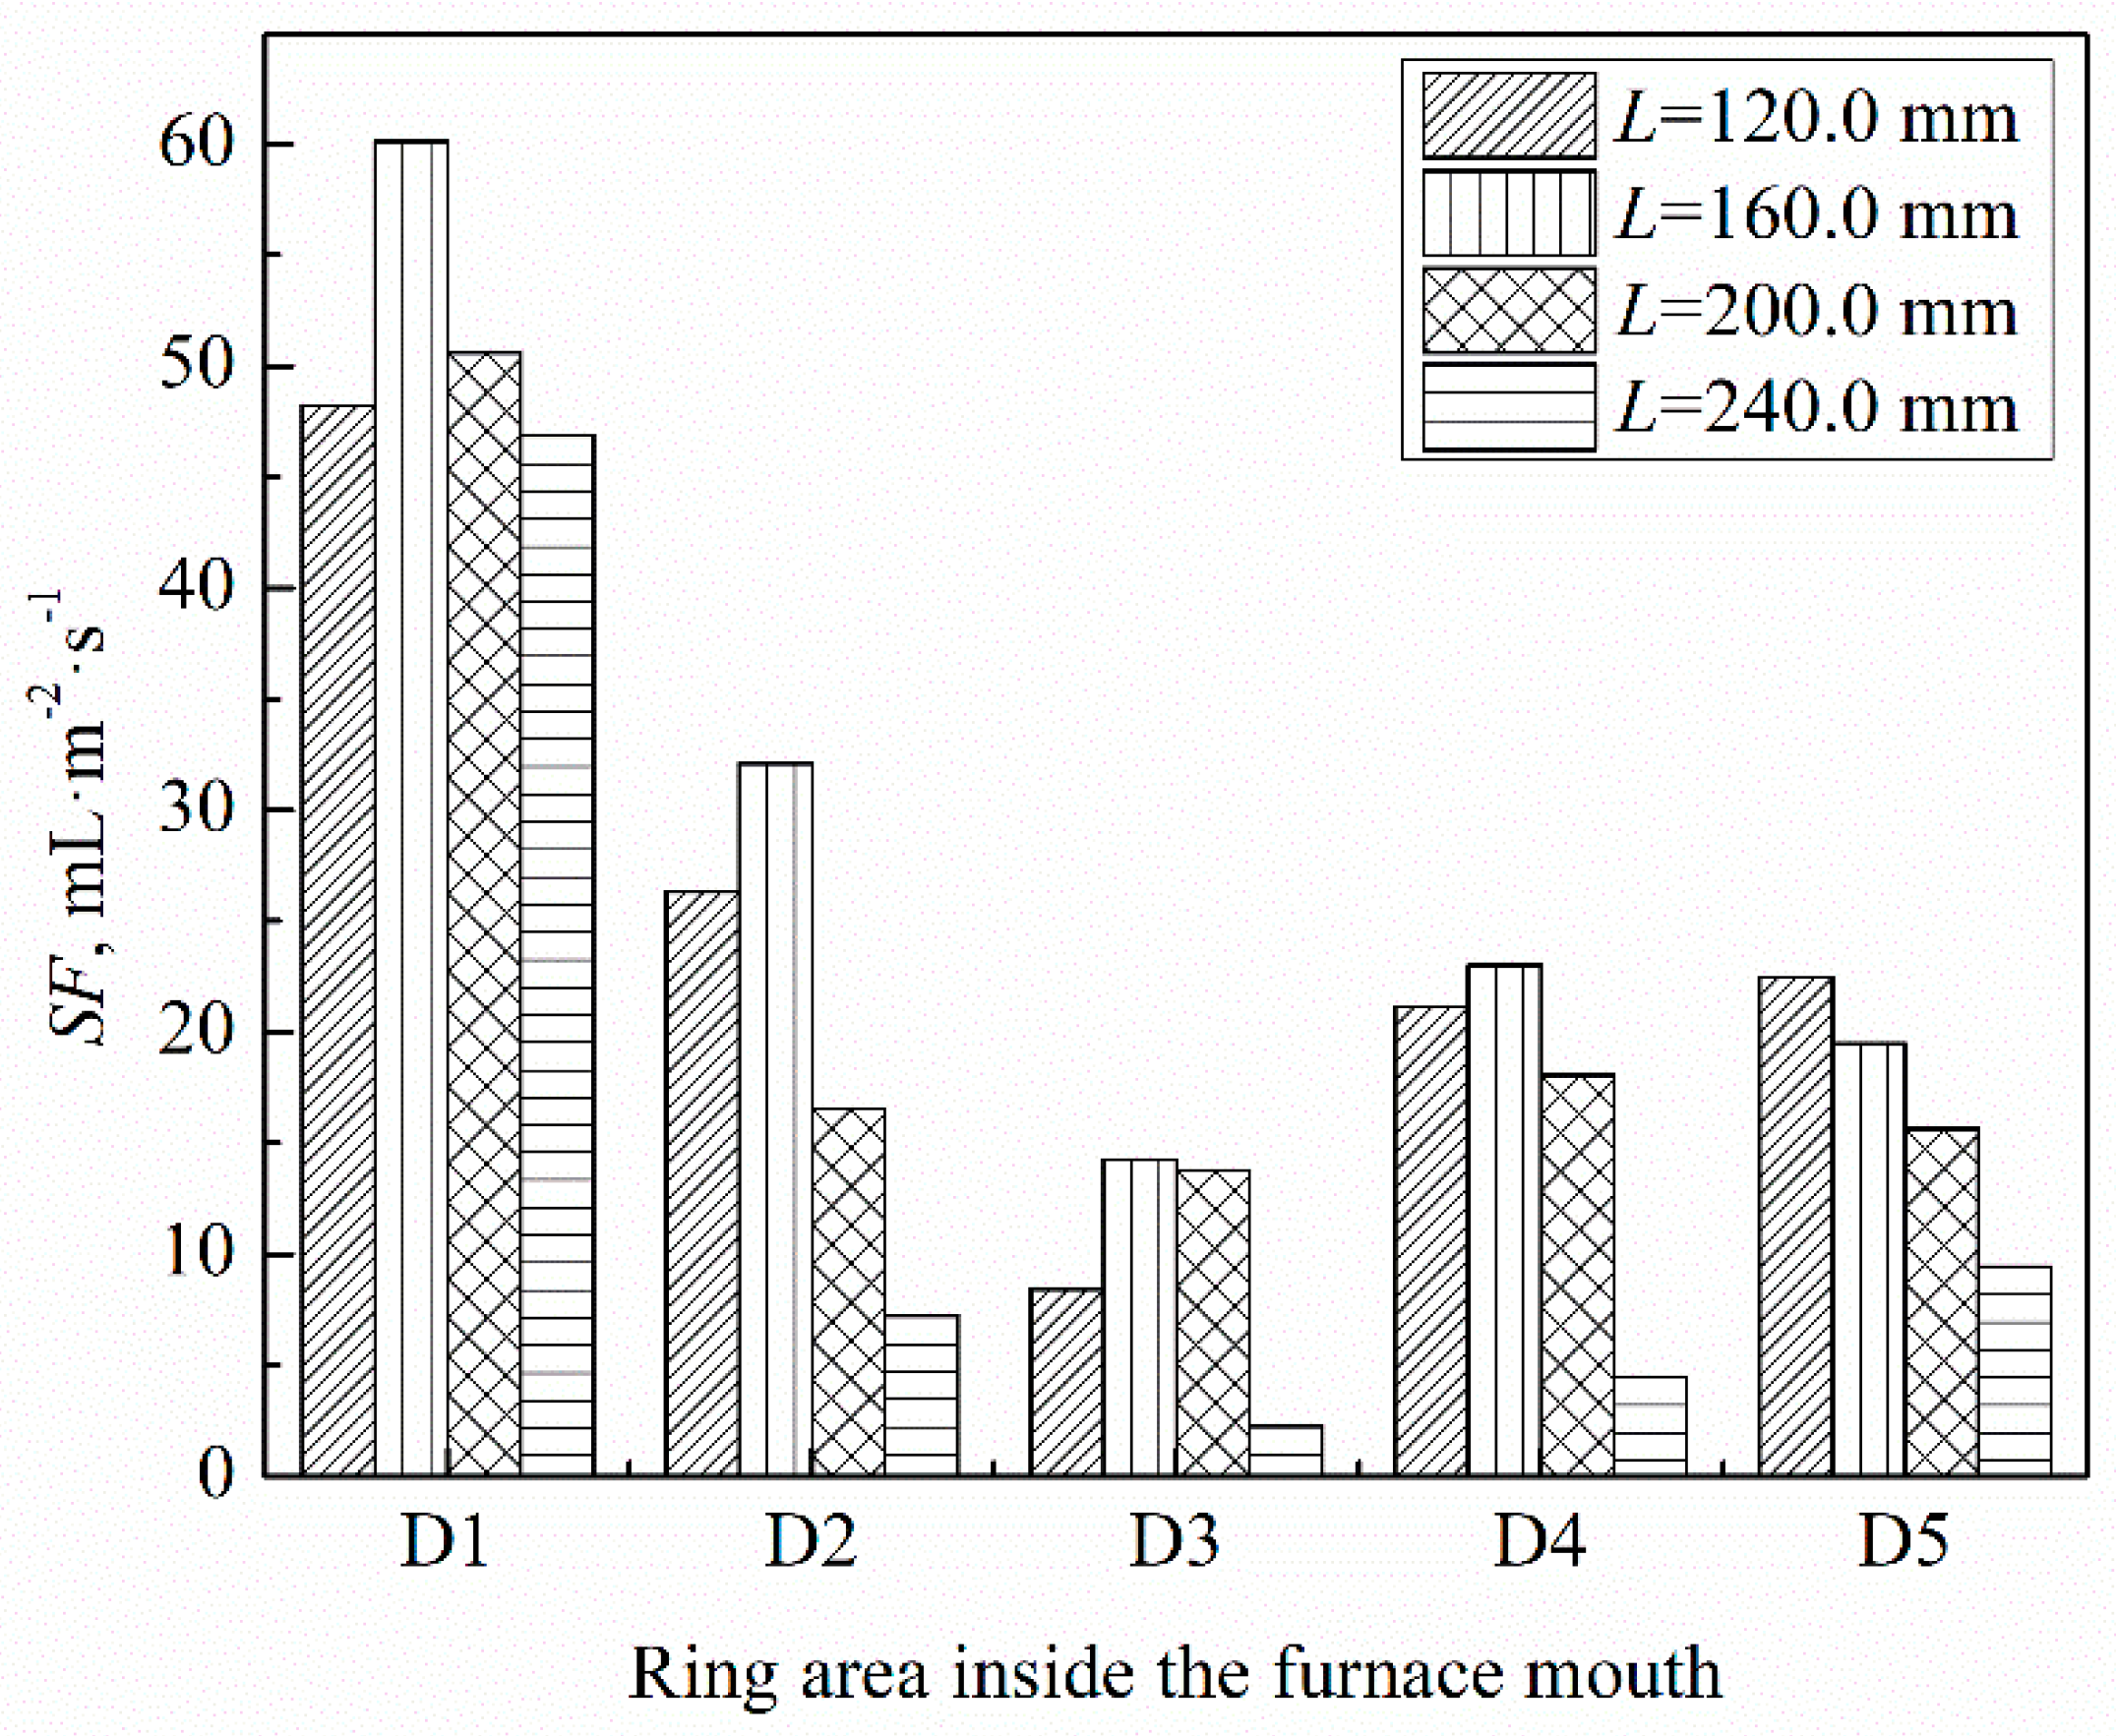
3.3.1. Inside the Furnace Mouth

The SF inside the furnace mouth was obtained by weighing the weight increment of the sponge filled in the furnace mouth after the splashing experiment. The results show that there is no weight increment at a gas flow of <32.3 Nm3·h−1, defined as the critical gas flow of splashing outside the converter. The SF of the furnace mouth was investigated at various gas flow and oxygen lance heights, as shown in Figure 7. The SF in the furnace mouth increased significantly with the increase in the gas flow. At gas flows of 32.3 Nm3·h−1 and 36.4 Nm3·h−1, the SF of the furnace mouth decreased with elevating the oxygen lance. This is because the initial velocity of splashing droplets was reduced with the decrease in impact energy caused by increasing the distance between the oxygen lance and the bath. This trend of the effect of the oxygen lance on SF is very similar with the experiment result under high temperature [15]. At a gas flow of 40.5 Nm3·h−1, the SF first increased and then decreased with elevating the oxygen lance. The shift of splashing mode led to this phenomenon. The movement direction of splashing droplets was toward the cavity inside under the “penetration” mode (cone shape) at the oxygen lance height of 120.0 mm, but this changed to outside the cavity under the “splashing mode” (bowl shape) when the oxygen lance height was elevated to 160.0 mm. The increase in the number of upward-moving droplets led to the splashing increment in the furnace mouth. When the oxygen lance was higher, the SF decreased due to the impact energy decreasing.
The SF at the D1–D5 areas of the furnace mouth under the top-blown gas jet condition (L = 120.0–240.0 mm and Q = 36.4 Nm3·h−1) are shown in Figure 8. It can be seen that the SF near the converter center axis (D1 and D2 areas), which is the oxygen lance position, is the largest. Accidents of burning out oxygen lance may be caused by the dramatic splashing at this position. Therefore, the control of SF in D1 and D2 areas should be paid more attention.

3.3.2. Outside the Furnace Mouth

The SF inside the furnace mouth was obtained by weighing the weight increment of the sponge filled in the furnace mouth after the splashing experiment. The SF at the six areas (D6–D11) outside the furnace mouth are measured at a gas flow of 36.4 Nm3·h−1 and a oxygen lance height of 160.0 mm, as shown in Figure 9. It can be seen that the SF outside the furnace mouth decreased rapidly with the radial distance. The fitting result shows that the SF has an exponential relationship with the radial distance, as shown in Equation (5). The safe distance standard could be established referring to this result.
S F = Exp ( 7.32 + 125 r 0.5 )
where, r is the radial distance between the measuring area and the center of furnace mouth (mm).
The SF at the different heights (H1–H9) and the different ring areas (D1–D6) above the furnace mouth were measured by moving the sponge rings. Based on these experimental results, the SF distribution at the different spatial position above the furnace mouth was calculated using the interpolation method, as shown in Figure 10. Obviously, the SF near the center and the edge of the furnace mouth are higher, tending to damage the oxygen lance and the gas hood. The SF decreased significantly with the height. The statistics of the SF provides a reference for protecting the converter equipment.

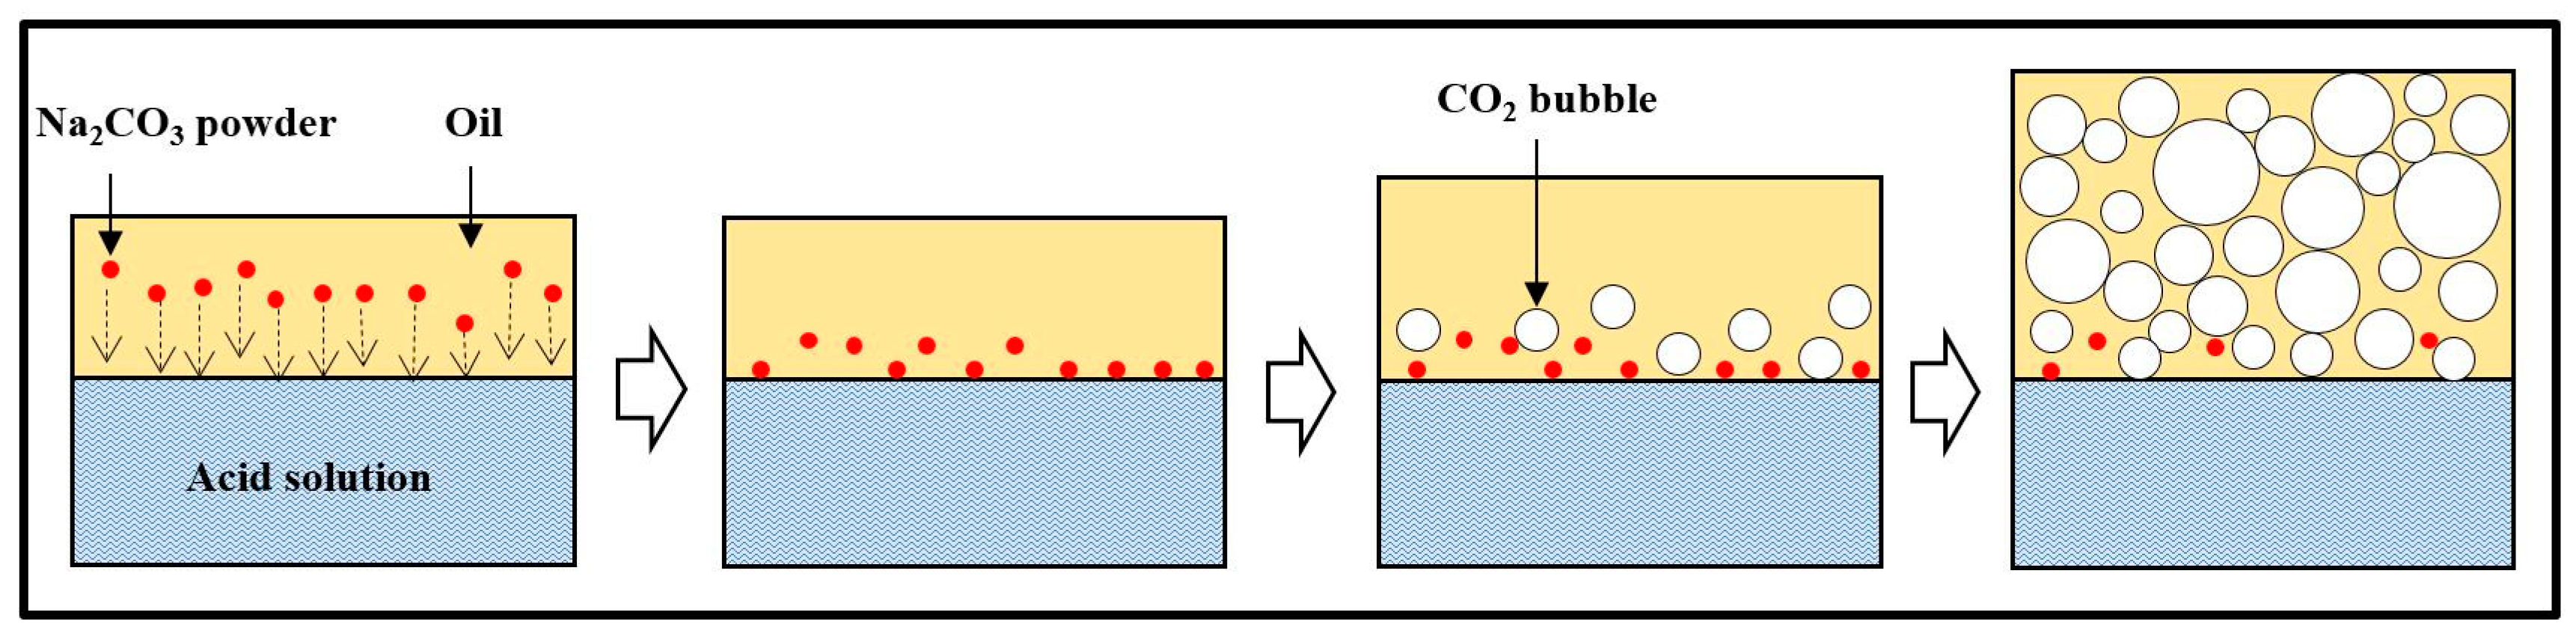
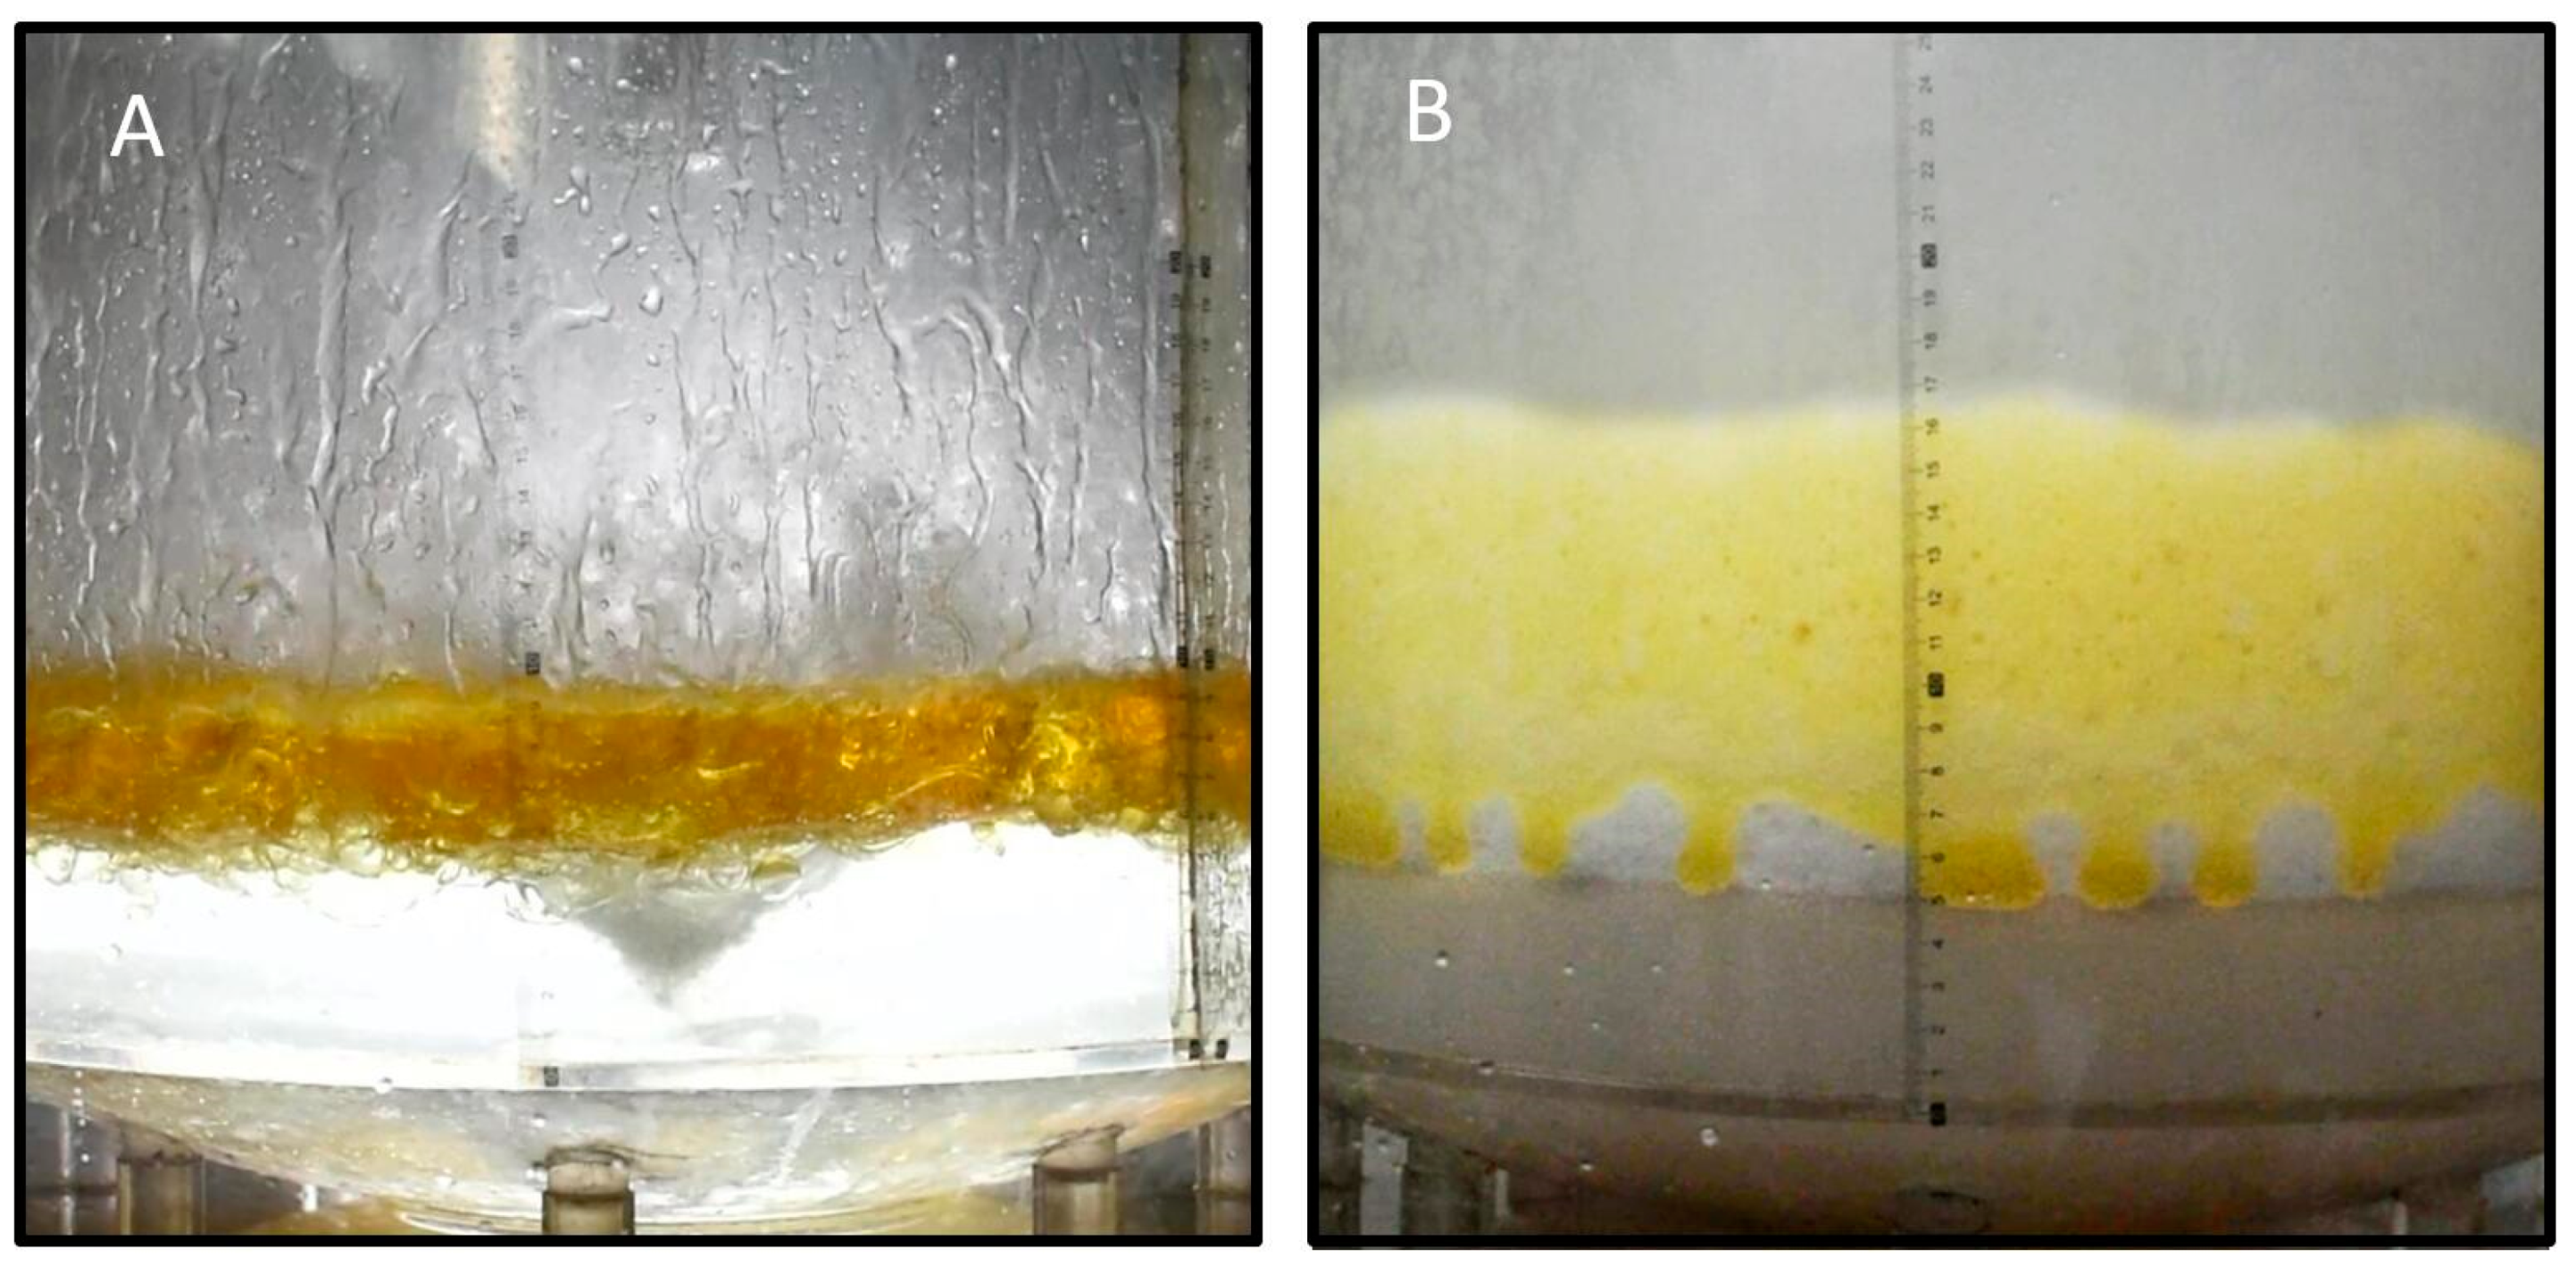
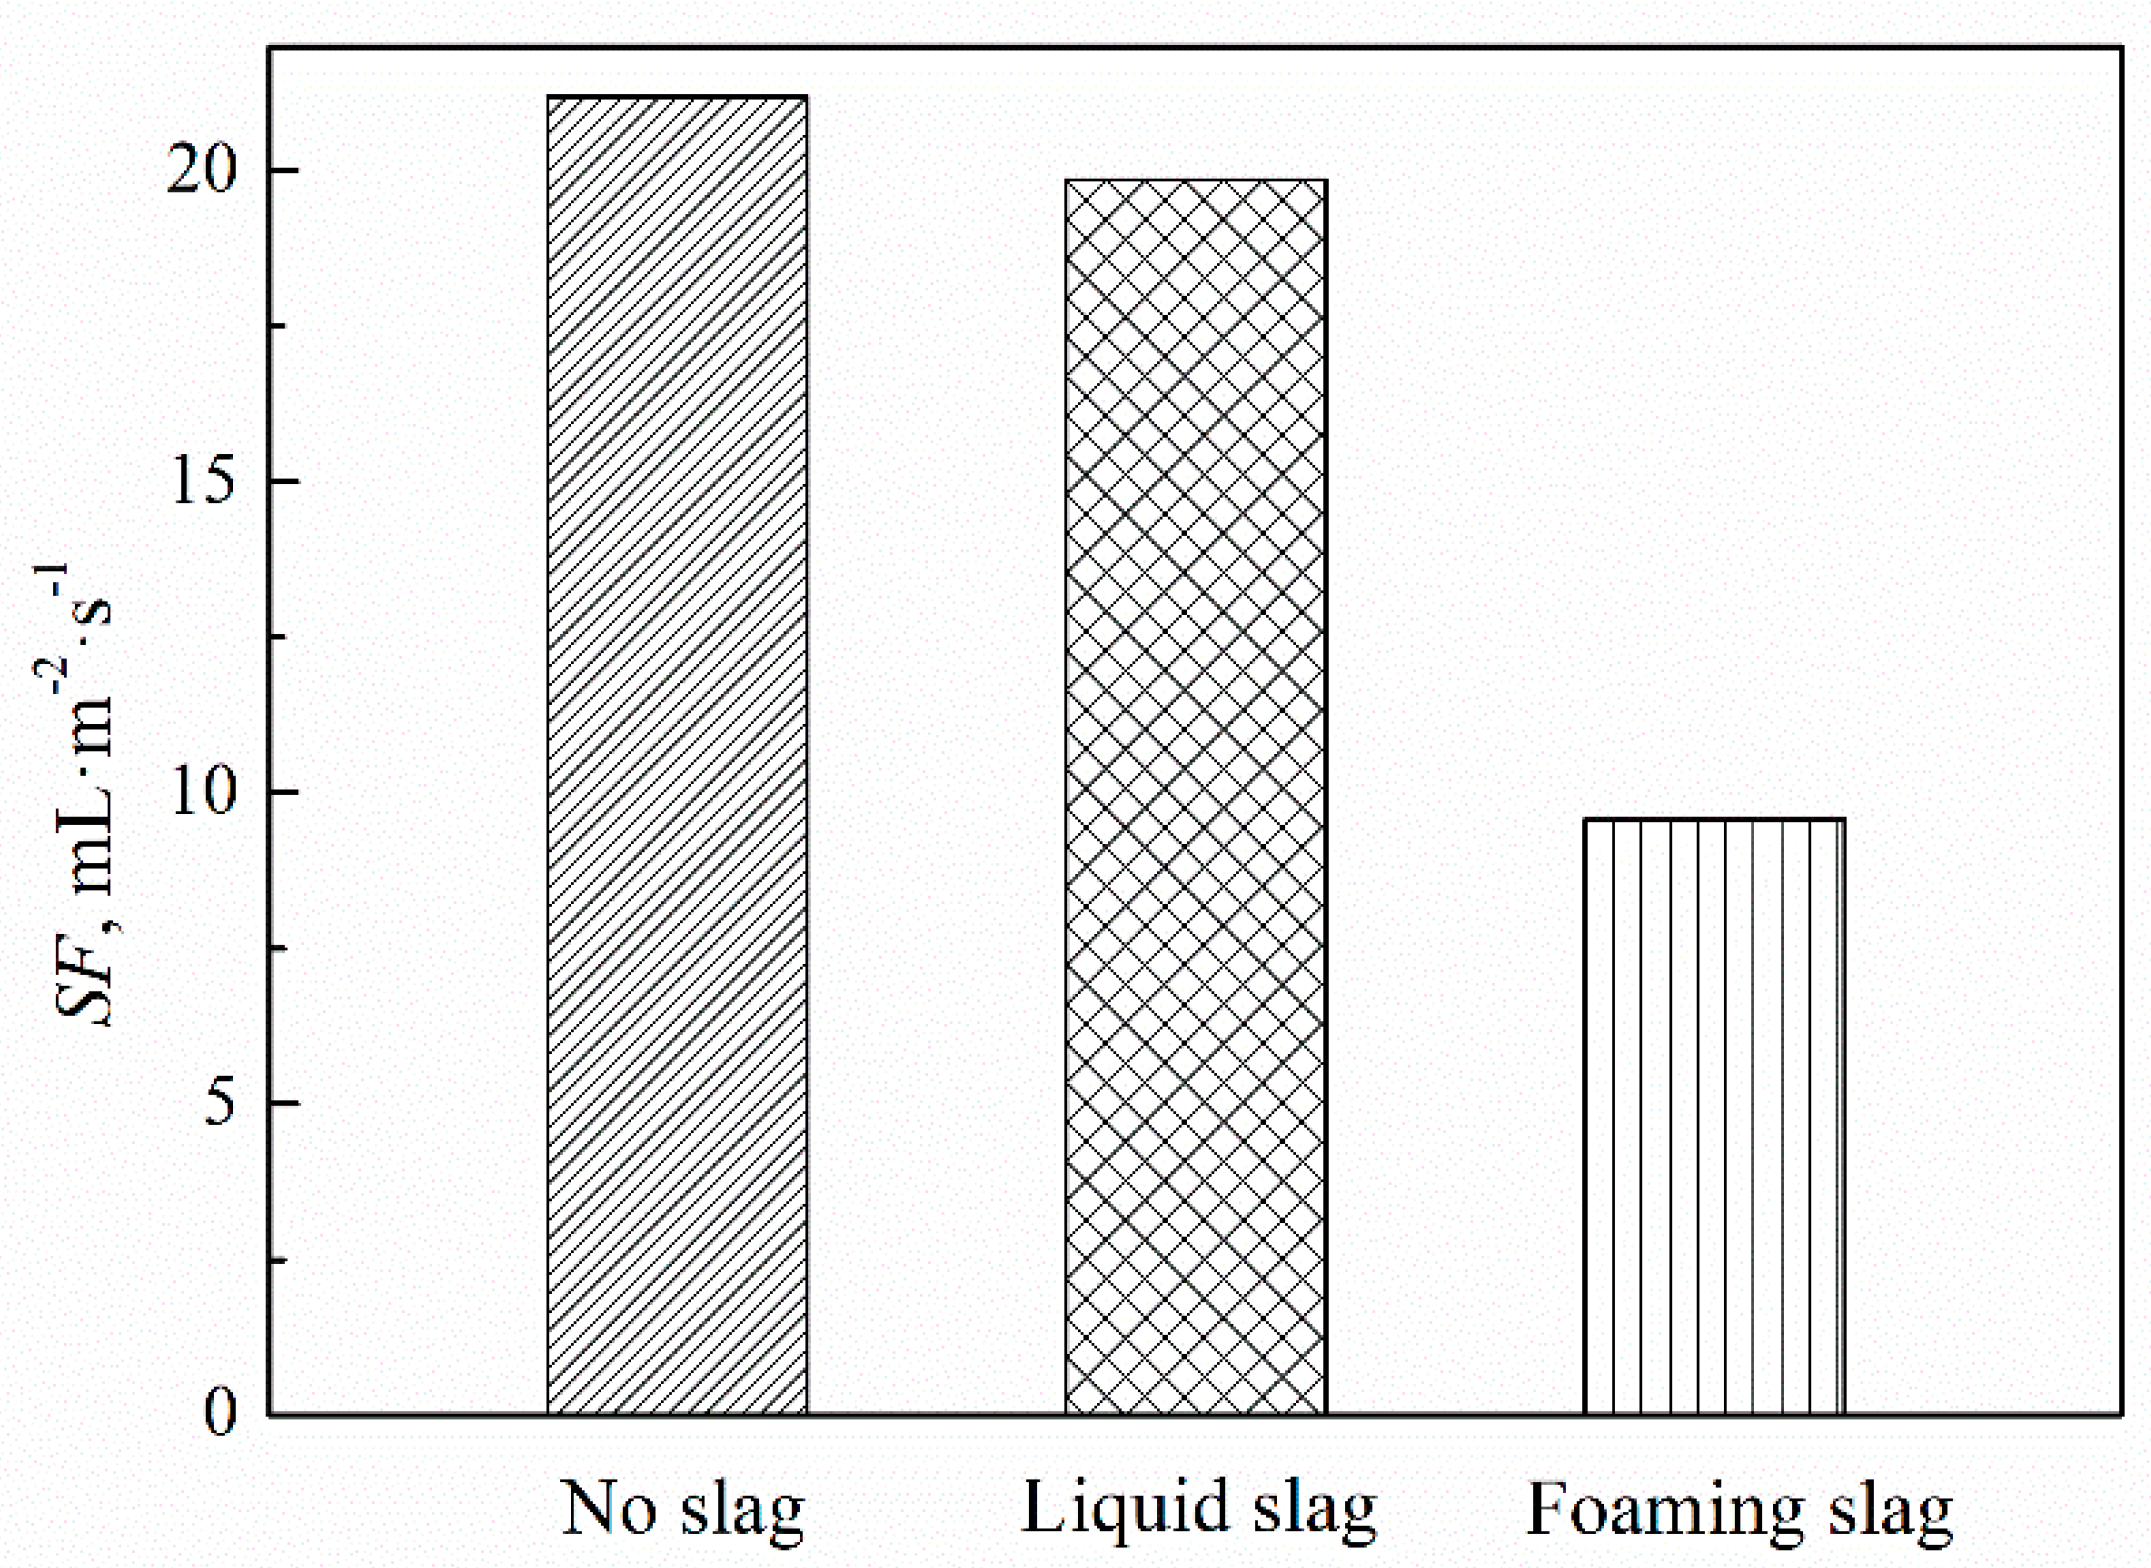
3.4. Influence of the Foaming Slag on Splashing

The chemical reaction (Equation (6)) between the sodium carbonate powder in the heat transfer oil and the sulfuric acid solution (5 wt.% H2SO4) was used to simulate the slag-metal reaction (Equation (7)) between (FeO) and (C) in the smelting process, as the gas source of foaming. The foaming process is shown in the Figure 11.
Na2CO3 + H2SO4 = Na2SO4 + CO2 + H2O
(FeO) + (C) = (Fe) + CO
As shown in Figure 12, the impact cavity with “cone” shape can be observed with the coverage of the liquid slag (Figure 12A), whereas it disappeared with the coverage of foaming slag (Figure 12B) under the same top-blown gas jet conditions (L = 160.0 mm and Q = 40.5 Nm3·h−1). The SF in the furnace mouth with the coverage of the no-slag, the liquid slag, and the foaming slag were measured, as shown in Figure 13. Compared with the liquid slag, the effect of the foaming slag on the SF of furnace mouth is more significant. The foaming slag layer consumed a part of the top-blown gas jet energy and absorbed some splashing droplets, resulting in a decrease in the SF. Hence, the proper foaming slag can suppress the splashing during the smelting process.

4. Conclusions

Following the geometric similarity and the dynamic similarity, in this paper a physical model is developed with the prototype of a 200 t converter in China. The impact cavity morphology triggered by the top-blown gas jet of the oxygen lance was captured. The impact cavity shape gradually changed following the sequence of “disc” → “bowl” → “cone” with the increase in the gas flow, leading to the variation of the splashing modes. Moreover, the splashing inside and outside the converter was characterized quantitatively under the different top-blown gas jet conditions. It was found that the splashing on the furnace inner wall concentrated at the region adjacent to the molten bath surface, implying severe flushing of the furnace lining of this region. The critical gas flow of splashing outside the converter was 32.3 Nm3·h−1, corresponding to a gas flow of 39,000 Nm3·h−1 in the prototype. The statistics of the SF provide a reference for raising personal safety and protecting the converter equipment. On the one hand, the SF outside the furnace mouth has an exponential relationship with the radial distance, which could be referred to set up a safe distance standard for the workers. On the other hand, the SF near the center axis and the edge of the furnace mouth are higher than other regions, tending to damage the oxygen lance and the gas hood. In addition, the foaming slag can suppress the splashing during the smelting process.

Author Contributions

B.Z. and C.L. conceived and designed the experiments; K.C. and R.W. performed the experiments; K.C. analyzed the data; M.J. contributed reagents/materials/analysis tools; B.Z., K.C., and R.W. wrote the paper.

Funding

This research was funded by the National Key R & D Program of China, grant number 2017YFC0805100, and the National Natural Science Foundation of China, grant number 51774087.

Conflicts of Interest

The authors declare no conflict of interest.

References

  1. Zhang, J.G.; Yang, X.J.; Zhang, D.Y.; Zhao, Y.G.; Peng, S.Y. 150 t converter steelmaking process parameter optimization research and application. China Metall. 2013, 23, 37–40. [Google Scholar]
  2. Li, Z.Z.; Zhu, R.; Zhu, Y.Q. Effect of CO2 on material and energy in dephosphorization converters. Chin. J. Eng. 2016, 38, 232–237. [Google Scholar]
  3. Brooks, G.; Pan, Y.; Subagyo; Coley, K. Modeling of trajectory and residence time of metal droplets in slag-metal-gas emulsions in oxygen steelmaking. Metall. Mater. Trans. B 2005, 36, 525–535. [Google Scholar] [CrossRef]
  4. Luomala, M.J.; Virtanen, E.O.; Mure, P.T.; Siivola, T.P.; Fabritius, T.M.; Härkki, J.J. A novel approach in the estimation of splashing in the BOF. Steel Res. 2002, 73, 9–14. [Google Scholar] [CrossRef]
  5. Lee, M.S.; O’rourke, S.L.; Molloy, N.A. Oscillatory flow in the steelmaking vessel. Scand. J Metall. 2003, 32, 281–288. [Google Scholar] [CrossRef]
  6. Han, S.J.; Li, C.L.; Ma, H.T. Splash prediction based on BT-SVM for argon-oxygen decarburization refining Cr-Fe alloy process. J. Iron Steel Res. 2011, 23, 59–62. [Google Scholar]
  7. Sabah, S.; Brooks, G. Splash distribution in oxygen steelmaking. Metall. Mater. Trans. B 2015, 46, 863–872. [Google Scholar] [CrossRef]
  8. Flinn, R.A.; Pehlke, R.D.; Glass, D.R.; Hays, P.O. Jet penetration and bath circulation in the basic oxygen furnace. AIME Met. Soc. Trans. 1967, 239, 1776–1791. [Google Scholar]
  9. Meidani, A.R.N.; Isac, M.; Richardson, A.; Cameron, A.; RIL, G. Modelling shrouded supersonic jet in metallurgical reactor vessels. ISIJ Int. 2004, 44, 1639–1645. [Google Scholar] [CrossRef]
  10. McGee, P.; Iron, G.A. The pentration of oxygen lance jet in foaming slags. Iron Steelmak. 2002, 29, 59–68. [Google Scholar]
  11. Molloy, N.A. Impining jet flow in a two-phase system: the basic flow pattern. J. Iron Steel Inst. 1970, 216, 943–950. [Google Scholar]
  12. Subagyo; Brooks, G.A.; Coley, K.S.; Irons, G.A. Generation of droplets in slag-metal emulsions through top gas blowing. ISIJ Int. 2003, 43, 983–989. [Google Scholar] [CrossRef]
  13. Alam, M.; Naser, J.; Brooks, G. Computational fluid dynamics simulation of supersonic oxygen jet behavior at steelmaking temperature. Metall. Mater. Trans. B 2010, 41, 636–645. [Google Scholar] [CrossRef]
  14. Li, M.M.; Li, Q.; Kuang, S.B.; Zou, Z.S. Determination of Cavity Dimensions Induced by Impingement of Gas Jet onto a Liquid Bath. Metall. Mater. Trans. B 2016, 47, 116–126. [Google Scholar] [CrossRef]
  15. Koch, K.; Falkus, J.; Bruckhaus, R. Hot Model Experiments of the Metal Bath Spraying Effect During The Decarburization of Fe-C Melts through Oxygen Top Blowing. Steel Res. 1993, 64, 15–21. [Google Scholar] [CrossRef]
Figure 1. Schematic diagram of the experimental equipment (1—air compressor; 2—gas tank; 3—pressure stable valve; 4—flow meter; 5—oxygen lance; 6—nozzles of lance; 7—sampling tube; 8—camera).
Metals 09 00409 g001
Figure 2. Arrangement mode and symmetric relation of the sampling positions. (A). position of the sampling hole and the oxygen lance nozzle; (B). schematic diagram of the calculation method with the symmetry.
Metals 09 00409 g002
Figure 3. Measurement area division of the splashing experiment.
Metals 09 00409 g003
Figure 4. Impact cavity morphology and splashing mode. (A). disc shape cavity; (B). bowl shape cavity; (C). cone shape cavity; (D). “dimpling” mode; (E). “splashing” mode; (F). “penetrating” mode.
Metals 09 00409 g004
Figure 5. SF on the furnace inner wall at the height of 192.0 mm above bath surface (L = 160.0 mm, Q = 36.4 Nm3·h−1). “” experimental data, and “■”data obtained by symmetry analysis.
Metals 09 00409 g005
Figure 6. SF on the furnace inner wall at the height of 192.0 mm (A), 288.0 mm (B), 384.0 mm (C), 480.0 mm (D), and 606.0 mm (E) above bath surface (Q = 36.4 Nm3·h−1).
Metals 09 00409 g006
Figure 7. SF inside the furnace mouth under the different top-blown gas jet conditions.
Metals 09 00409 g007
Figure 8. SF at the different ring areas inside the furnace mouth (Q = 36.4 Nm3·h−1).
Metals 09 00409 g008
Figure 9. Effect of the radial distance on SF outside the furnace mouth.
Metals 09 00409 g009
Figure 10. Splashing distribution above the furnace mouth.
Metals 09 00409 g010
Figure 11. Schematic diagram of the slag foaming simulation.
Metals 09 00409 g011
Figure 12. Cavity shape with the coverage of liquid slag and foaming slag. (A). liquid slag; (B). foaming slag.
Metals 09 00409 g012
Figure 13. Effect of the slag on the SF in the furnace mouth.
Metals 09 00409 g013
Table 1. Physical properties of the experimental materials and prototype materials.
MaterialsTemperature T, °CDensity
ρ, g·cm−3
Dynamic Viscosity
μ, mPa·s
Surface Tension
σ, N·m−1
Water200.9981.0273 × 10−6
Liquid steel16007.086.41600 × 10−6
Heat transfer oil200.851250.035
Liquid slag13502.8–3.250–4000.2–0.6
Table 2. Parameters of prototype versus model.
ParametersPrototypeModel
Diameter of furnace shaft (DS), m60.5
Diameter of furnace mouth (DM), m3.60.3
Furnace height (H), m9.7680.814
Number of nozzles (N)55
Diameter of nozzle exit (DE), mm584.8
Diameter of nozzle throat (DT), mm433.6
Nozzle angle (θ), °1515
Bath depth (h), m1.680.14
Oxygen lance height (L), mm1440–2880120.0–240.0
Gas flow (Q), Nm3·h−124,000–49,00019.9–40.5
* Oxygen lance height is the distance between the bath surface and the oxygen lance tip.
Table 3. Impact cavity shapes under the different top-blown gas jet conditions.
Oxygen Lance Height, mmGas Flow, Nm3·h−1
19.924.028.132.336.440.5
120.0DiscDiscDiscBowlBowlCone
160.0DiscDiscDiscBowlBowlCone
200.0DiscDiscDiscBowlBowlCone
240.0DiscDiscDiscBowlBowlBowl

