Abstract
In this work, the corrosion behavior of an AA6012 aluminum alloy, submitted to a T6 strengthening treatment (solubilization and aging), and later to a severe plastic deformation, through equal channel angular pressing (ECAP) was studied. Some of these samples were submitted to a cryogenic treatment before the ECAP process. The analysis of corrosion behavior of the AA6012 samples was carried out at room temperature by means of electrochemical characterization in 0.1 M Cl− deaerated and aerated solution at pH 2. For this purpose, Tafel plots and electrochemical impedance spectroscopy tests were performed. The evolution of the microstructure was studied by means of SEM and TEM observations. The experimental results show that the cryogenic treatment does not influence the corrosion behavior of the studied alloy submitted to T6 treatment. Moreover, it was found that the ECAP technique does not induce a marked deterioration of the analyzed samples in terms of corrosion resistance.
1. Introduction
Aluminum alloys of 6XXX series are mainly employed in structural applications for their light-weight, good mechanical properties, better weldability, higher corrosion resistance, and lower price. Among these aluminum alloys, the AA6012 is used for its good formability and machinability as well as weldability and corrosion resistance. In particular, the addition of lead increases the alloy machinability and allows its use for many applications.
To improve mechanical properties, maintaining a suitable level of ductility, ultra-fine grained (UFG) metallic materials, including 6XXX Al alloys, have been considered and greatly studied. Severe plastic deformation (SPD) techniques are applied to obtain UFG metallic materials and among them the equal channel angular pressing (ECAP) is used. It does not induce any cross sectional change and maintains a uniform microstructure of the whole processed alloy [1,2]. For this reason, a large number of research studies on the mechanical properties and the microstructure evolution of the metals processed by this technique has been recently produced [3,4,5,6]. In particular, the UFG AA6012, obtained by ECAP, showed an improvement of its mechanical properties even after a single pass [7].
On the contrary, corrosion behavior of aluminum alloys, processed by ECAP, are still under study. They are susceptible to all corrosion forms, but pitting is the most important one. Generally, pitting occurs when the passive film around second phase particles, scratches, mechanical defects, or stochastic local discontinuities is broken down [8,9,10,11]. These different characteristics of the alloy surface depend on heat treatment conditions and from the elements present in the alloy [12,13]. In addition to grain refinement produced by SPD, ECAP specifically determines other metallurgical and structural changes: phase transformations, distribution of impurities, solute elements segregation, modification of the precipitate morphology, dislocation density, surface texture, etc. [14]. Therefore, ECAP could play a crucial role in modifying the corrosion behavior of aluminum alloys processed by this technique.
Ralston et al. [15] reviewed the literature about corrosion of materials subjected to SPD, asserting that some investigations suggest a decrease of corrosion resistance for UFG aluminum alloys, particularly if processed by ECAP. This is related to the reduction of size of secondary-phases or intermetallic particles, which could operate as local cathodes and/or sites for the initiation of localized attack [16,17,18]. Although the majority of the papers report beneficial effects of SPD on UFG materials, Miyamoto [14] summarized that for aluminum alloys, contradictory results have been obtained by different authors on similar materials and similar environments. However, the morphology of nobler precipitates (size and distribution) influences the micro-scale electrochemical polarization and consequently the corrosion behavior of aluminum alloys [19,20].
Therefore, the contemporary improvement of mechanical and corrosion properties of aluminum alloys can be considered a challenging task. Previously, a beneficial effect of cryogenic treatment on the reduction of the formation of secondary β-phase (Mg2Si), promoted by ECAP processing, was found [7,21].
In this work, the corrosion performances of AA6012 aluminum alloy was studied after processing it by the following treatments, performed by different sequences: grain refinement, produced by ECAP; traditional T6 strengthening; cryogenic dipping in liquid nitrogen. The electrochemical characterization of the different treated alloy samples was carried out by means of the Tafel plots and electrochemical impedance spectroscopy (EIS) in 0.1 M Cl− deaerated and aerated solutions at pH 2. The microstructure modifications were studied by scanning electron microscopy (SEM) and transmission electron microscopy (TEM).
2. Materials and Methods
The aluminum alloy studied in the present work was AA6012, in the form of cylindrical bars, with a diameter of 10 mm, whose chemical composition is (wt%): 0.8 Si, 0.5 Mn, 1.0 Mg, 0.8 Pb, 1.0max (Fe + Cu + Cr + Zn + Ti).
Different samples of the bars were submitted to ECAP, heat treatment, and cryogenic dipping in order to evaluate the combined effects of these processes on the corrosion behavior of the alloy.
The ECAP die was made up of a SK3 tool steel block containing an L-shaped channel, which was obtained by two linear channels intersecting at an angle of 90°. The diameter of the circular cross-section of the L-shaped channel was 10 mm. The ECAP processing (E) consisted of pressing, for only one pass into the die, 100 mm long samples by means of 40–80 kN force with a speed of 100 mm/min. The cryogenic processing (C) of the sample bars was performed by dipping them into liquid nitrogen for at least 2 h immediately before the introduction into the ECAP die. The two heat treatments applied to the samples were: solubilization (S) at 475 °C for 2 h; aging (A) at 185 °C for 16 h; and quenching in water (T6 strengthening treatment). The sequence of the treatments applied to the different examined samples is reported in Table 1, where the numbers give the order from which arises the label in the first column. In this way, the influence of the different treatments on the AA6012 alloy was studied.

Table 1.
Sequence of the treatments applied to the AA6012 alloy samples.
The electrochemical characterization of AA6012 alloy, subjected to the different treatments reported in Table 1, was performed on the cross-sections of rod samples (Φ 1.00–1.14 cm; height 1 cm). The samples were embedded in an epoxy resin, mechanically grounded by emery papers up to 4000 grit, and polished with alumina (1 μm). Subsequently, the samples were ultrasonically cleaned in ethanol for 10 min, rinsed in demineralized water, and dried in a stream of warm air. After the obtainment of a suitable electric contact, they were the working electrodes (exposed surface 0.50–0.70 cm2) of a three-electrode cell; a saturated calomel electrode (SCE, +0.241 V vs SHE at 25 °C), as reference, and a platinum spiral wire, as counter, were used. All the electrochemical analyses were carried out by means of a Gamry Reference 600 potentiostat (Gamry instruments, Warminster, PA, USA).
Just after sample immersion in the testing solution with a concentration of 0.1 M Cl− (0.09 M NaCl + 0.01 M HCl) at pH 2, the measurements were carried out at room temperature after achieving a stationary value of the corrosion potential Ecorr, for at least 30 min. Subsequently, the corrosion behavior was studied by means of Tafel plots recorded in deaerated and aerated solutions. In the case of deaerated conditions, the N2 bubbling and solution stirring was maintained for at least an hour. After this period, the stirrer was stopped, and electrochemical tests were performed. The Tafel plots were obtained by potentiodynamic scans at a scan rate of 0.166 mV/s from Ecorr − 150 mV to Ecorr + 150 mV. All curves were compensated from ohmic drop between the working and reference electrodes. The results were analyzed by the fitting method described in [22], and the kinetic parameters and the corrosion current density were obtained.
In the aerated testing solution, EIS measurements were also performed at different time of exposure: 0, 3, 6, and 24 h. The applied AC signal was 10 mV rms, in the frequency range of 100 kHz–10 mHz, swept by setting 5 points/decade. EIS data were fitted by Gamry Echem Analyst software.
All electrochemical tests were repeated three times.
To determine the influence of intermetallics on the corrosion resistance of the AA6012 alloy, SEM and energy dispersive X-ray analysis (EDX) were carried out (before and after corrosion tests). These investigations were performed by means of a Zeiss Supra 40 microscope (Carl Zeiss Microscopy GmbH, Jena, Germany) coupled with a Bruker Quantax series 5000L N2-free XFlash (Bruker Nano GmbH, Berlin, Germany). TEM observations were carried out on some samples before corrosion tests, using a Philips CM-20 (Eindhoven, The Netherlands) equipped with a double tilt specimen holder, and operated at 200 kV. TEM discs were prepared with conventional dimpling and Precision Ion Polishing System (PIPS) techniques.
3. Results and Discussion
Figure 1 displays the Tafel plots obtained by testing the studied samples in the deaerated solution, whereas Table 2 reports the average kinetic parameters obtained from the fitting of all curves recorded for all samples of each series. On considering the anodic branches, Figure 1 shows an almost active corrosion in all cases, even if a slight inflection toward positive potentials was particularly visible for the non-ECAPed samples. During the potential scan, this anodic characteristic indicates that these samples had a minor tendency to be oxidized compared to the ECAPed ones. A confirmation of this observation was given by the higher values of ba for the non-ECAPed samples with respect to those corresponding to the ECAPed samples (Table 2). However, the values of current densities related to the inflection point could not be attributed to a tendency to passivation of the alloy, because they were higher with respect to those of passive metallic materials (around 10−7–10−5 A/cm2). Concerning the cathodic branches, they were almost overlapped and could be attributed to the hydrogen reduction: in fact, the bc values of Table 2 were close to the theoretical value of this process (−0.120 V/decade).
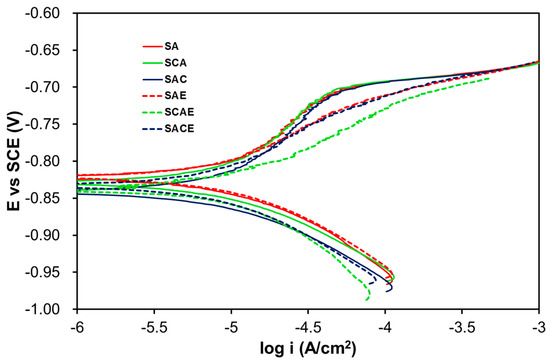
Figure 1.
Tafel plots of the studied samples in the deaerated solution.
Table 2.
Average kinetic values of the different AA6012 samples obtained from Tafel plots in deaerated solution.
The fitting of Tafel plots supplied also the corrosion current density icorr (not reported in Table 2), while the polarization resistance Rp was calculated by using the Stern–Geary equation: Rp = B/icorr. icorr and Rp of the different samples are reported in Figure 2, which shows that the corrosion behavior seemed more or less the same, taking into account the error bars. Therefore, corrosion resistance was scarcely dependent from the sequence of treatments undergone by AA6012 alloy. It was possible to observe only a slight lower corrosion resistance of the samples processed by ECAP with respect to the other ones: Rp for ECAPed samples (SCAE, SACE, SAE) was around an average value of 2550 Ω·cm2 (icorr around 13 µA·cm−2) and Rp for the non-ECAPed samples (SA, SCA, SAC) was around an average value of 3180 Ω·cm2 (icorr around 11 µA·cm−2).
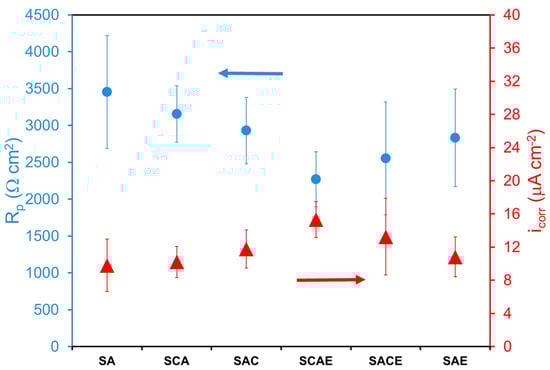
Figure 2.
Polarization resistance (Rp) and corrosion current density (icorr) of different AA6012 samples in deaerated solution.
Considering in particular the role of cryogenic treatment, the results of the present work did not agree with previous findings [7,21], where the AA6012 alloy was not submitted to the artificial aging (A). With more details, previous studies showed that the cryogenic treatment, applied before ECAP, reduced its negative effect on the corrosion resistance of AA6012 alloy, while, in the present case, it was not more effective, as could be observed by comparing the corrosion resistance of SACE and SAE samples (Figure 2). The beneficial effect of cryogenic treatment was previously attributed to the reduction of the formation of secondary β-phases (Mg2Si), promoted by ECAP processing [3]. These phases affected negatively the corrosion behavior of AA6012 alloy because they were more anodic with respect to the Al-matrix [23,24]. The fact that the effect of cryogenic treatment was not observed in this work could be attributed to the artificial aging, which is the process that, together with solubilization, was always applied to all samples (Table 1). Therefore, taking into account the well-known precipitation hardening determined by this process, it was possible to promote the precipitation of the secondary phases and thus to reduce the difference in the corrosion behavior among all the examined samples, independently from the effect of cryogenic process on the formation of these phases. On the other hand, only ECAP slightly lowered the corrosion resistance of the tested samples, as observed above, because it promoted the further precipitation of secondary phases.
In the case of the aerated solution, the Tafel plots (Figure 3) were considerably overlapped, and a significant difference on the corrosion behavior among the examined samples could not be observed. Table 3 and Figure 4 give a confirmation of these results. With more details, Table 3 reports the average of kinetic parameters for the different samples, obtained from the fitting of Tafel plots. Considering the anodic branches and the relative ba values, all samples showed an almost active behavior, and the values of bc (Table 3), even in this case, indicated that the main cathodic reaction, participating in the corrosion process, was the hydrogen reduction. From the icorr values (not reported in Table 3), Rp was calculated as explained above. Both icorr and Rp are displayed in Figure 4. In the aerated solution, Rp values of the different samples showed a higher variability compared to that of the samples examined in deaerated solution (Figure 2). Therefore, it was pretty difficult to find a clear role played by the different treatments. Finally, considering the error bars and the low variability of icorr, even in this case a significant difference in the corrosion performances among the tested samples of AA6012 alloy could not be observed.
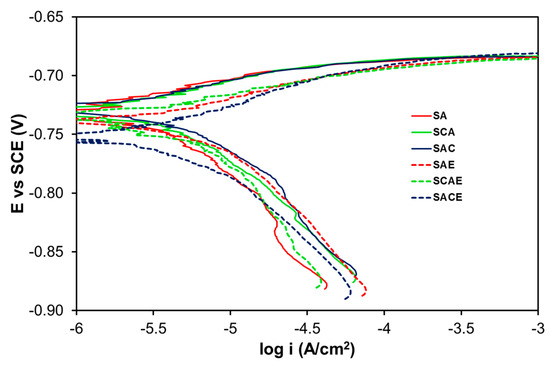
Figure 3.
Tafel plots of the studied samples in the aerated solution.
Table 3.
Average kinetic values of the different AA6012 samples obtained from Tafel plots in aerated solution.
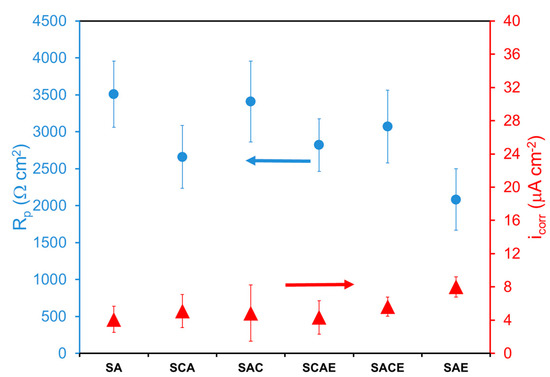
Figure 4.
Polarization resistance (Rp) and corrosion current density (icorr) of different AA6012 samples in aerated solution.
In order to study possible differences of corrosion resistance among the different samples of AA6012 alloy (Table 1), further electrochemical tests were carried out by means of EIS technique. The samples were submitted to a short-term exposure in the aerated testing solution by performing EIS measurements at 0, 3, 6, and 24 h.
Figure 5 shows six Nyquist plots obtained by EIS tests performed on representative samples of each series (Table 1), after 6 h of exposure. All plots showed two time constants: one at high frequencies, associated with a well-defined loop, which can be attributed to the parallel combination of a charge transfer resistance (Rt) and a double layer constant phase element (Qdl); and another at low frequencies, associated with a quite scattered and not always well-defined inductive loop. In the literature, the presence of an inductive loop in the impedance plot is generally attributed to the non-stationary contribution of adsorbed species on the metal corroding surface, participating in the whole faradaic process [25,26,27,28].
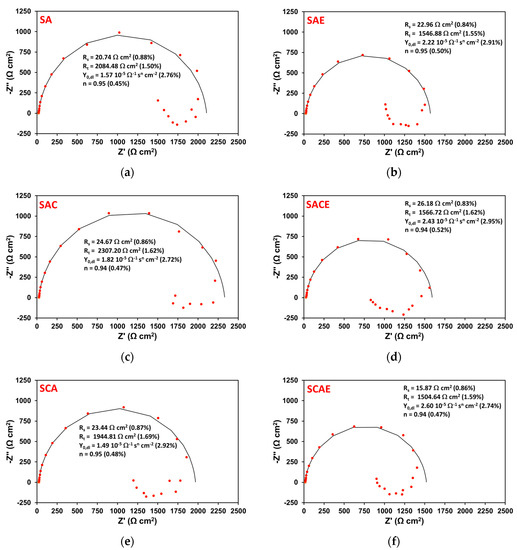
Figure 5.
Nyquist plots obtained on a representative sample of the different series (Table 1) after 6 h of exposure in aerated solution: SA (a); SAE (b); SAC (c); SACE (d); SCA (e); SCAE (f). The red symbols represent the experimental data, while the solid black curves correspond to the results of the fitting explained in the text. On each plot, the fitting parameters are reported together with the relative values and percentage errors, put in brackets.
The appropriate circuit to fit the experimental data shown in Figure 5 was reported in a previous work [25]: it consisted of a parallel connection between a typical Randles circuit (Figure 6) and a branch with a resistance in series with an inductance, both useful to fit the inductive loop. In this case, considering that there was a poor difference among the corrosion behavior of the different examined samples in aerated solution (Figure 4) and a significant scattering of data at low frequency (Figure 5), in correspondence to the inductive loop, the risk was the impossibility of obtaining feasible parameters related to this loop and scarce additional information on the system under study. Therefore, the EIS data analysis was simplified using the simple Randles circuit shown in Figure 6, considering and then selecting only the impedance data corresponding to the high frequency loop (Rt–Qdl). This choice, reported also in [29], gave the essential information for this study, which was the charge transfer resistance Rt. Rt was the corrosion parameter used in the Stern–Geary type relationship in place of polarization resistance (Rp) to obtain the corrosion current icorr of the examined samples (icorr = B/Rt), as reported in the literature [25,30,31,32]. In Figure 6, the other circuit elements shown were: Rs, the solution resistance between working electrode and reference electrode; and Qdl, the constant phase element associated with the double layer capacitance present in the interface between the sample and the testing solution.
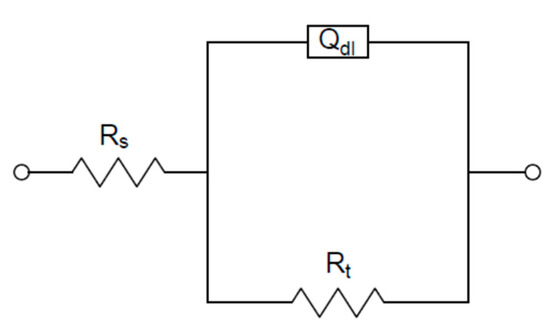
Figure 6.
Equivalent circuit used for fitting electrochemical impedance spectroscopy (EIS) experimental data.
From this approach, the black curves shown in Figure 5 corresponded to the results of the fitting of the high-frequency loop. Each plot reports the circuit parameters values shown in Figure 6 and the relative percentage errors supplied by the analysis performed by Echem Analyst software. The errors were very low and were never higher than 3%.
From an in-depth observation of Figure 5, it is clear that the corrosion resistance (Rt) was higher for non-ECAPed (left column of plots) samples with respect to the ECAPed ones (right column of plots).
Figure 7 and Figure 8 show Rt and icorr trends, respectively, as a function of exposure time. In general, it was possible to observe a reduction of Rt and correspondingly an increase of icorr as a function of exposure time. More specifically, the considerations suggested by Figure 5 were confirmed by comparing the trends of the different samples: starting from 6 h of exposure, a relatively significant lower corrosion resistance of ECAPed samples (dotted lines: SAE, SCAE, SACE) with respect to non-ECAPed ones (solid lines: SA, SCA, SAC) could be observed.
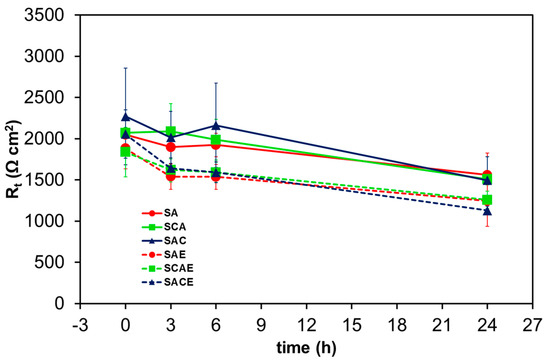
Figure 7.
Average charge transfer resistance (Rt) of the different AA6012 samples in aerated solution as a function of exposure time.
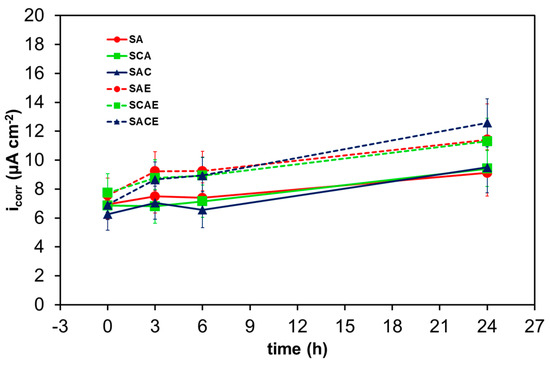
Figure 8.
Average corrosion current density (icorr) of the different AA6012 samples in aerated solution as a function of exposure time.
The trend of Qdl can be examined as a function of time considering that its admittance was Ydl = Y0,dl(jω)n, where Y0,dl and n are the characteristic parameters of the constant phase element, j is the imaginary unit, and ω the angular frequency of the AC signal used for EIS measurements [25]. Together with Rs and Rt, Y0,dl and n are reported on each plot of Figure 5. The capacitance Cdl, associated with Qdl, can be calculated by Cdl = Y0,dl(ωmax)n−1 [33], where ωmax is the angular frequency corresponding to the maximum absolute value of the imaginary part of impedance represented in Nyquist plots, like those shown in Figure 5 (in correspondence of the top of each semicircle). Figure 9 shows the average values of Cdl vs time for all types of samples. A general increase of this parameter indicated the progress of the corrosion of all samples of AA6012, because, during this process, the roughness of their real surface and consequently the value of Cdl increased. In particular, Figure 9 clearly shows that the ECAPed samples assumed higher values of Cdl with respect to non-ECAPed ones during the short-term exposure, indicating that ECAP made the AA6012 alloy more susceptible to corrosion. This represented a further confirmation of the previous results obtained by analyzing the other electrochemical parameters.
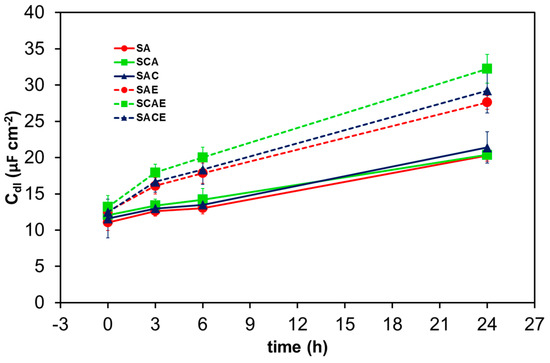
Figure 9.
Average double layer capacitance (Cdl) of the different AA6012 samples in aerated solution as a function of exposure time.
All these considerations suggest that the microstructure of the examined samples was not particularly different and that only the ECAP slightly influenced their corrosion behavior.
In order to understand the corrosion behavior observed by electrochemical tests, an analysis of the sample microstructures was carried out by SEM–EDX and TEM.
Figure 10 shows two SEM micrographs of a SAE sample surface before the beginning of EIS tests and after 6 h of immersion in the aerated solution. Three different types of particles could be observed before EIS measurements (Figure 10a), having the composition reported in Table 4: a large rounded particle (#1) enriched in lead, a small rounded particle (#2) with the presence of magnesium and silicon, and an irregular particle (#3) enriched in iron, silicon, and manganese. From these results, the first type of particle was due to the lead present in the alloy and not solutioned in the Al-matrix, and the second type could be the Mg–Si secondary β-phase (Mg2Si), as reported in the literature [23,34,35,36,37]. The third type of particle (iron-rich phase) was the most documented inclusions present on 6XXX aluminum alloys [38,39]. In addition, on this surface there were some cavities, probably due to the physical removal of the observed particles during the sample grinding and polishing.
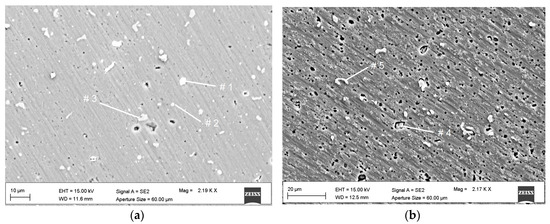
Figure 10.
SEM micrographs of an SAE sample surface, before EIS corrosion test (a) and after 6 h of immersion in the aerated testing solution (b).
Table 4.
Chemical composition (wt%) obtained from energy dispersive X-ray (EDX) analysis of the particles indicated in Figure 10.
The second micrograph (Figure 10b), relative to the SAE sample corroded surface, showed a diffuse localized attack, becoming a uniform active corrosion. The numerous cavities presented an irregular shape, the same as the iron-rich intermetallics (#3, #5), suggesting that the corrosion process initiated and proceeded in the Al-matrix around these particles until their detachment occurred. Furthermore, Figure 10b clearly shows a corrosive attack around the lead-rich particle #4 (Table 4). The increase in porosity, clearly visible by comparing Figure 10a,b, could explain the reduction of Rt and the corresponding increase in icorr as a function of the exposure time (Figure 7 and Figure 8).
The observed corrosion behavior could be explained considering that the iron-containing intermetallics and the lead particles were nobler than the alloy matrix and, therefore, they were cathodic with respect to the surrounding and corroding matrix [23,24]. Furthermore, the secondary β-phase contributed to the corrosion of aluminum alloy, but with a different mechanism: it corroded leaving a pit, because this phase was less noble than the surrounding alloy matrix [23,40]. Unfortunately, considering that the dimension of this phase was significantly smaller than the other intermetallic particles, the effect of its corrosion could not be observed clearly by SEM.
The observations made so far could be extended to all studied samples in this work (Table 1) because their microstructure before and after the corrosion was almost the same. This explains the above mentioned low difference in the corrosion performances obtained after the electrochemical tests.
On the other hand, the slight minor corrosion resistance of ECAPed samples compared to that of the not ECAPed ones, found during the short-term exposure tests (Figure 7 and Figure 8), could be attributed to the different amounts of the small Mg2Si secondary phase, evenly distributed in the Al-matrix. Severe plastic deformation like ECAP process enhanced the precipitation of these phase [14,41,42].
TEM analysis were performed only on samples not submitted to cryogenic treatment, considering that the results of corrosion tests showed a poor influence of this process. Therefore, examining the alloy in T6 (SA) and T6 + ECAP (SAE) conditions, a significant distribution difference of the nanometric size Mg2Si and Si secondary phase particles was found, as Figure 11 shows.
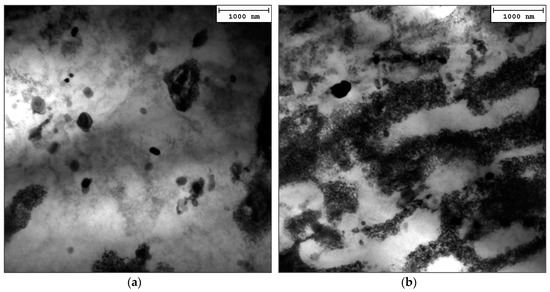
Figure 11.
TEM micrographs of SA (a) and SAE (b) samples.
The direct comparison between SA (Figure 11a) and SAE (Figure 11b) samples showed that ECAP greatly promoted a further precipitation of secondary phase particles with respect to the already existing particles after T6 (SA). This was chiefly due to the local adiabatic heating, the shearing deformation that continuously introduced tangle dislocations within the grained structure, and to the plastic rearrangement of grain boundary network and refining grain interior [43,44]. Thence, it resulted in the SAE samples having a larger volume number fraction of both rod-like Mg2Si and rounded Si strengthening secondary phase particles. These were found to be alike in size and volume distribution between the SA and SAE samples. The formation of these nanometric secondary phases was found to have a detrimental effect on the corrosion response of the AA6012 alloy. This in turns determined a counteracting metallurgical effect of ECAP on such aluminum alloys. On the one hand, ECAP greatly improved the mechanical behavior of the AA6012, similar to 6XXX series alloys, through grain size refinement and secondary phase strengthening; on the other hand, ECAP seemed to reduce to some extent, if not jeopardize, the alloy corrosion response in the short-term exposure to aggressive environments.
4. Conclusions
Corrosion behavior of an AA6012 alloy, processed by ECAP and subjected to cryogenic and heat treatments (solubilization and artificial aging), applied by different sequences, was investigated.
The experimental results obtained from the fitting of Tafel plots showed that all the samples, to some extent, had a similar corrosion resistance, independently from the sequence of different treatments (ECAP, cryogenic treatment, solubilization and artificial aging). During the short-term exposure of the samples in the aerated chloride solution, from electrochemical impedance measurements arose a slight difference between ECAPed and non-ECAPed ones. With more details, the ECAPed samples had a slightly worse corrosion resistance when compared to the non-ECAPed ones, due to the large volume fraction of the anodic and nanometric Mg2Si and Si secondary phase particles present in the ECAPed samples, because their precipitation was greatly promoted by the ECAP process. The present results do not agree with those of previous works, where there was found a beneficial effect of cryogenic treatment performed before the ECAP process, determining a retardation of secondary phases precipitation and correspondingly an increase of corrosion resistance. The difference between the old and the new samples is that the first were not artificially aged while the second ones were. Therefore, it is concluded that artificial aging, performed on all the studied samples, is able to promote the precipitation of secondary phases and thus to reduce the difference in the corrosion resistances of the present studied samples. As a consequence, if AA6012 is submitted to artificial aging, it is not useful to submit this alloy to cryogenic treatment.
Author Contributions
T.B. and M.C. conceived and designed the experiments; A.V. and C.P. performed ECAP; A.V. prepared the samples for the tests and performed the electrochemical characterization experiments; G.R. performed SEM–EDX observations; M.C. performed TEM observations; T.B. and A.V. performed all the data elaborations; A.V., T.B., M.C., and G.R. wrote, revised, and edited the manuscript.
Funding
This research received no external funding.
Conflicts of Interest
The authors declare no conflict of interest.
References
- Langdon, T.G. Twenty-five years of ultrafine-grained materials: Achieving exceptional properties through grain refinement. Acta Mater. 2013, 61, 7035–7059. [Google Scholar] [CrossRef]
- Valiev, R.Z.; Langdon, T.G. Principles of equal-channel angular pressing as a processing tool for grain refinement. Prog. Mater. Sci. 2006, 51, 881–981. [Google Scholar] [CrossRef]
- Veveçka, A.; Cabibbo, M.; Langdon, T.G. A characterization of microstructure and microhardness on longitudinal planes of an Al–Mg–Si alloy processed by ECAP. Mater. Charact. 2013, 84, 126–133. [Google Scholar] [CrossRef]
- Furukawa, M.; Horita, Z.; Nemoto, M.; Langdon, T.G. Review: Processing of metals by equal-channel angular pressing. J. Mater. Sci. 2001, 36, 2835–2843. [Google Scholar] [CrossRef]
- Panigrahi, S.K.; Jayaganthan, R. Effect of ageing on microstructure and mechanical properties of bulk, cryorolled, and room temperature rolled Al 7075 alloy. J. Alloys Compd. 2011, 509, 9609–9616. [Google Scholar] [CrossRef]
- Prell, M.; Xu, C.; Langdon, T.G. The evolution of homogeneity on longitudinal sections during processing by ECAP. Mater. Sci. Eng. A 2008, 480, 449–455. [Google Scholar] [CrossRef]
- Cabibbo, M.; Santecchia, E.; Mengucci, P.; Bellezze, T.; Viceré, A. The role of cryogenic dipping prior to ECAP in the microstructure, secondary-phase precipitation, mechanical properties and corrosion resistance of AA6012 (Al-Mg-Si-Pb). Mater. Sci. Eng. A 2018. [Google Scholar] [CrossRef]
- Birbilis, N.; Muster, T.H.; Buchheit, R.G. Corrosion of Aluminum Alloys. In Corrosion Mechanism in Theory and Practice; Marcus, P., Ed.; CRC Press: New York, NY, USA, 2012; pp. 705–736. ISBN 9781420094626. [Google Scholar]
- Frankel, G.S. Pitting Corrosion of Metals. J. Electrochem. Soc. 1998, 145, 2186. [Google Scholar] [CrossRef]
- Chen, G.S.; Gao, M.; Wei, R.P. Microconstituent-Induced Pitting Corrosion in Aluminum Alloy 2024-T3. CORROSION 1996, 52, 8–15. [Google Scholar] [CrossRef]
- Ly, R.; Hartwig, K.T.; Castaneda, H. Effects of strain localization on the corrosion behavior of ultra-fine grained aluminum alloy AA6061. Corros. Sci. 2018, 139, 47–57. [Google Scholar] [CrossRef]
- Svenningsen, G.; Larsen, M.H.; Walmsley, J.C.; Nordlien, J.H.; Nisancioglu, K. Effect of artificial aging on intergranular corrosion of extruded AlMgSi alloy with small Cu content. Corros. Sci. 2006, 48, 1528–1543. [Google Scholar] [CrossRef]
- Svenningsen, G.; Larsen, M.H.; Nordlien, J.H.; Nisancioglu, K. Effect of thermomechanical history on intergranular corrosion of extruded AlMgSi(Cu) model alloy. Corros. Sci. 2006, 48, 3969–3987. [Google Scholar] [CrossRef]
- Miyamoto, H. Corrosion of Ultrafine Grained Materials by Severe Plastic Deformation, an Overview. Mater. Trans. 2016, 57, 559–572. [Google Scholar] [CrossRef]
- Ralston, K.D.; Birbilis, N. Effect of Grain Size on Corrosion: A Review. CORROSION 2010, 66, 075005-075005-13. [Google Scholar] [CrossRef]
- Chung, M.-K.; Choi, Y.-S.; Kim, J.-G.; Kim, Y.-M.; Lee, J.-C. Effect of the number of ECAP pass time on the electrochemical properties of 1050 Al alloys. Mater. Sci. Eng. A 2004, 366, 282–291. [Google Scholar] [CrossRef]
- Sikora, E.; Wei, X.J.; Shaw, B.A. Corrosion Behavior of Nanocrystalline Bulk Al-Mg-Based Alloys. CORROSION 2004, 60, 387–398. [Google Scholar] [CrossRef]
- Son, I.J.; Nakano, H.; Oue, S.; Kobayashi, S.; Fukushima, H.; Horita, Z. Pitting corrosion resistance of anodized aluminum-copper alloy processed by severe plastic deformation. Nippon Kinzoku Gakkaishi/J. Jpn. Inst. Met. 2008, 72, 353–359. [Google Scholar] [CrossRef]
- Hockauf, M.; Meyer, L.W.; Nickel, D.; Alisch, G.; Lampke, T.; Wielage, B.; Krüger, L. Mechanical properties and corrosion behavior of ultrafine-grained AA6082 produced by equal-channel angular pressing. J. Mater. Sci. 2008, 43, 7409–7417. [Google Scholar] [CrossRef]
- Son, I.-J.; Nakano, H.; Oue, S.; Kobayashi, S.; Fukushima, H.; Horita, Z. Pitting Corrosion Resistance of Anodized Aluminum Alloy Processed by Severe Plastic Deformation. Mater. Trans. 2007, 48, 21–28. [Google Scholar] [CrossRef]
- Viceré, A.; Cabibbo, M.; Paoletti, C.; Roventi, G.; Bellezze, T. Analisi del comportamento a corrosione di campioni di alluminio AA6012 sottoposti a ECAP e trattamento criogenico. La Metall. Ital. 2018, 2, 25–33. [Google Scholar]
- Bellezze, T.; Giuliani, G.; Roventi, G. Study of stainless steels corrosion in a strong acid mixture. Part 1: Cyclic potentiodynamic polarization curves examined by means of an analytical method. Corros. Sci. 2018, 130, 113–125. [Google Scholar] [CrossRef]
- Yasakau, K.A.; Zheludkevich, M.L.; Lamaka, S.V.; Ferreira, M.G.S. Role of intermetallic phases in localized corrosion of AA5083. Electrochim. Acta 2007, 52, 7651–7659. [Google Scholar] [CrossRef]
- Yasakau, K.A.; Zheludkevich, M.L.; Ferreira, M.G.S. Role of intermetallics in corrosion of aluminum alloys. Smart corrosion protection. Intermet. Matrix Compos. 2018, 425–462. [Google Scholar] [CrossRef]
- Bellezze, T.; Giuliani, G.; Viceré, A.; Roventi, G. Study of stainless steels corrosion in a strong acid mixture. Part 2: Anodic selective dissolution, weight loss and electrochemical impedance spectroscopy tests. Corros. Sci. 2018. [Google Scholar] [CrossRef]
- Orazem, M.; Tribollet, B. Electrochemical Impedance Spectroscopy; Wiley: Hoboken, NJ, USA, 2011. [Google Scholar]
- Bai, L.; Conway, B.E. AC Impedance of Faradaic Reactions Involving Electrosorbed Intermediates: Examination of Conditions Leading to Pseudoinductive Behavior Represented in Three-Dimensional Impedance Spectroscopy Diagrams. J. Electrochem. Soc. 1991, 138, 2897. [Google Scholar] [CrossRef]
- Cao, C. On the impedance plane displays for irreversible electrode reactions based on the stability conditions of the steady-state—I. One state variable besides electrode potential. Electrochim. Acta 1990, 35, 831–836. [Google Scholar] [CrossRef]
- Li, X.; Jiang, J.H.; Zhao, Y.H.; Ma, A.B.; Wen, D.J.; Zhu, Y.T. Effect of equal-channel angular pressing and aging on corrosion behavior of ZK60 Mg alloy. Trans. Nonferrous Met. Soc. China 2015, 25, 3909–3920. [Google Scholar] [CrossRef]
- Pardo, A.; Merino, M.C.; Carboneras, M.; Viejo, F.; Arrabal, R.; Muñoz, J. Influence of Cu and Sn content in the corrosion of AISI 304 and 316 stainless steels in H2SO4. Corros. Sci. 2006, 48, 1075–1092. [Google Scholar] [CrossRef]
- Pardo, A.; Merino, M.C.; Coy, A.E.; Viejo, F.; Arrabal, R.; Matykina, E. Effect of Mo and Mn additions on the corrosion behavior of AISI 304 and 316 stainless steels in H2SO4. Corros. Sci. 2008, 50, 780–794. [Google Scholar] [CrossRef]
- Epelboin, I.; Gabrielli, C.; Keddam, M.; Takenouti, H. Alternating-Current Impedance Measurements Applied to Corrosion Studies and Corrosion-Rate Determination. In Electrochemical Corrosion Testing; ASTM International: West Conshohocken, PA, USA; pp. 150–166.
- Hsu, C.H.; Mansfeld, F. Concerning the Conversion of the Constant Phase Element Parameter Y0 into a Capacitance. CORROSION 2001, 57, 747–748. [Google Scholar] [CrossRef]
- Czechowski, M. Low-cycle fatigue of friction stir welded Al–Mg alloys. J. Mater. Process. Technol. 2005, 164–165, 1001–1006. [Google Scholar] [CrossRef]
- Mizuno, K.; Nylund, A.; Olefjord, I. Surface reactions during pickling of an aluminium–magnesium–silicon alloy in phosphoric acid. Corros. Sci. 2001, 43, 381–396. [Google Scholar] [CrossRef]
- Leblanc, P.; Frankel, G.S. A Study of Corrosion and Pitting Initiation of AA2024-T3 Using Atomic Force Microscopy. J. Electrochem. Soc. 2002, 149, B239. [Google Scholar] [CrossRef]
- Perovic, A.; Perovic, D.; Weatherly, G.; Lloyd, D. Precipitation in aluminum alloys AA6111 and AA6016. Scr. Mater. 1999, 41, 703–708. [Google Scholar] [CrossRef]
- Qian, M.; Taylor, J.; Yao, J.; Couper, M.; StJohn, D. A practical method for identifying intermetallic phase particles in aluminium alloys by electron probe microanalysis. J. Light Met. 2001, 1, 187–193. [Google Scholar] [CrossRef]
- Cabibbo, M.; Evangelista, E.; Vedani, M. Influence of severe plastic deformations on secondary phase precipitation in a 6082 Al-Mg-Si alloy. Metall. Mater. Trans. A 2005, 36, 1353–1364. [Google Scholar] [CrossRef]
- Tan, L.; Allen, T.R. Effect of thermomechanical treatment on the corrosion of AA5083. Corros. Sci. 2010, 52, 548–554. [Google Scholar] [CrossRef]
- Zhang, W.; Wen, Y.-H.; Li, N.; Huang, S.-K. Remarkable improvement of recovery stress of Fe–Mn–Si shape memory alloy fabricated by equal channel angular pressing. Mater. Sci. Eng. A 2007, 454–455, 19–23. [Google Scholar] [CrossRef]
- Murayama, M.; Horita, Z.; Hono, K. Microstructure of two-phase Al–1.7 at% Cu alloy deformed by equal-channel angular pressing. Acta Mater. 2001, 49, 21–29. [Google Scholar] [CrossRef]
- Cabibbo, M. Microstructure strengthening mechanisms in different equal channel angular pressed aluminum alloys. Mater. Sci. Eng. A 2013, 560, 413–432. [Google Scholar] [CrossRef]
- Cabibbo, M. Microstructure strengthening mechanisms in an Al–Mg–Si–Sc–Zr equal channel angular pressed aluminium alloy. Appl. Surf. Sci. 2013, 281, 38–43. [Google Scholar] [CrossRef]


© 2019 by the authors. Licensee MDPI, Basel, Switzerland. This article is an open access article distributed under the terms and conditions of the Creative Commons Attribution (CC BY) license (http://creativecommons.org/licenses/by/4.0/).