Abstract
Laminated metals sheets have been used widely in various sectors including the optoelectronics, aerospace, ship, and automotive industries because of their desirable mechanical properties. Therefore, techniques for successful joining of such laminates are a focus of study. The objective of this study was to perform butt-welding of bi-layered aluminum laminated sheets using the friction stir welding (FSW) technique. The tensile properties, flexural properties, residual stress distribution, and fractured surfaces of the final weldments were analyzed. The effects of the process parameters on the mechanical properties of the weldments were also investigated. Mixing defects (voids and cracks) were observed in the stir zone (SZ) at the following combinations: low rotational speed (ω) and low tool traverse speeds (v) and also at high ω and high v, which substantially decreased the tensile and bending strength of the weldments as well as % elongation. Moreover, the sample welded at ω = 1500 rpm and v = 47.5 mm/min showed the best performance under mechanical loading: with a % elongation and tensile strength of 24.72% and 79.10 MPa, respectively. Similarly, the sample welded at ω = 750 rpm and v = 118 mm/min showed the highest flexural strength of 3.15 MPa. Finally, the suitable parameters are proposed for the joining of bi-layered aluminum laminated sheets.
1. Introduction
Important mechanical properties such as corrosion resistance, formability, and high strength to weight ratio possessed by aluminum (Al) alloys have made it increasingly popular in the aerospace and automotive industries. The use of aluminum sheets in the body panels of automobiles is an interesting application as it can significantly reduce vehicle’s weight. As a consequence, the automobile manufacturers are shifting from steels towards Al/Al-alloys for manufacturing lighter, safer, and more efficient automobiles [1,2]. The mechanical properties can further be improved by assembling materials in laminated form. The laminated material can be obtained by stacking thin sheets. In recent years, laminated sheets have attracted attention from various sectors including the optoelectronics, aerospace, ship, and automotive industries because they offer superior properties in comparison to monolithic sheets or base materials (BM) [3,4]. The aluminum laminated sheets exhibit better strength to weight ratio, fracture toughness, and high resistance to impact and fatigue loadings. The aluminum laminated sheets are extensively used in the modern aircraft manufacturing industries [5]. The use of aluminum laminates is limited by the difficulties of welding aluminum perfectly using traditional welding techniques. Thus, the need of an alternate, efficient, and economical joining technique for joining aluminum laminates becomes a matter of concern. Friction stir welding (FSW) is capable of joining materials like aluminum, magnesium, copper, and titanium alloys that are difficult to weld using conventional welding techniques [6,7,8,9].
FSW for joining of aluminum sheets was introduced by Wayne Thomas from the UK in 1991 [10]. FSW is a thermo-mechanical welding technique in which a non-consumable FSW tool harder than the BM is employed to perform joining. The shouldered pin FSW tool after attaining a desired rotating speed (ω) is inserted into the faying surface and is moved with constant traverse speed (v) along the weld line. The contact between the tool shoulder and BM generates friction heat that softens the BM. Consequently, mixing of the softened material of the two adjacent surfaces takes place around the tool pin to form a solid state joint. The process is relatively easy to perform with significant reduction in time and cost. The FSW process has become popular for producing quality joints of aluminum alloys because of its remarkable ability to produce defect free, fine, and high strength welds [11]. An FSW weld contains three distinct zones, namely: the stir zone (SZ) or nugget zone (NZ), thermo-mechanically affected zone (TMAZ), and heat-affected zone (HAZ) [12]. The SZ experiences severe plastic deformation and comparatively high heat input causing formation of fine and equiaxed grains. The TMAZ lies adjacent to the SZ and undergoes relatively less plastic deformation. The HAZ does not experience any plastic deformation and bears only thermal effects. Temperature rise and plastic deformation in FSW dictate the micro-structural changes. These micro-structural changes in turn control macro-structural properties such as tensile strength, % elongation, flexural strength, and residual stresses of the weldments. The final quality of the weldment is determined on the basis of mechanical properties and appearance of the weld.
Biallas et al. [13] investigated the effect of FSW process parameters on the tensile strength of FSW 2024Al-T4. According to their study, the tensile strength and ductility of the material increased with the increasing of the tool rotational speed (ω). Mishra et al. [14] and Strombeck et al. [15] both carried out similar studies to investigate yield strength, ultimate tensile strength (UTS), and % elongation at different locations of FSW weldments. It was concluded that proper material mixing and severe plastic deformation caused a significant improvement in ductility and tensile strength of the weldments. Bisadi et al. [16] studied the effect of FSW process parameters on the tensile properties in lap joints of 5083-Al. It was observed that changing the tool traverse speed at high tool rotation rates had an inverse effect on the properties of the joints.
It has been reported that the residual stresses produced due to localized heating and plastic deformation during FSW process significantly affect the post weld quality and mechanical properties of the joints. Peel et al. [17] studied the residual stress distribution during FSW of 5083-Al and stated that the residual stresses normal to the weld exhibited a maximum value at the center of the weld. Furthermore, they observed that with an increase in v, longitudinal (parallel to the weld) residual stresses increased while transverse (normal to the weld) residual stresses remained unchanged. Donne et al. [18] also investigated the distribution of residual stresses in FSW of 6013Al-T6 and 2024Al-T3 welds using several techniques. The longitudinal residual stresses were higher than transverse residual stresses in every case, independent of ω, v, and pin diameter. It was also noted that the HAZ contained the maximum tensile residual stresses. The tensile residual stresses decreased as the v and ω were decreased. James et al. [19] measured residual stresses in the joints of 7050Al-T7451, 2219-Al and C458 Al–Li alloy. It was observed that the stresses generated during FSW were relatively low compared to those produced in fusion welding. Generally, the residual stresses along the welding direction were tensile in nature while the residual stresses perpendicular to the welding direction were compressive.
According to the authors’ knowledge, the only research published on the butt joining of laminated sheets via FSW was carried out by Beygi et al. [20]. They performed butt joining of bilayer Al−Cu sheet through FSW. The main focus was the investigation of the flow pattern during FSW. The microstructure and hardness behavior of the weldments was also studied. However, the relationship between FSW process parameters, mechanical properties, and residual stress distribution was not explored.
In light of the above literature review, there is a need to perform an investigation to examine the suitability of the FSW process for joining multilayered sheet. Furthermore, the similarities and dissimilarities between FSW of multilayered and monolithic sheets need to be addressed. Therefore, the current research is carried out with an objective to investigate the above-mentioned areas. In this study, butt joints of bi-layered aluminum laminated sheets were obtained at various tool rotation and traveling speeds. The effects of FSW process parameters on the residual stress distribution and mechanical properties of the final weldments were investigated in detail. The fractography of the joints fractured under bending and tensile loadings was performed. Moreover, a comparative analysis regarding the effect of FSW process parameters on the mechanical properties of laminated and monolithic sheet joints was also carried out.
2. Materials and Methods
In the current study, bi-layered commercial aluminum laminated sheets of 90 mm × 55 mm × 4 mm dimensions were used as the BM. The chemical composition and mechanical properties of the as received BM are shown in Table 1; Table 2, respectively. A tapered pin FSW tool with a 16 mm shoulder diameter, 3 mm pin height, 5 mm initial pin diameter, and 3 mm pin tip diameter was used (Figure 1a). In order to maximize the material flow from the advancing side (AS) to the retreating side (RS), a constant tool tilt angle of 2° was maintained during all the experiments [21].

Table 1.
Chemical composition (weight %) of base material (BM).
Table 2.
Mechanical Properties of BM.
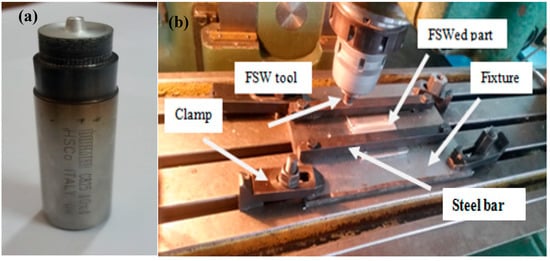
Figure 1.
(a) Friction stir welding (FSW) tool used in the current study and (b)Experimental setup for FSW process.
Initially the blanks of specified dimensions were cut and the edges of the blanks were grinded to minimize the gap between the adjacent surfaces. A specially designed fixture (Figure 1b) was used to hold the joining blanks firmly. A vertical milling machine was used to perform the FSW process.
For the experimental plan, nine different combinations of processing parameters were selected, as shown in Table 3. This experimental plan was followed to perform the FSW process for butt joining of bi-layered aluminum laminated sheets by varying tool rotation and tool traverse speeds.
Table 3.
Design of experiments.
Tensile tests were performed to determine the ultimate tensile strength and % elongation of the BM and welded specimens. A computer numerically controlled (CNC) electric discharge machine (Jilin Songjiang Technology & Trade Co. Ltd., Tianjin, China) was employed to extract sub size I-shape tensile test specimens of the BM and weldments (across the weld) as per ASTM (E 8M standard. The universal testing machine INSTRON 5567 (Instron Corp., Norwood, MA, USA) was used to perform tension test at a crosshead rate of 1 mm/min, until the fracture occurred.
Bending test samples of 18 mm × 100 mm × 4 mm were cut using CNC-EDM in accordance with ASTM E190-92 standard. The flexural behavior and ductility of the weldments were investigated by root bend test (i.e., bending force-application on the weld surface). The distance between the centers of two supporting rollers was 90 mm. A constant cross head speed of 1.5 mm/min was maintained during the bending test up to a maximum deflection of 5%. The residual stresses in the BM and in different zones of welded samples were determined using the hole drill method (ASTM E-837-13a). In this method, a tungsten carbide drill bit of 1.6 mm diameter was used for drilling a small hole through the thickness with a step size of 0.1 mm. The relieved strains of the strain gauge rosettes during drilling were measured with the help of a P3 strain indicator. The measured strains were then post-processed for determining the corresponding stresses using H-drill software. Finally, scanning electron microscopy (SEM) (TESCAN, Brno, Czech Republic) was performed to analyze the fractured surfaces of bending and tensile samples.
3. Results and Discussion
3.1. Microscopic Observations
Visual and microscopic observation of weldments is very important as it provides the basic information about the quality of the produced joints. Hence, all the welds were visually inspected at the first instance. The accumulation of defects resulted in the formation of voids (formation of gaps or unfilled indents where the material is not present) and cracks in various tests such as weldments in Tests 1, 4, 8, and 9, as shown in Figure 2a–e. Thorough analysis indicated that these defects have links with the selection of parameters. For instance, Test 1 was performed at low ω and high v, and the joint suffered from voids. In fact, this can be attributed to improper mixing due to: 1) low tool rotation rate (ω) that results in insufficient generation of heat required to soften the material; and 2) high tool traverse speed (v) that does not provide sufficient time for complete softening and effective mixing of the material [22]. The defects also appeared for higher v and higher ω (Figure 2c,d), which again can be attributed to inadequate mixing due to high v. This reveals that parameter v is more important than parameter ω. On the contrary, mixing defects were not observed in Test 7 because of proper mixing conditions i.e., high ω and low v. These results follow that proper selection of v and ω is manadatory to realize the successful joints.
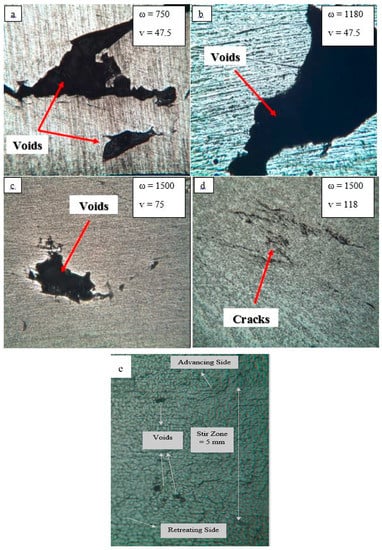
Figure 2.
Accumulation of defects in (a) Test 1 (b) Test 4 (c) Test 8 (d) Test 9 and (e) Stir zone and various sides of Test 4 with many voids.
3.2. Temperature Evolution
During the FSW process, continuous stirring generates heat due to friction between the FSW tool and workpiece. As a result, the heat generated during stirring causes softening and hence joining of the material, as discussed by Mishra et al. [4]. The amount and dissipation rate of the generated heat dictated the final quality of the weld. The temperature distribution across the weld region of Test 1 and Test 7 weldments was measured as shown in Figure 3. Test 1 and Test 7 weldments were produced at a v of 47.5 mm/min and ω of 750 rpm and v of 47.5 mm/min and ω of 1500 rpm, respectively. The material in Test 7 experienced the highest temperature of 266 °C in the stir zone (SZ) due to highest value of ω. While Test 1 weldment endured the lowest peak temperature of 163 °C in the SZ due to lowest value of ω.
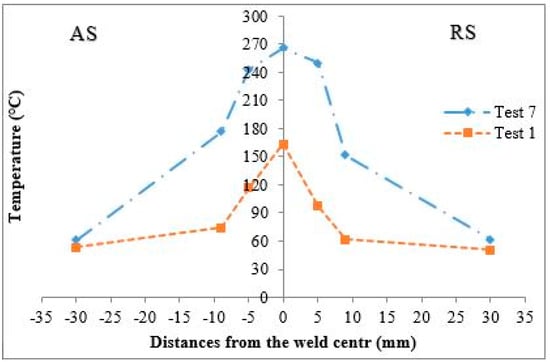
Figure 3.
Temperature distribution across the weld.
The highest temperatures in both the cases were found to be in the SZ, which gradually decreased along the width in both directions as shown in Figure 3. The temperature on the advancing side (AS) of the weld during FSW was found to be slightly higher than that of the retreating side (RS). The lower temperature on the RS might be due to lack of material on the RS, occurring as a result of the difference in material flow between the AS and RS.
3.3. Tensile Properties
The stress-strain curves obtained from the tensile-test of the BM and weldments are shown in Figure 4. All the weldments showed a lower ultimate tensile strength (UTS) and failure strain as compared to that of the BM. Furthermore, Test 1 and Test 4 weldments exhibited brittle fractures due to the presence of mixing defects as discussed in Section 3.1. On the other hand, the rest of the samples experienced a considerable plastic deformation, and necking behavior was observed prior to fracture. Only Test 5 is an exception among this group, which showed a failure strain of approximately 6%. Tensile samples of Test 7, 8, and 9 weldments showed high UTS, while the Test 1 sample exhibited the smallest UTS, as shown in Figure 4. Furthermore, the failure strain in Test 7 was highest among all the weldments. It might be due to the high input heat (high temperature generation) and better material mixing (high tool rotational speed and low tool traverse speed). Although the Test 8 and Test 9 samples showed the highest UTS but an increase in v at high ω (1500 rpm) in both the cases caused the inverse effect on the ductility. Therefore, this is a similar trend to that concluded by Bisadi et al. [16].
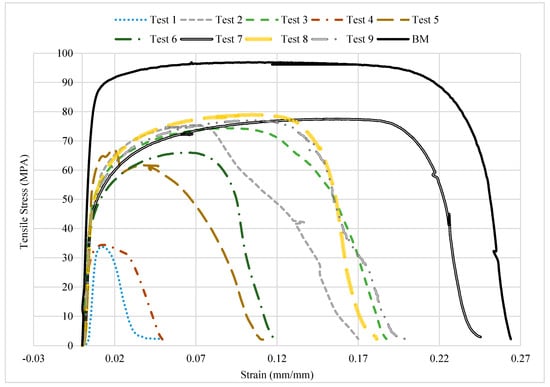
Figure 4.
Stress-strain curves of BM and FSW samples.
The lowest ω and v in the Test 1 sample seem responsible for the formation of voids due to insufficient heat input. The presence of voids in the SZ of Test 1 weldment caused a decrease in its UTS. As a result, the tensile sample of the Test 1 weldment fractured in the SZ as shown in Figure 5a. In contrast to Test 1, the higher heat input in the Test 7 weldment resulted in effective material mixing, and hence better weld strength. Thus, unlike Test 1, the fracture in the tensile sample of the Test 7 weldment occurred in the heat affected zone (HAZ) as shown in Figure 5b.
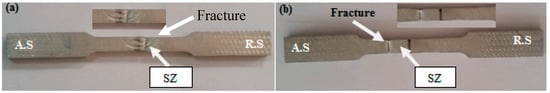
Figure 5.
Fractured tensile sample of (a) Test 1 and (b) Test 7. Note: A.S. and R.S. means advancing side and retreating side, respectively.
The UTS and % elongation of the BM and weldments are listed in Table 4. The Test 1 and Test 4 specimens showed minimum percentage elongations due to the presence of voids as shown in Figure 2a,b. Moreover, the mechanical properties such as strength and ductility of the Test 2 and Test 3 weldments were relatively better because of the absence of voids.
Table 4.
Tensile properties of welded samples and BM.
The types of defects that caused the failure in different weldments are listed in Table 4. Test 7 exhibits the best combination of UTS and % elongation among all the weldments (Table 4). The heat input and cooling rate in Test 7 seem favorable regarding effective material mixing, as reported earlier in Section 3.1. As a result, both of these phenomena enhanced the % elongation and tensile strength of the Test 7 weldment, as shown in Table 4.
3.4. Guided Bend Test for Ductility of Welds
The highest magnitude of stress on the stress–strain curve of each FSW and BM gives the flexural strength, as shown in Table 5. Test 3 exhibits the maximum flexural strength while Test 1 shows the minimum flexural strength, as presented in Table 5. The BM was ductile in nature, thus the set deformation was achieved (without fracture) at a flexural strength of 2.5 MPa.
Table 5.
Flexural strength of FSW parts and BM.
The Test 1, 3, 4, and 5 samples were completely fractured under the bending load before acquiring the required deflection of 5%, as shown in Figure 6a. However, cracks on the bend surface were observed in the Test 6 sample, as shown in Figure 6b. The minimum flexural strength of the Test 1 weldment is due to the accumulation of defects as discussed in Section 3.1. Although the Test 3 sample showed the highest flexural strength, it was fractured before attaining the required deflection, which predicts an inferior ductile nature of the Test 3 weldment.
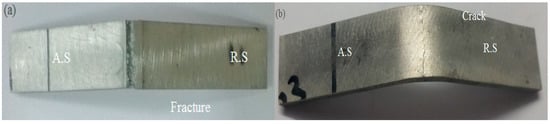
Figure 6.
(a) Fractured sample of Test 1 under bending load and (b) Crack on bend surface of Test 6 sample under bending load.
The possible reasons for the low ductility and lower levels of plastic deformation in the fractured samples could be an inappropriate combination of ω and v (as discussed in Section 3.1). The increase in ω up to 1500 rpm increased the flexural strength and ductility due to high heat generation (Test 7, Test 9). Similarly, the increase in v from 47.5 mm/min to 118 mm/min at low ω of 750 rpm (Test 1, 2 & 3) increased the flexural strength but decreased the ductility. The reduction in ductility might be due to the rapid cooling (the low tool contact time with the workpiece and hence low heat localization).
3.5. Residual Stress Distribution in Welded Zones
The residual stress distribution in the BM and two representative weldments (Test 1 and Test 7) was determined. The strains in two directions were measured: S1 is the strain measured in the transverse direction of the weld and S3 is the strain measured along the direction of the weld, as shown in Figure 7a. The residual stress distribution in the SZ and TMAZ on the advancing side (AS) and retreating side (RS) was determined. The attached strain rosettes are shown in Figure 7b.
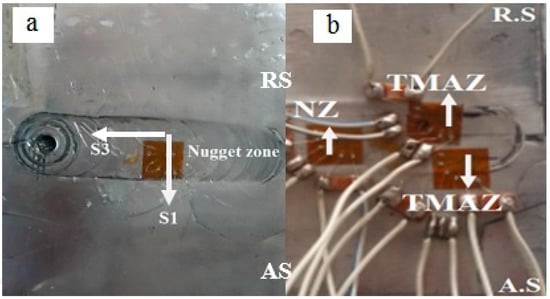
Figure 7.
(a) Direction of strains S1 and S3 on the FSW part and (b) Expanded view of strain gauges attached to different zones of the FSW part.
The measured longitudinal residual stress (i.e., S3) distribution through thickness in the NZ and TMAZ on the AS and RS are shown in Figure 8. The longitudinal residual stresses in the NZ were mostly tensile in nature. The heat generated in the NZ during stirring is greater than the heat produced in other zones, as reported by Mahoney et al. [23] and Dialami et al. [24], which could release a greater amount of residual stress in the NZ. As a result, the magnitudes of the residual stress in the NZ were mostly less than those produced in the TMAZ on both the AS and RS, as shown in Figure 8. A similar finding was observed in Buglioni et al. [25].
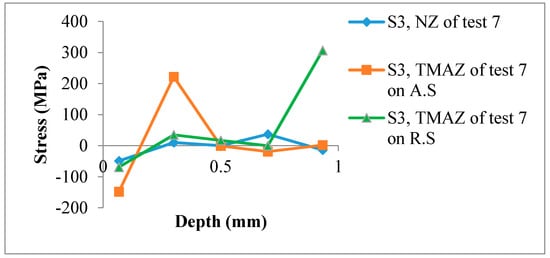
Figure 8.
Longitudinal residual stress distribution in the nugget zone (NZ) and thermo-mechanically affected zone (TMAZ) on the advancing side (AS) and retreating side (RS).
The longitudinal residual stresses in the TMAZ on the AS were mainly compressive while those on the RS were mostly tensile in nature, as shown in Figure 8. In addition, the magnitude of stresses on the AS is lower than those on the RS. The temperature rise in the TMAZ is slightly higher on the AS, as reported by Arbegast et al. [26]. This higher temperature rise on the AS may have helped in releasing a higher amount of residual stresses on the AS. The transverse residual stress (i.e., S1) distribution through thickness is shown in Figure 9. The transverse residual stresses in all the zones were mainly tensile and non-uniform in nature. Like longitudinal residual stresses, the transverse residual stresses in the NZ were lower compared to that of the other zones. Initially in the TMAZ, the residual stresses in the transverse direction were slightly higher on the AS. However, along the depth, transverse residual stresses on the AS tended to decrease, whereas on the RS, the transverse residual stresses increased abruptly as a result of the higher temperature drop through thickness on the RS.
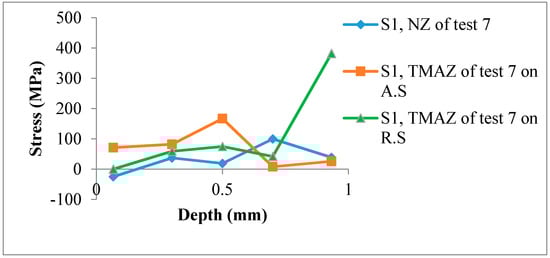
Figure 9.
Transverse residual stress distribution in the NZ and TMAZ on the AS and RS.
3.6. Comparison of Residual Stress Distribution
The longitudinal and transverse residual stress distributions in the BM and in the NZs of the two representative weldments (Test 1 and Test 7) are determined, as shown in Figure 10a,b, respectively. In the weldments of Test 7 and Test 1, transverse and longitudinal residual stresses were mainly tensile and non-uniform in nature. However, in the BM the longitudinal residual stresses were mostly compressive in nature while the transverse residual stresses showed tensile behavior.
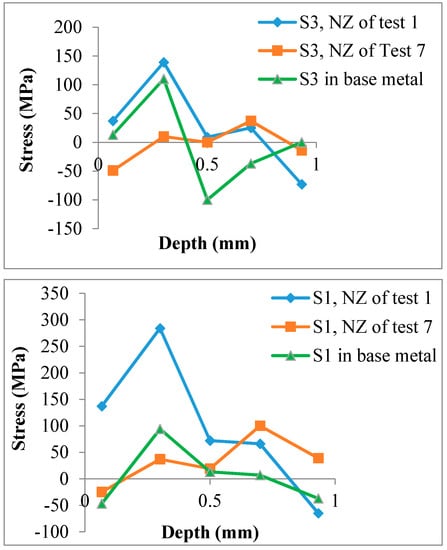
Figure 10.
Residual stress distribution (S1 and S3) in BM and NZ of Test 1 and Test 7.
Test 1 exhibited the maximum tensile residual stresses in both longitudinal and transverse directions. It is due to the low temperature rise. This increase in transverse residual stresses in tensile nature seems to have reduced the tensile load bearing capability. It can be seen in Section 3.3 that Test 1 shows the least tensile strength. The ω in Test 7 was higher as compared to that of Test 1, which produced greater amount of heat. The higher amount of heat produced in Test 7 may have released a higher amount of residual stresses in Test 7 as compared to that of Test 1, as shown in Figure 10. Furthermore, the BM possessed the least residual stresses in both longitudinal and transverse directions, as shown in Figure 10. The presence of residual stresses in the parent sheet might be due to its pre-straining (cold working).
3.7. Fracture Mechanism
3.7.1. Fracture under Tensile Loadings
Figure 11a,b depict the fractographs of two representative surfaces of the Test 7 and Test 1 weldments, respectively. A dimple feature was observed in the fractographs of the Test 7 sample, while micro-cracks were found in the Test 1 specimen. The presence of a large population of deep dimples indicates the typical ductile mode of fracture in the Test 7 sample under tensile loading. The ductile nature was possibly due to the absence of cracks and proper material mixing. As a result, greater energy dissipation and hence more plastic deformation took place during tensile loading of the Test 7 weldment.
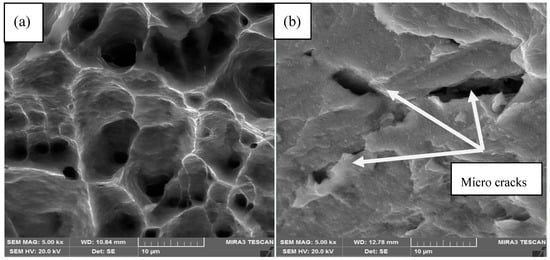
Figure 11.
Fractographs of tensile fractures (a) Test 7 and (b) Test 1.
On the other hand, dimples were not observed on the fractured surface of the Test 1 weldment, rather micro-cracks were detected. The presence of cracks suggests that the fracture might have initiated from pre-existing cracks which developed in the weldment during the FSW process. The absence of dimples also indicates that the weldment did not undergo substantial plastic deformation prior to fracture.
The fracture in both the layers of tensile samples did not occur at the same cross-section, as shown in Figure 12. This shows that crack does not propagate from one layer to another and as a result a low crack propagation rate takes place in the laminated weldments (as discussed in chapter 1).
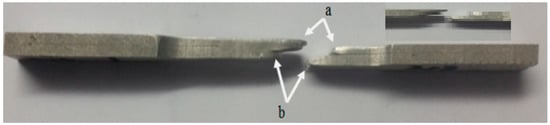
Figure 12.
Cross-section of fracture in (a) top layer and (b) bottom layer.
3.7.2. Fracture under Bending Loads
Figure 13a,b show the fractographs of the fractured surfaces of the Test 1 and Test 6 samples, respectively. The fractographs of the Test 1 sample shows micro-cracks and discontinuity between the layers, which indicates the non-uniform deformation and inappropriate mixing of material. The presence of micro-cracks led to the reduction in flexural strength and the brittle mode of the fracture under the bending test of the Test 1 sample. The fractured surface of the Test 6 sample contained flakes as shown in Figure 13b. However, the layers were continuous in nature, which predicts the relatively higher flexural strength and plastic deformation of the Test 6 sample compared to that of Test 1.
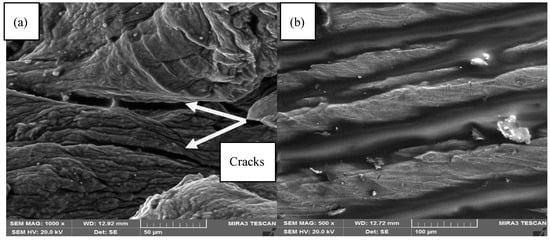
Figure 13.
Fractographs of bending fractures in (a) Test 1 and (b) Test 6.
3.8. Comparison between FSW of Layered and Monolithic Sheet Metals
A comparative analysis of the previous and current investigations on FSW of the laminated and monolithic sheet is presented in Table 6. It can be observed that the current study (laminated sheet joining) is in agreement with the findings of the previous studies (monolithic sheet joining). The general effect of the FSW process parameters on the mechanical properties in both the cases is almost alike. It can be inferred from Table 6 that in most of the cases, the tool rotation rate in the range 1000–1500 rpm resulted in an increased UTS. Furthermore, the increase in tool rotation rate from 1500 rpm and the increase in tool traverse rate at the higher tool rotation rate (ω ≥ 1200 rpm) considerably decreased the tensile properties in both (laminated and monolithic) the cases. The ductility of the bilayer sheet weldments is found to be greater than that of the monolithic sheet joints. It could be due to effective material mixing during FSW of the laminated sheet. Moreover, the conditions for the maximum tensile strength and ductility are not alike. It might be due to the type of material employed and also the range of parameters selected. Therefore, it seems possible to say that the material–parameter interaction exists in FSW of the laminated sheet.
Table 6.
Summary of FSW variables and tensile properties of monolithic and laminated Al joints welded via FSW.
3.9. Proposed Welding Conditions for Laminated Aluminum Sheets
It was observed that the tensile strength and % elongation of all experiments decreased as compared to the BM. However, Test 7 showed the highest % elongation and tensile strength of 24.72% and 79.10 MPa, respectively. Similarly, Test 3 showed the highest flexural strength of 3.15 MPa and Test 7 showed a similar value of flexural strength as compared to the BM. Therefore, the Test 7 parameters (i.e., ω = 1500 rpm and v = 47.5 mm/min) are proposed for the joining of bi-layered aluminum laminated sheets on the basis of higher tensile strength, better ductile nature of fracture, and medium value of flexural strength.
4. Conclusions
In the current study, butt joining of bi-layered aluminum laminates was successfully carried out by employing friction stir welding. The residual stress distribution, fracture analysis, and mechanical characterizations of the weldments were performed. Mixing defects (voids and cracks) were observed in the SZ at the following combinations: low rotational speed (ω) and low tool traverse speeds (v) and also at high ω and high v. These defects caused a considerable decrease in ductility and tensile strength of the weldments. The weldment obtained at a tool rotation speed of 1500 rpm and tool traverse rate of 47.5 mm/min exhibited the best combination of mechanical properties, i.e., percentage elongation of 24.72%, ultimate tensile strength of 79.10 MPa, and flexural strength of 2.53 MPa. The transverse and longitudinal residual stresses produced in the SZ during FSW were lower than those in the other zones, which is due to the higher heat concentration in the NZ. The tensile strength and % elongation of all experiments also decreased as compared to those of the base material. However, Test 7 (i.e., ω = 1500 rpm and v = 47.5 mm/min) showed the highest % elongation and tensile strength of 24.72% and 79.10 MPa, respectively. Similarly, Test 3 (i.e., ω = 750 rpm and v = 118 mm/min) showed the highest flexural strength of 3.15 MPa, and Test 7 (i.e., ω = 1500 rpm and v = 47.5 mm/min) showed similar value of strength as compared to the base material. Therefore, the Test 7 parameters (i.e., ω = 1500 rpm and v = 47.5 mm/min) are proposed for the joining of bi-layered aluminum laminated sheets.
Author Contributions
Conceptualization, M.T. and G.H.; methodology, H.W., M.T.; software, M.T. and I.K.; validation, H.W. and I.K.; formal analysis, H.W. and M.T.; investigation, M.T., and I.K.; resources, G.H. and M.I.K.; data curation, H.W. and M.T.; writing—original draft preparation, M.T. and I.K.; writing—review and editing, G.H. and M.I.K.; visualization, I.K. and M.I.K.; supervision, G.H. and M.I.K.; project administration, H.W.; funding acquisition, G.H and W.A.K; Technical resources and language proofing: G.H and W.A.K.
Funding
The necessary funding to realize this work in the research community was provided by Fundamental Research Funds for the Central Universities (Grant no: NS2015055), for which the authors are grateful.
Acknowledgments
The authors are thankful to GIK Institute of Engineering Sciences and Technology for providing advisory and technical support.
Conflicts of Interest
The authors declare no conflict of interest.
References
- Kelkar, A.; Roth, R.; Clark, J. Automobile bodies: Can aluminum be an economical alternative to steel? JOM 2001, 53, 28–32. [Google Scholar]
- Blawert, C.; Hort, N.; Kainer, K.U. Automotive applications of magnesium and its alloys. Trans. Indian Inst. Met. 2004, 57, 397–408. [Google Scholar]
- Jo, Y.M.; Lee, K.S.; Lee, Y.S.; Kang, N. Influence of annealing on the interface-correlated mechanical properties of a Ti/STS clad sheet. J. Korean Inst. Met. Mater. 2014, 52, 881–891. [Google Scholar]
- Mishra, R.S.; Ma, Z.Y. Frictions stir welding and processing. Mater. Sci. Eng. R Rep. 2005, 50, 1–78. [Google Scholar] [CrossRef]
- Stephan, A.; Airbus Deutschland GmbH. Laminate Sheet, in Particular for Fuselage Skin Sheets for Aircrafts. U.S. Patent 7,875,333, 25 January 2011. [Google Scholar]
- Shigematsu, I.; Kwon, Y.J.; Suzuki, K.; Imai, T.; Saito, N. Joining of 5083 and 6061 aluminum alloys by friction stir welding. J. Mater. Sci. Lett. 2003, 22, 353–356. [Google Scholar] [CrossRef]
- Cao, X.; Jahazi, M. Effect of tool rotational speed and probe length on lap joint quality of a friction stir welded magnesium alloy. Mater. Des. 2011, 32, 1–11. [Google Scholar] [CrossRef]
- Xu, N.; Ueji, R.; Fujii, H. Dynamic and static change of grain size and texture of copper during friction stir welding. J. Mater. Process.Technol. 2016, 232, 90–99. [Google Scholar] [CrossRef]
- Buffa, G.; Fratini, L.; Micari, F. Mechanical and microstructural properties prediction by artificial neural networks in FSW processes of dual phase titanium alloys. J. Manuf. Process. 2012, 14, 289–296. [Google Scholar] [CrossRef]
- Thomas, W.M.; Nicholas, E.D. Friction stir welding for the transportation industries. Mater. Des. 1997, 18, 269–273. [Google Scholar] [CrossRef]
- Perrett, J.G.; Martin, J.; Threadgill, P.L.; Ahmed, M.M.Z. Recent developments in friction stir welding of thick section aluminium alloys. In Proceedings of the 6th World Congress, Aluminium Two Thousand, Florence, Italy, 15 March 2007; pp. 13–17. [Google Scholar]
- Threadgill, P. Friction stir welds in aluminium alloys–preliminary microstructural assessment. TWI Bull. 1997, 38, 30–33. [Google Scholar]
- Biallas, G.; Braun, R.; Donne, C.D.; Staniek, G.; Kaysser, W.A. Mechanical properties and corrosion behaviour of friction stir welded 2024-T3. In Proceedings of the First International Symposium on Friction Stir Welding, Thousand Oaks, CA, USA, 14–16 June 1999. [Google Scholar]
- Mishra, R.S.; Sharma, S.R.; Mara, N.A.; Mahoney, M.W. Mechanical properties of friction stir welded aluminum alloys. In Joining of Advanced and Specialty Materials; ASM International: Materials Park, OH, USA, 2000; pp. 157–159. [Google Scholar]
- Von Strombeck, A.; dos Santos, J.F.; Torster, F.; Laureano, P.; Koc, M. Fracture Toughness Behavior of FSW Joints on Aluminum Alloys. In Proceedings of the 1st International Symposium on Friction Stir Welding, Thousand Oaks, CA, USA, 14–16 June 1999. [Google Scholar]
- Bisadi, H.; Tour, M.; Tavakoli, A. The influence of process parameters on microstructure and mechanical properties of friction stir welded Al 5083 alloy lap joint. Am. J. Mater. Sci. 2011, 1, 93–97. [Google Scholar] [CrossRef]
- Peel, M.; Steuwer, A.; Preuss, M.; Withers, P.J. Microstructure, mechanical properties and residual stresses as a function of welding speed in aluminium AA5083 friction stir welds. Acta Mater. 2003, 51, 4791–4801. [Google Scholar] [CrossRef]
- Donne, C.D.; Lima, E.; Wegener, J.; Pyzalla, A.; Buslaps, T. Investigations on residual stresses in friction stir welds. In Proceedings of the Third International Symposium on Friction Stir Welding, Kobe, Japan, 27–28 September 2001. [Google Scholar]
- James, M.; Mahoney, M.; Waldron, D. Residual Stress Measurements in Friction Stir Welded Aluminum Alloys. In Proceedings of the 1st International Symposium on Friction StirWelding, Thousand Oaks, CA, USA, 14–16 June 1999. [Google Scholar]
- Beygi, R.; Kazeminezhad, M.; Kokabi, A.H. Butt joining of Al–Cu bilayer sheet through friction stir welding. Trans. Nonferrous Met. Soc. China 2012, 22, 2925–2929. [Google Scholar] [CrossRef]
- Lee, T.H.; Lee, Y.J.; Park, K.T.; Jeong, H.G.; Lee, J.H. Mechanical and asymmetrical thermal properties of Al/Cu composite fabricated by repeated hydrostatic extrusion process. Met. Mater. Int. 2015, 21, 402–407. [Google Scholar] [CrossRef]
- Khan, I.; Hussain, G.; Tariq, M.; Ilyas, M. Fabrication of UHMW polyethylene/nano-hydroxyapatite biocomposite via heat-assisted friction stir processing. Int. J. Adv. Manuf. Technol. 2018, 96, 3651–3663. [Google Scholar] [CrossRef]
- Mahoney, M.W.; Rhodes, C.G.; Flintoff, J.G.; Bingel, W.H.; Spurling, R.A. Properties of friction-stir-welded 7075 T651 aluminum. Metall. Mater. Trans. A 1998, 29, 1955–1964. [Google Scholar] [CrossRef]
- Dialami, N.; Cervera, M.; Chiumenti, M.; de Saracibar, C.A. Local–global strategy for the prediction of residual stresses in FSW processes. Int. J. Adv. Manuf. Technol. 2017, 88, 3099–3111. [Google Scholar] [CrossRef]
- Buglioni, L.; Tufaro, L.N.; Svoboda, H.G. Thermal cycles and residual stresses in FSW of aluminum alloys: Experimental measurements and numerical models. Procedia Mater. Sci. 2015, 9, 87–96. [Google Scholar] [CrossRef]
- Arbegast, W.J.; Hartley, P.J. Friction Stir Welding. In Proceedings of the 5th International Conference on Trends in Welding Research, Pine Mountain, GA, USA, 1–5 June 1998; p. 541. [Google Scholar]
- Khodir, A.; Shibayanagi, T. Microstructure and mechanical properties of friction stir welded AA2024-T3 aluminum alloy. Mater. Trans. 2007, 48, 1928–1937. [Google Scholar] [CrossRef]
- CAVALIERE, P.; Cerri, E.; Marzoli, L.; Dos Santos, J. Friction stir welding of ceramic particle reinforced aluminium based metal matrix composites. Appl. Compos. Mater. 2004, 11, 247–258. [Google Scholar] [CrossRef]
- Chen, X.G.; da Silva, M.; Gougeon, P.; St-Georges, L. Microstructure and mechanical properties of friction stir welded A A60 63–B4C metal matrix composites. Mater. Sci. Eng. A 2009, 518, 174–184. [Google Scholar] [CrossRef]
- Khodir, S.A.; Shibayanagi, T. Friction stir welding of dissimilar AA2024 and AA7075 aluminum alloys. Mater. Sci. Eng. B 2008, 148, 82–87. [Google Scholar] [CrossRef]


© 2019 by the authors. Licensee MDPI, Basel, Switzerland. This article is an open access article distributed under the terms and conditions of the Creative Commons Attribution (CC BY) license (http://creativecommons.org/licenses/by/4.0/).