1. Introduction
Intercritical annealing of low-alloy steel occurs in the temperature regime between the
Ac1 and
Ac3 temperatures, where thermodynamic equilibrium corresponds to some mixture of the austenite and ferrite phases. The amount of austenite at the conclusion of intercritical annealing depends on several factors, such as the starting microstructure, heating rate [
1] and, more importantly, the alloying contents of the steel. Upon quenching at higher than critical cooling rates, the intercritical austenite phase is transformed to martensite, resulting in low-alloy dual-phase steel consisting of martensitic islands in a matrix of ferritic grains.
If the quenching is interrupted somewhere between the martensite start temperature
Ms and the temperature where the last of the austenite transforms (
Mf), the martensitic transformation will be incomplete and the martensitic islands will include some untransformed metastable austenite. If the steel is then transitioned for a certain duration to a suitable intermediate holding temperature (also commonly referred as ‘partitioning temperature’), this metastable austenite can be either partially or fully stabilized down to room temperature by enriching it with carbon partitioned from the carbon-supersaturated martensite. The resulting microstructure then would consist of martensitic islands interspersed with carbon-enriched retained austenite, suspended in the ferritic matrix. In effect, the intercritical austenite phase has undergone a heat treatment known as quenching and partitioning (Q&P), originally proposed in 2003 by Speer et al. [
2].
The end goal of the Q&P treatment of intercritical austenite is to improve the ductility of a dual-phase microstructure via the strain-induced transformation of the retained austenite to martensite during deformation, essentially increasing the strain hardening capability of the steel. It was found by some of the present authors in a previous study [
3] that austenite stabilized in this manner can increase ductility even for a low-carbon, high-aluminum steel. However, it was recently observed by Tan et al. [
4] that the ability of the retained austenite to contribute to strain hardening depends on its localization, morphology and stability essentially with respect to the carbon-content. They found that if the deformation occurs primarily in the ferrite phase, the transformation of retained austenite to martensite remains limited, thus limiting the total elongation. A fine film-like morphology (resulting in high mechanical stability) and localization of the austenite away from ferrite-prior austenite interfaces will also promote this type of undesirable mechanical stability.
Successfully promoting quenching and partitioning in a steel imposes some requirements on alloying. First, the steel must have the ability to suppress or delay the formation of carbides or other precipitates during partitioning. This is typically achieved by adding a combination of ferrite-stabilizing elements such as aluminum [
5], silicon [
6] or chromium [
7]. Second, the steel must contain a sufficient amount of carbon to enable stabilizing an optimum retained austenite fraction to achieve the desired increase in ductility. Third, the steel must be sufficiently hardenable in order to reach the initial quench temperature without allowing undesired ferritic or bainitic phase transformations during the initial cooling step.
Intercritical annealing opens up some interesting possibilities for controlling the condition of the austenite at the conclusion of annealing. The grain size and the relative fraction of the intercritical austenite can be controlled to a large extent by suitably varying the annealing parameters [
1,
8,
9]. The growth of the austenite phase in low- and medium-carbon steels has been observed in various research works to be controlled essentially by the diffusion of carbon across the interphase boundary. Therefore, carbon can be expected to partition nearly completely to austenite [
1,
10], while the partitioning of heavier elements (such as silicon, aluminum or manganese) is usually limited and will depend on the annealing temperature and duration [
11].
The conditioning of the austenite will drastically affect the quenching response, both in terms of martensite start temperature
Ms as well as the hardenability. Assuming total partitioning of carbon from ferrite to austenite, a smaller initial fraction of austenite will greatly increase its carbon content. This will both decrease
Ms and improve hardenability [
12], at least up to the eutectoid composition. To illustrate the point further, three preliminary calculations were made with the thermodynamic and kinetic calculation software JMATPRO
® [
13] for two of the experimental steels studied in this work: Steel A and Steel B (see
Table 1 for chemical composition). JMATPRO was used to calculate continuous cooling transformation (CCT) curves based on the model by Kirkaldy et al. [
14] modified by Lee and Bhadeshia [
15].
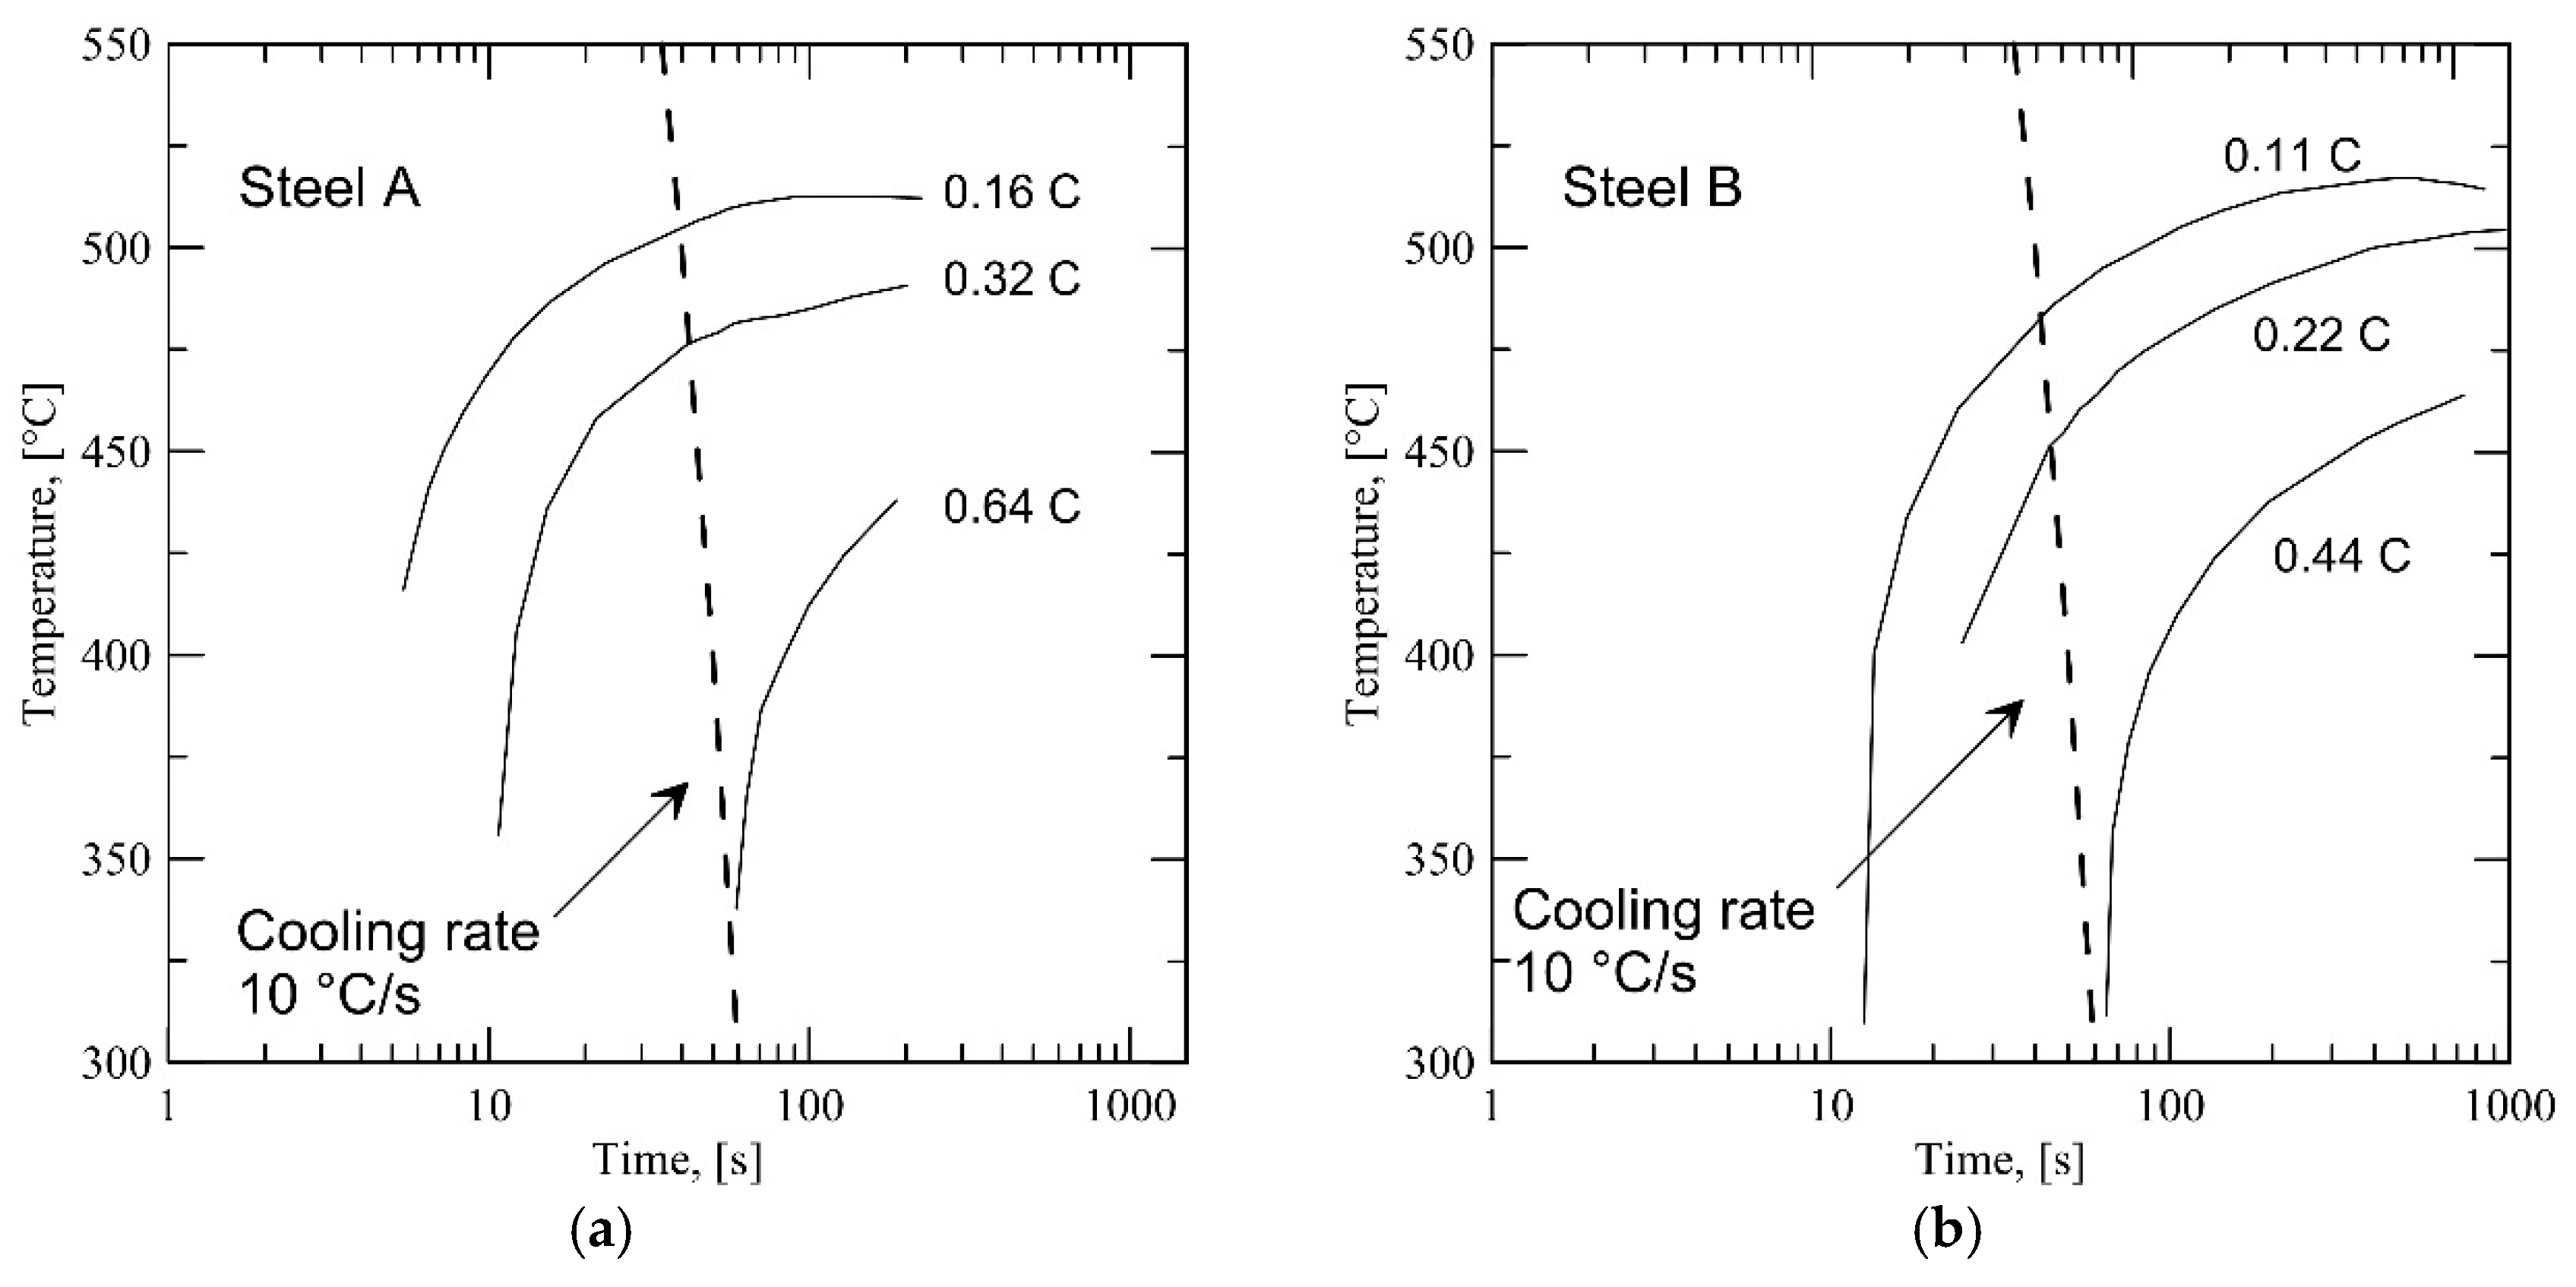
Figure 1 shows the CCT curves for the steels with modified carbon contents, from nominal composition to carbon contents corresponding to 50 and 25 vol % fraction of intercritical austenite at the conclusion of annealing (assuming full partitioning of carbon). In the figure, the 50 vol % fraction of austenite is indicated by an assumed carbon content of 0.32C for Steel A and 0.22C for Steel B, and 25 vol % austenite content is indicated by 0.64C for Steel A and 0.44C for Steel B. Dashed lines in the figure indicate continuous cooling curves corresponding to a linear cooling rate of 10 °C/s, which is a realistically achievable cooling rate in modern continuous annealing lines. Referring to
Figure 1, the onset of bainite transformation is delayed due to an increase in carbon content at lower austenite fractions. At an austenite fraction of 25 vol %, bainite transformation is avoided completely at a cooling rate of 10 °C/s, based on the JMATPRO
® calculations.
These calculations do not take into account prior austenite grain size, which has been observed to have a significant effect on the martensite transformation of intercritically annealed steel in a previous study [
8]. Essentially, the prior austenite grain size potentially remains very small during intercritical annealing, further reducing the
Ms temperature. Such an effect of fine austenite grain size on
Ms has been exhaustively investigated, for instance, by Yang and Bhadeshia [
16].
Austenite conditioning via intercritical annealing was shown to affect the quenching and partitioning response of a high-aluminum steel in a previous study [
3]. In this case, the prior austenite grain size was of the order of 1.5 µm and the austenite had a high carbon content directly after intercritical annealing. This decreased
Ms significantly beyond the value predicted by empirical equations and promoted the formation of martensite with a small packet size and coarse, irregularly-shaped lath morphology. This, in turn, resulted in blocky rather than film-like retained austenite formation, situated primarily at prior austenite and packet boundaries. The amount of retained austenite was found to correlate well with the initial quench temperature, as well as the uniform and ultimate elongations of the studied steels. The effect of intercritical annealing on
Ms was also observed by Yi et al. [
17], who showed that with a suitably high carbon and aluminum content in the steel, intercritical annealing can be used to lower the initial quench temperature
QT to ambient temperature or lower. Q&P-aided dual-phase microstructures were also produced for a Fe-0.2C-2.0Mn-1.5Si (wt %) steel after intercritical annealing by Wang et al. [
18].
The above discussion should emphasize the point that the condition of the austenite at the conclusion of intercritical annealing should be known (at least at the level of prior austenite grain size and its carbon content), if any reliable estimation for Q&P heat treatment parameters should be made beforehand. Otherwise, it is necessary to determine Ms experimentally by suitable methods, such as dilatometry.
Despite several promising early results [
3,
4,
17,
18], the alloy compositions that have been investigated thus far are challenging to produce in an industrial setting with the current level of knowledge and technology. Furthermore, either the high silicon content of the steels makes hot dip galvanizing difficult [
19] or the high aluminum or other alloying contents complicate the casting procedure.
With this in mind, the quenching and partitioning response was investigated for three experimental alloys following intercritical annealing: a conventional aluminum-alloyed TRIP-type steel and two novel lean-alloyed complex phase-type compositions with a mixture of aluminum, silicon and chromium elements as suppressors of carbide formation. The steels have been cast, rolled and could be hot dip galvanized in an industrial setting, at the current level of technology. The annealing temperatures and timeframes investigated here were also selected from the viewpoint of industrial relevance.
The phase transformation behavior during quenching of the steels was investigated via dilatometry and suitable quenching and partitioning parameters were determined based on the results. The effect of quench temperature on the retained austenite content and the morphology of the various phases in the final microstructures were investigated via optical microscopy, X-ray diffraction (XRD) and electron backscatter diffraction (EBSD). Preliminary evaluation of Q&P treated samples was made in respect of tensile properties.
2. Materials and Methods
The compositions of the investigated steels are shown in
Table 1. The steels were supplied in a cold rolled, fully hard condition as 1.3-mm thick sheets.
Dilatometry experiments were conducted with a Gleeble 3800 thermomechanical simulator (Dynamic Systems Inc., Poestenkill, NY, USA) to determine the
Ms temperatures of the steels after intercritical annealing. 10 mm × 60 mm specimens were cut from the sheets for the experiments. The specimens were subjected to a computer-controlled resistance heating followed by controlled cooling, with the aid of compressed argon gas below 400 °C down to room temperature. The temperature of each specimen was monitored with a K-type thermocouple, and the dilatation was measured in the transverse direction of the specimen at the thermocouple location using an extensometer fitted with quartz rods. The heat treatment parameters are shown in
Table 2.
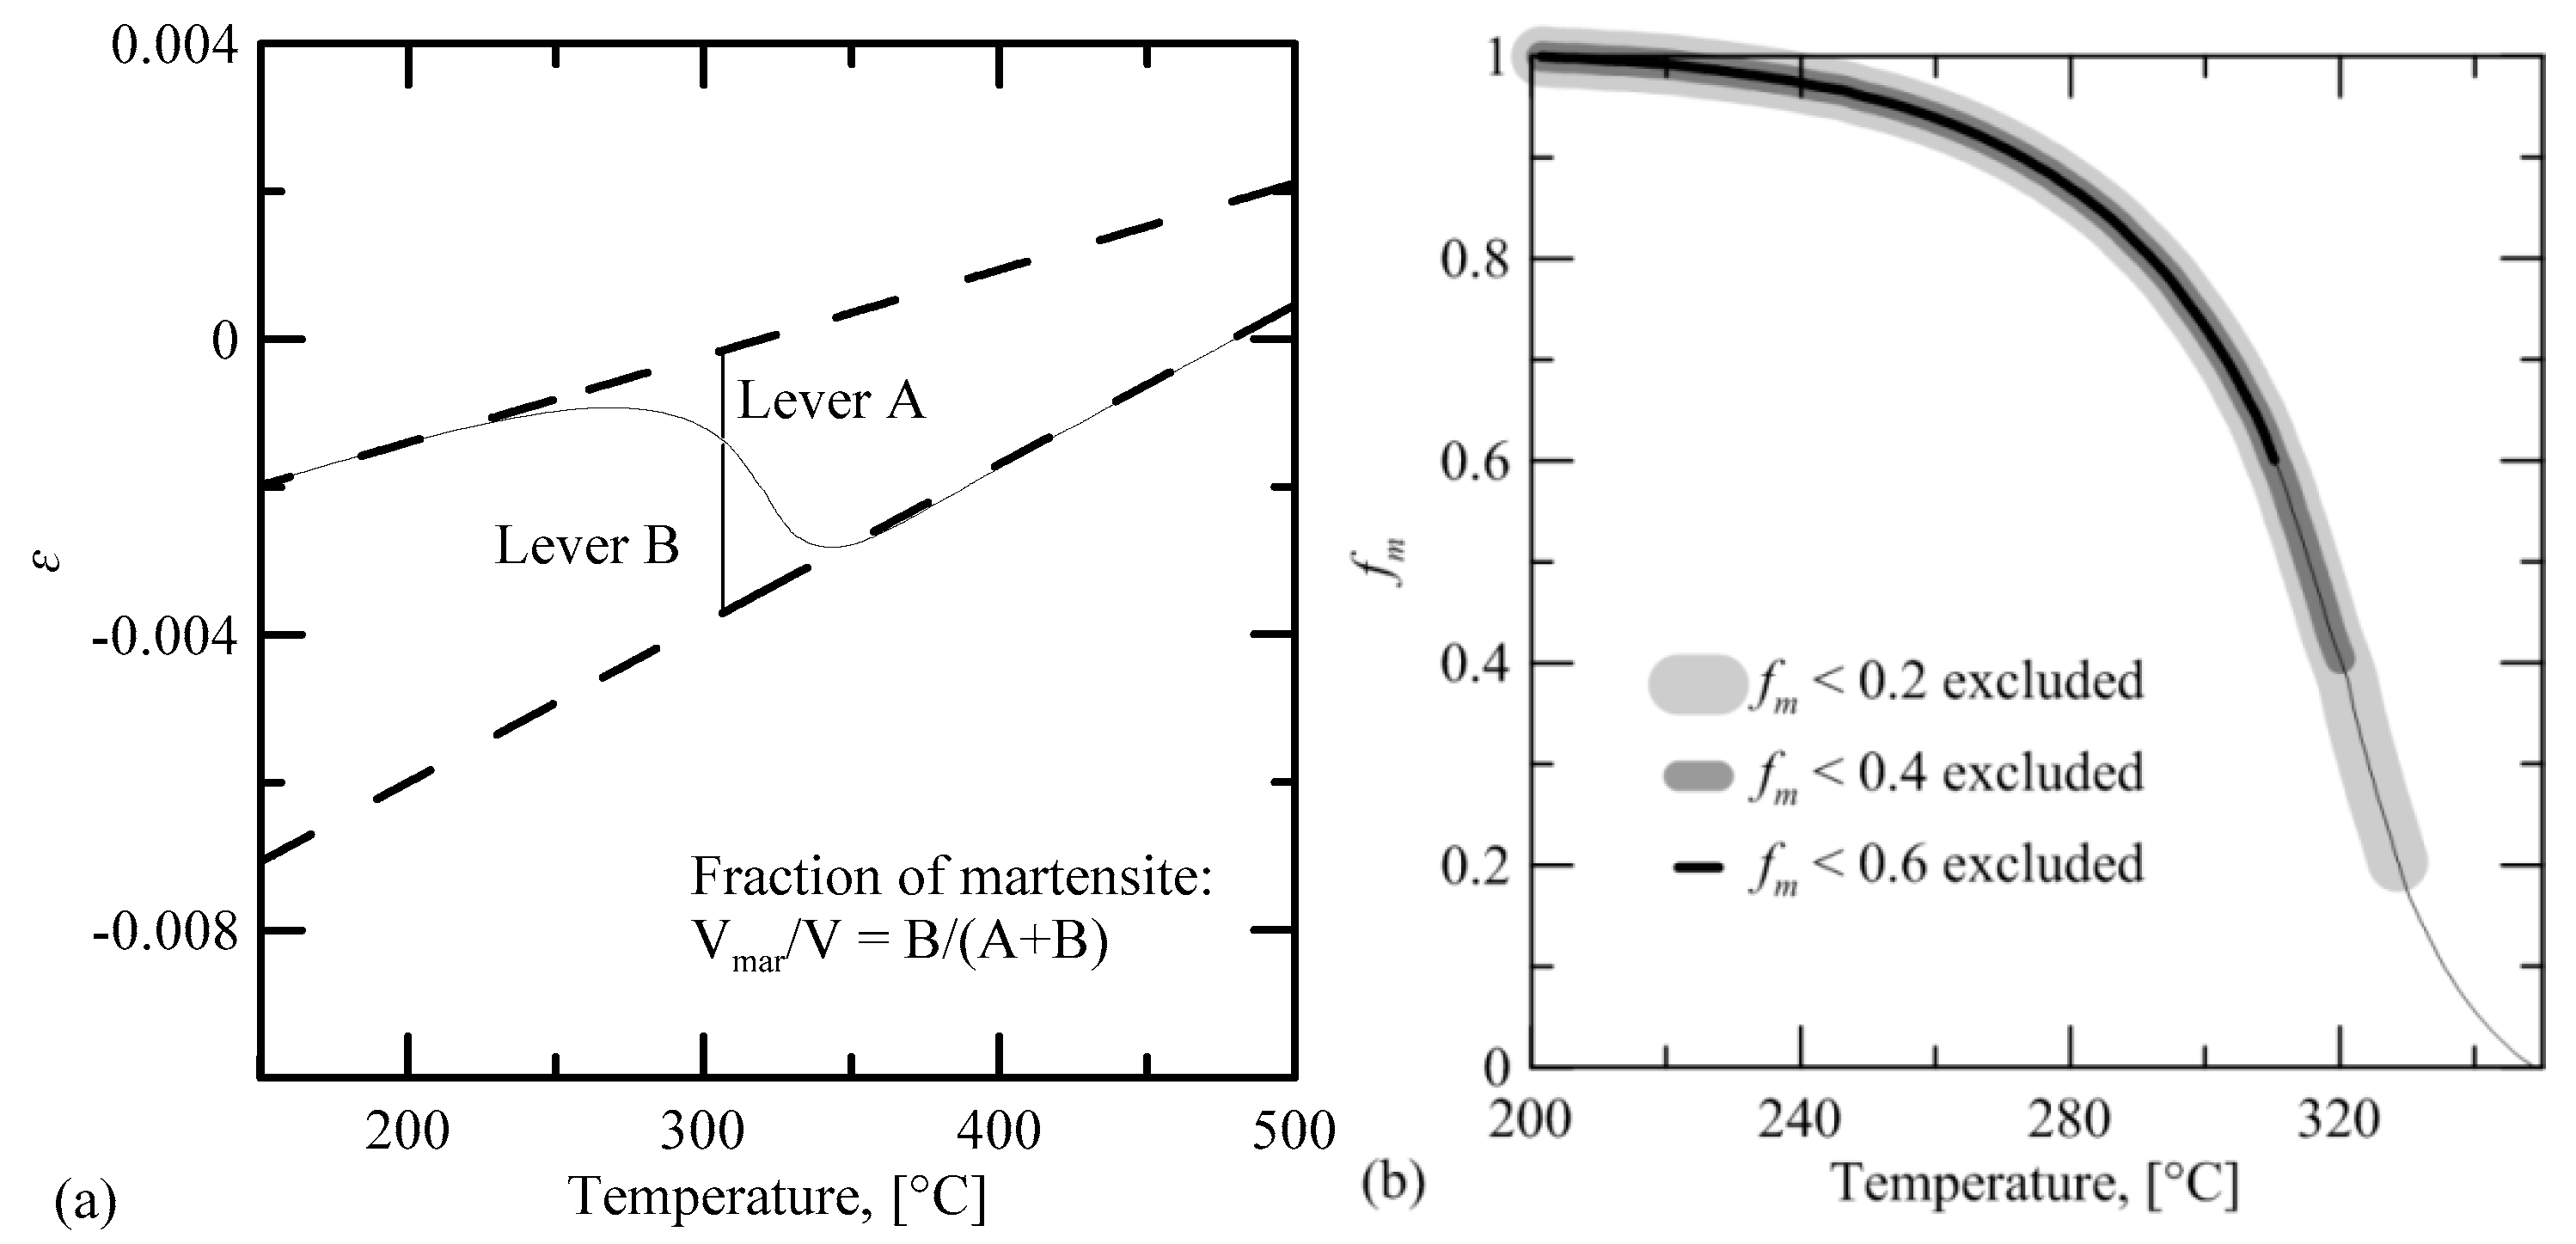
The transformation curves were extracted from the dilatometric data by line fitting over the linear thermal contraction portion of both the austenite and martensite phases. Martensite and austenite cooling contraction curves were extrapolated from the linear portions of the curve. The extent of the martensitic transformation was calculated by using the lever rule. A curve was fitted to this data corresponding to the Koistinen-Marburger [
20] equation:
The martensite start temperature
Ms and empirical fitting constant
K were determined by curve fitting of Equation (1), using Trust-Region-Reflective Least Squares Algorithm in the Matlab
® Curve Fitting Toolbox in Matlab
® R2018b (Mathworks Inc., Natick, MA, USA). The transformation data up to a martensite fraction of 0.2 were excluded from the fitting, in order to minimize the effect of initial gradual martensite start on the fit. Two additional fits were also made, excluding data up to 0.4 and 0.6 martensite fraction. Of these three fits, the best fit according to the adjusted R-square statistics, when compared to the whole transformation data, was chosen as the optimum fitting solution. The
Ms temperature was obtained directly from the fitting parameters for Equation (1). The fitting procedure is shown schematically in
Figure 2.
The specimens were then sectioned in the transverse direction at the thermocouple location and mounted into cold setting resin for metallography. The specimens were ground and polished with colloidal silica Buehler Mastermet2 used in the final polishing step. The specimens were then treated with the color etching procedure proposed by LePera [
21]. The polished and etched specimens were examined and micrographed with the Alicona InfiniteFocus G5 profilometer (Optimax IIM Ltd., Market Harborough, UK).
Typical quenching and partitioning parameters were designed for the steels based on the
Ms values measured in the dilatometry experiments and the fitted martensitic transformation behavior,
Figure 2. The parameters are shown in
Table 3.
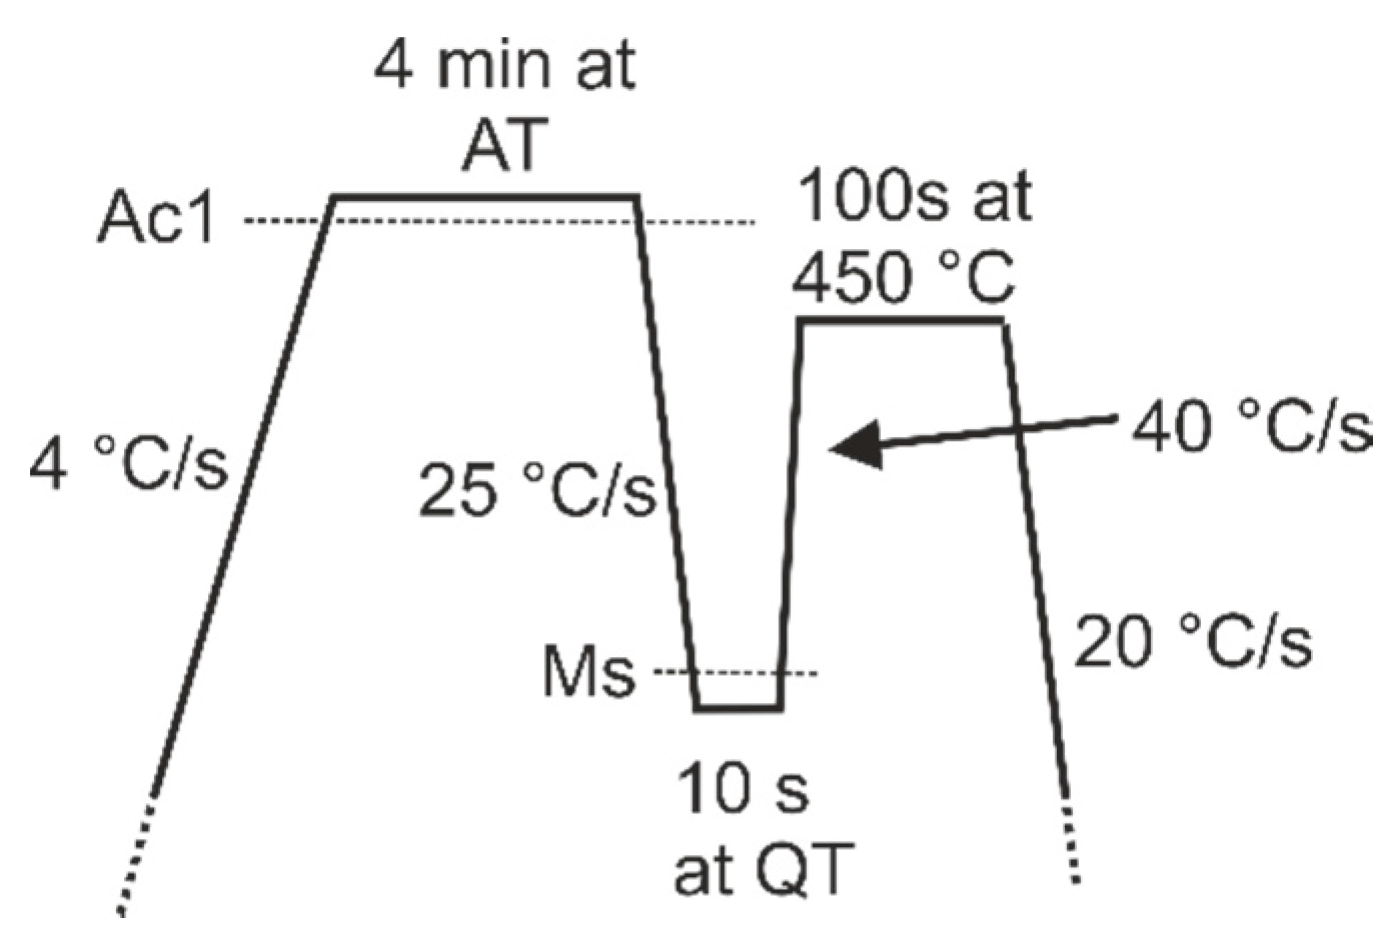
Figure 3 shows a schematic diagram of the Q&P treatment cycle including linear heating and cooling rates.
Heat treatment specimens of 10 mm × 60 mm size were cut from the steel sheets. The Q&P treatments were conducted in the Gleeble 3800 simulator with the pocket jaw grips set at a free span distance of 35 mm. Two specimens were heat treated for each Q&P cycle: one specimen was later used for tensile testing and another for microstructural evaluation and retained austenite measurements using XRD. The test setup was essentially similar to the one employed in dilatometry, with the only difference that the extensometer was not used, if deemed unnecessary.
To determine if significant heating or cooling gradients exist in the specimens during the heat treatment cycles and to assess uniform temperature zone, three thermocouples were fitted on one of the Steel C specimens: one at the center, one 3 mm from center to the side and one 6 mm from center to the other side. It was found that at a distance of 3–6 mm from the controlling thermocouple, the temperature gradient remains below 3–5 °C at all stages of the heat treatment.
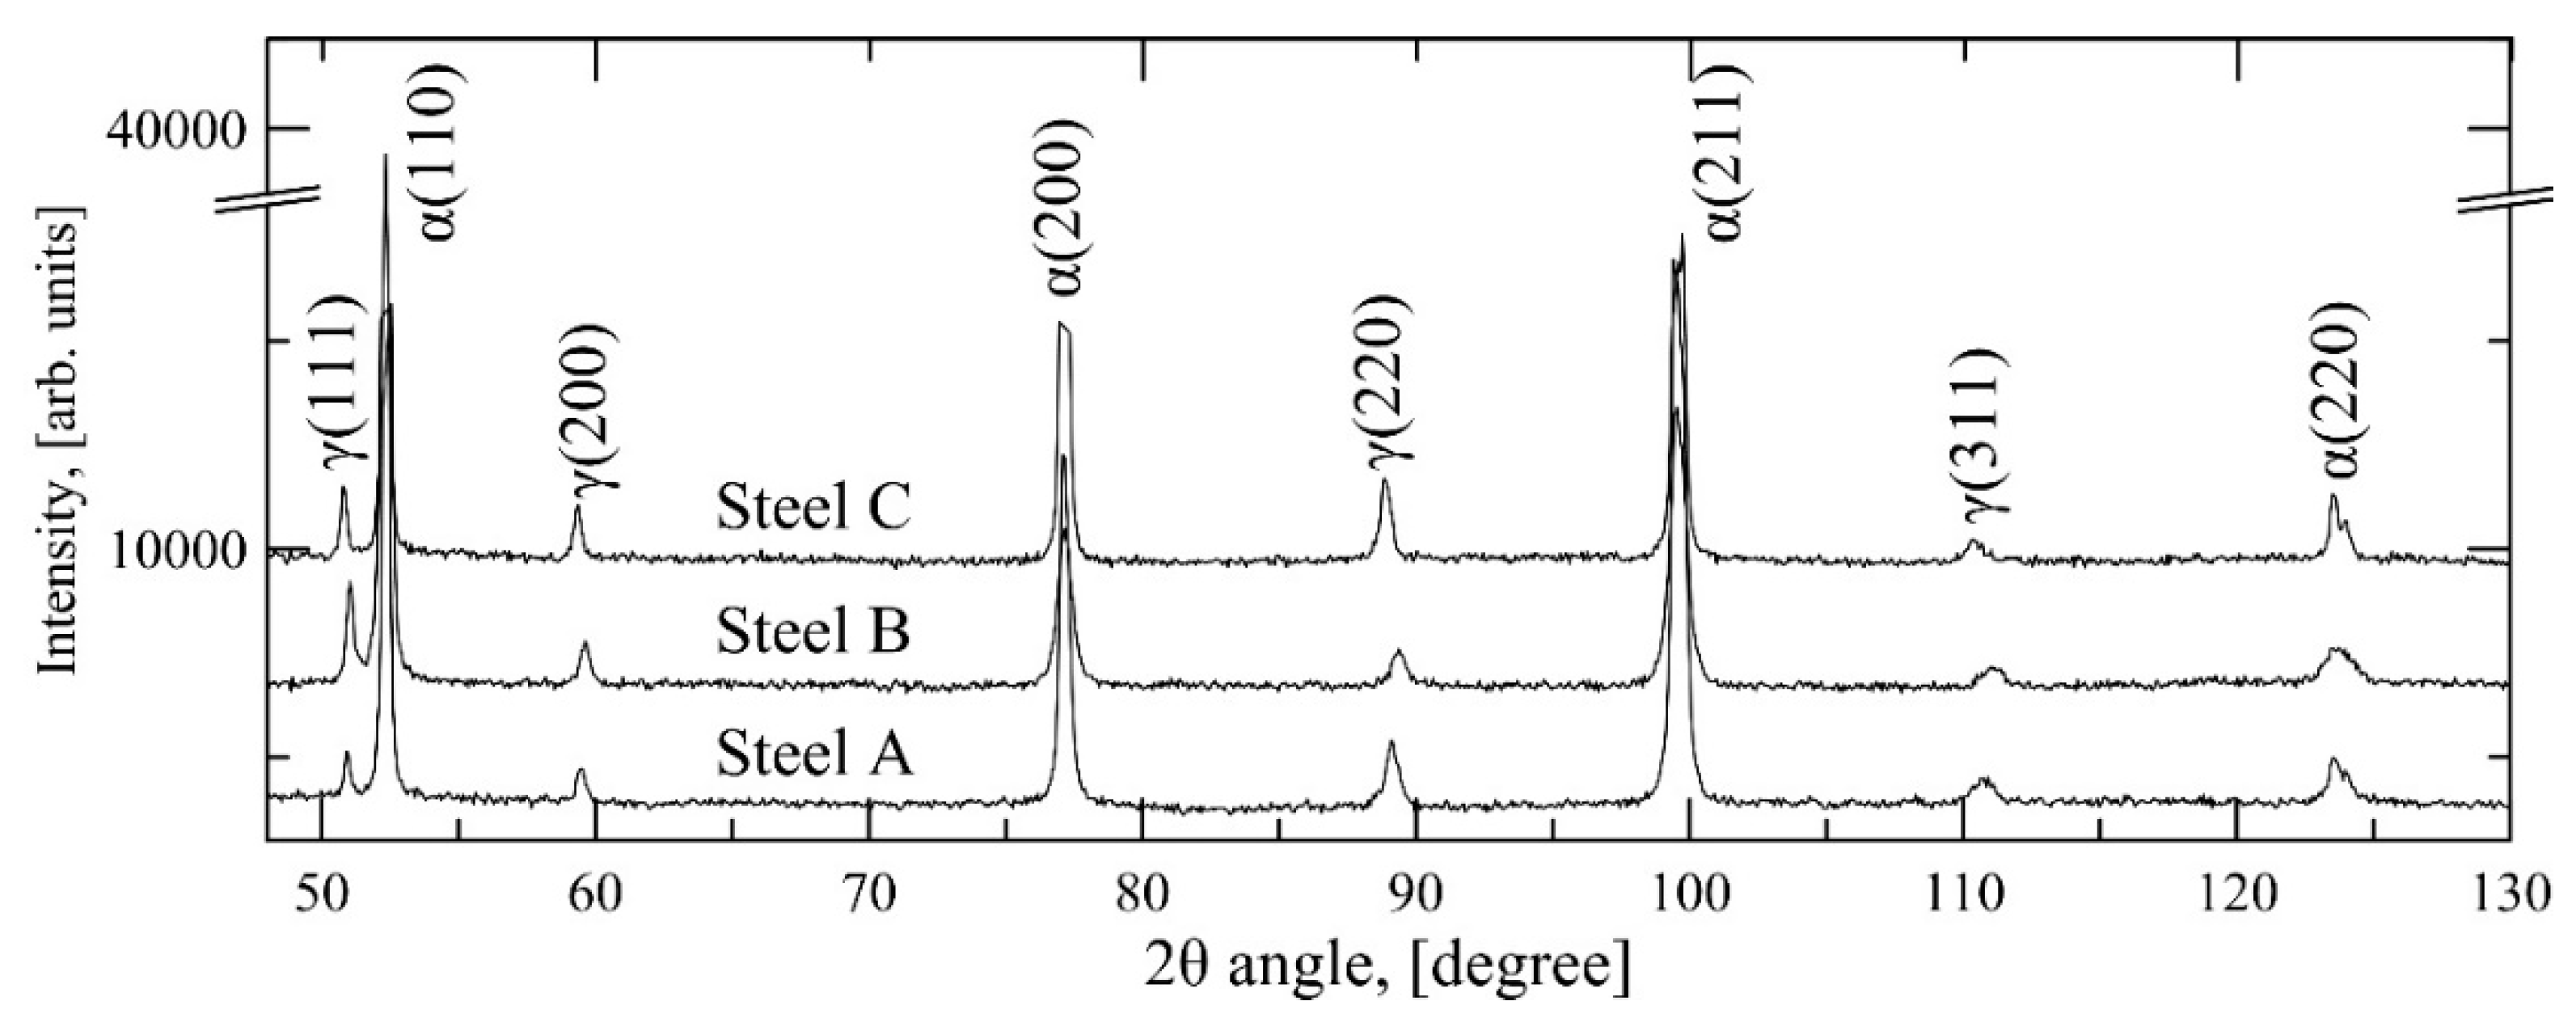
The retained austenite contents of the Q&P specimens were measured at room temperature using X-ray diffraction. A thickness of ~0.2 mm was ground from the specimen surface using a P800 SiC emery paper. The specimens were then ground with progressively finer papers, ending with the roughness P2000 in accord with standard polishing practice. The specimens were then electrolytically polished for 12 s at 40 V with the A2 electrolyte in a Lectropol-5 polisher (Struers Inc., Cleveland, OH, USA). The XRD analyses were conducted with the Panalytical Empyrean X-Ray diffractometer (Malvern Panalytical Ltd., Malvern, UK) using Co K
α-radiation (40° < 2θ < 102°, 40 kV, 45 mA). The site of the thermocouple location was used for centering the X-ray beam on the specimens. The peaks used in the analysis were (110), (200), (211) and (220) for martensite and (111), (200), (220) and (311) for austenite. The method for retained austenite calculation was the four-peak method described in SP-453 [
22] (four peaks for both ferrite and austenite). The carbon content was estimated from the measured average austenite lattice parameter using Equation (2) [
23]:
in which
aγ stands for the average austenite lattice parameter in Å.
After the XRD measurements, the specimens were sectioned in the transverse direction at the location of the thermocouple and prepared for electron backscatter diffraction (EBSD). The specimens were polished in a manner similar to the practice adopted for dilatometry specimens prepared for light optical microscopy. However, the specimens were not etched after polishing. The polished specimens were removed from the mounts, washed in ethanol and placed in a low pressure desiccator overnight to remove moisture. Prior to electron microscopy, the specimens were cleaned in an evacuated chamber fed with ionized oxygen plasma to remove any leftover organic residues on the surface.
The specimens were then subjected to electron backscatter diffraction (EBSD) studies. The scanning electron microscope (SEM) used was a Zeiss ULTRAPLUS UHR FEG-SEM system (ZEISS International, Oberkochen, Germany) fitted with a field emission gun (FEG) and an HKL Premium-F Channel EBSD system with a Nordlys F400 detector (Oxford Instruments plc, Abingdon, UK), which was used for phase contrast and orientation mapping. The parameters for EBSD analysis were 20 kV acceleration voltage, 14 mm working distance and a tilt angle of 70° with a step size of 0.05 μm.
Tensile testing was carried out using an Instron 8800
servohydraulic materials testing machine (Instron, Norwood, MA, USA). Non-standard tensile specimens were prepared by precision milling a 6 mm long, 3.5 mm wide gage area with 1 mm roundings into the center of each specimen. A cooling lubricant jet was used to reduce thermal effects on the specimen during milling. Each specimen was tested in tension to fracture at an engineering strain rate of 0.001 s
−1. Elongation was measured using a miniature axial extensometer. The total elongation
A was recalculated to correspond to standard test geometry of a 120 mm × 20 mm gage section using the Oliver equation as implemented by ISO 2566/1 [
24]:
where
A2 is the calculated elongation value,
A1 is the known elongation value,
k1 and
k2 are the proportionality ratios of the two test pieces, and
n is a material dependent constant. The standard adopts
n = 0.4. The proportionality ratios
k1 and
k2 were calculated with the equation:
where
ws and
ls are the new width and length, respectively, and
wa,
la and
ta are the measured width, length and thickness, respectively.
4. Discussion
Based on the image analysis of the dilatometry specimens, there is an approximately 27 vol % intercritical austenite fraction in the microstructure of the Steel A after annealing. Assuming that all of the untransformed austenite that remains directly after the interrupted quenching is stabilized with carbon and is also retained at room temperature; 55 vol % is transformed at 175 °C, 63 vol % at 150 °C and 70 vol % at 125 °C. Fitting the Koistinen-Marburger equation to these values does not give a meaningful result, because the apparent martensitic transformation is too gradual with respect to temperature to obtain a good fit. Besides, martensite finish temperature
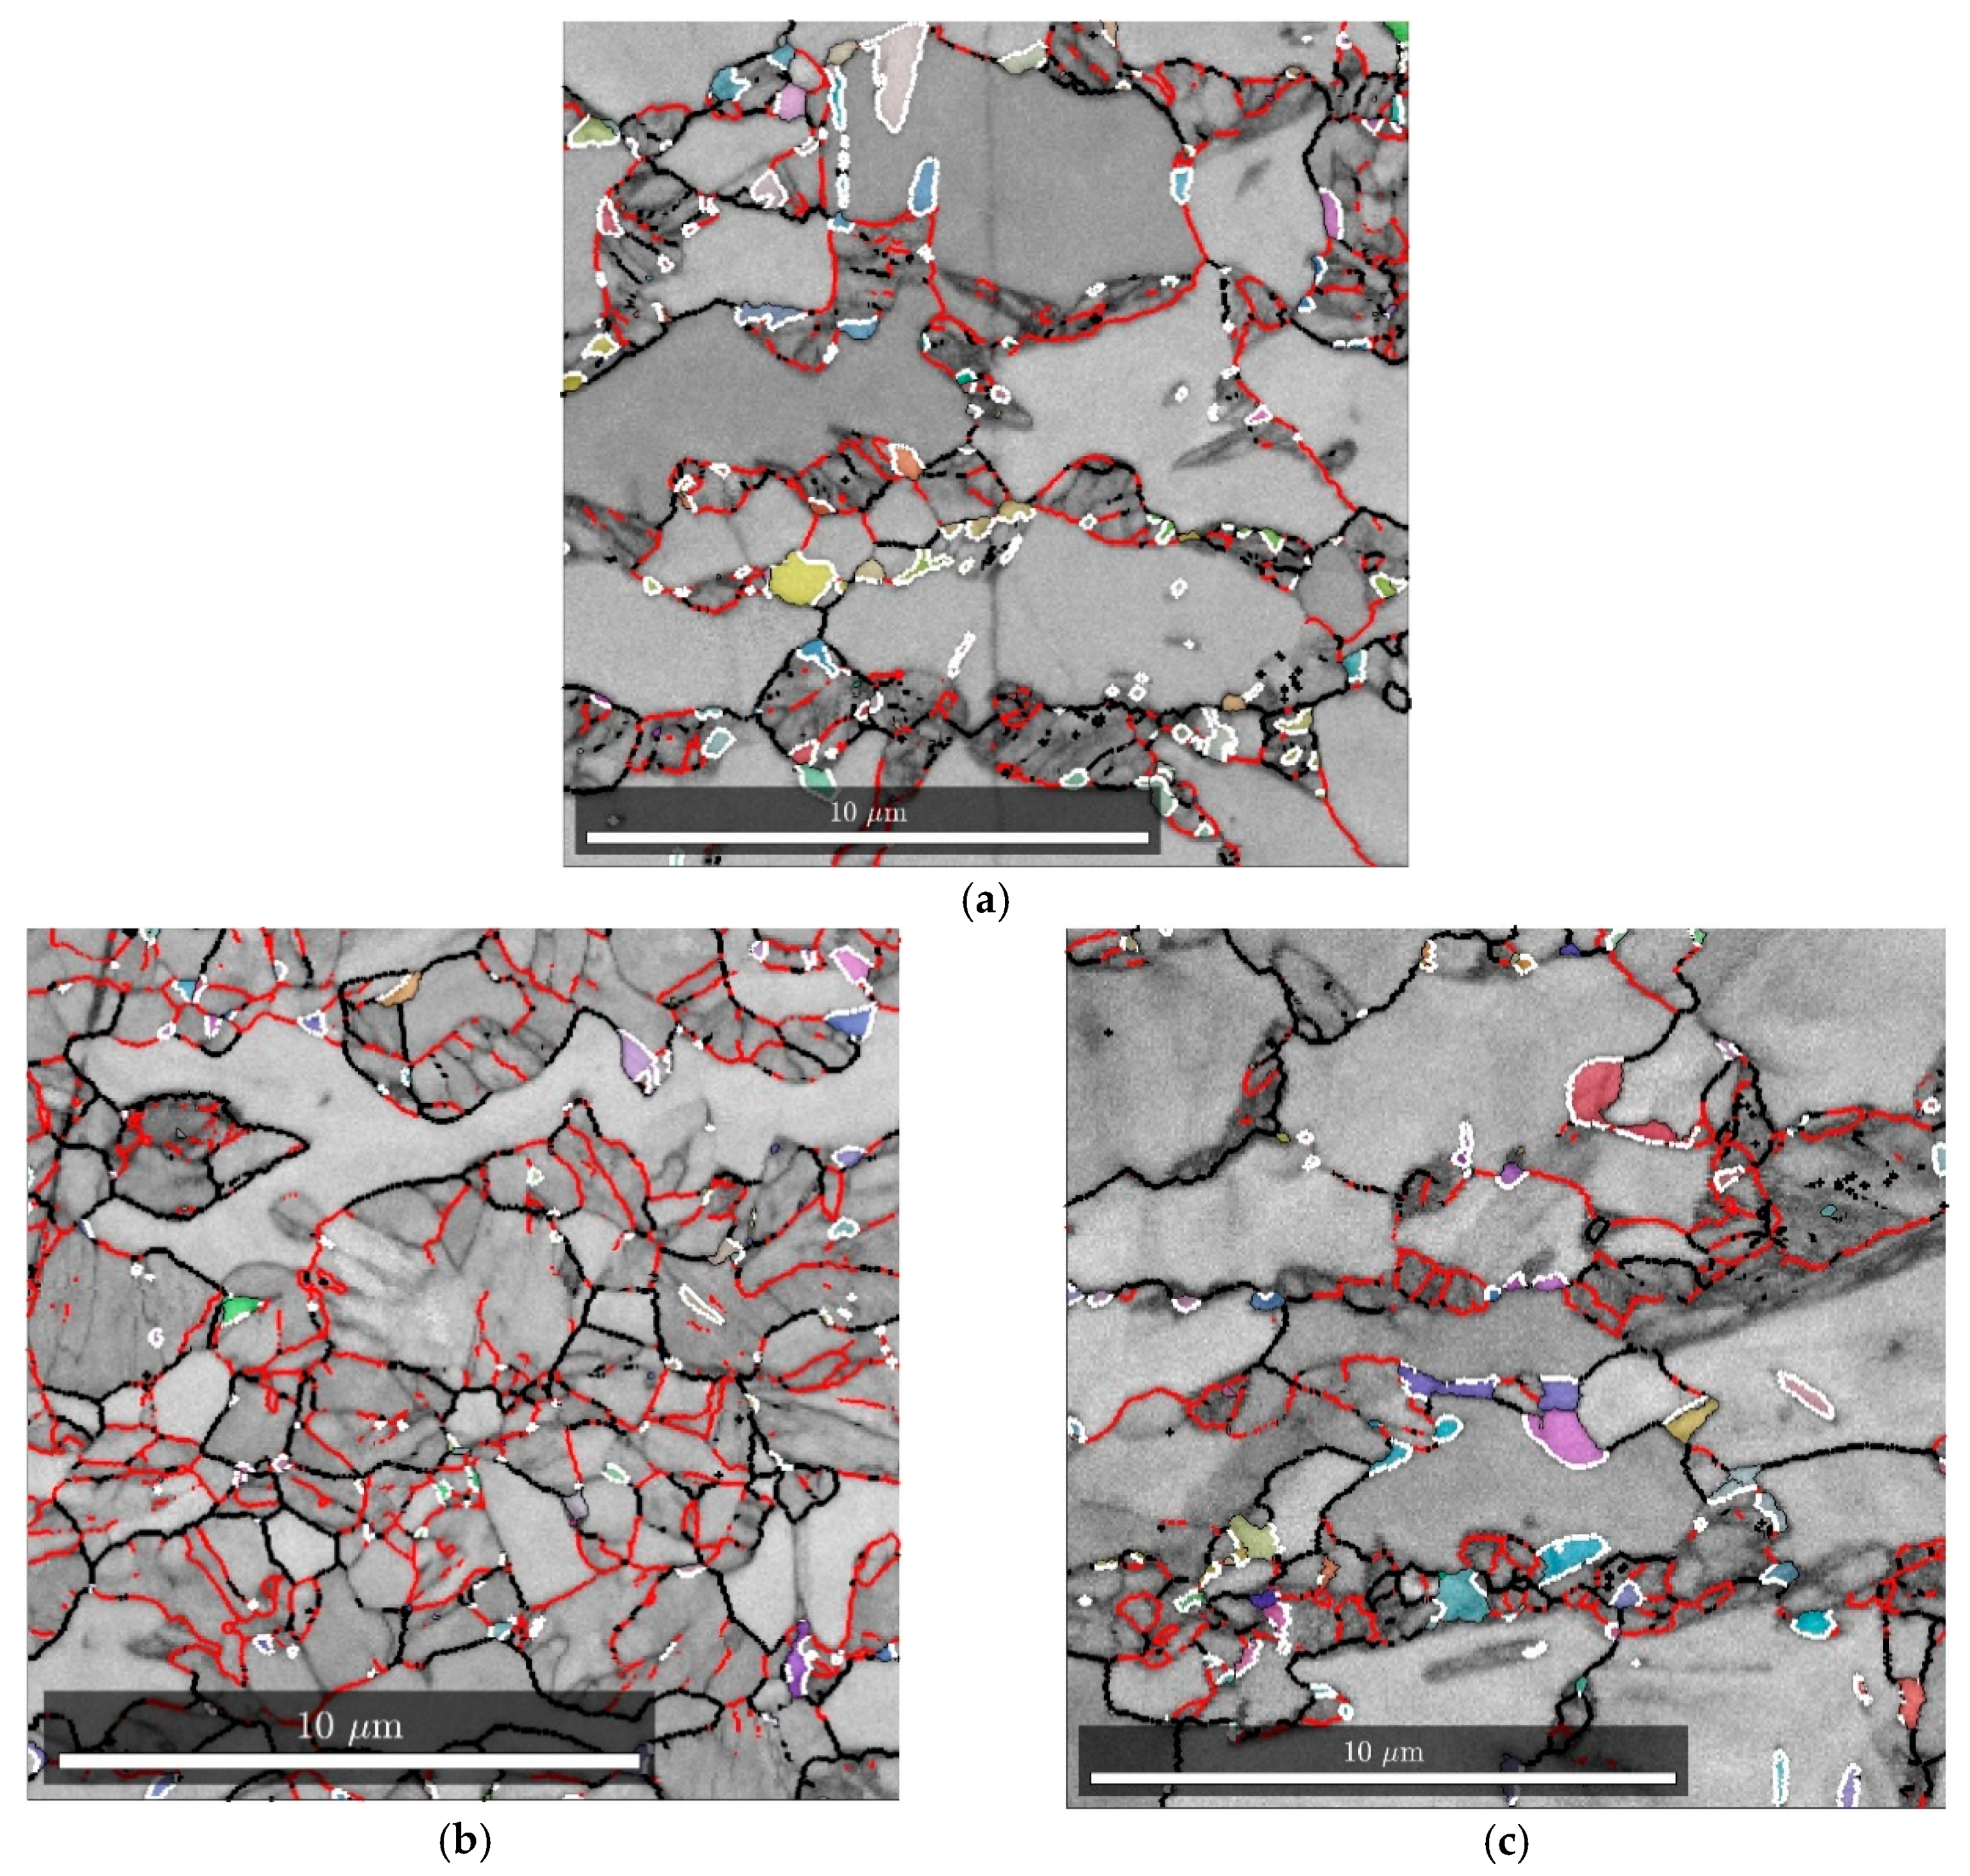
Mf is an indistinct term. It is therefore probable that the martensitic transformation is not actually homogeneous in the microstructure and the degree of transformation varies from grain to grain. This conclusion is supported by the EBSD maps in
Figure 11a, which shows a heterogenous martensitic transformation. The behavior of Steel C appears to follow a similar trend, based on the image analysis, XRD and EBSD results.
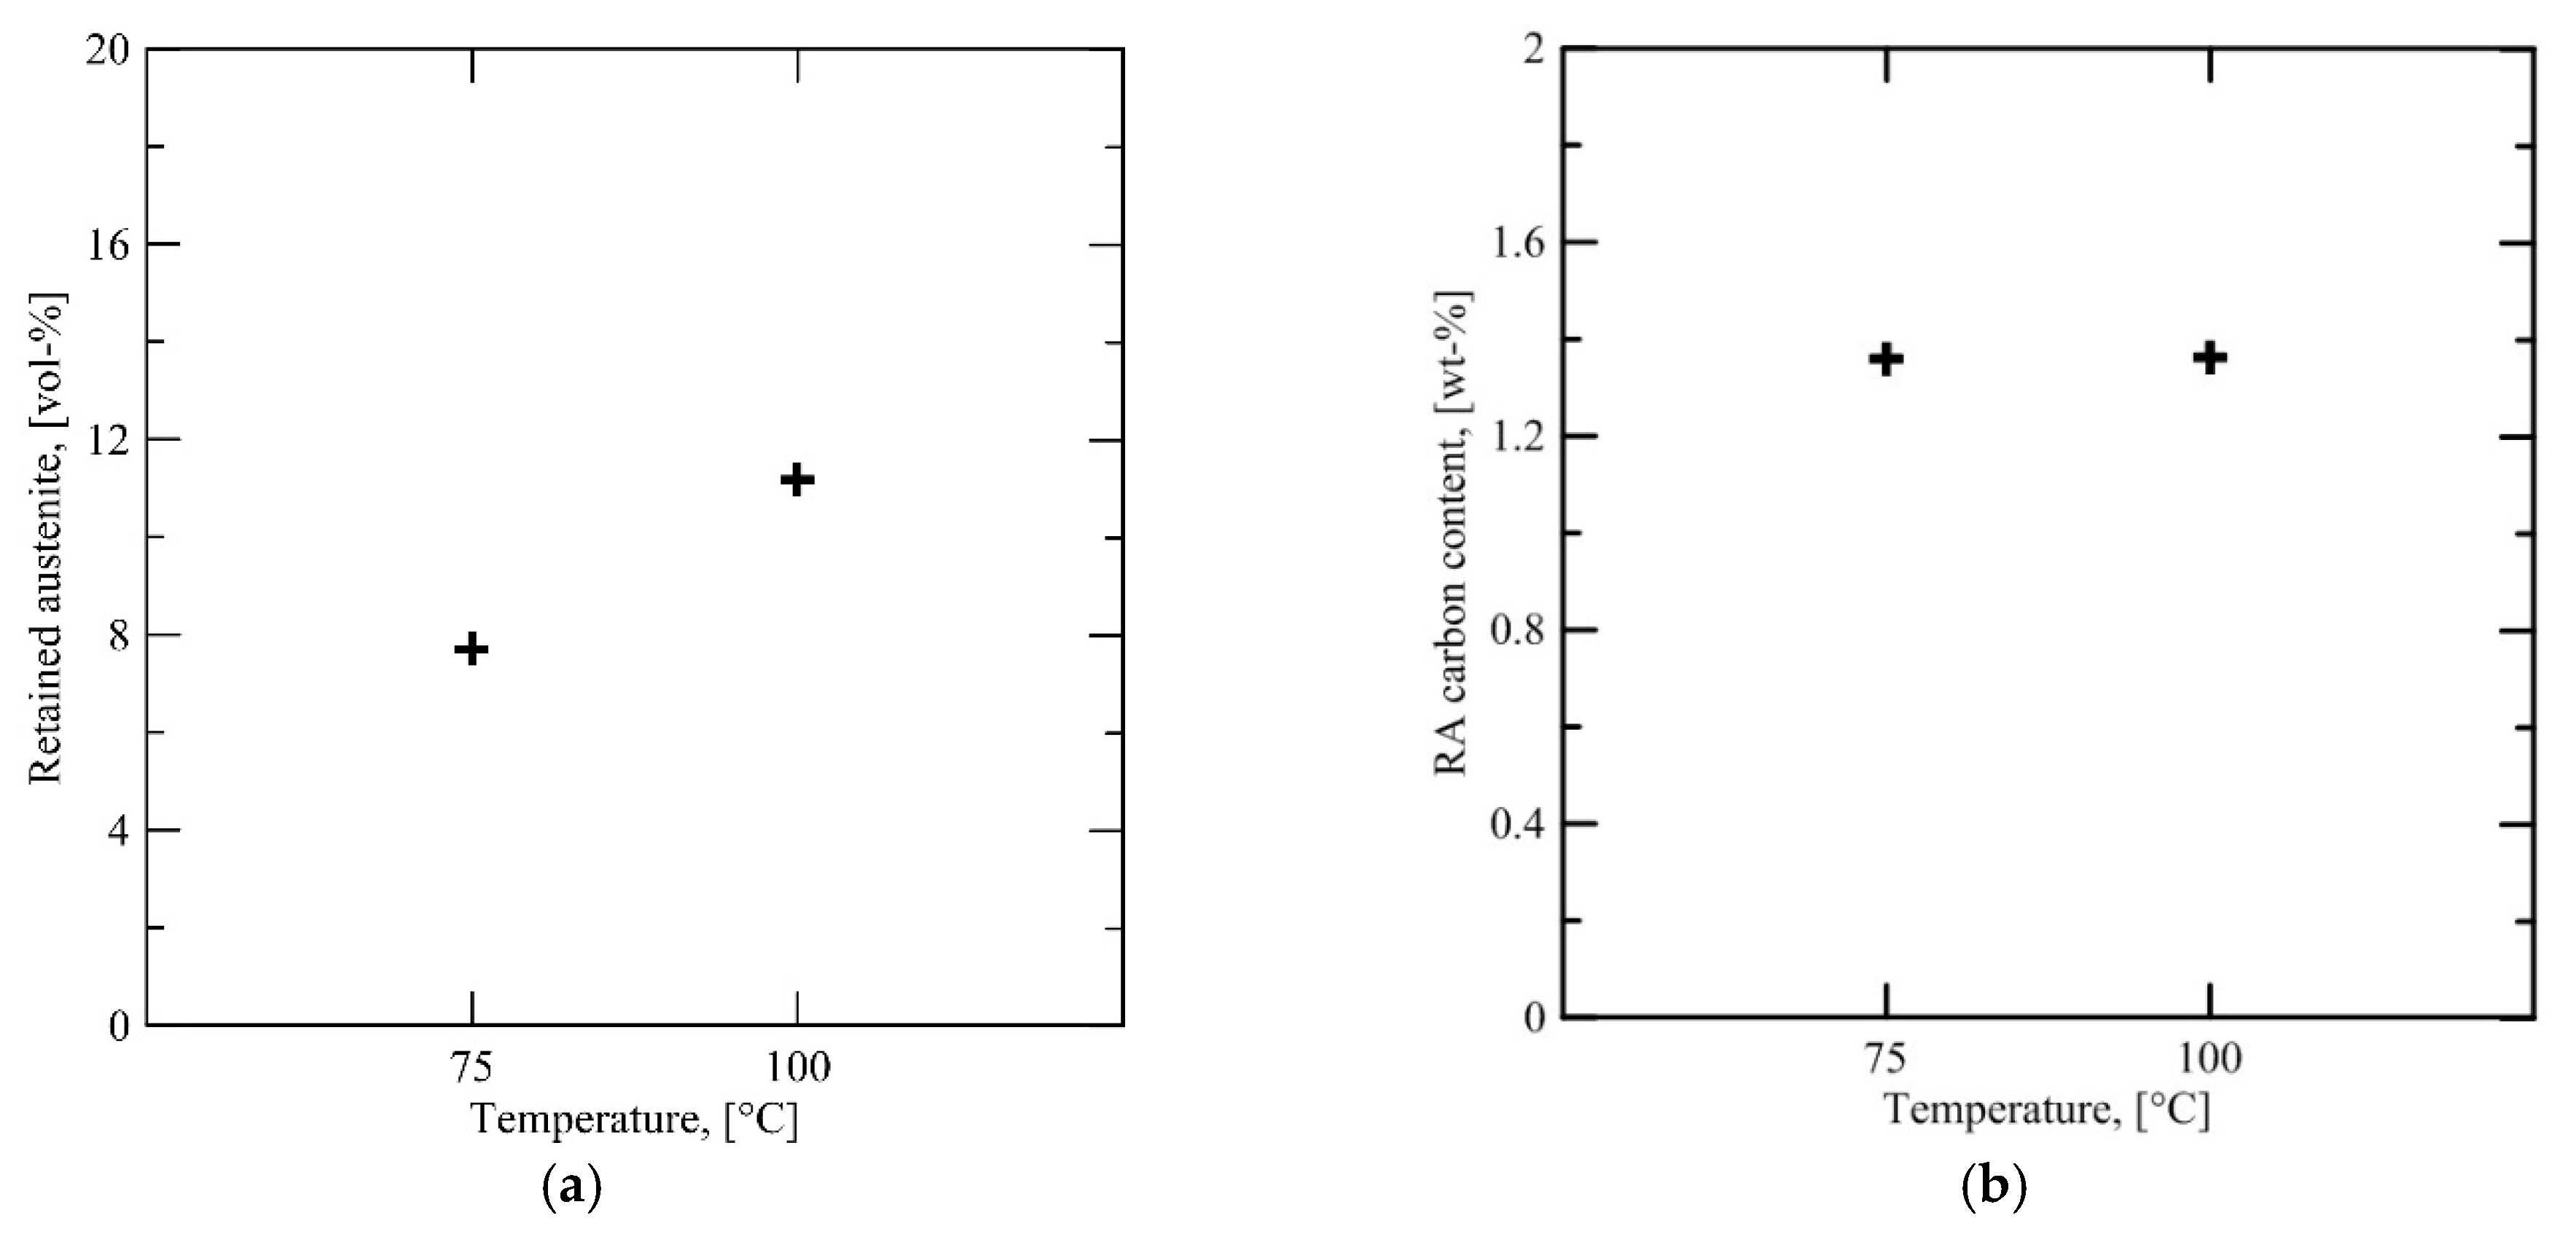
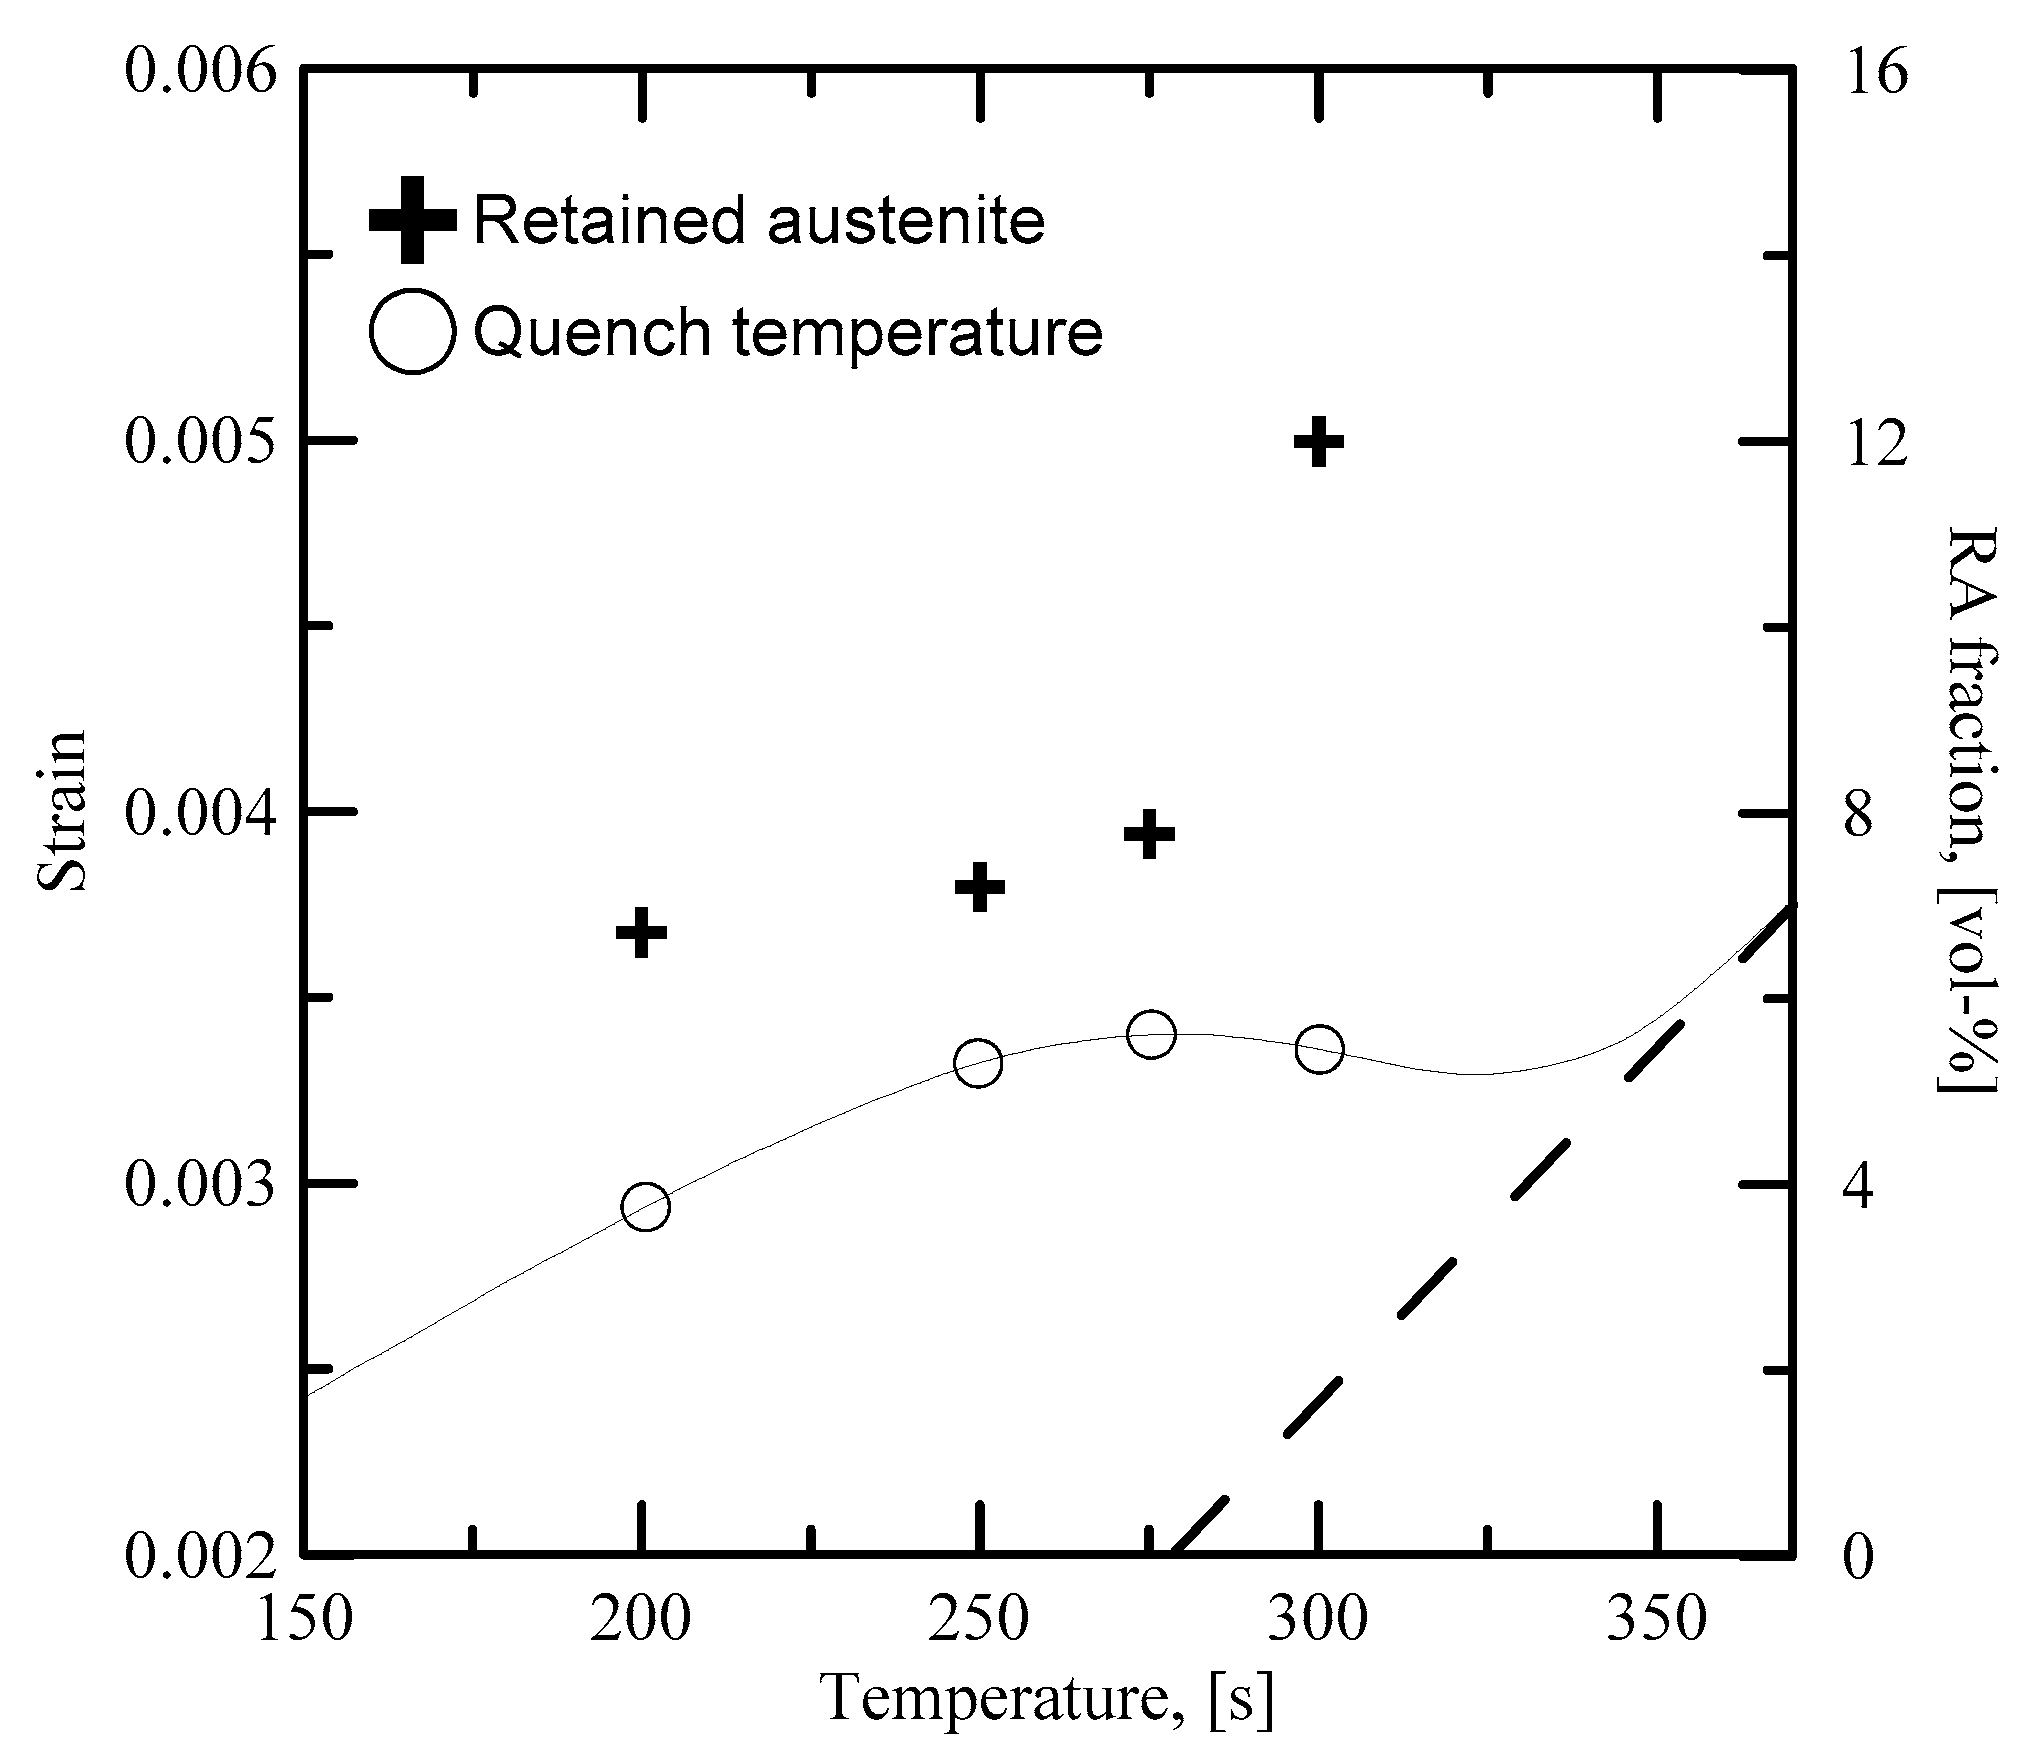
The behavior of Steel B differs from that of Steels A and C. Instead of a steady reduction in austenite fraction, there is an initially high amount at QT = 300 °C followed by an appreciable drop at QT = 275 °C to a nearly stable austenite fraction irrespective of further QT temperature reduction.
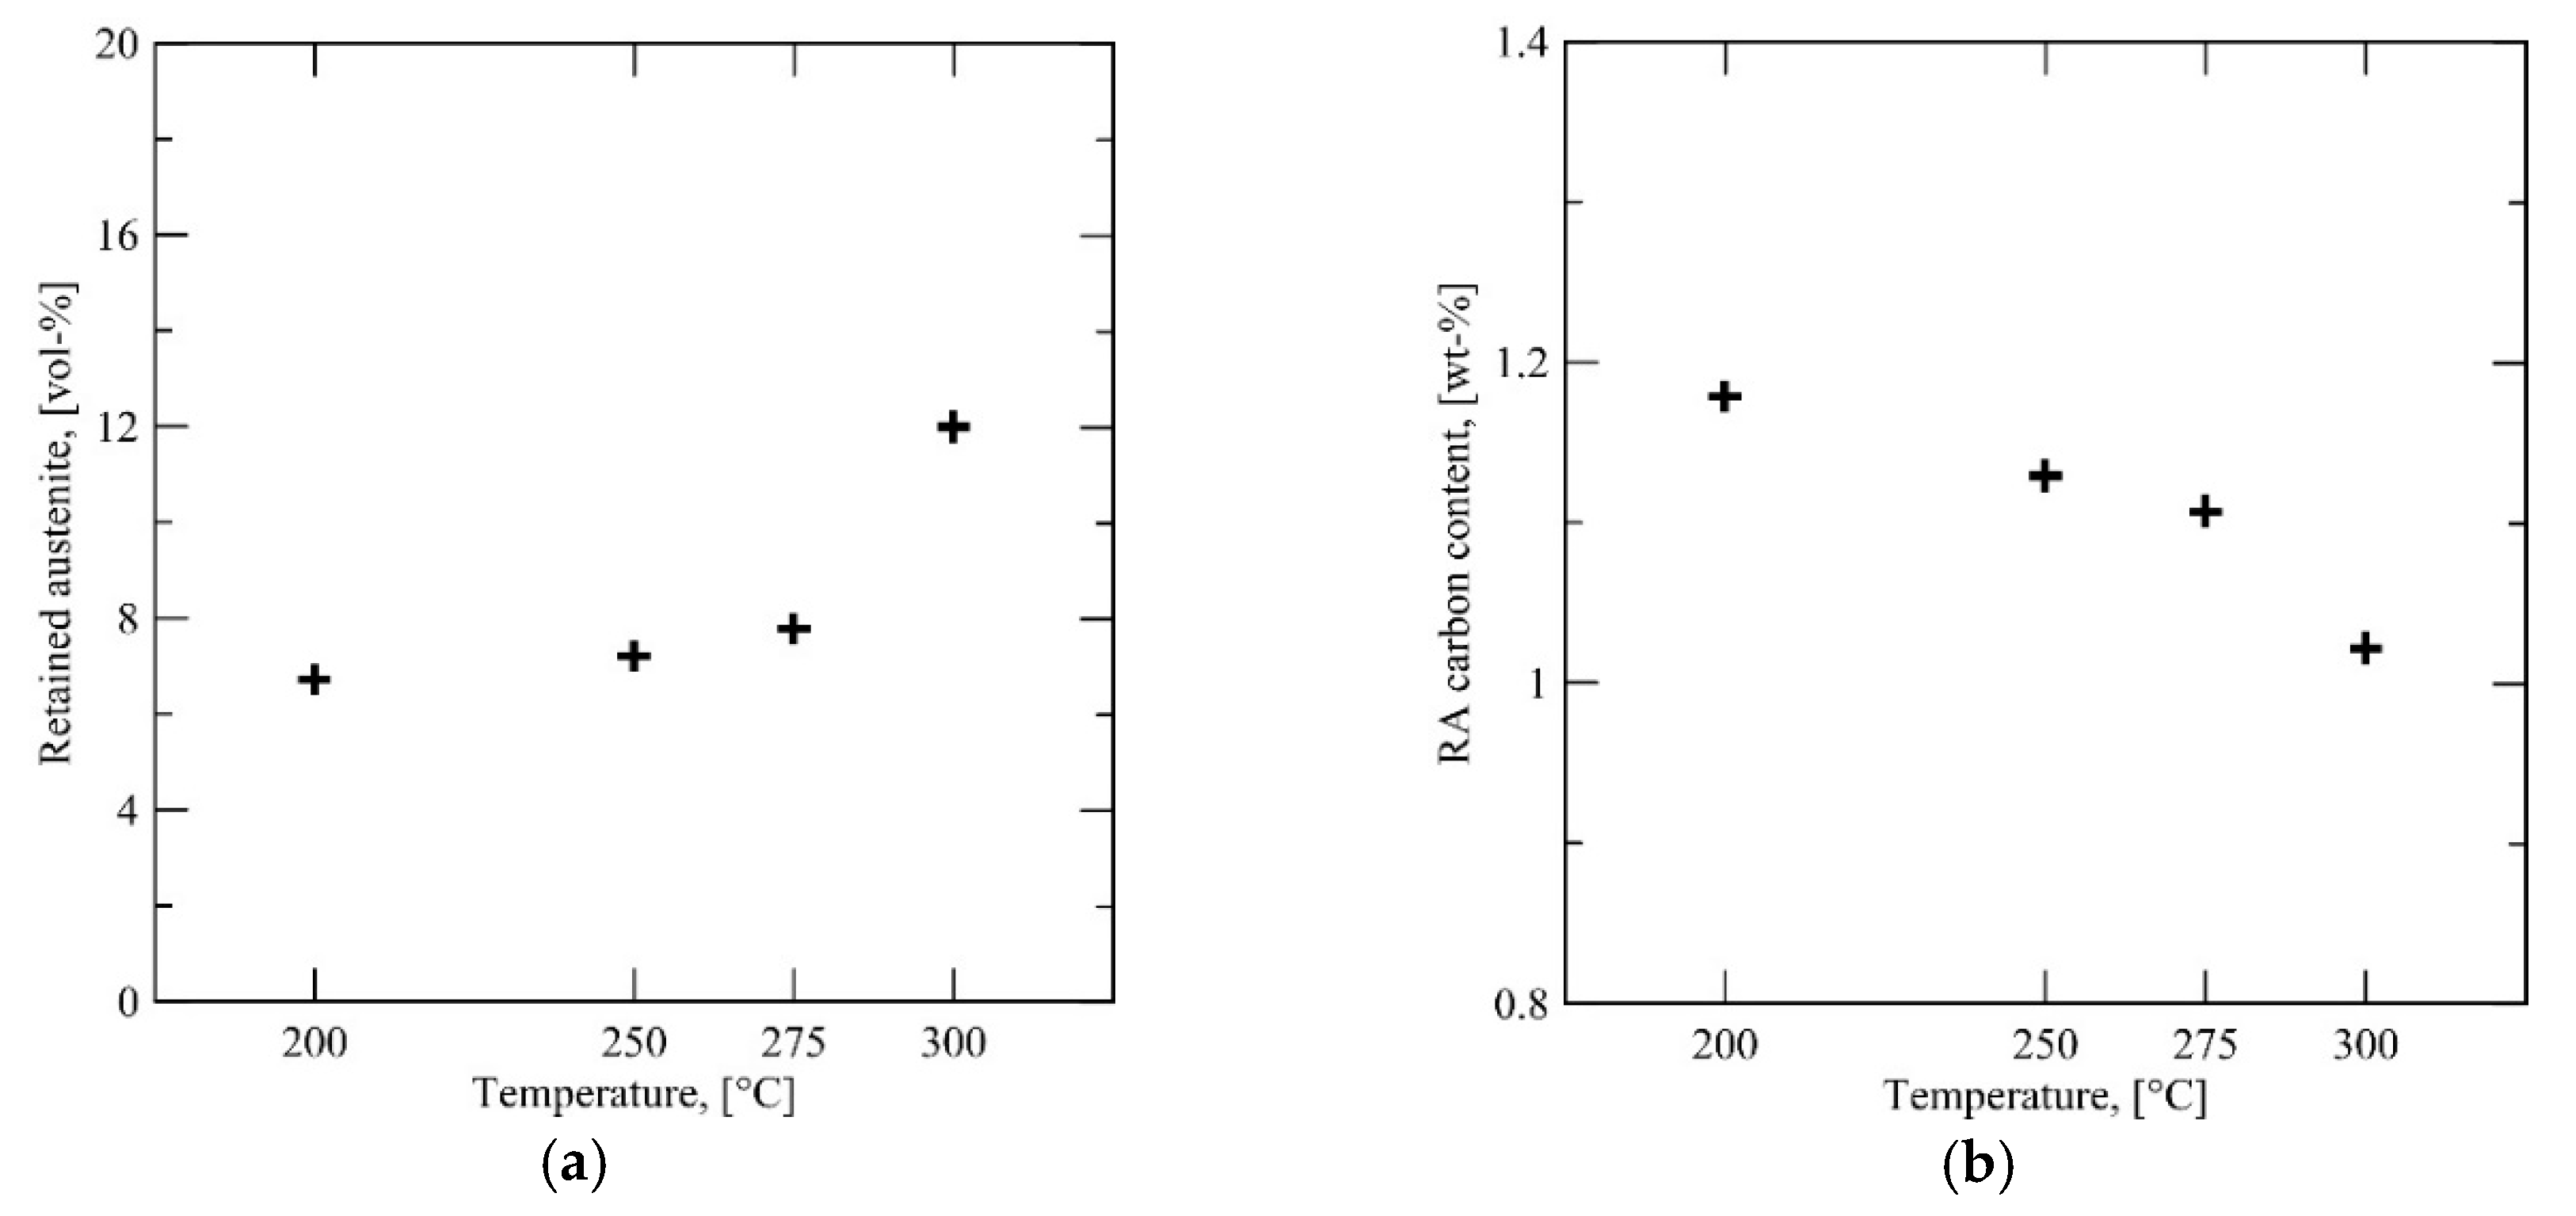
As shown by
Figure 4b, there is much more austenite in the microstructure of Steel B after intercritical annealing compared to Steels A and C. This has two consequences—the average carbon content of the austenite is significantly lower (assuming total partitioning of carbon) and austenite grain size is higher. Both factors lower the critical driving force necessary for martensite nucleation, contributing to the rapid formation of martensite when lowering
QT past 300 °C. It is possible that autocatalytic nucleation (“burst martensite” [
28]) accelerates the rate of transformation. The rapid martensite formation is shown in
Figure 13, which displays the retained austenite content with respect to
QT overlaid with the dilatation curve in the temperature regime of the martensitic transformation.
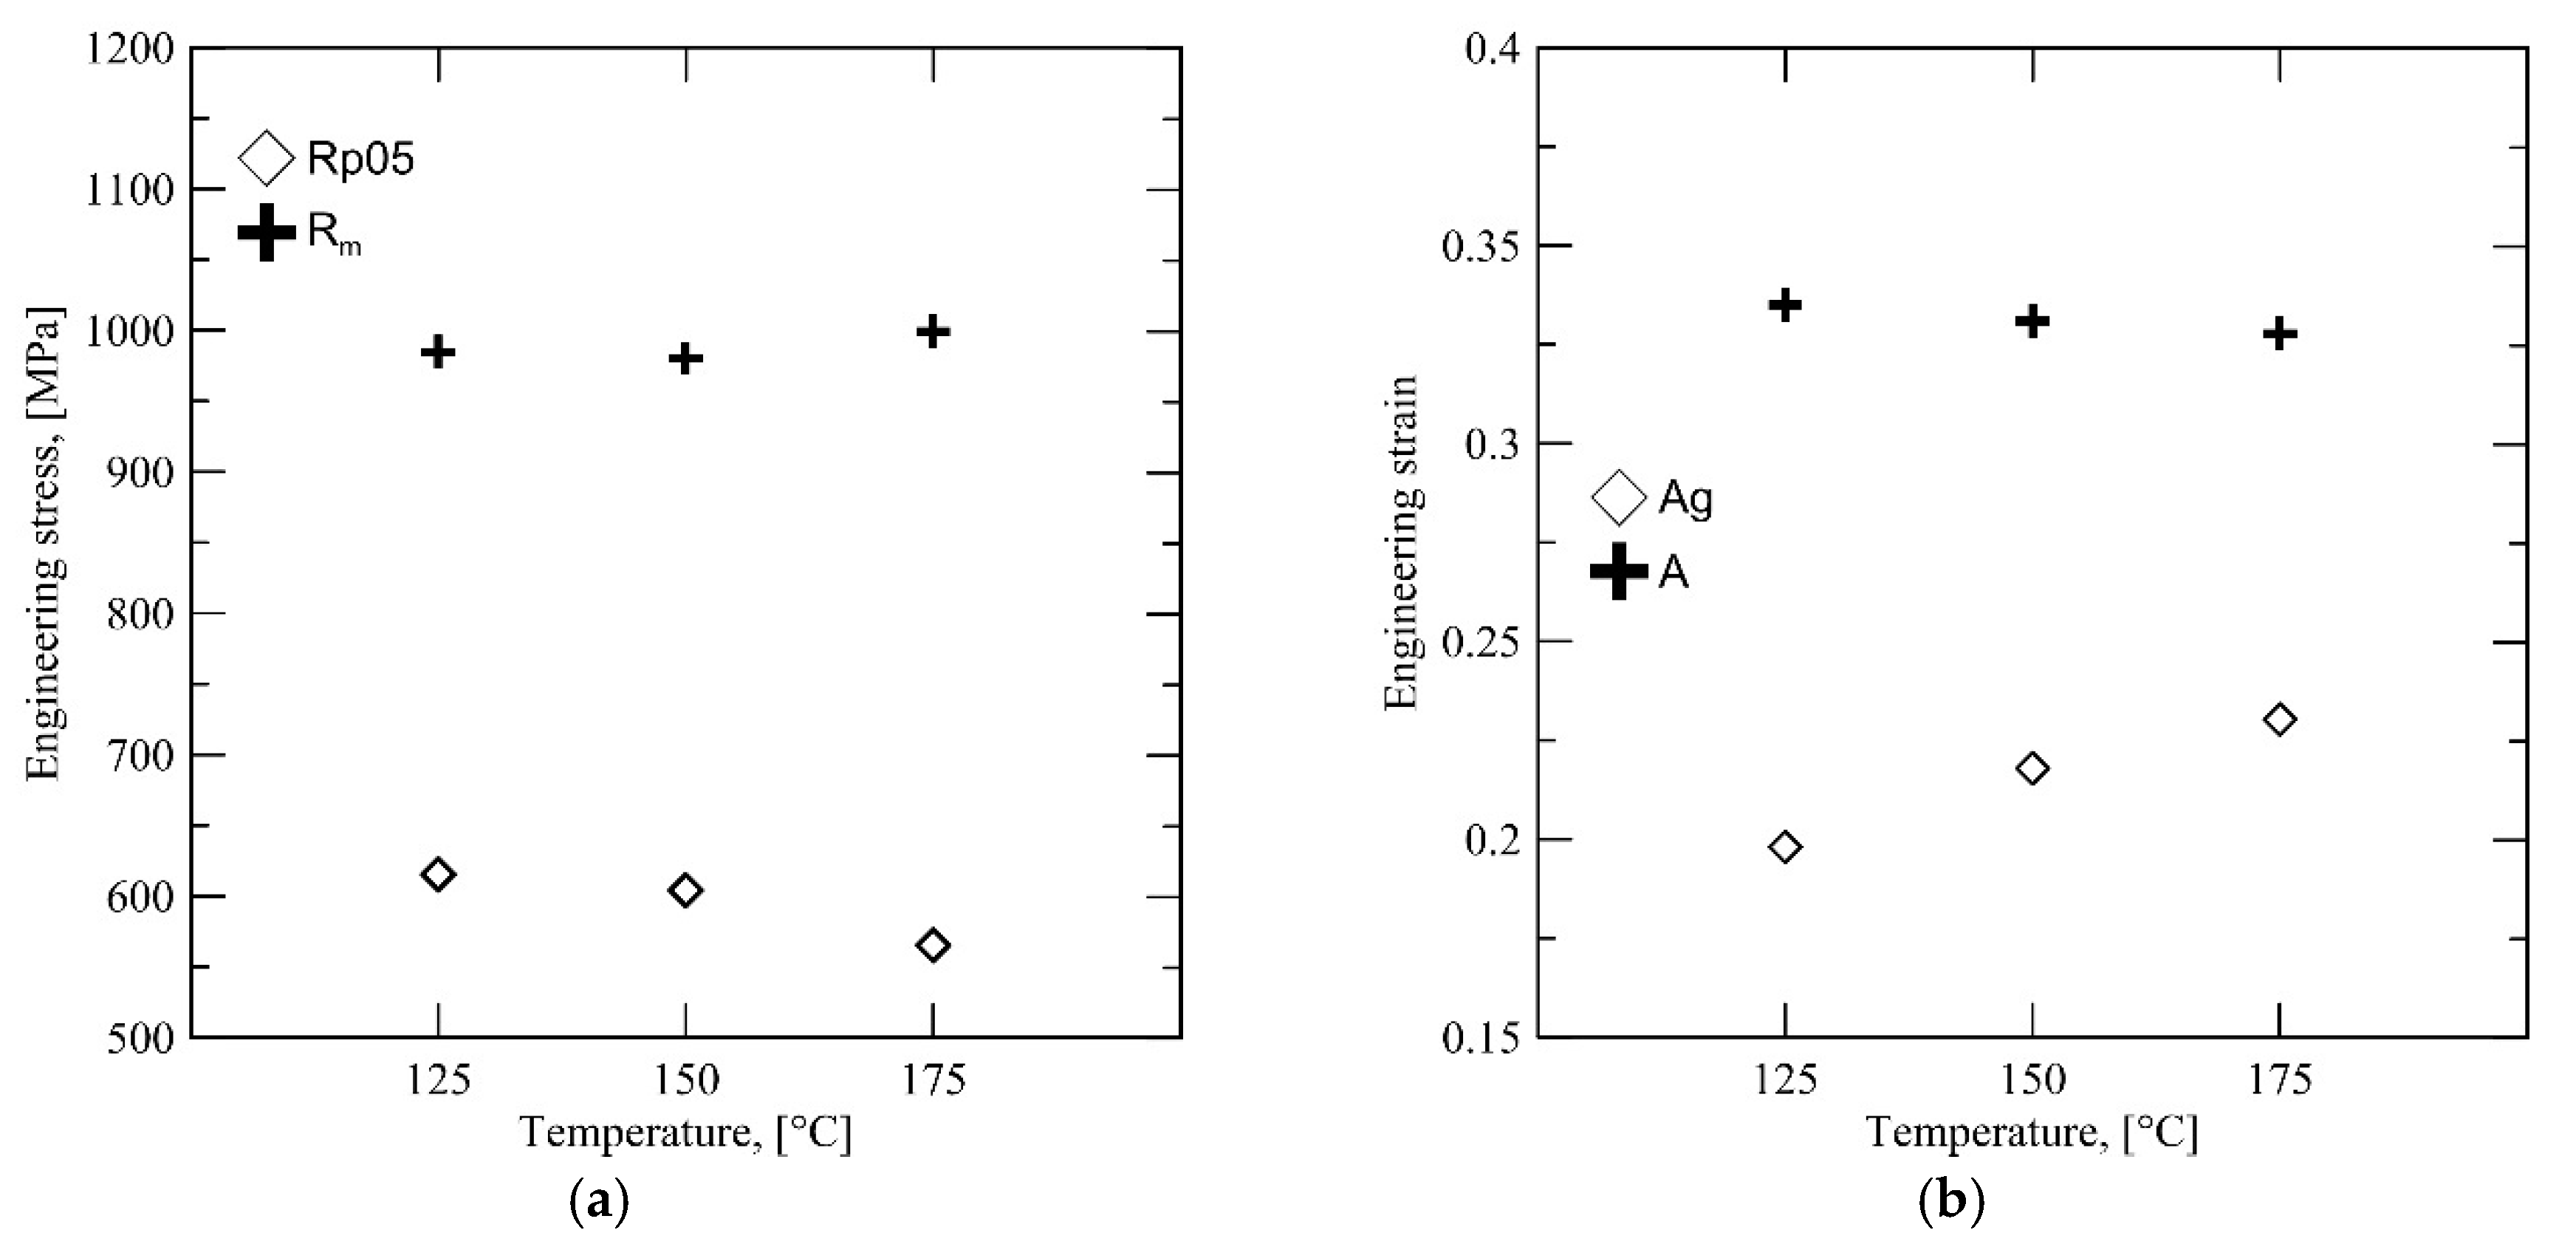
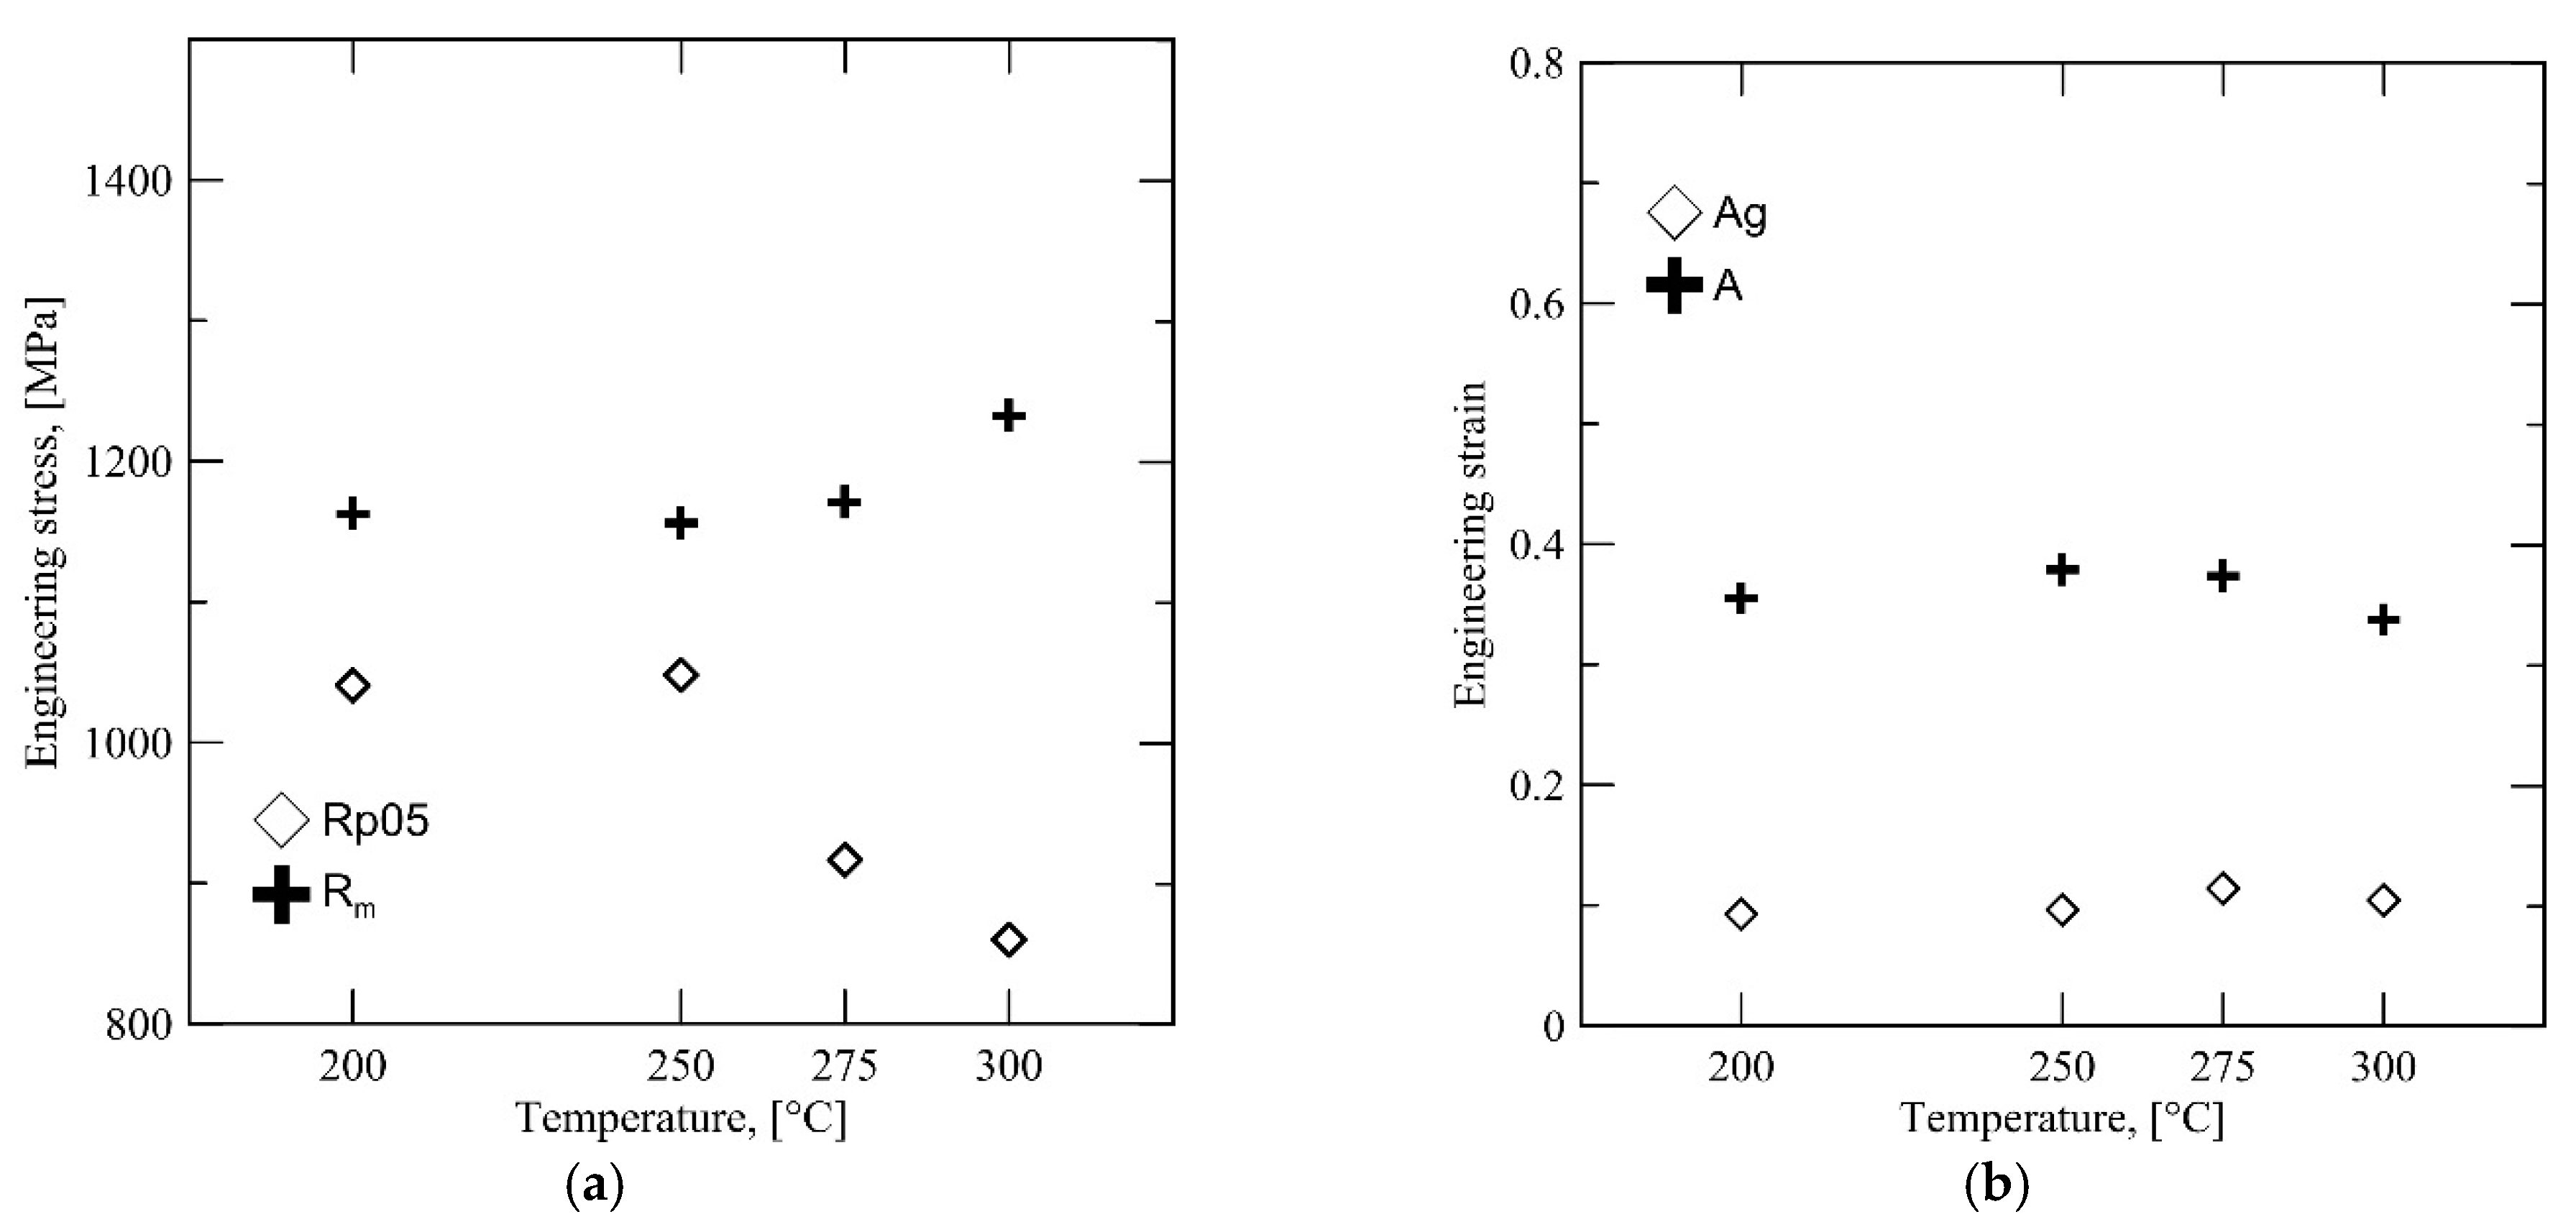
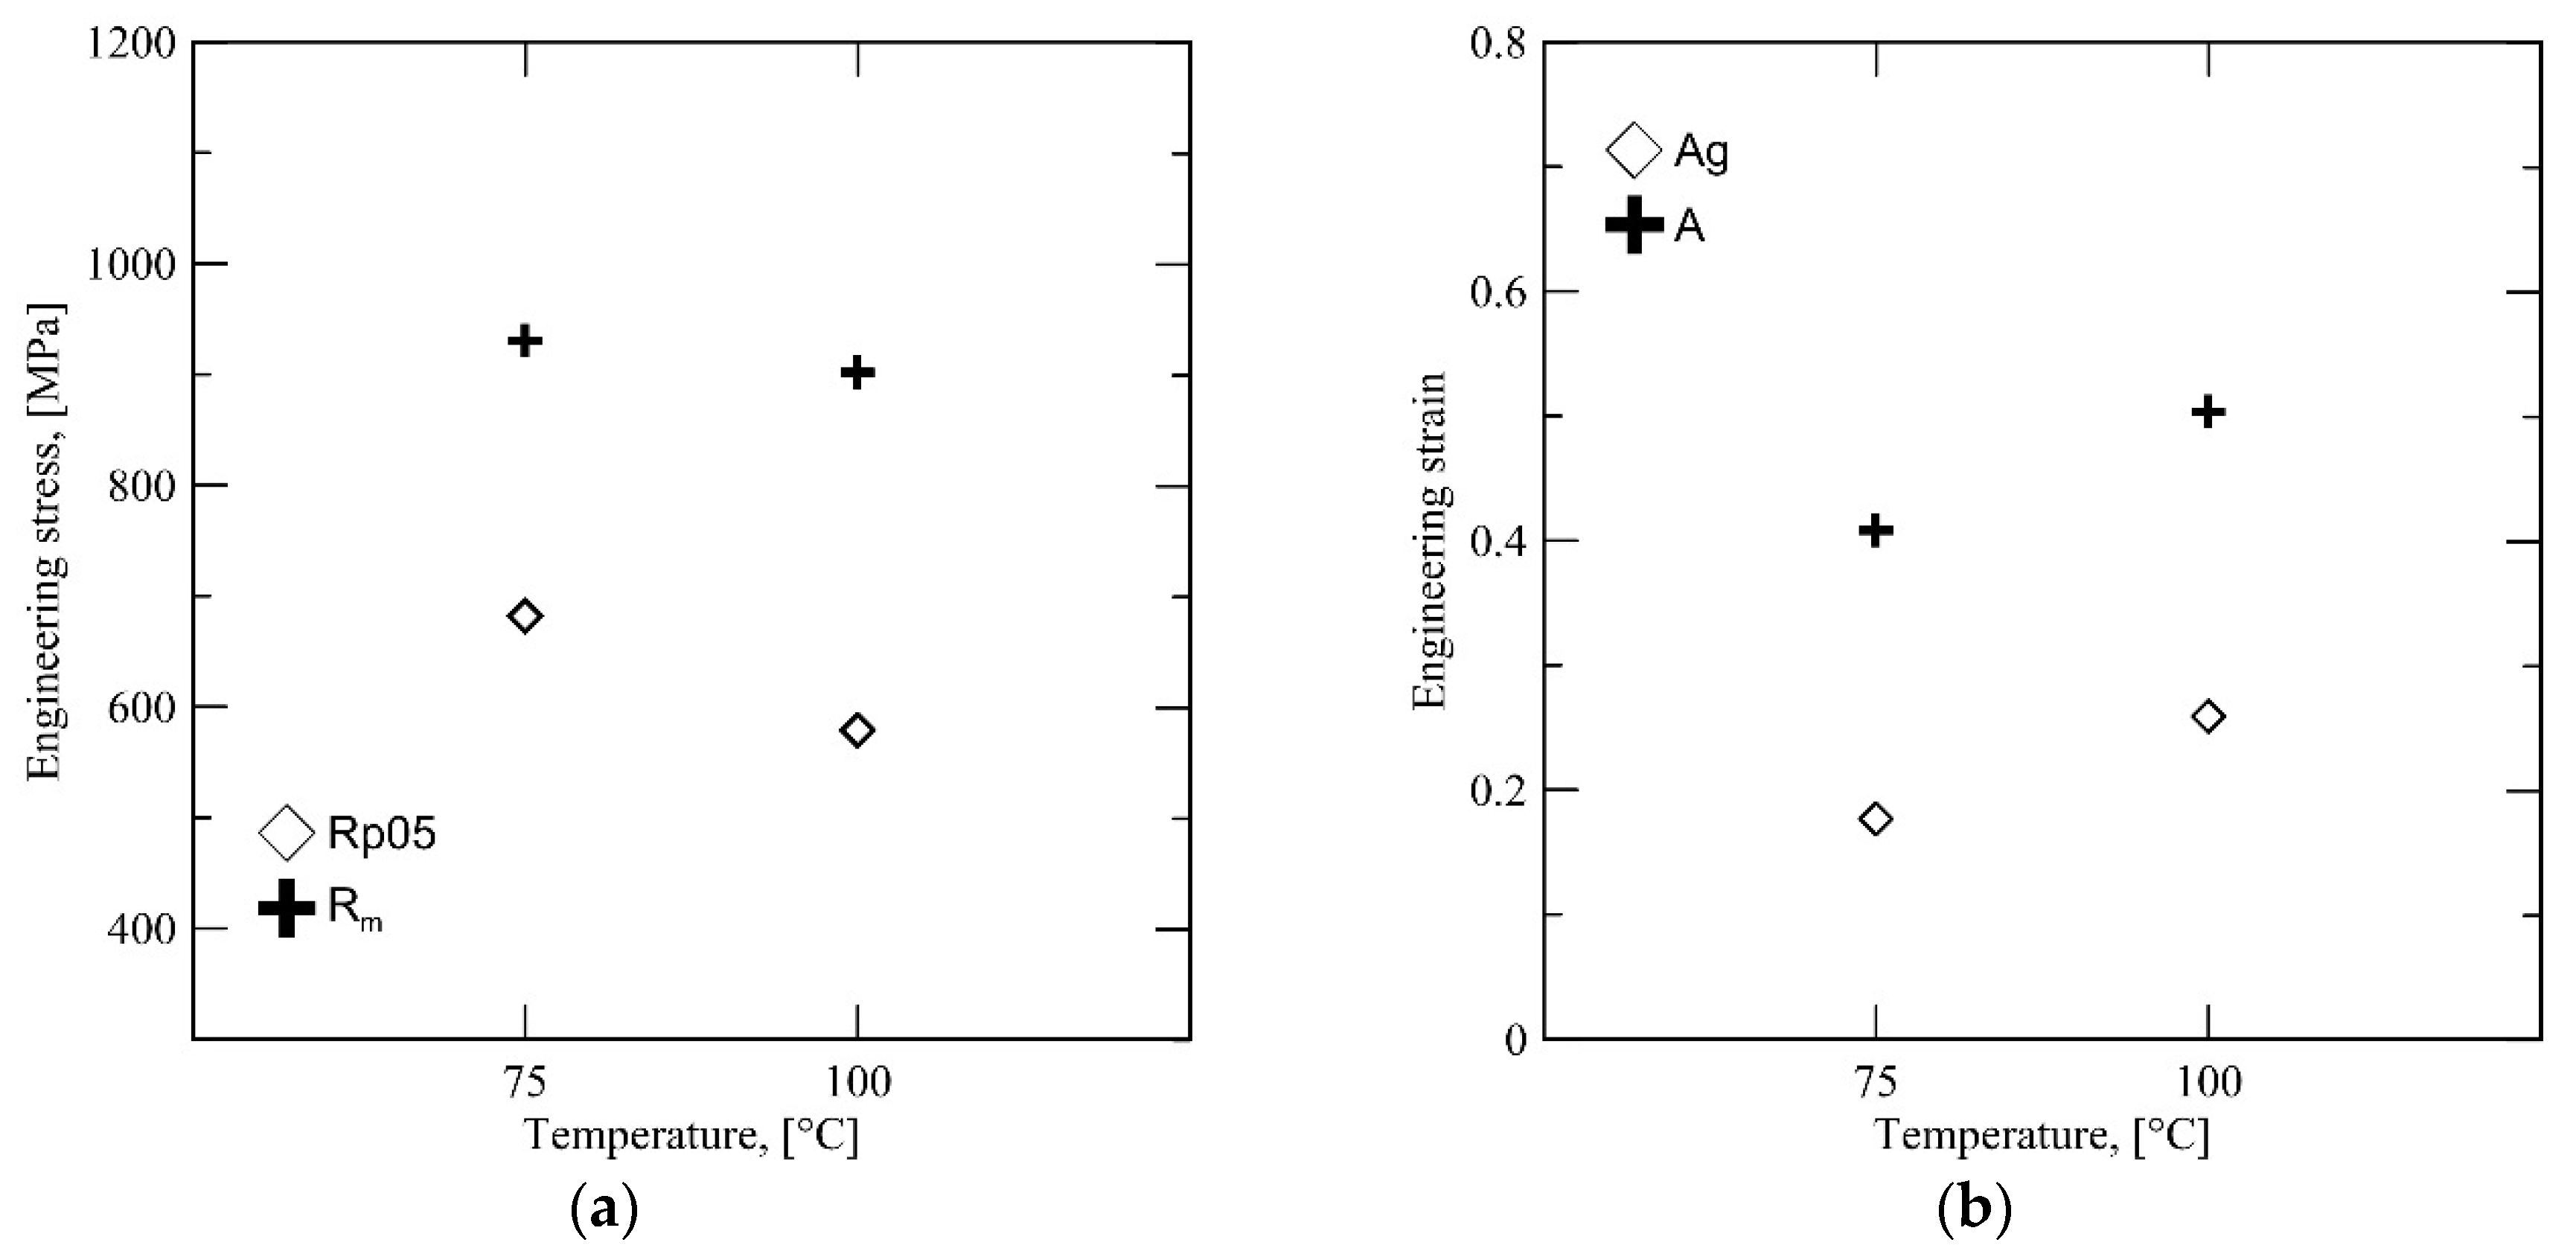
Interestingly, the uniform elongation
Ag does not correlate with the high retained austenite content at 300 °C. Instead, there is a significant drop in yield strength, accompanied with a significant rise in
Rm, as shown by
Figure 9. This behavior is likely to be caused by a combination of both high retained austenite fraction and the effect of the different austenite morphology characteristic to this
QT.
Figure 8b shows that the average carbon content of the austenite phase after quenching to 300 °C is lower, which should also affect mechanical stability. The presence of unstable austenite grains results in a very high degree of strain hardening at the initial stages of deformation and consequently results in a high
Rm combined with a low initial yield point. The unstable austenite grains are unable to contribute to ductility during later stages of deformation, having been completely transformed at an earlier stage and resulting in a lower total elongation
A, as shown by
Figure 9b.
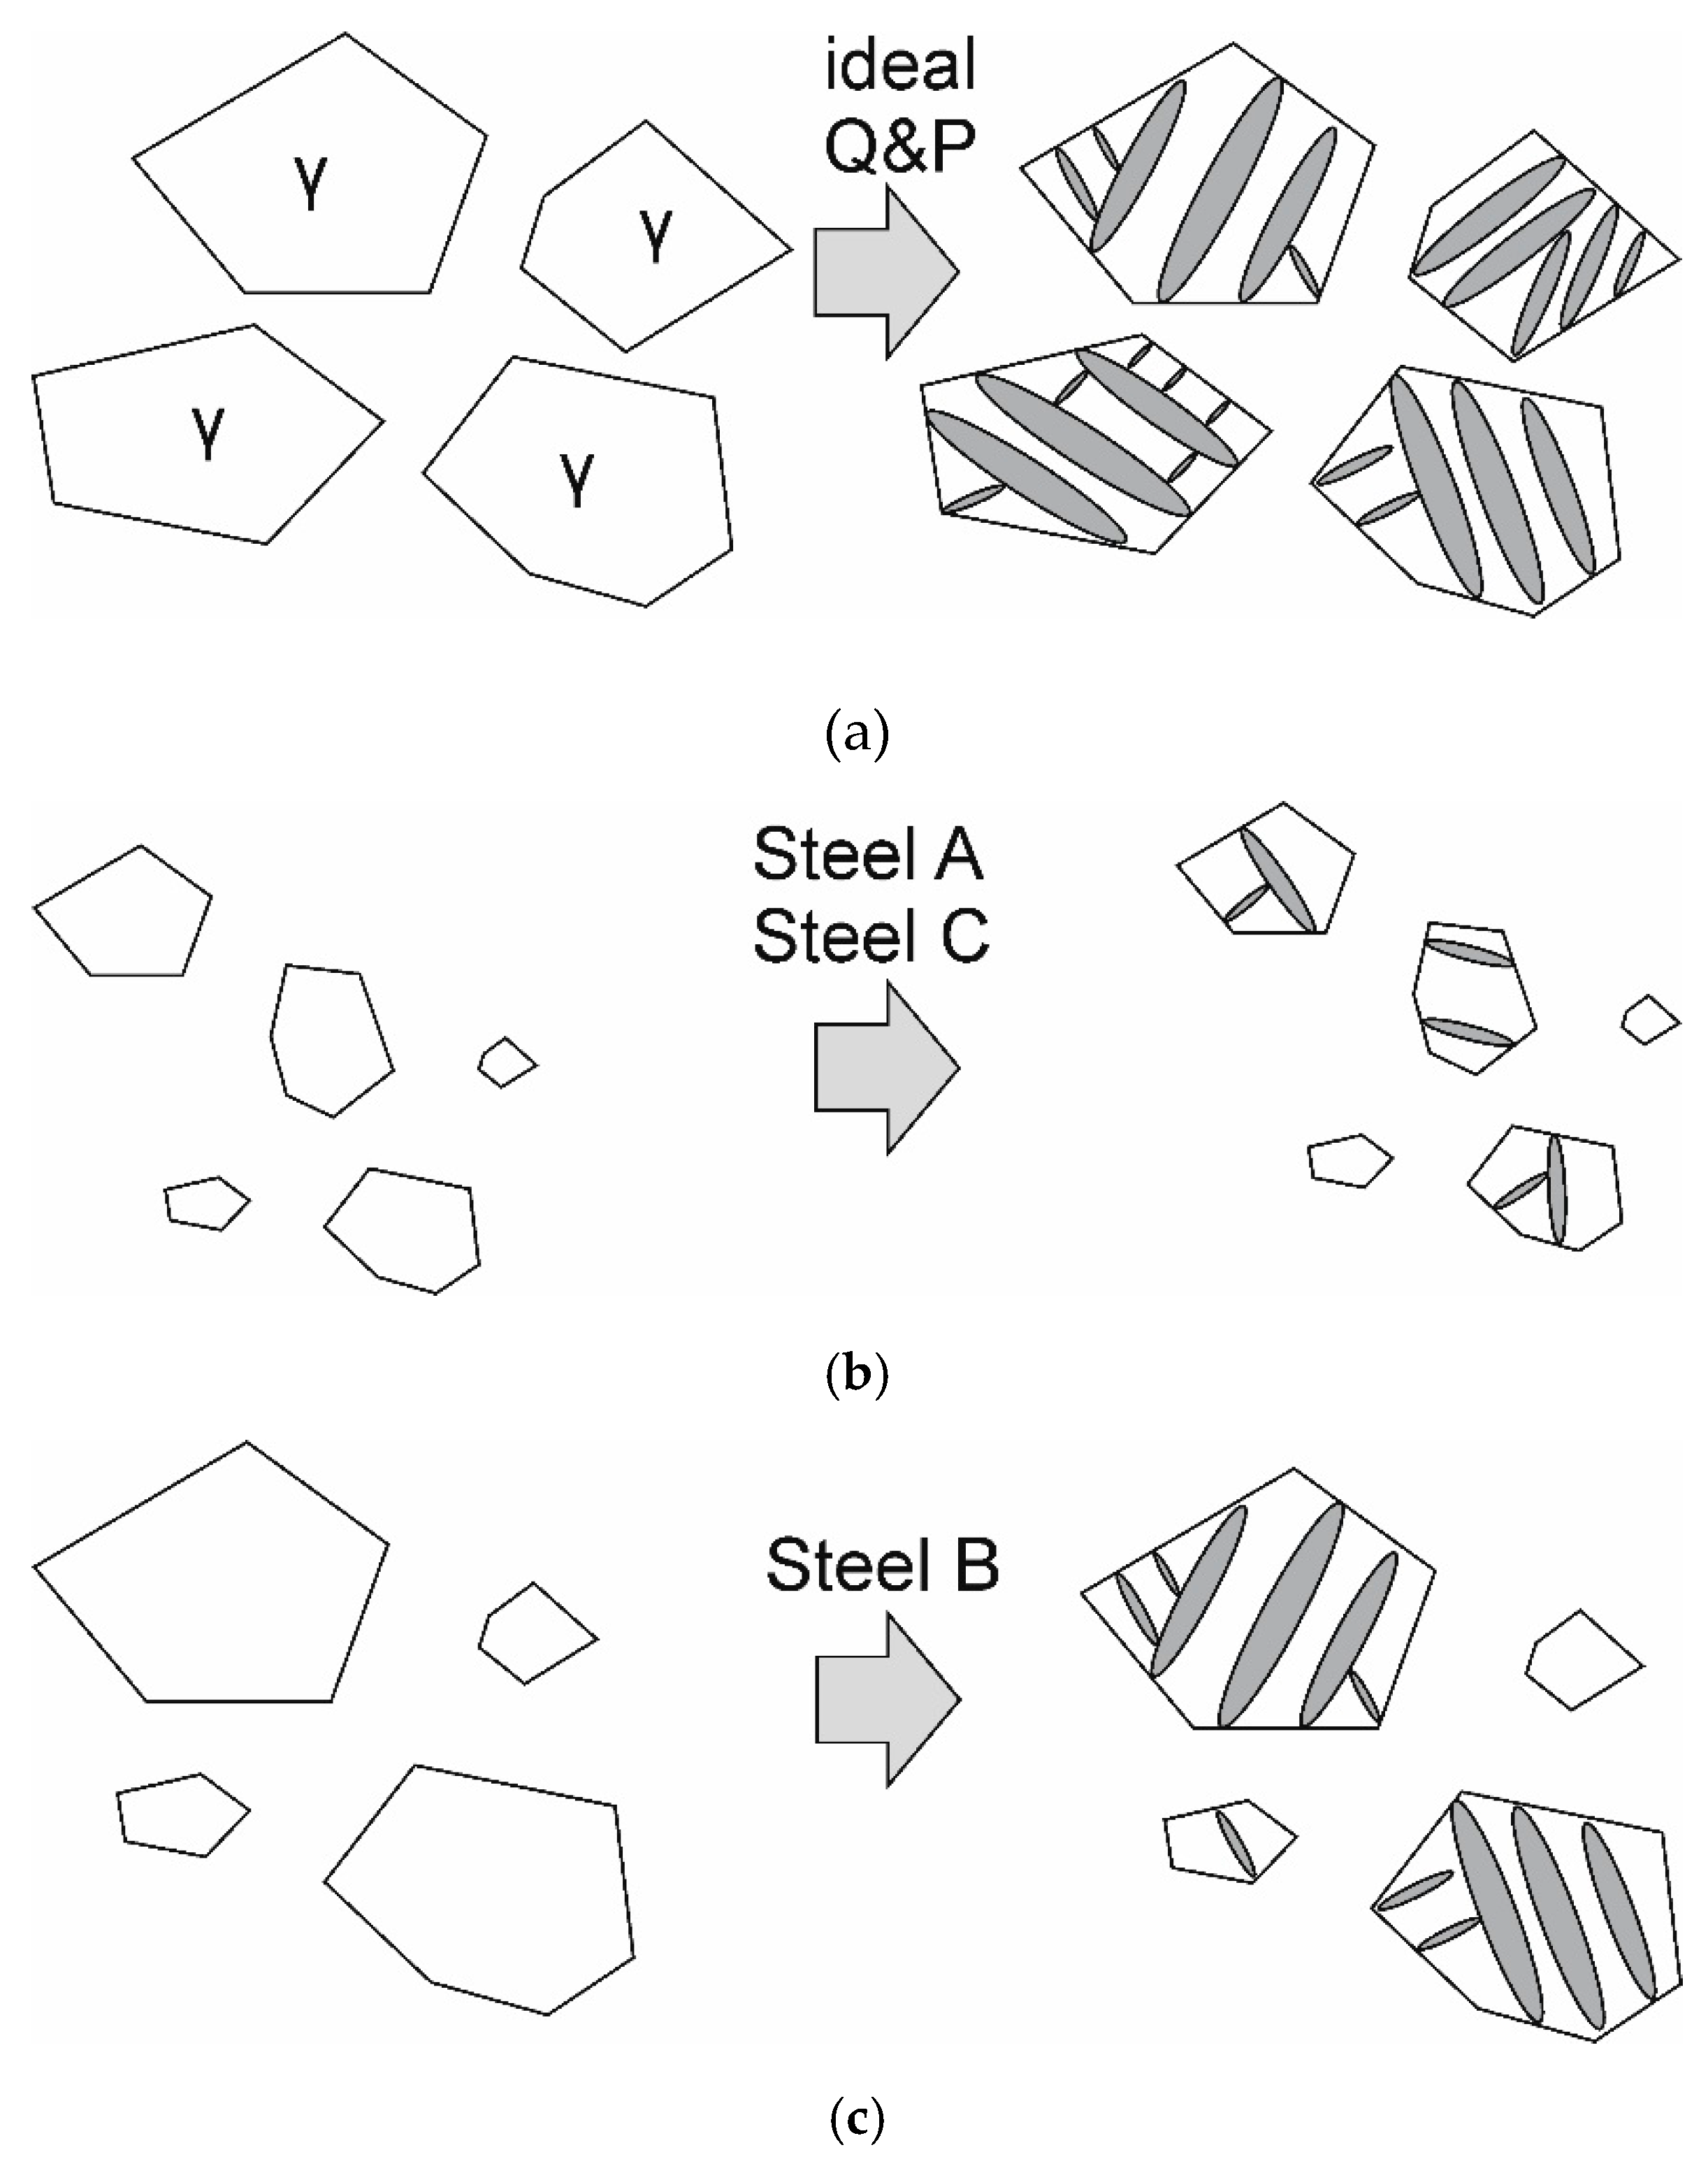
From a microstructure point of view, the expected response to the quenching and partitioning would be the partial transformation of each austenite grain into martensite, followed by the enrichment of the balance untransformed austenite with carbon. The final microstructure, shown in
Figure 14a, would then be a mixture of intercritical ferrite and martensitic islands interspersed with carbon-enriched retained austenite in martensite.
This type of microstructure was not observed in any of the studied grades. Instead, a complex microstructure had emerged in all cases consisting of intercritical ferrite, untransformed austenite grains and prior austenite grains in which the martensitic transformation had progressed to some degree.
This behavior can be attributed to two factors—the local chemical composition and the size of each austenite grain. During intercritical annealing, austenite will form at low-energy sites that are favorable towards nucleation [
10]. In practice, this means ferrite grain boundaries and grain corners where the dissolution of cementite or other carbides has formed a carbon-rich volume suitable for nucleation. The stage of the annealing cycle at which each austenite grain nucleates will be decided by these local conditions. The growth rate of a nucleated austenite grain will, in turn, initially depend on the carbon content of the nucleus and at later stages the diffusion barrier formed by ferrite-stabilizing elements. In the case of the studied experimental steels, the primary element limiting austenite growth is aluminum, which is a strong ferrite stabilizer. As the austenite growth front advances, more and more aluminum will diffuse across the advancing front, until the aluminum content is high enough in the interfacial ferrite neighborhood and the growth slows down significantly.
The behavior during intercritical annealing can thus be characterized by a slow and uneven growth of austenite. Just prior to cooling, a microstructure has formed where exists a range of austenite grains with different sizes and chemical compositions. Such intercritical austenite microstructures are outlined schematically in
Figure 14b,c.
Steel A and Steel C exhibited microstructures and mechanical properties quite similar and will be discussed together. Both steels have a similar chemical composition, with the notable differences being an elevated manganese content and a lower aluminum content in Steel A. This difference, along with the lower aluminum content, resulted in a slightly elevated austenite volume fraction after intercritical annealing in Steel A. In any case, both steels exhibit the type of intercritical austenite structure shown in
Figure 14b, in which there are both very small and slightly larger austenite grains in the microstructure after annealing. When the steel in this condition is quenched to the quench temperature
QT, primarily the larger, less stable austenite grains undergo a martensitic transformation, while the smaller, more stable grains remain unchanged. The less stable retained austenite is then stabilized with carbon during the partitioning stage. The result is a microstructure where the large, less stable austenite grains have become more refined and chemically stable due to martensitic transformation and subsequent rejection of supersaturated carbon during partitioning. Although only the larger austenite grains exhibit the expected quenched and partitioned response, the final result is a more homogenous, refined microstructure in terms of austenite stability, leading to the observed improvement in uniform elongation. Similar results have also been previously observed for steels with higher aluminum contents [
3].
The quenching and partitioning response of Steel B is mostly explained by a greater fraction of intercritical austenite, along with a large distribution of austenite grain sizes and a larger average grain size overall. For Steel B, it is likely that bainite or isothermal martensite formation has occurred during partitioning, indicated by the large, irregularly shaped laths in
Figure 11b. Another factor supporting bainite formation during partitioning is the high volume fraction of intercritical austenite (approximately 65 vol %). At 65 vol % austenite, assuming full partitioning of carbon, the austenite carbon concentration would be approximately 0.17 wt %. Compared to the Steels studied here with lower intercritical austenite fractions and consequentially higher carbon concentrations, Steel B is more amenable towards bainite (or, keeping in mind the high aluminum content, carbide-free bainite) formation during partitioning.
When Steel B is quenched to a sufficiently high temperature (in this case, 300 °C), the situation is similar to that observed for Steel A and Steel C: the smaller grains are left almost fully austenitic, while the larger grains transform to a greater degree (either to martensite or to carbide-free bainite). However, in this case, the smaller grains are left more unstable in the final microstructure; these unstable grains are transformed to martensite during the early stages of deformation, becoming unable to promote ductility at later stages. The message of this result is that to increase ductility, the end goal of the heat treatment should not be a perfect quenching and partitioning response, but the presence of highly stable retained austenite that will transform at a controlled stage of deformation. For Steels A and C, the quenching and partitioning treatment can be successfully used to refine and stabilize blocky-type austenite and increase the ductility of the steel, while at the same time introducing martensite into the microstructure. For Steel B, this is also possible to some degree, even though the tendency to form bainite or isothermal martensite during partitioning affects the final austenite fraction.

 ,
, 


