1. Introduction
A fine and uniform grain size is desirable in steels, to provide high strength and good toughness, and this requires recrystallisation during thermo-mechanical processing. It is important to be able to predict the rate of recrystallisation and a number of relationships, based on the Johnson-Mehl-Avrami-Kolmogorov (JMAK) equation, that has been reported. The Avrami exponent in the JMAK equation is a key parameter and is generally fitted to experimental data. Whilst the initial grain size has been shown experimentally to affect the Avrami exponent, no method to predict the Avrami exponent for a given grain size distribution has been reported previously.
Controlling recrystallisation during hot rolling or annealing after cold rolling is important in generating a fine and uniform grain size microstructure [
1,
2,
3,
4,
5]. It has been widely accepted that recrystallisation primarily initiates in the heavily deformed material around grain boundaries, which is driven by the stored energy; and its reaction kinetics can be expressed as a function of the nucleation rate
and growth rate
[
6,
7,
8]. Thus, grain size and strain are two key parameters in predicting the recrystallisation kinetics. The classical model for recrystallisation kinetics is the sigmoidal time dependence of recrystallised volume fraction (JMAK model), where the recrystallised fraction
X can be expressed as:
where,
is the rate parameter (
f is shape factor,
for spherical nucleus) and
n is the Avrami exponent. The model assumes that the nucleation sites are randomly distributed and all nuclei grow isotropically at a constant rate [
3].
The Avrami exponent
n is supposed to depend only on time for the nucleation and growth rate of recrystallisation (i.e., temperature independent); for example, Sellars reported that the exponent showed independence to temperature and strain rate [
1]. Given the assumption of continuous or site saturated nucleation, and three-dimensional growth with a constant rate for recrystallisation, then the
n value should be four or three, respectively. However, the majority of published data give exponent values lower than two or even one [
2,
3,
9,
10]. Zaefferer et al. has investigated the recrystallisation kinetics in Fe-36Ni after cold deformation with an average grain size of 10 µm and reported Avrami exponents between 1.06–1.38 [
11]. Medina et al. and Laasraoui et al. examined microalloyed steels recrystallising at 1100–900 °C and reported that the
n value was lower than one with or without the influence of strain induced precipitation during recrystallisation [
10,
12]. Moreover,
n is in many cases not a constant value but decreases as recrystallisation progresses [
13]. Recovery during recrystallisation has been suggested to be responsible for the low reported Avrami exponent values [
3]. Additionally, for recovery occurring prior to recrystallisation, it would be expected to reduce the stored energy not modify the time-dependence of nucleation and growth. However, experiments have shown that low Avrami exponents can also be observed in the absence of any recovery [
2]. Therefore, the Avrami exponent is not dependent on strain [
1,
2,
3].
Some authors have proposed that variations in grain size and a heterogeneous distribution of stored energy can cause the low Avrami exponent values [
8,
9,
14]. Hutchinson reported that under the same temperature and strain conditions, fine-grain sized copper (average grain size of 15 µm), gave an
n value of 2.7 whereas coarse-grain sized copper (average grain size of 50 µm) gave an
n value of 1.7 [
15]. Similar observations have been reported by Barraclough and Sellars for Type 304 stainless steel, where the Avrami exponent decreased from 2 to 1 by increasing the initial average grain size from 140 to 530 µm at 0.5 strain [
1]. However, no grain size distribution nor the effect of the grain size distribution on the Avrami exponent was discussed in either case. Strain inhomogeneity has also been widely observed in deformed products; Furu observed that cold rolled aluminium was deformed inhomogeneously across thickness, the heavily deformed regions tend to recrystallise quicker than less deformed regions in aluminium, which leads to a faster initial recrystallisation rate and the rate decreases with time, i.e., lower Avrami exponent [
3].
In the past 40 years, generally it has been the mode/average grain size values that have been considered in recrystallisation modelling. In practice, the initial microstructure includes a range of grain sizes, i.e., grain size distribution, and this is now being increasingly considered. Several authors have proposed models for recrystallisation inhomogeneity that takes the grain size distribution into consideration. The model used by Rehman and by Zurob et al. assumes that each grain has different stored energy after deformation dependent on its orientation/Taylor factor and its size, then the overall recrystallisation kinetics are predicted via subgrain growth modelling [
16,
17]. The model by Rollett predicts that larger grains have a less preferential nucleation site and/or less stored energy, thus, the larger grains recrystallise at a slower rate [
8]. The recrystallisation nucleation and growth rate in each grain is expected to vary based on these models. The overall recrystallisation rate is the sum of the recrystallisation kinetics of each individual grain, therefore a decreasing recrystallisation growth rate is expected. However, no fitting parameters in these models have been developed to predict the Avrami exponent based on different grain size distribution. Additionally, very few experimental data of recrystallisation kinetics, i.e., starting and finishing time and Avrami exponent, has been linked to various grain size distributions to investigate its effect on the recrystallisation rate.
This paper reports a study on the recrystallisation kinetics at 850–950 °C, following room temperature deformation to 0.3 and 0.2 strain, in a model Fe-30Ni steel with different starting grain size distributions and proposes a method to predict the Avrami exponent based on the starting grain size distribution. The Fe-30Ni steel is austenitic allowing the deformation structure and partially recrystallised austenitic microstructure to be observed at room temperature. In addition, in situ heating after deformation in a scanning electron microscopy (SEM) with electron backscattered diffraction (EBSD) was used to examine the effects of grain size distribution and strain heterogeneity on recrystallisation.
4. Discussion
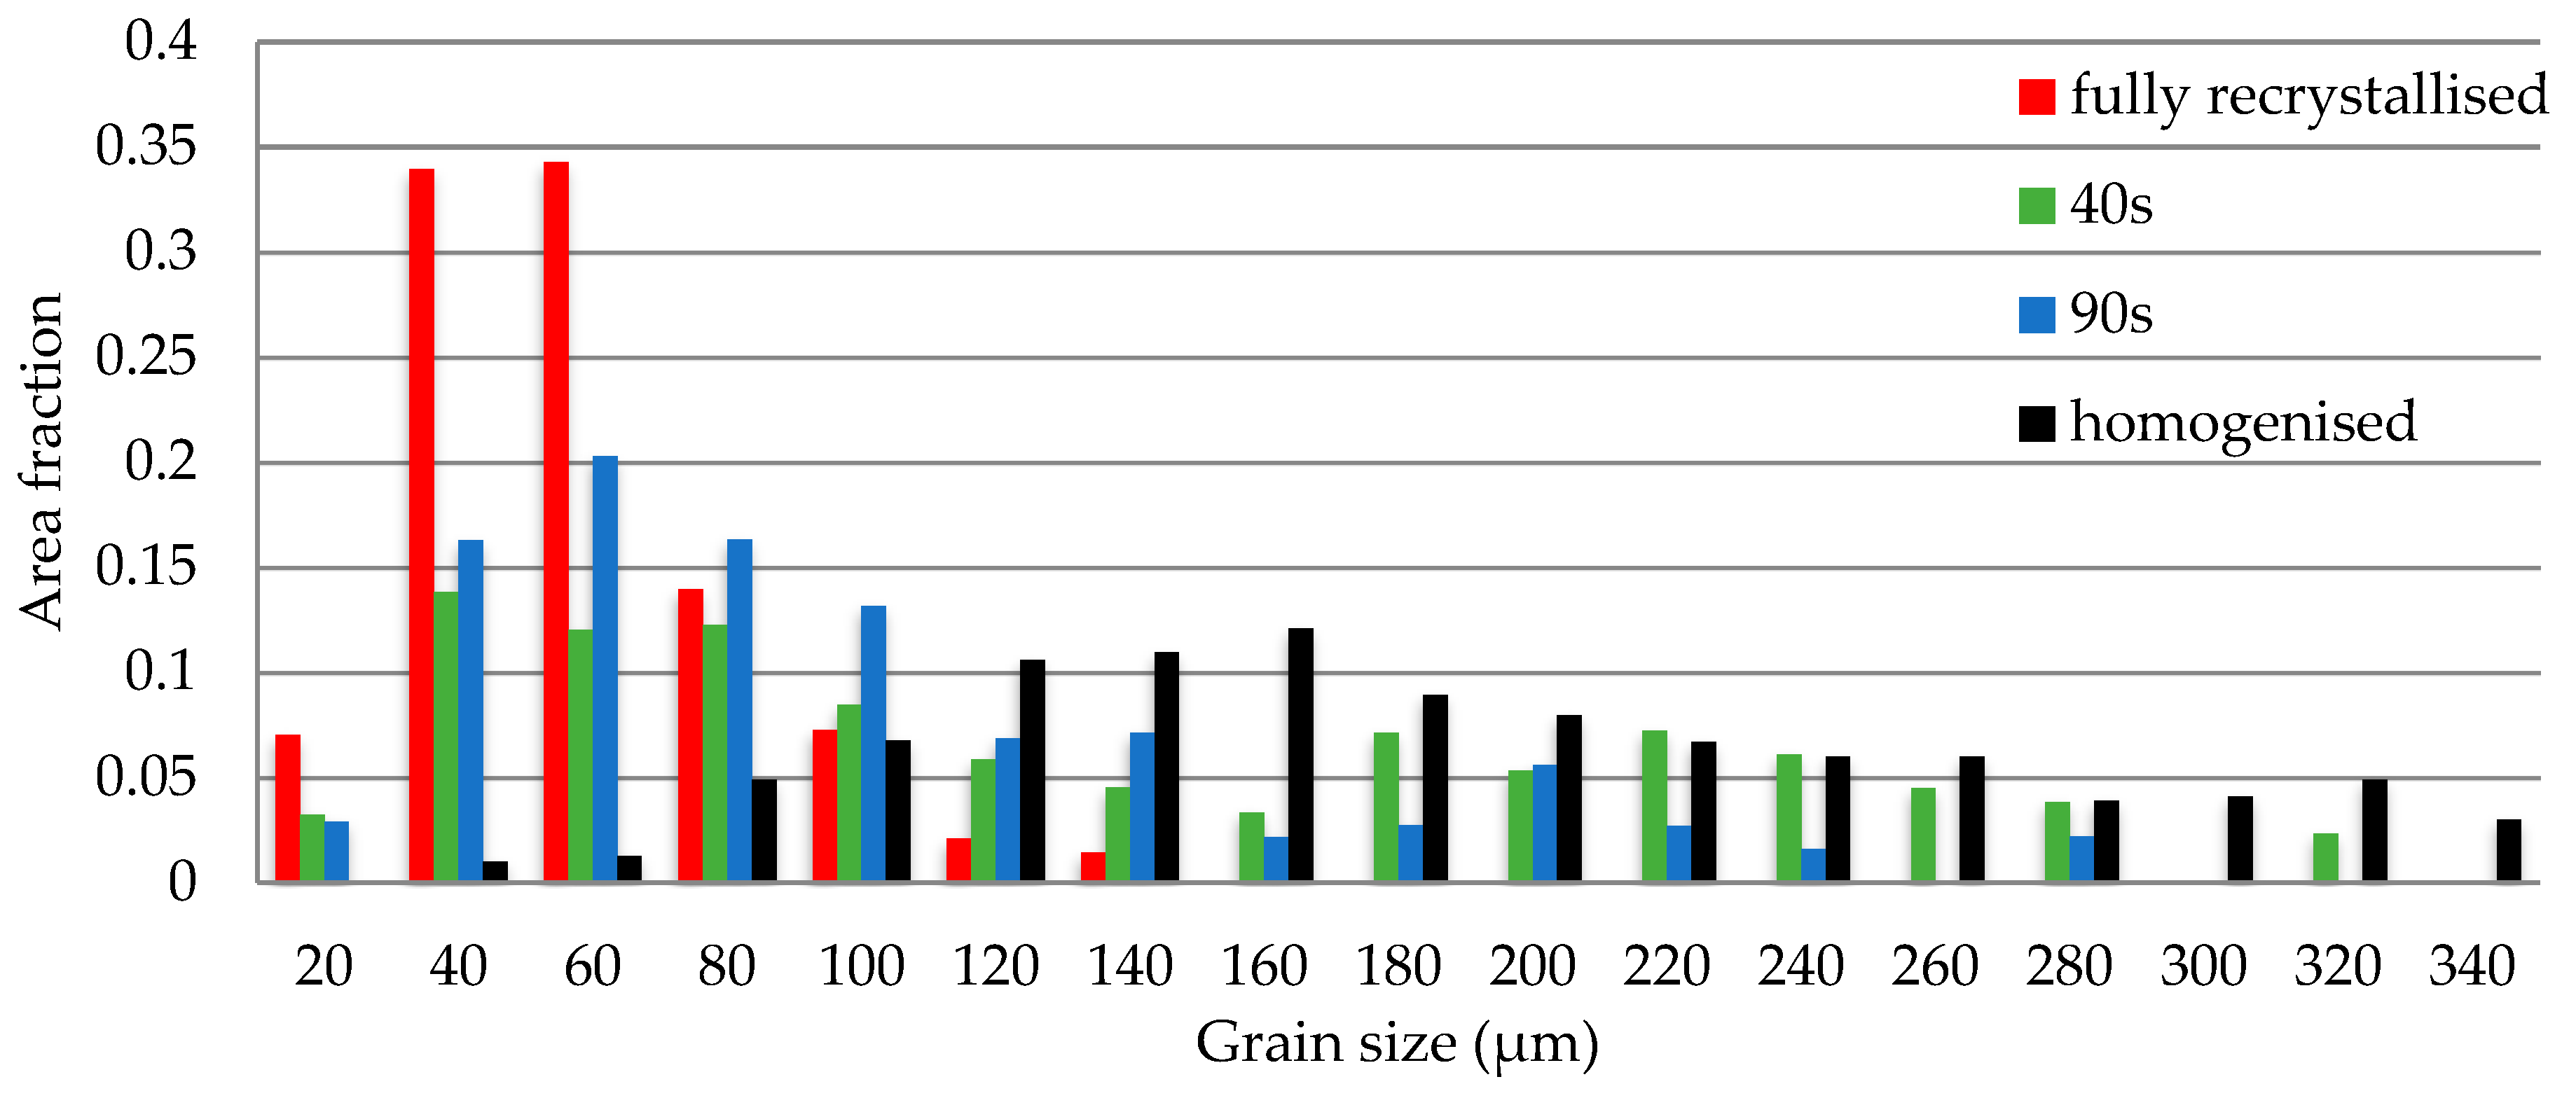
For each individual grain that deformed to 0.3 or 0.2 strain (with no shear band formation), recrystallisation occurred at the grain boundaries and the recrystallised grains grew into the grain interior. As a result, finer grains in the distribution recrystallised quicker, which was attributed to a larger number of nucleation sites per unit area, and coarser grains recrystallised more slowly. It was shown in both optical microscopy,
Figure 7, and EBSD,
Figure 8, that the recrystallisation rates were different for the different grain size classes in a distribution. Additionally, the early impingement of the recrystallisation nuclei could also have led to the decrease in the Avrami exponent, which was attributed to the preferred nucleation along the grain boundary regions.
To quantitatively demonstrate how a grain size distribution affects the recrystallization kinetics, and hence the Avrami exponent, it was assumed that each grain separately followed the JMAK model, in which site saturation and three-dimensional constant growth rate occurred, giving an
n value of 3. The assumption was based on the fact that recrystallisation nuclei pre-exist in the deformed microstructure without continued nucleation along grain boundaries after the initial nucleation event, and that recrystallised grain growth is not inhibited by precipitates or second phase particles. The recrystallisation kinetics for each individual grain were then calculated using the Sellars approach [
1]. The grain size and strain exponents were taken as 2 and −4 respectively. Then, the recrystallisation starting time was given as,
where
A is a constant,
D0 is the initial grain size, ε is the strain,
Q is the recrystallisation activation energy,
R is the gas constant and
T is the isothermal holding temperature.
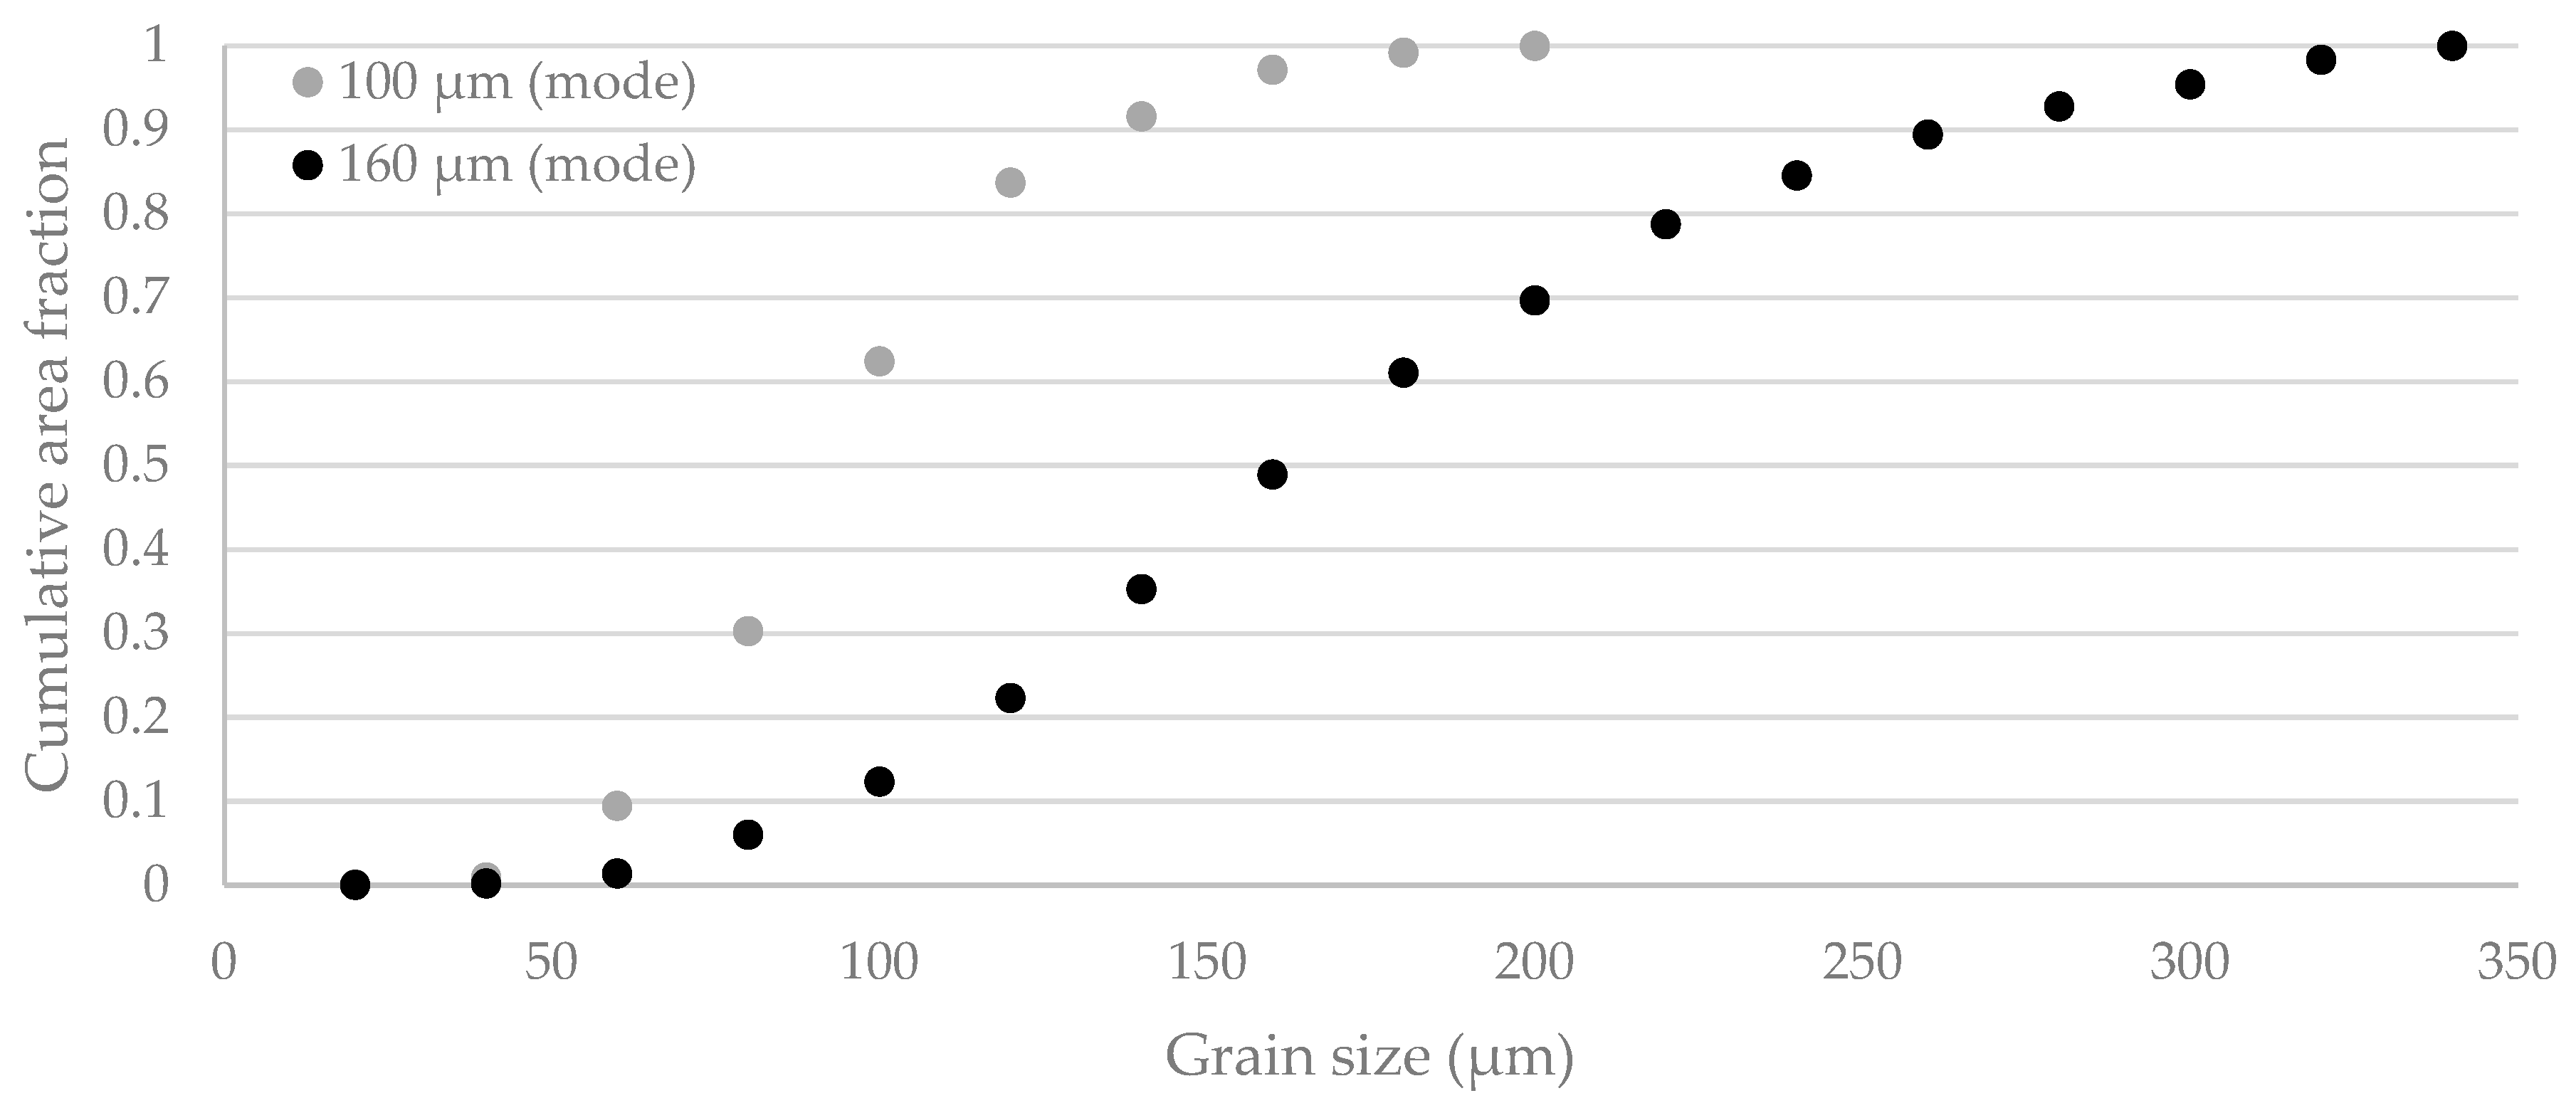
Assuming each grain size class recrystallises individually, then the recrystallisation curve should roughly follow the cumulative area fraction curve resulting from the application of Equation (2) to the grain size distribution,
Figure 9, for a given holding time.
The Avrami exponent was experimentally measured as:
where
X(
t) is the recrystallisation fraction at time
t.
Assuming each grain size class recrystallises individually, then the time to achieve 5% (
R0.05) and 85% (
R0.85) of the overall recrystallised fraction was approximately equal to the recrystallisation starting time for
D0.05 and
D0.85, where
D0.85 and
D0.05 was the grain size class at 85% and 5% of the cumulative grain size distribution respectively, as shown in
Figure 9.
Therefore, the Avrami exponent could be estimated as,
As recrystallisation time is proportional to the square of grain size, as shown in Equation (2), then Equation (4) can be given as,
For the samples with mode grain size of 160 µm, the equation predicted the Avrami exponent as 1.5 and 2.1 for the mode grain size of 100 µm using the grain sizes from
Figure 9. The results showed the same trend as the experimental results (
Table 1) with the smaller average and narrower grain size distribution showing a significantly lower Avrami exponent than for the larger average, wider grain size distribution. Additionally, it is worth noting that this approach had only considered a low strain condition, i.e., up to 0.3 strain, without the interference of the shear bands, therefore it may not have been applicable for the recrystallisation kinetics prediction after severe cold deformation. However, the measured Avrami exponents were slightly higher for the coarser grained material, and lower for the finer grained samples than predicted and this requires further consideration. Nevertheless, this approach provides the first attempt to quantitatively predict the Avrami exponent for a material based on the initial grain size distribution and is consistent with the reported experimental variations in Avrami exponent reported in the literature for different grain size samples.
Author Contributions
Conceptualization, M.J., C.D. and M.S.; methodology, M.J.; validation, M.J., C.D. and M.S.; formal analysis, M.J., C.D. and M.S.; investigation, M.J.; resources, C.D.; data curation, M.J.; writing—original draft preparation, M.J.; writing—review and editing, C.D. and M.S.; visualization, M.J.; supervision, C.D. and M.S.; project administration, C.D.; funding acquisition, C.D. and M.S.
Funding
This research was funded by EPSRC and Tata Steel Europe.
Acknowledgments
The authors would like to thank WMG at the University of Warwick for the provision of research facilities, and Tata Steel Europe for the provision of test material, data support of the project.
Conflicts of Interest
The authors declare no conflict of interest.
References
- Barraclough, D.R.; Sellars, C.M. Static recrystallization and restoration after hot deformation of type 304 stainless steel. Met. Sci. 1979, 13, 257–268. [Google Scholar] [CrossRef]
- Humphreys, F.J.; Hatherly, M. Recrystallisation and Related Annealing Phenomena, 2nd ed.; Elsevier: Oxford, UK, 2004. [Google Scholar]
- Furu, T.; Marthinsen, K.; Nes, E. Modelling recrystallisation. Mater. Sci. Technol. 1990, 6, 1093–1102. [Google Scholar] [CrossRef]
- Park, J.T.; Szpunar, J.A. Effect of initial grain size on texture evolution and magnetic properties in non-oriented electrical steels. J. Magn. Magn. Mater. 2009, 321, 1928–1932. [Google Scholar] [CrossRef]
- Burger, G.B.; Gupta, A.K.; Jeffrey, P.W.; Lloyd, D.J. Microstructural control of aluminum sheet used in automotive applications. Mater. Charact. 1995, 35, 23–29. [Google Scholar] [CrossRef]
- Cizek, P.; Bai, F.; Palmiere, E.J.; Rainforth, W.M. EBSD study of the orientation dependence of substructure characteristics in a model Fe− 30wt% Ni alloy subjected to hot deformation. J. Microsc. 2005, 217, 138–151. [Google Scholar] [CrossRef] [PubMed]
- Rios, P.R.; Siciliano, F., Jr.; Sandim, H.R.Z.; Plaut, R.L.; Padilha, A.F. Nucleation and growth during recrystallisation. Mater. Res. 2005, 8, 225–238. [Google Scholar] [CrossRef]
- Rollett, D.; Srolovitz, D.J.; Doherty, R.D.; Anderson, M.P. Computer simulation of recrystallization in non-uniformly deformed metals. Acta Metall. 1989, 37, 627–639. [Google Scholar] [CrossRef]
- Saidi, P.; Shahandeh, S.; Hoyt, J.J. Relationship between recrystallization kinetics and the inhomogeneity of stored energy. Metall. Mater. Trans. A 2015, 46, 2975–2985. [Google Scholar] [CrossRef]
- Medina, S.F.; Quispe, A. Improved model for static recrystallisation kinetics of hot deformed austenite in low alloys and Nb/V microalloyed steels. ISIJ Inter. 2001, 41, 774–781. [Google Scholar] [CrossRef]
- Zaefferer, S.; Baudin, T.; Penelle, R. A study on the formation mechanisms of the cube recrystallization texture in cold rolled Fe- 36% Ni alloys. Acta Mater. 2001, 49, 1105–1122. [Google Scholar] [CrossRef]
- Laasraoui, A.; Jonas, J.J. Prediction of temperature distribution, flow stress and microstructure during the multipass hot rolling of steel plate and strip. Trans. Iron Steel Inst. Japan 1991, 31, 95–105. [Google Scholar] [CrossRef]
- Sellars, C.M. The Physical Metallurgy of Hot Working. In Proceedings of the an International Conference on Hot Working and Forming Processes, London, UK, 14–15 July 1980; pp. 3–15. [Google Scholar]
- Luo, H.; Sietsma, J.; van der Zwaag, S. Effect of inhomogeneous deformation on the recrystallization kinetics of deformed metals. ISIJ Inter. 2004, 44, 1931–1936. [Google Scholar] [CrossRef]
- Hutchinson, B.; Jonsson, S.; Ryde, L. On the kinetics of recrystallisation in cold worked metals. Scr. Metall. 1989, 23, 671–676. [Google Scholar] [CrossRef]
- Cram, D.G.; Zurob, H.S.; Brechet, Y.J.M.; Hutchinson, C.R. Modelling discontinuous dynamic recrystallisation using a physical based model for nucleation. Acta Mater. 2009, 57, 5218–5228. [Google Scholar] [CrossRef]
- Rehman, M.K. Modelling the Microstructure Evolution during Hot Deformation of Microalloyed Steels. Ph.D. Thesis, McMaster University, Hamilton, ON, Canada, November 2014. [Google Scholar]
- Cizek, P.; Whiteman, J.A.; Rainforth, W.M.; Beynon, J.H. EBSD and TEM investigation of the hot deformation substructure characteristics of a type 316L austenitic stainless steel. J. Microsc. 2004, 213, 285–295. [Google Scholar] [CrossRef] [PubMed]
- Black, M.P. Microstructural evolution of austenite in a microalloyed Fe-30Ni alloy. Ph.D. Thesis, University of Sheffield, Sheffield, UK, 2002. [Google Scholar]
- Palmiere, E.J. The use of model systems based on Fe- 30 wt% Ni for investigating the precipitation and transformation behaviour of microalloyed austenite. In HSLA Steels 2015, Microalloying 2015 & Offshore Engineering Steels 2015; Springer: New York, NY, USA, 2016; pp. 1095–1101. [Google Scholar]
- Poddar, D.; Cizek, P.; Beladi, H.; Hodgson, P.D. Evolution of strain-induced precipitates in a model austenitic Fe-30Ni-Nb steel and their effect on the flow behavior. Acta Mater. 2014, 80, 1–15. [Google Scholar] [CrossRef]
- Hansen, N. Cold deformation microstructures. Mater. Sci. Technol. 1990, 6, 1039–1047. [Google Scholar] [CrossRef]
- Abdollah-Zadeh, A. The Investigation of Deformation, Recovery, Recrystallisation and Precipitation in Austenitic HSLA Steel Analogue Alloys. Ph.D. Thesis, University of Wollongong, Wollongong, Australia, 1996. [Google Scholar]
- Torabinejad, V.; Zarei-Hanzaki, A.; Moemeni, S. An analysis to the kinetics of austenite recrystallization in Fe-30Mn-5Al steel. Mater. Manuf. Processes 2013, 28, 36–41. [Google Scholar] [CrossRef]
- Hurley, P.J.; Hodgson, P.D.; Muddle, B.C. A study of deformation substructures in austenite using a model Ni- 30 wt.% Fe alloy. Scr. Mater. 2001, 45, 25–32. [Google Scholar] [CrossRef]
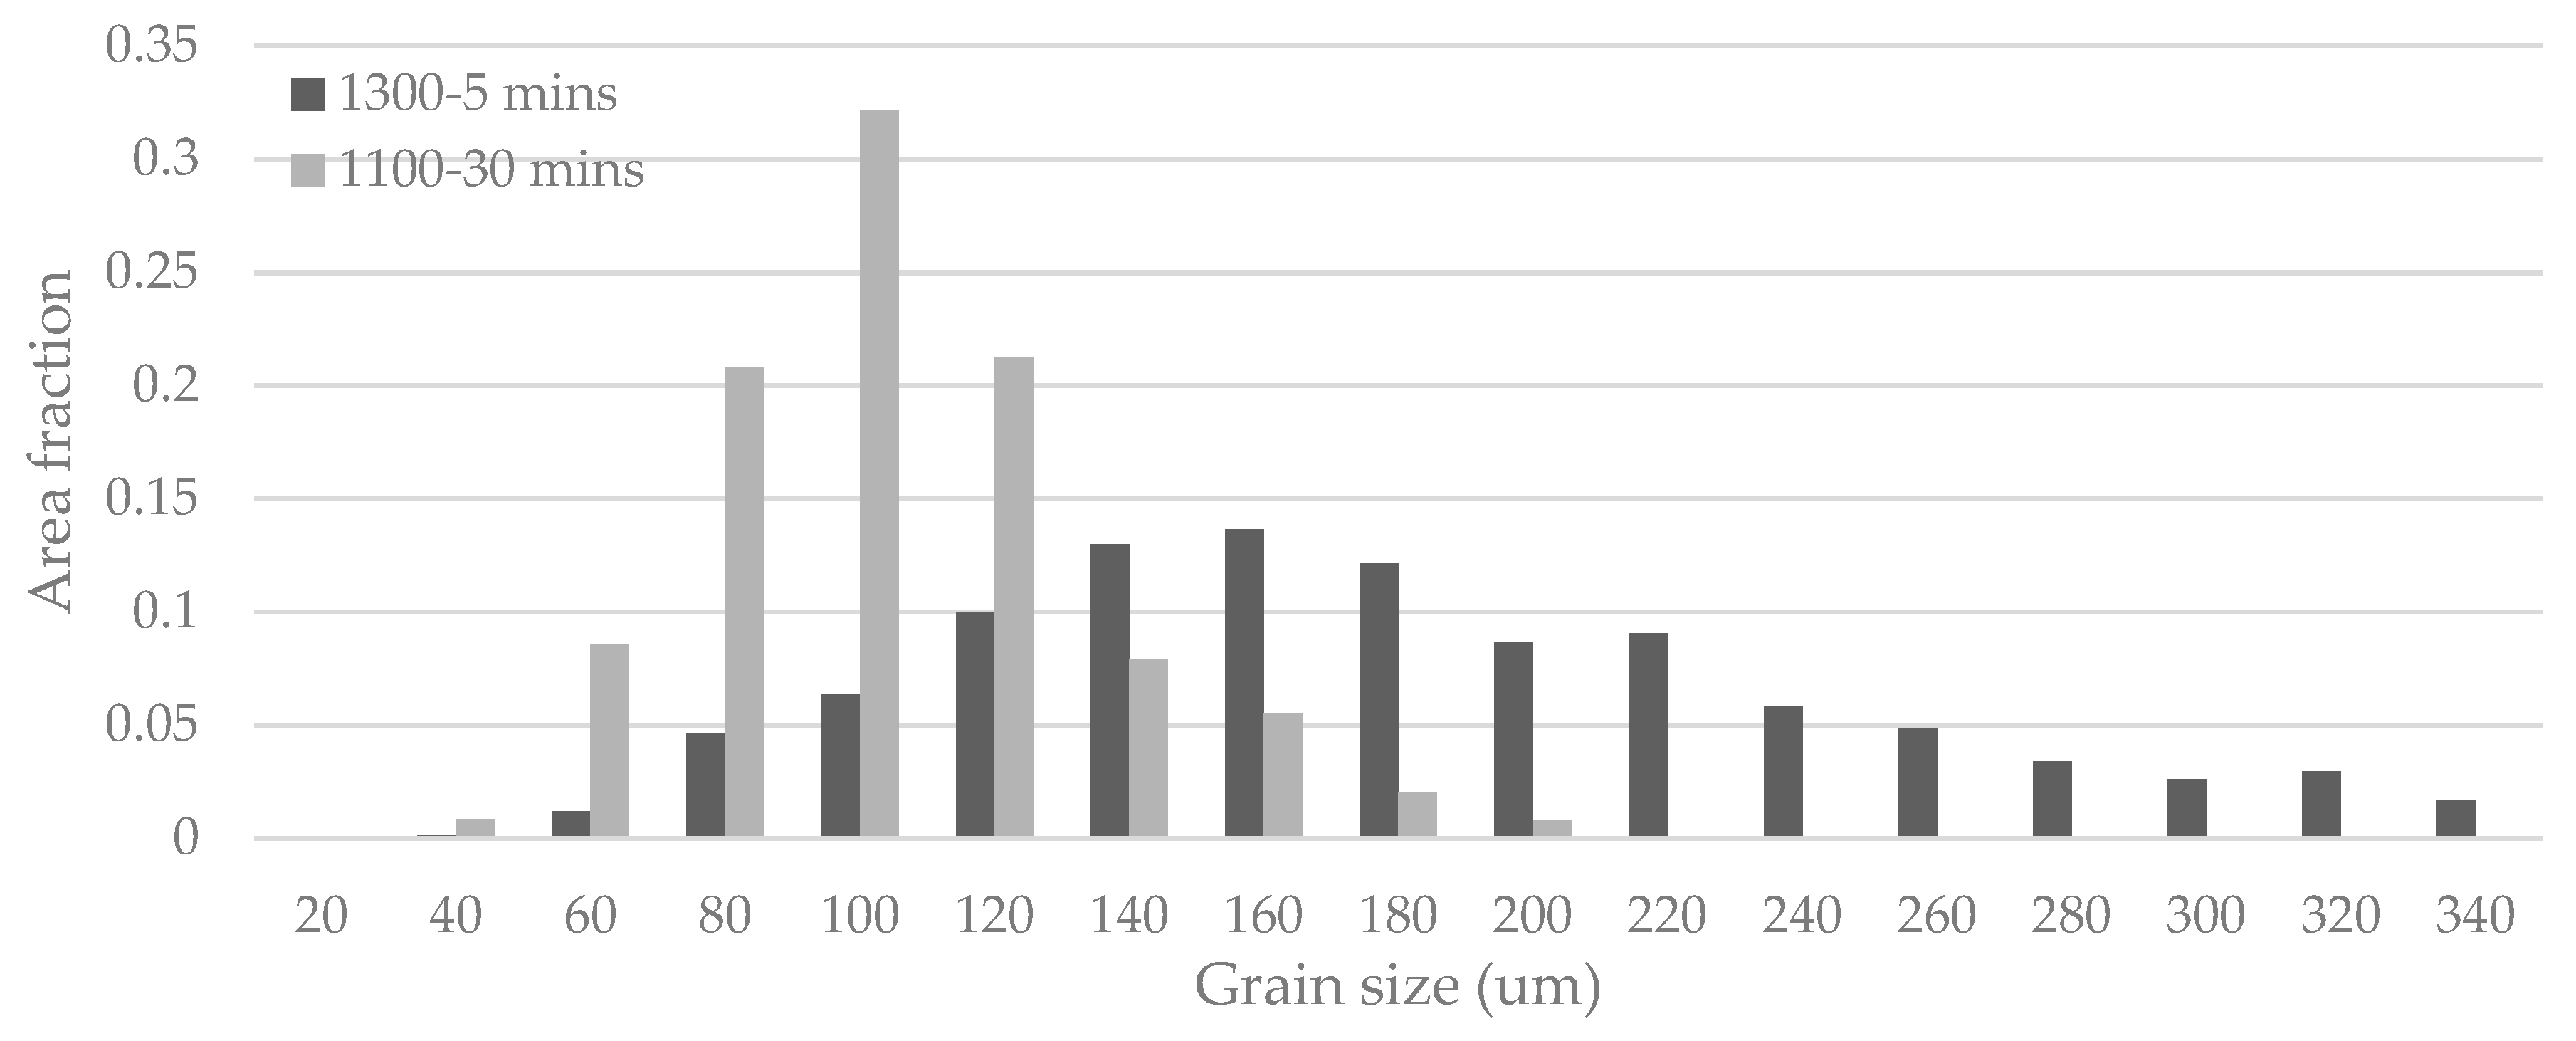
Figure 1.
Grain size distribution for the heat-treated samples.
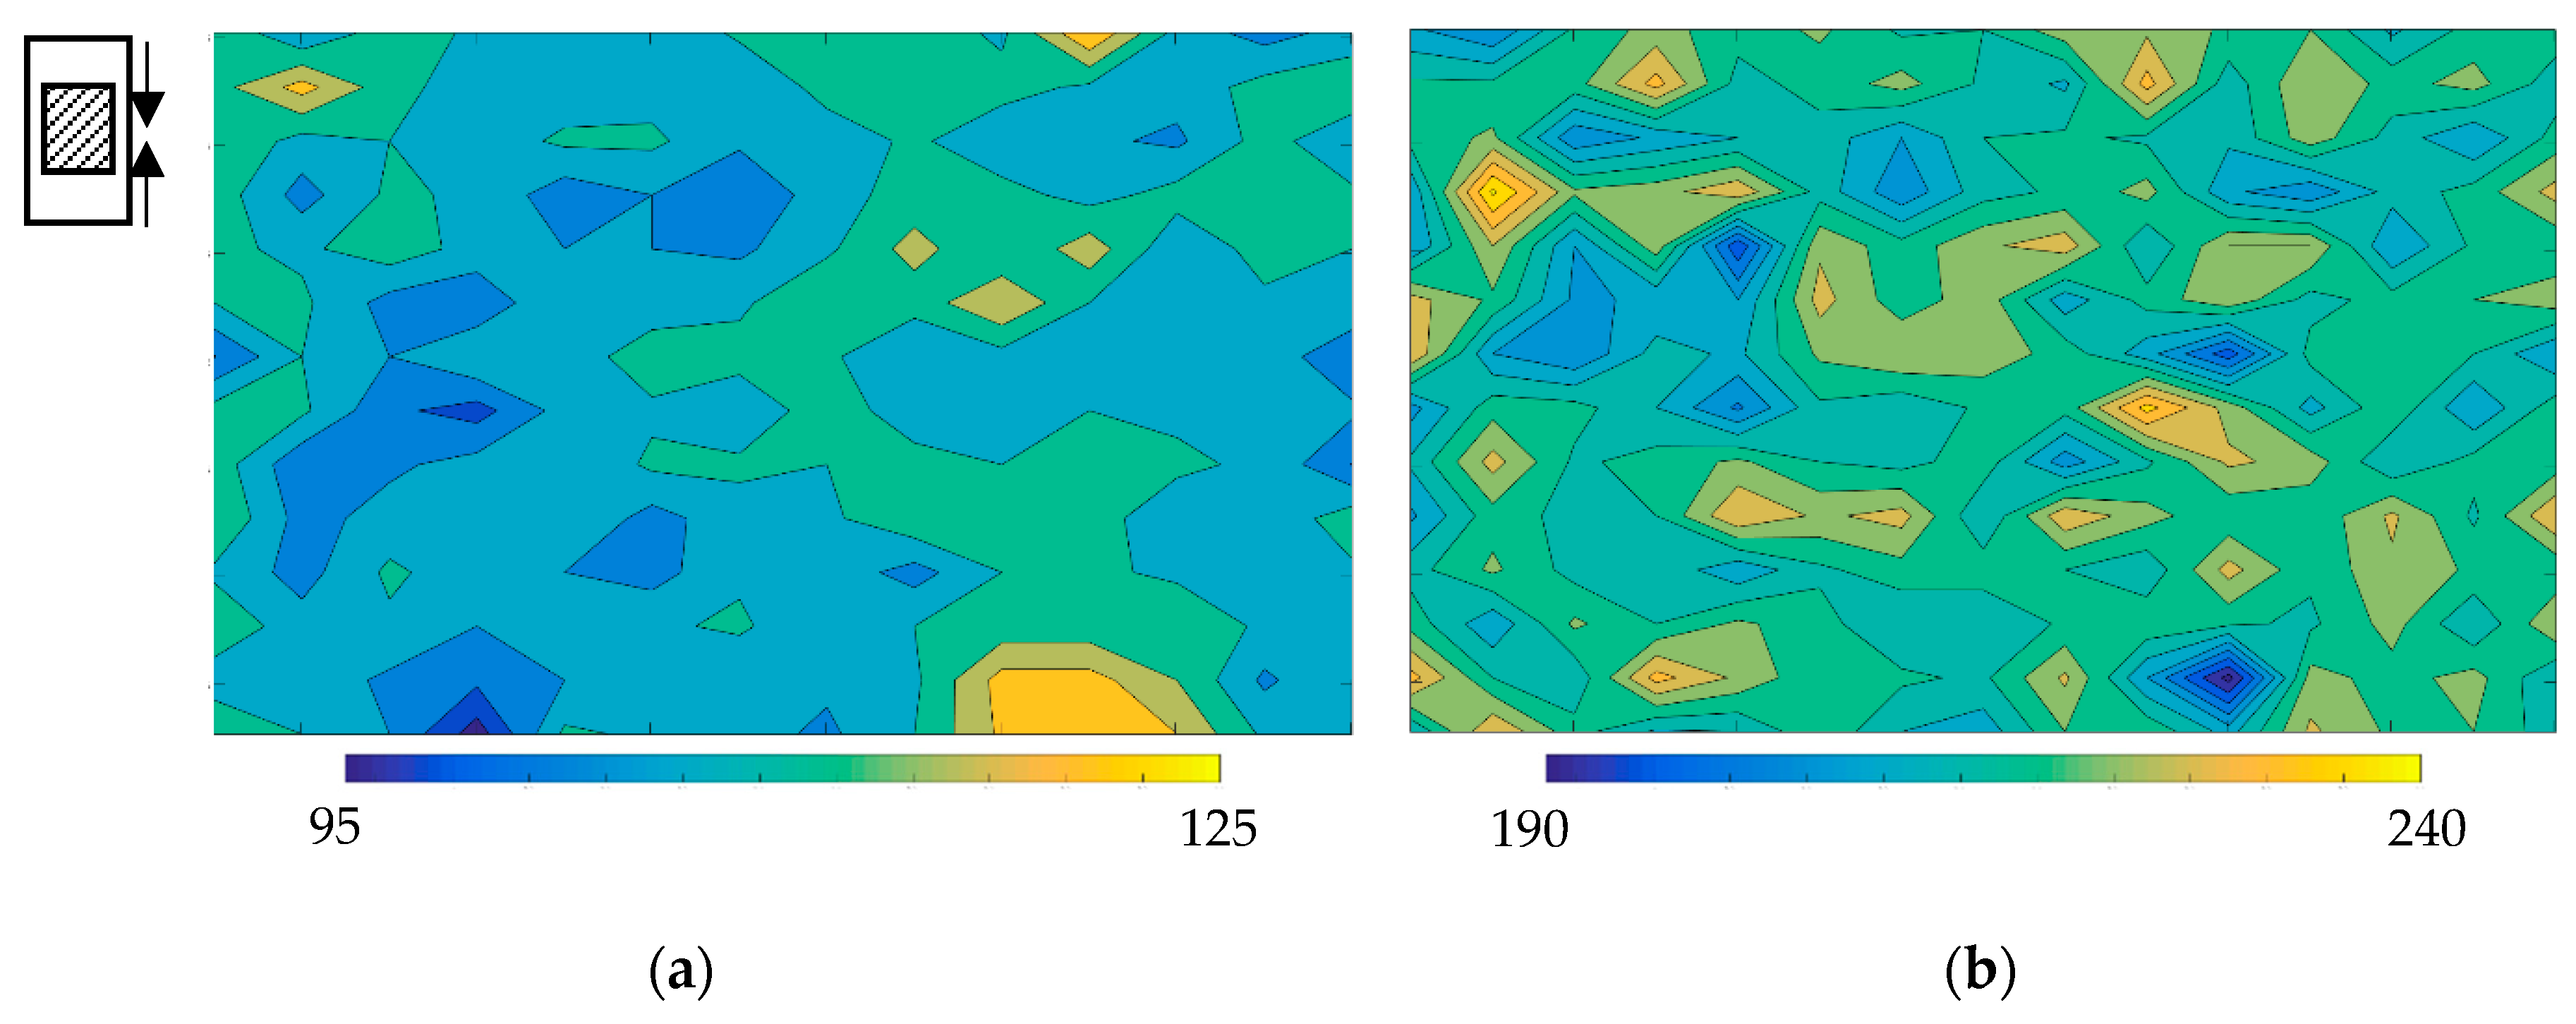
Figure 2.
Microhardness mapping of Fe-30Ni material in (a) homogenized and (b) deformed to 0.3 strain at room temperature conditions, step size 0.5 mm. (Examination area 3.5 mm × 7 mm). Inset diagram: Arrows show the compression direction for the 15 mm height; 10 mm diameter samples and the shadowed region shows the examination area.
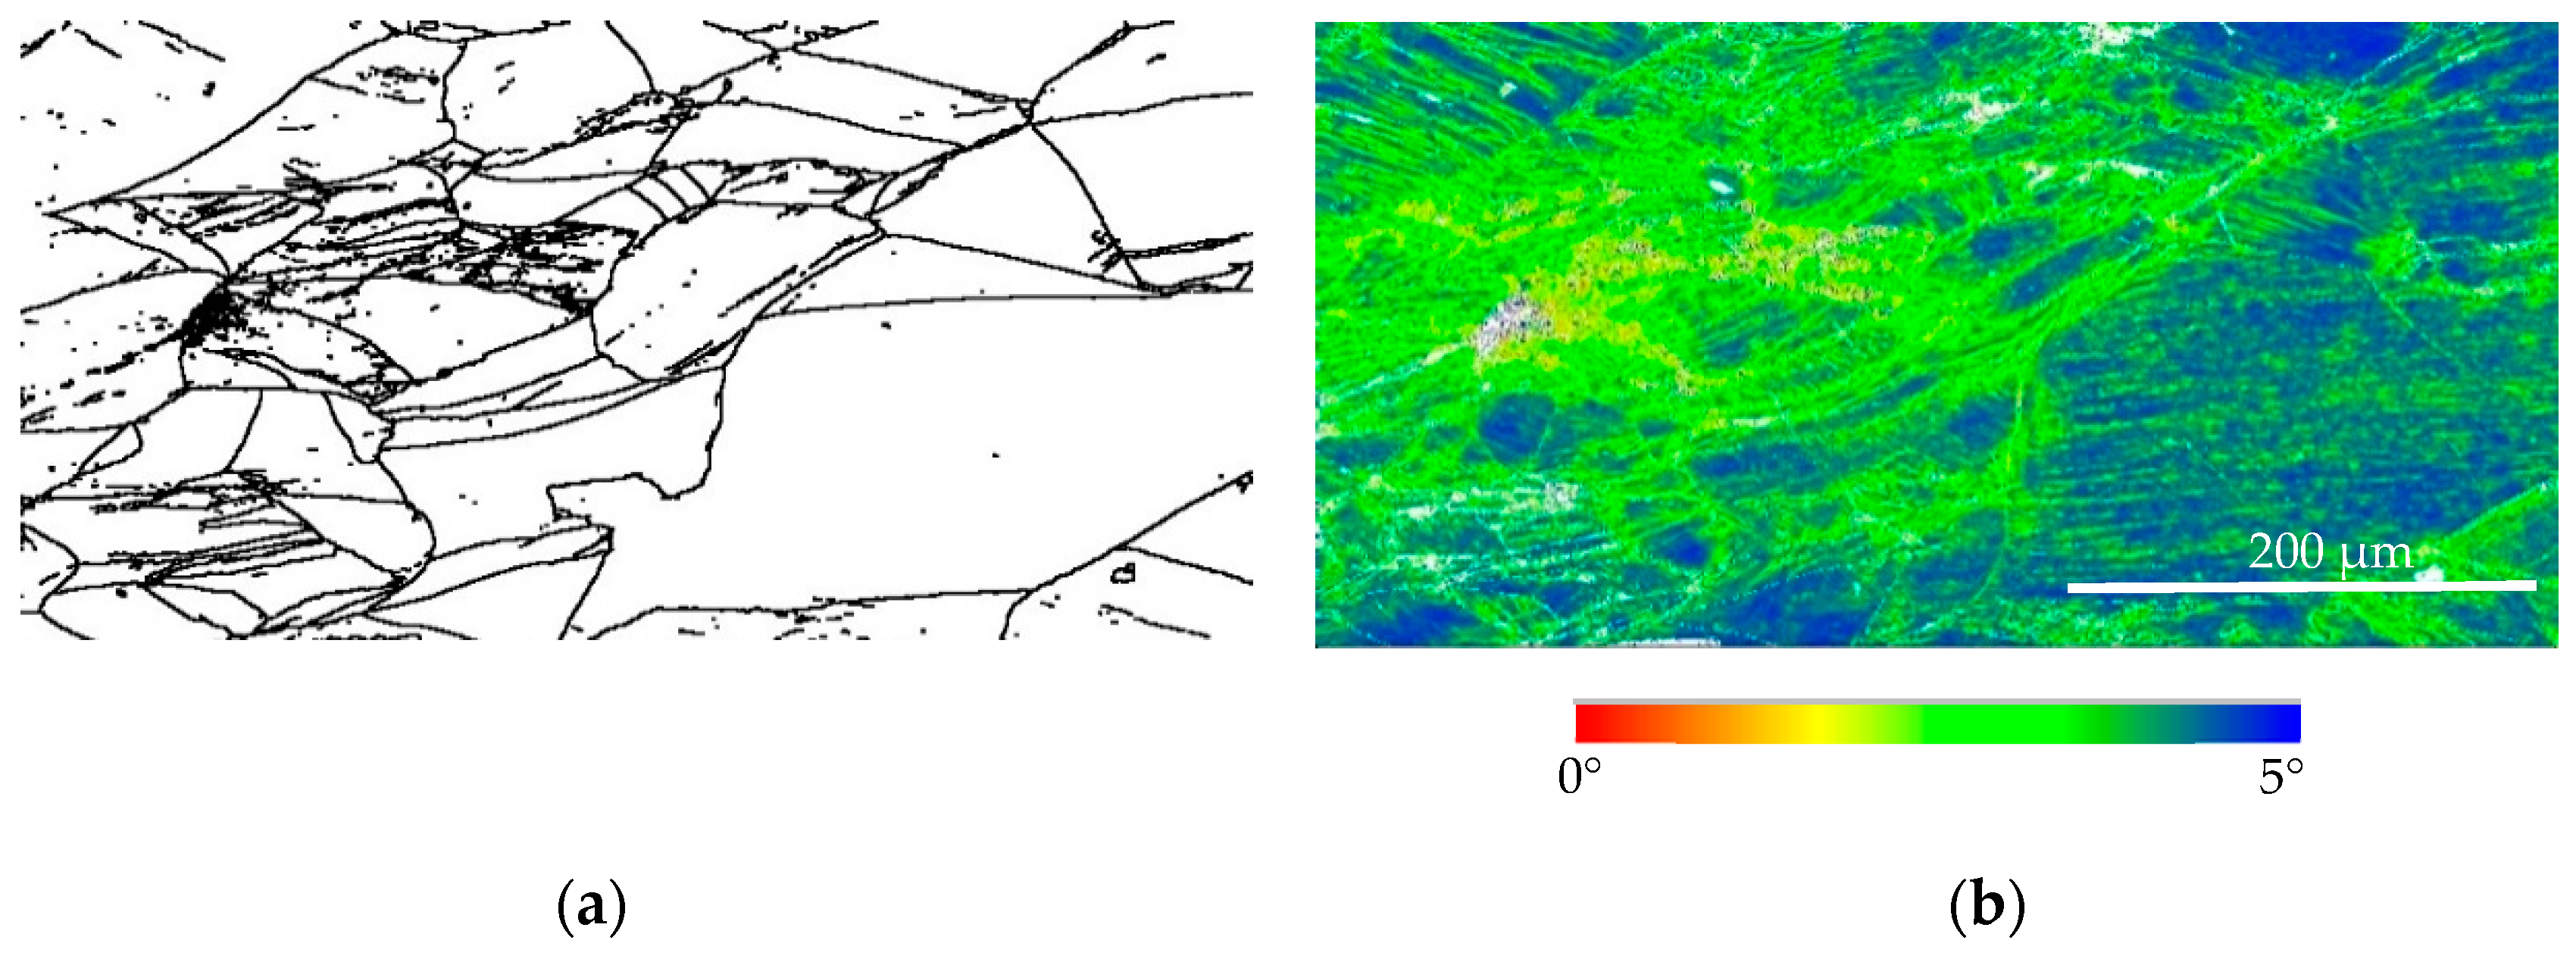
Figure 3.
EBSD (electron backscattered diffraction) image of Fe-30Ni sample with initial mode grain size of 160 µm deformed to 0.3 strain at room temperature (a) grain boundary (HAGB > 15 degree) and (b) local misorientation map (misindexing, i.e., white regions, were assumed to be heavily deformed).
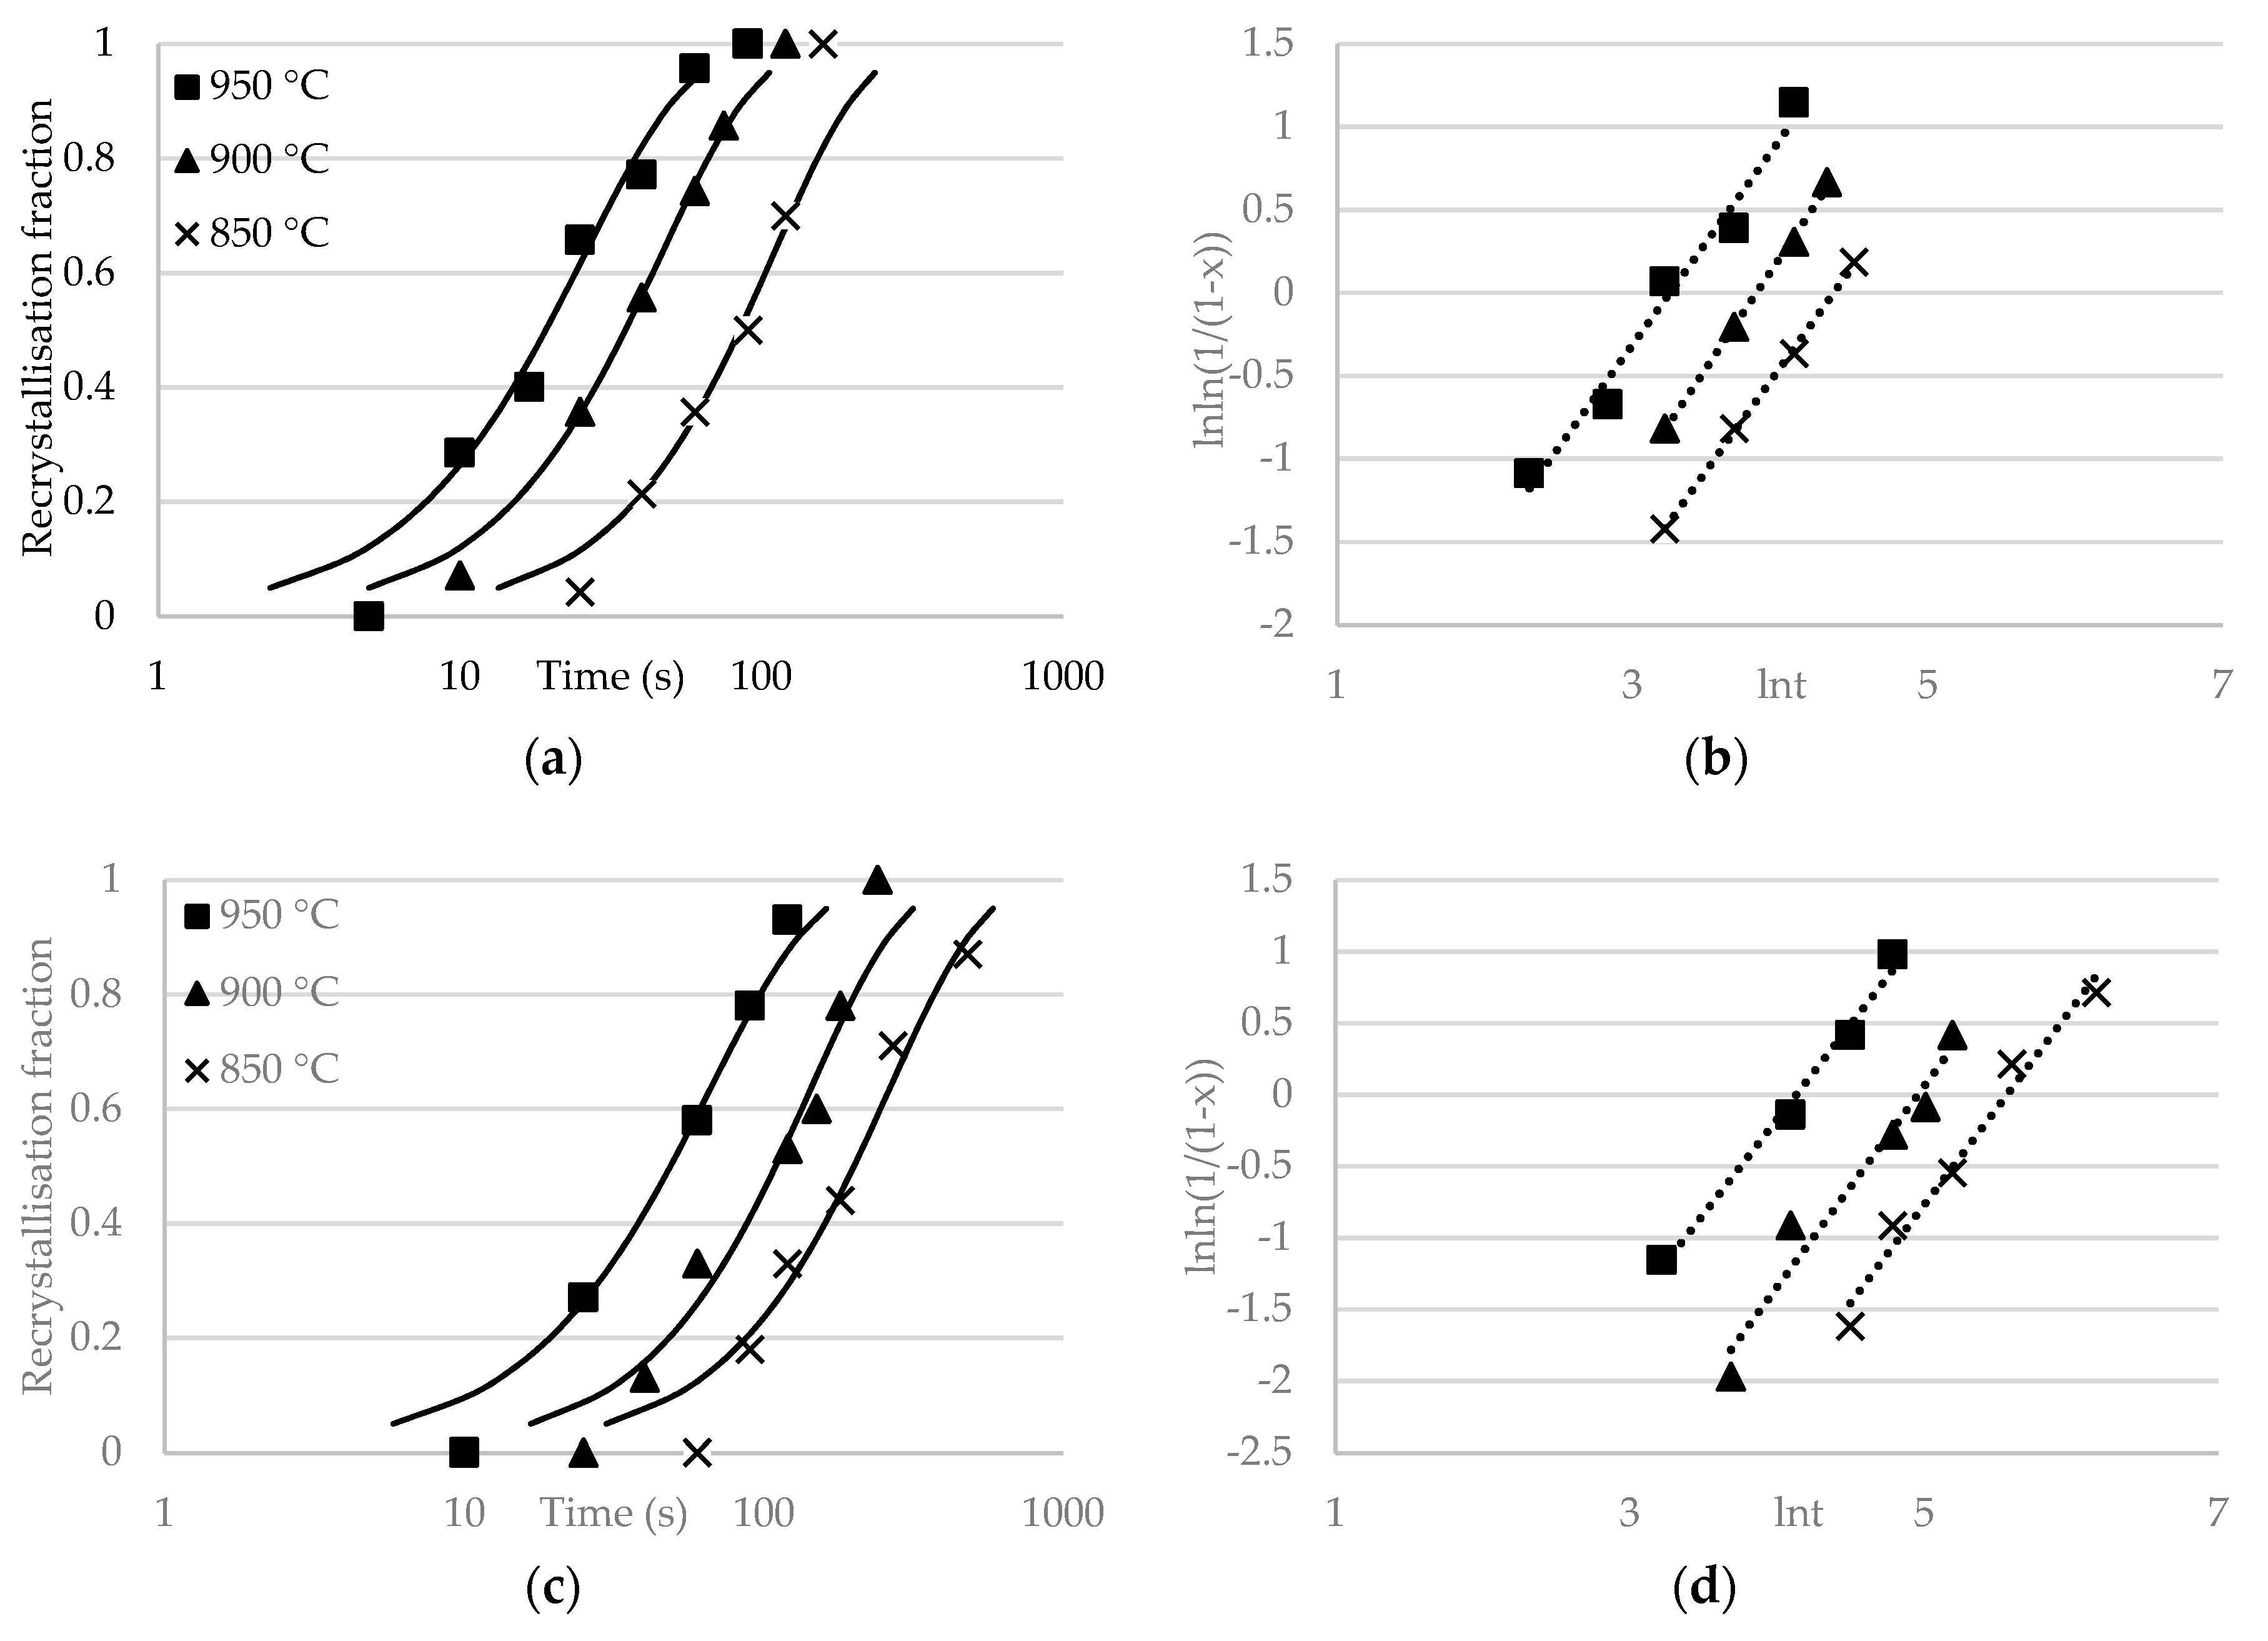
Figure 4.
Recrystallisation kinetics and double log diagram for 160 µm mode grain size samples deformed to (a,b) 0.3 strain and (c,d) 0.2 strain at room temperature, then annealed at three temperatures (850, 900 and 950 °C).
Figure 5.
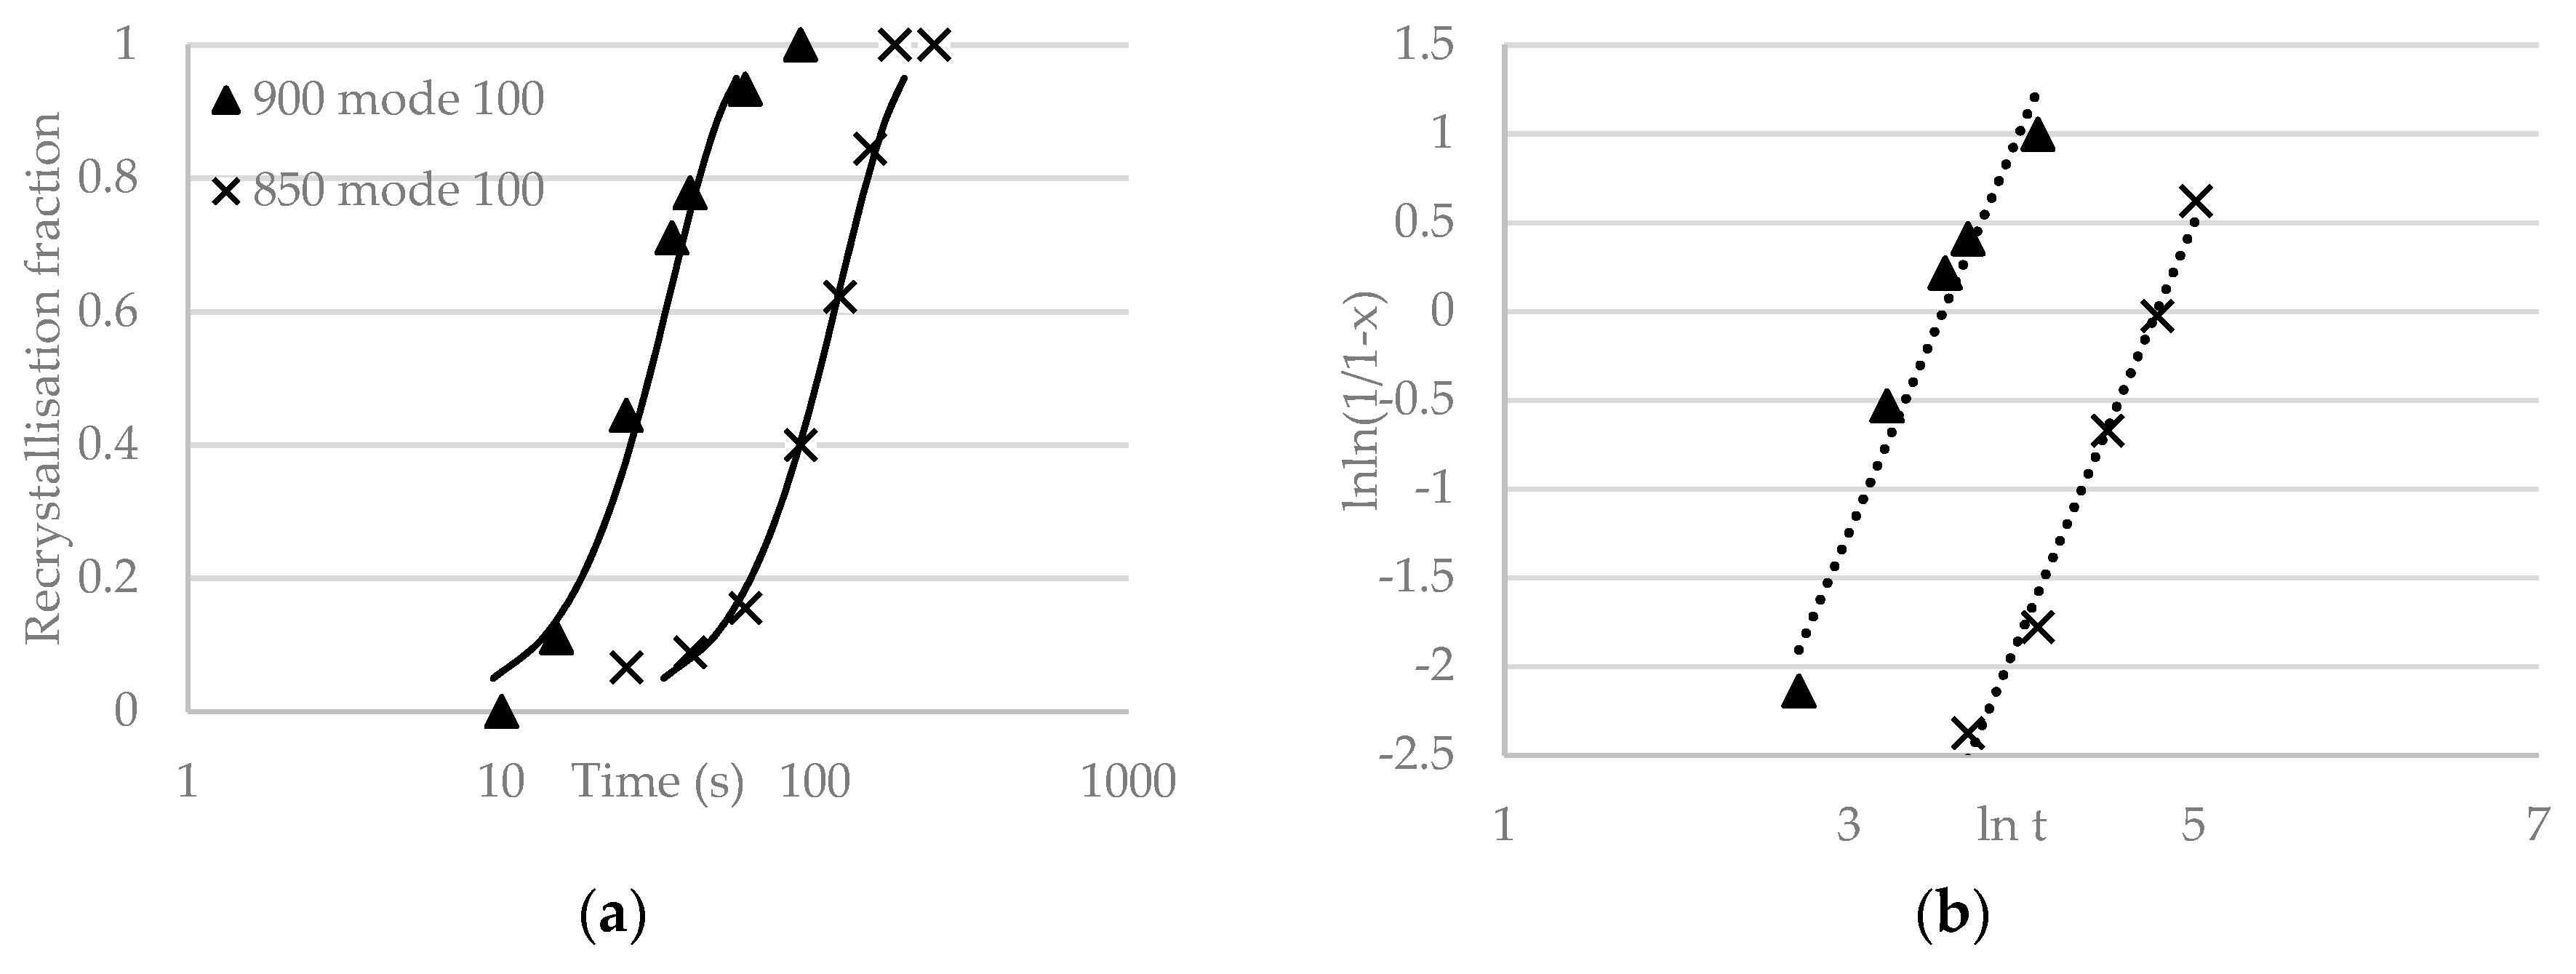
Recrystallisation kinetics (a) and double log diagram (b) for 100 µm mode grain size samples deformed to 0.2 strain at room temperature, then held at two temperatures (850 and 900 °C).
Figure 6.
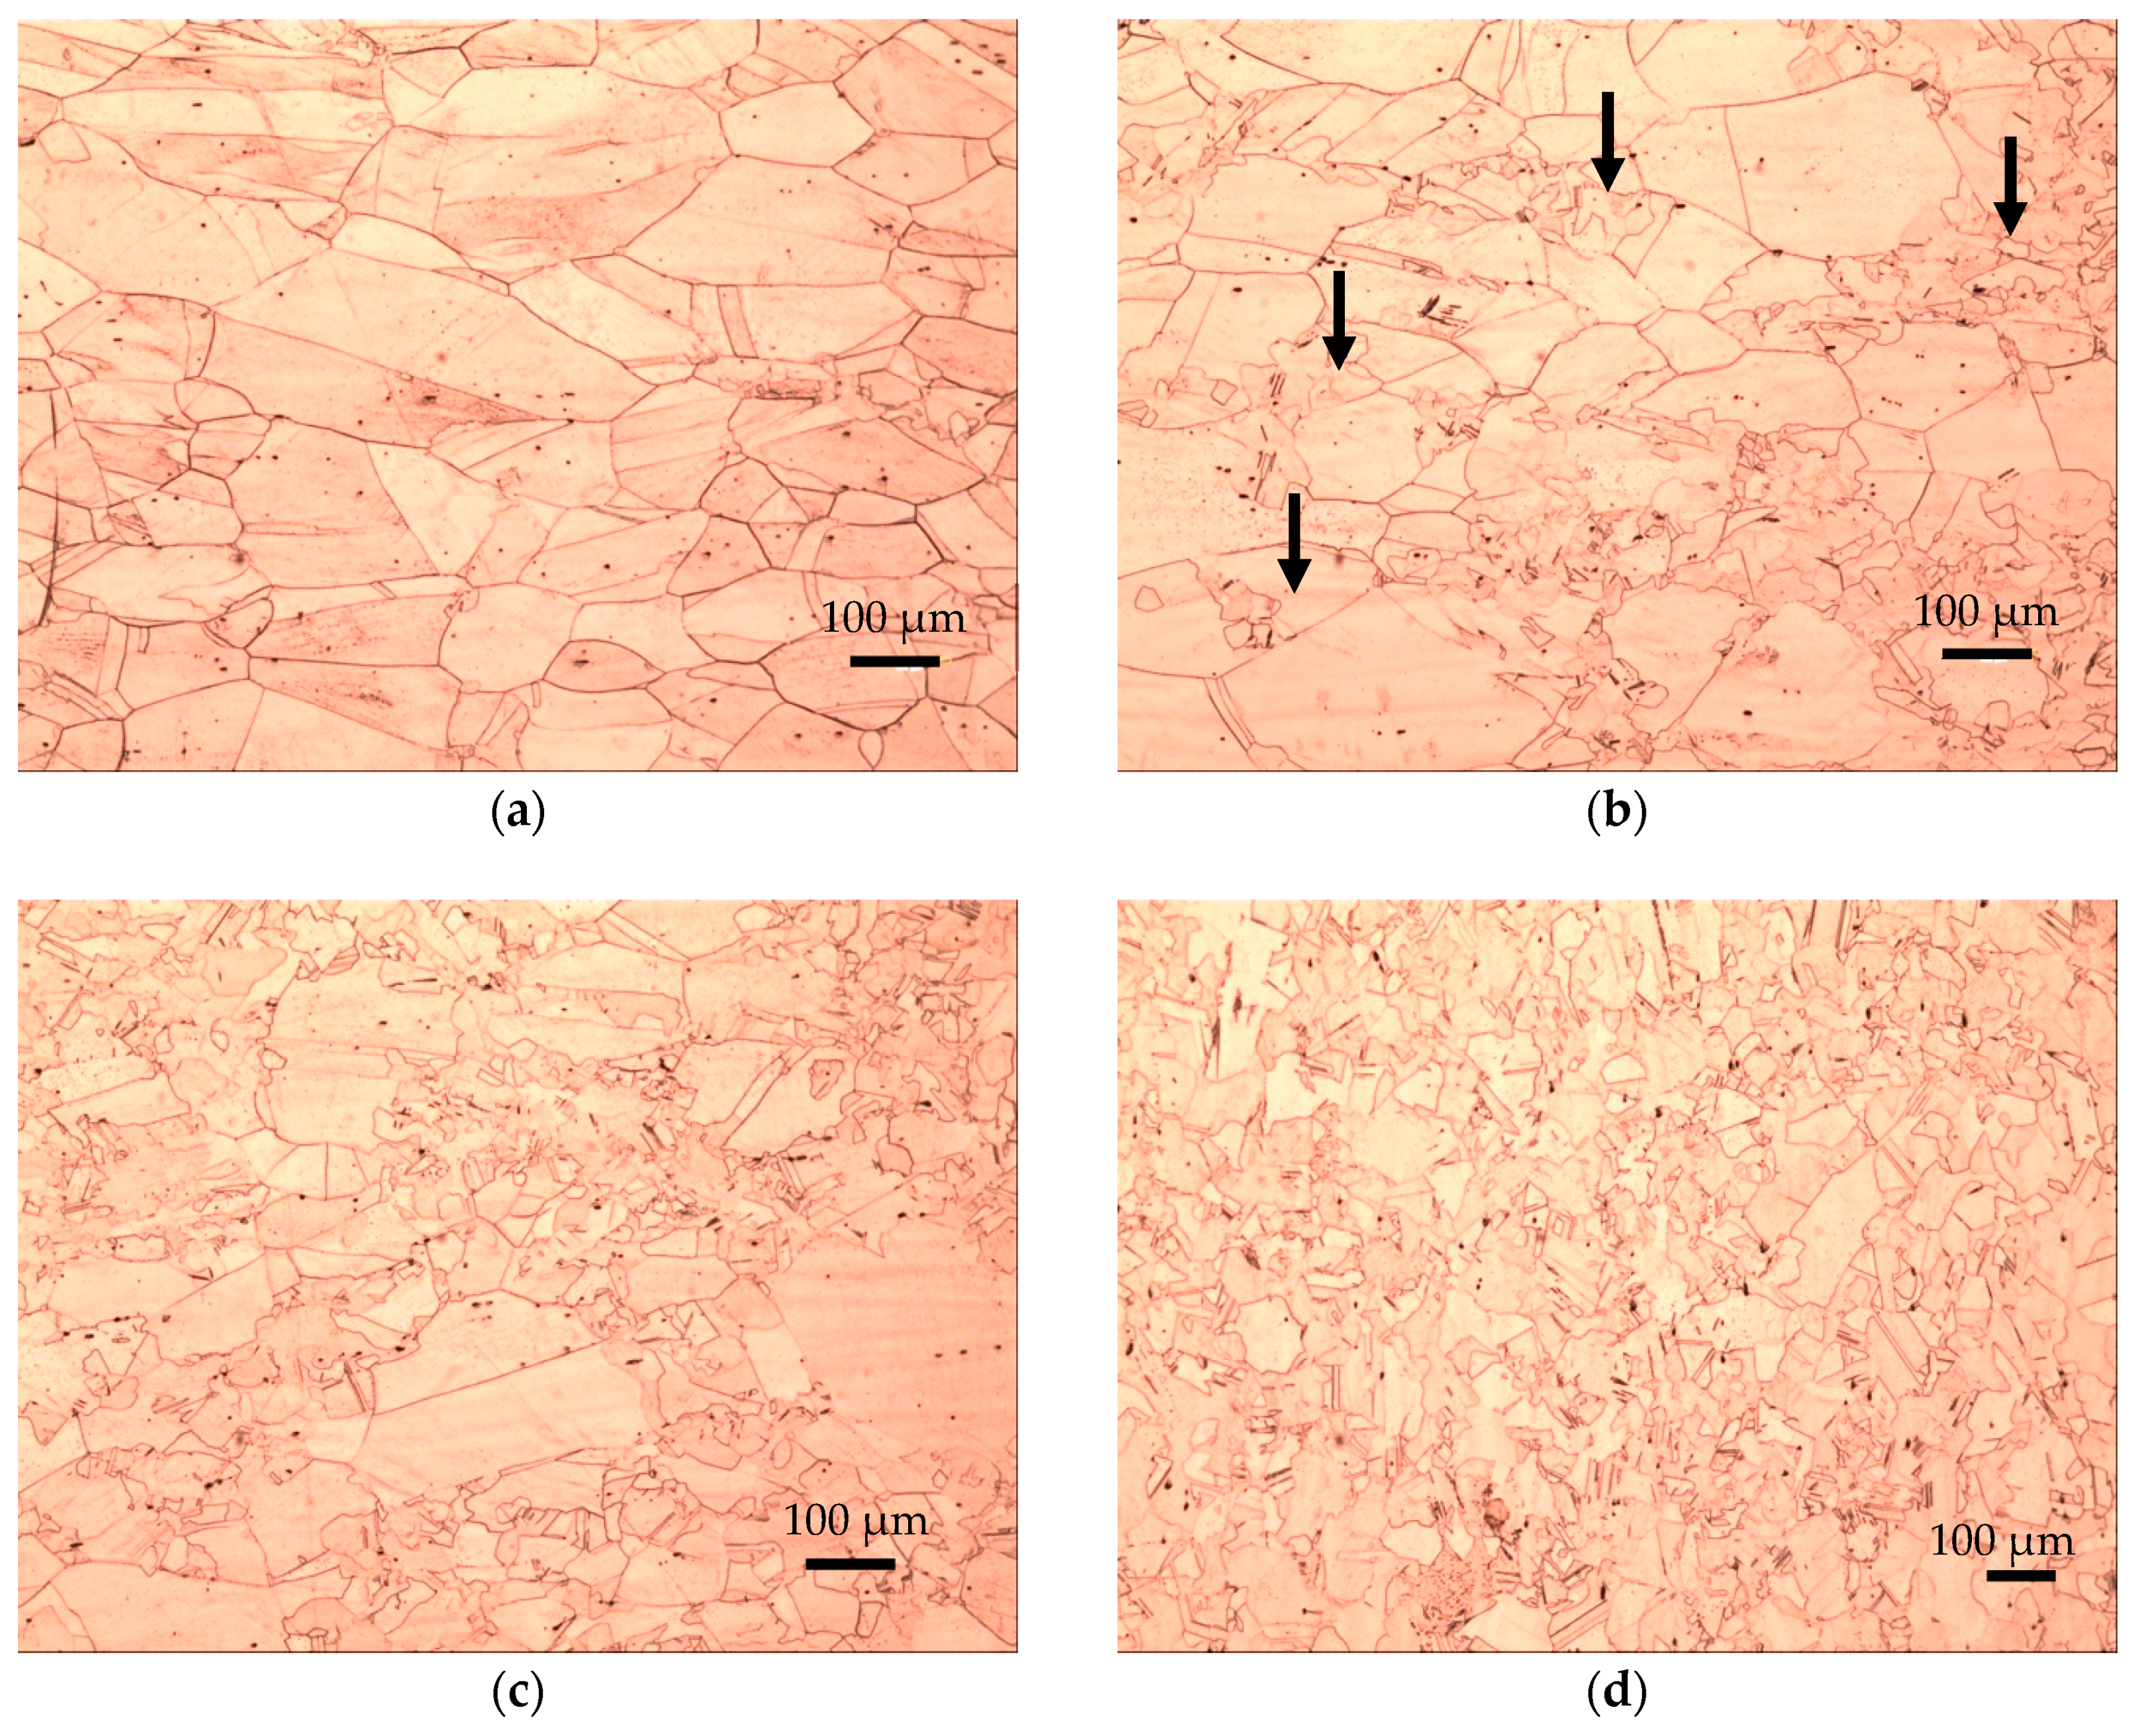
Microstructure evolution in the 160 µm initial grain size material at (a) 25 s, unrecrystallised; (b) 40 s, 20% recrystallised; (c) 90 s, 50% recrystallised; and (d) 160 s, fully recrystallised at 850 °C, 0.3 strain. The arrows in (b) show recrystallisation nuclei preferentially located at grain boundaries and triple points.
Figure 7.
The grain size distribution of homogenised, 40 s (30% recrystallised), 90 s, (50% recrystallised) and fully recrystallised samples.
Figure 8.
Band contrast EBSD images for the (a) cold deformed sample with 160 µm mode gran size (0.3 strain) and (b) partially recrystallised sample after reheating at 700 °C for 60 min showing the coarse grain remains unrecrystallised whilst the fine grain region recrystallised.
Figure 9.
Cumulative area fraction representation of grain size for the two different grain size distributions.
Table 1.
Summary of experimentally determined Avrami exponents.
| Temperature (°C) | Mode Grain Size (µm) | Strain | n Value |
|---|
| 950 | 160 | 0.3 | 1.2 |
| 900 | 160 | 0.3 | 1.3 |
| 850 | 160 | 0.3 | 1.4 |
| 950 | 160 | 0.2 | 1.3 |
| 900 | 160 | 0.2 | 1.4 |
| 850 | 160 | 0.2 | 1.3 |
| 900 | 100 | 0.2 | 2.3 |
| 850 | 100 | 0.2 | 2.3 |
© 2019 by the authors. Licensee MDPI, Basel, Switzerland. This article is an open access article distributed under the terms and conditions of the Creative Commons Attribution (CC BY) license (http://creativecommons.org/licenses/by/4.0/).
