Article

The Effect of Different Annealing Temperatures on Recrystallization Microstructure and Texture of Clock-Rolled Tantalum Plates with Strong Texture Gradient

1
College of Materials Science and Engineering, Chongqing University, No. 174 Shazheng Street, Shapingba District, Chongqing 400044, China
2
Electron Microscopy Center of Chongqing University, Chongqing University, Chongqing 400044, China
*
Author to whom correspondence should be addressed.
Metals 2019, 9(3), 358; https://doi.org/10.3390/met9030358
Submission received: 28 February 2019 / Revised: 18 March 2019 / Accepted: 18 March 2019 / Published: 20 March 2019

Abstract

:
The texture and the bulk stored energy along the thickness direction were extremely inhomogeneous in the clock-rolled tantalum sheets with 70% reduction. Therefore, the effects of different annealing temperatures on the microstructure and texture distribution of tantalum plates through the thickness were investigated by X-ray diffraction (XRD) and electron backscatter diffraction (EBSD). The results showed that the occurrence of strong {111} recrystallization texture in the center layer can be attributed to the subgrains nucleation mechanism when annealed at the low temperature. Many subgrains with {111} orientation appeared in the center layer, due to its high stored energy and preferential nucleation sites of the {111} deformed matrix, and rapidly grew into the effective nucleus, resulting in the large {111} grain size and strong {111} texture after complete recrystallization. Contrarily, at the high temperature, high-angle grain boundaries had sufficient driving force to generate migration, due to the lack of recovery, and the growth time of recrystallized nucleus was much shorter, contributing to relatively uniform recrystallization microstructure and texture distribution along the thickness.

1. Introduction

Tantalum (Ta), body-centered-cubic (BCC) structure, is a refractory metal with a series of excellent physical and chemical properties, such as corrosion resistance and good ductility, which makes it an ideal material for microelectronics and sputtering targets [1]. The quality of the sputtered film plays a key role in the semiconductor integrated circuit industry, and the grain size and crystal orientation distribution of the sputtering target have a direct influence on the quality of the sputtered film [2,3]. Different crystal orientations and grain size can lead to the difference in sputtering rates during magnetron sputtering [4]. In order to ensure the quality of the sputtered film, the average grain size of the target is required to be within a certain range. Besides, equiaxed grains and randomly distributed grain orientation through the thickness in Ta plate are necessary to improve the uniformity of the deposited film.
The high-purity Ta ingots are mainly prepared by electron beam melting (EBM) method, and the purity can be not only 5N (99.999 at.%) but even 6N (99.9999 at.%) [5]. However, severe through-thickness texture gradients and coarse grain size exist in the ingots only by EBM and cannot be directly applied. Therefore, subsequent forging, rolling, annealing and combined with other processing method are often adopted to produce the Ta plates with fine and uniform grain size, as well as random crystallographic orientation in the industrial production [6]. The deformed and recrystallized behavior of Ta plate is closely related to the grain orientation during conventional rolling [7]. Grains with different orientations always exhibit different deformation behavior, resulting in the different splitting structures and stored energy distribution. In the subsequent recrystallization process, the difference in stored energy as recrystallization driving force and deformed microstructure as nucleation site in different regions, ultimately results in inhomogeneous recrystallization microstructure [8].
Previous studies have reported that changes in strain paths during deformation can affect plastic deformation behavior and thus affect the texture formation [9,10]. Recently, our research work [6,7,8] has shown that 135° clock rolling (sequentially changing the rolling direction by 135° around the normal direction) effectively mitigates the through-thickness texture gradients that are always present in conventional rolled Ta plates. However, the uniformity of the texture distribution is closely related with the clock-rolled passes [6,8]. In other words, the increase of the clock-rolled passes during the deformation can lead to a more uniform microstructure and texture distribution, but a severe texture gradient along the thickness can be formed when the clock-rolled passes are limited. Obviously, the decrease of rolling passes can effectively lower the costing in the industry and improve production efficiency.
Hence, the Ta sheets were clock-rolled to 70% reduction in thickness only by eight passes to produce the severe texture gradient along the thickness. Electron backscatter diffraction was used to characterize the through-thickness recrystallization microstructure evolution at a different temperature, and X-ray diffraction technique was adopted to characterize the complete recrystallization texture distribution in the surface and center layers. The purpose of the current work is to explore appropriate annealing temperatures to ameliorate severe texture and microstructure gradient existing in clock-rolled Ta plates with eight passes.

2. Experimental Method

The raw materials for the experiment were prepared by EBM, and the purity was 99.95 wt%. The specific chemical composition can be found in Ref. [8]. The starting tantalum ingot was processed by forging to 20 mm thickness followed by annealing. Samples were 135°-clock-rolled to 70% reduction in thickness, in eight rolling passes. Then, the specimens (10 L × 8 W × 3 T mm3) cut from the as-rolled Ta plates were annealed at different temperatures in vacuum conditions. The specific annealing parameters were shown in Table 1. The surface and center layers of the specimen were tested, as shown in Figure 1.
The macrotexture and bulk stored energy of the surface and center layers (RD-TD plane) of the samples were measured by X-ray diffraction (XRD) (Rigaku, Tokyo, Japan). The detection was performed on a Rigaku D/max 2500PC diffractometer (40 kV/150 mA, Rigaku, Tokyo, Japan). Four incomplete pole figures {110}, {200}, {211} and {222} were recorded by the Schulz reflection method using the Kα radiation of the Cu target, and the orientation distribution function (ODF) was calculated by the ACD method [11]. The commercial software Labo Tex3.0 (Rigaku, Tokyo, Japan) was then used for data analysis. To quantify the orientation-dependent bulk stored energy, the {200} and {222} line profiles were recorded by step-scan with a step size of 0.01° and timing 1 s per step. An acceptable peak was obtained after optimizing the peak-to-background ratio.
The recrystallized microstructure was characterized by electron backscatter diffraction (EBSD). The measurement was performed on a TESCAN MIRA3 field emission gun-scanning electron microscope (TESCAN, Oxford, UK) and an HKL Channel 5 software (5.0.9.0, Oxford Instrument, Oxford, UK) was used for data acquisition and analysis. The samples were prepared by fine mechanical polishing followed by electro-polishing using a mixture of hydrofluoric acid and sulphuric acid (1:9 by volume) at ambient temperature. Note that at least five EBSD maps were taken for each condition to ensure data reliability. To quantify the progress of recrystallization in both series, segments of the microstructure were assigned one of three possible classifications for each micrograph: (1) “Deformed”, which indicates a grain average misorientation (GAM) of greater than 2°, (2) “substructured,” which indicates grains that have GAM less than 2° but boundaries with disorientation between 2° and 15°, (3) “recrystallized” if GAM is less than 2° and all grain boundary disorientation angles are greater than 15°. Recrystallization fractions are computed by Channel 5 according to the above conditions.

3. Results

3.1. Deformation Behavior

3.1.1. Texture Distribution

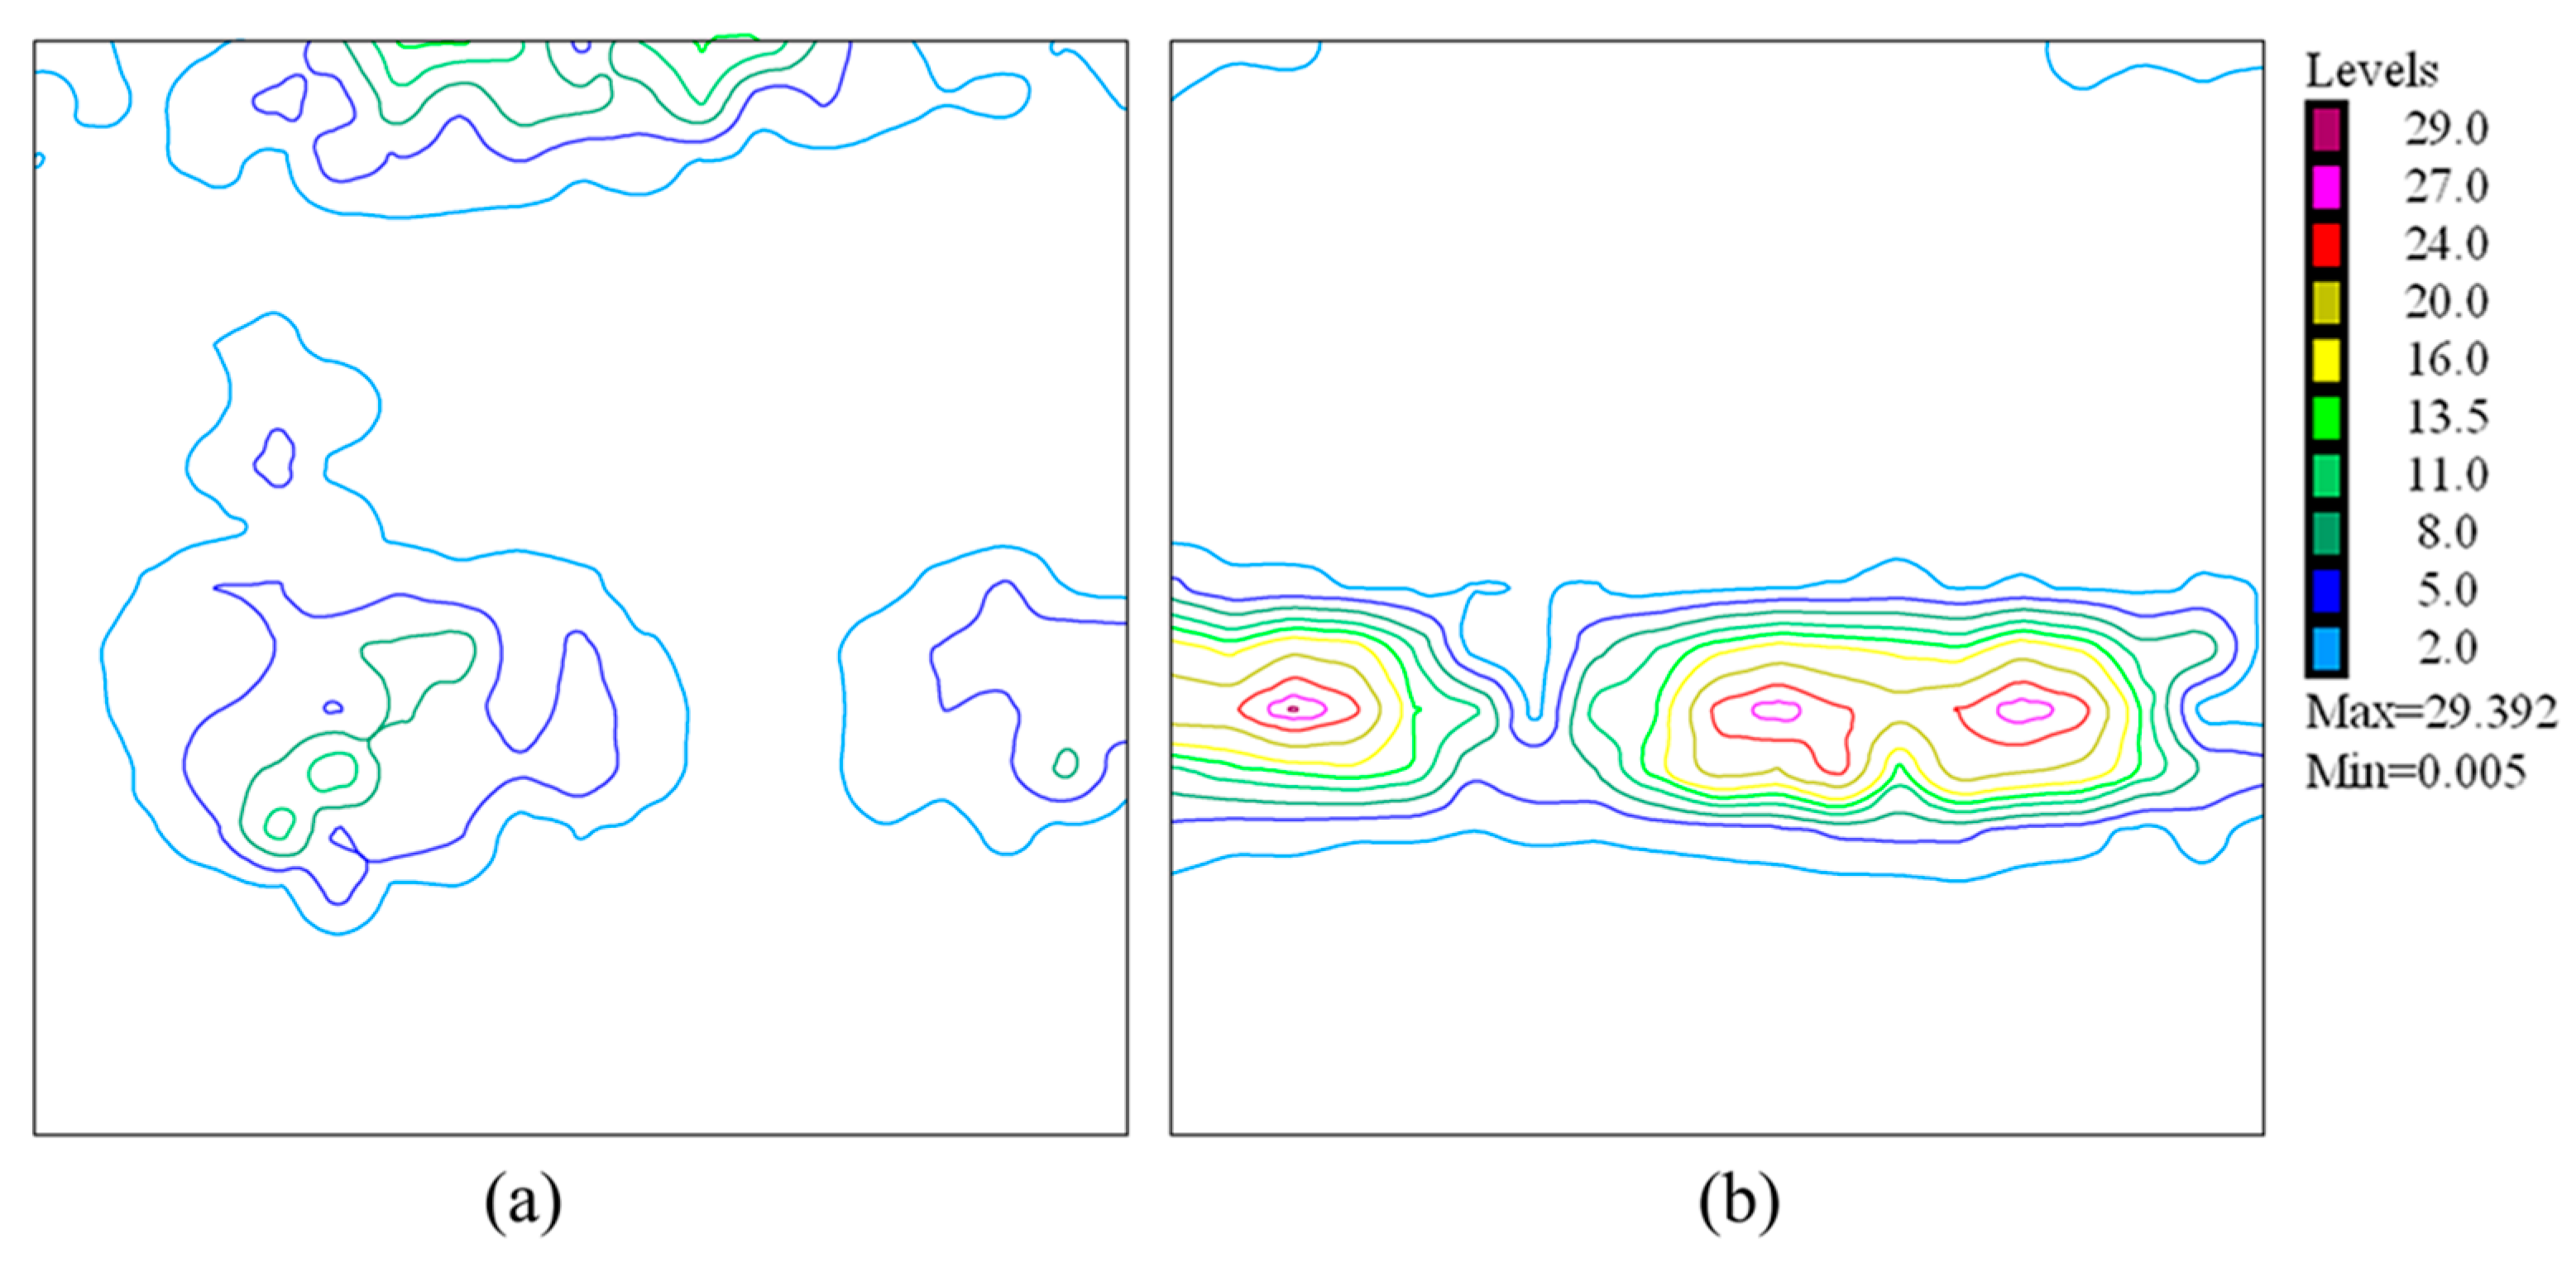
Generally, three types of fiber texture can be formed in BCC metals after rolling, i.e., the γ fiber with <111> parallel to the normal direction (ND), θ fiber with <100> along ND, and α fiber with <110> parallel to RD [12]. Note that all the orientations along these fibers can be revealed in the φ2 = 45° section in the Euler space, as illustrated in Ref. [8]. Figure 2 shows the through-thickness texture distribution of clock-rolled Ta sheets with 70% deformation. As shown in the ODF sections, severe texture gradient through the thickness was formed in the eight-passes sample. It can be found that the diffuse {111} <uvw> and {100} <uvw> texture was formed in the surface layer, and the maximum ODF intensity, f(g) value, reached 13.2. However, the strong {111} <uvw> texture was formed in the center layer and the maximum f(g) value reached 29.3, which is in accordance with the typical texture composition introduced by plane-strain deformation with regard to BCC metals.

3.1.2. Stored Energy Distribution

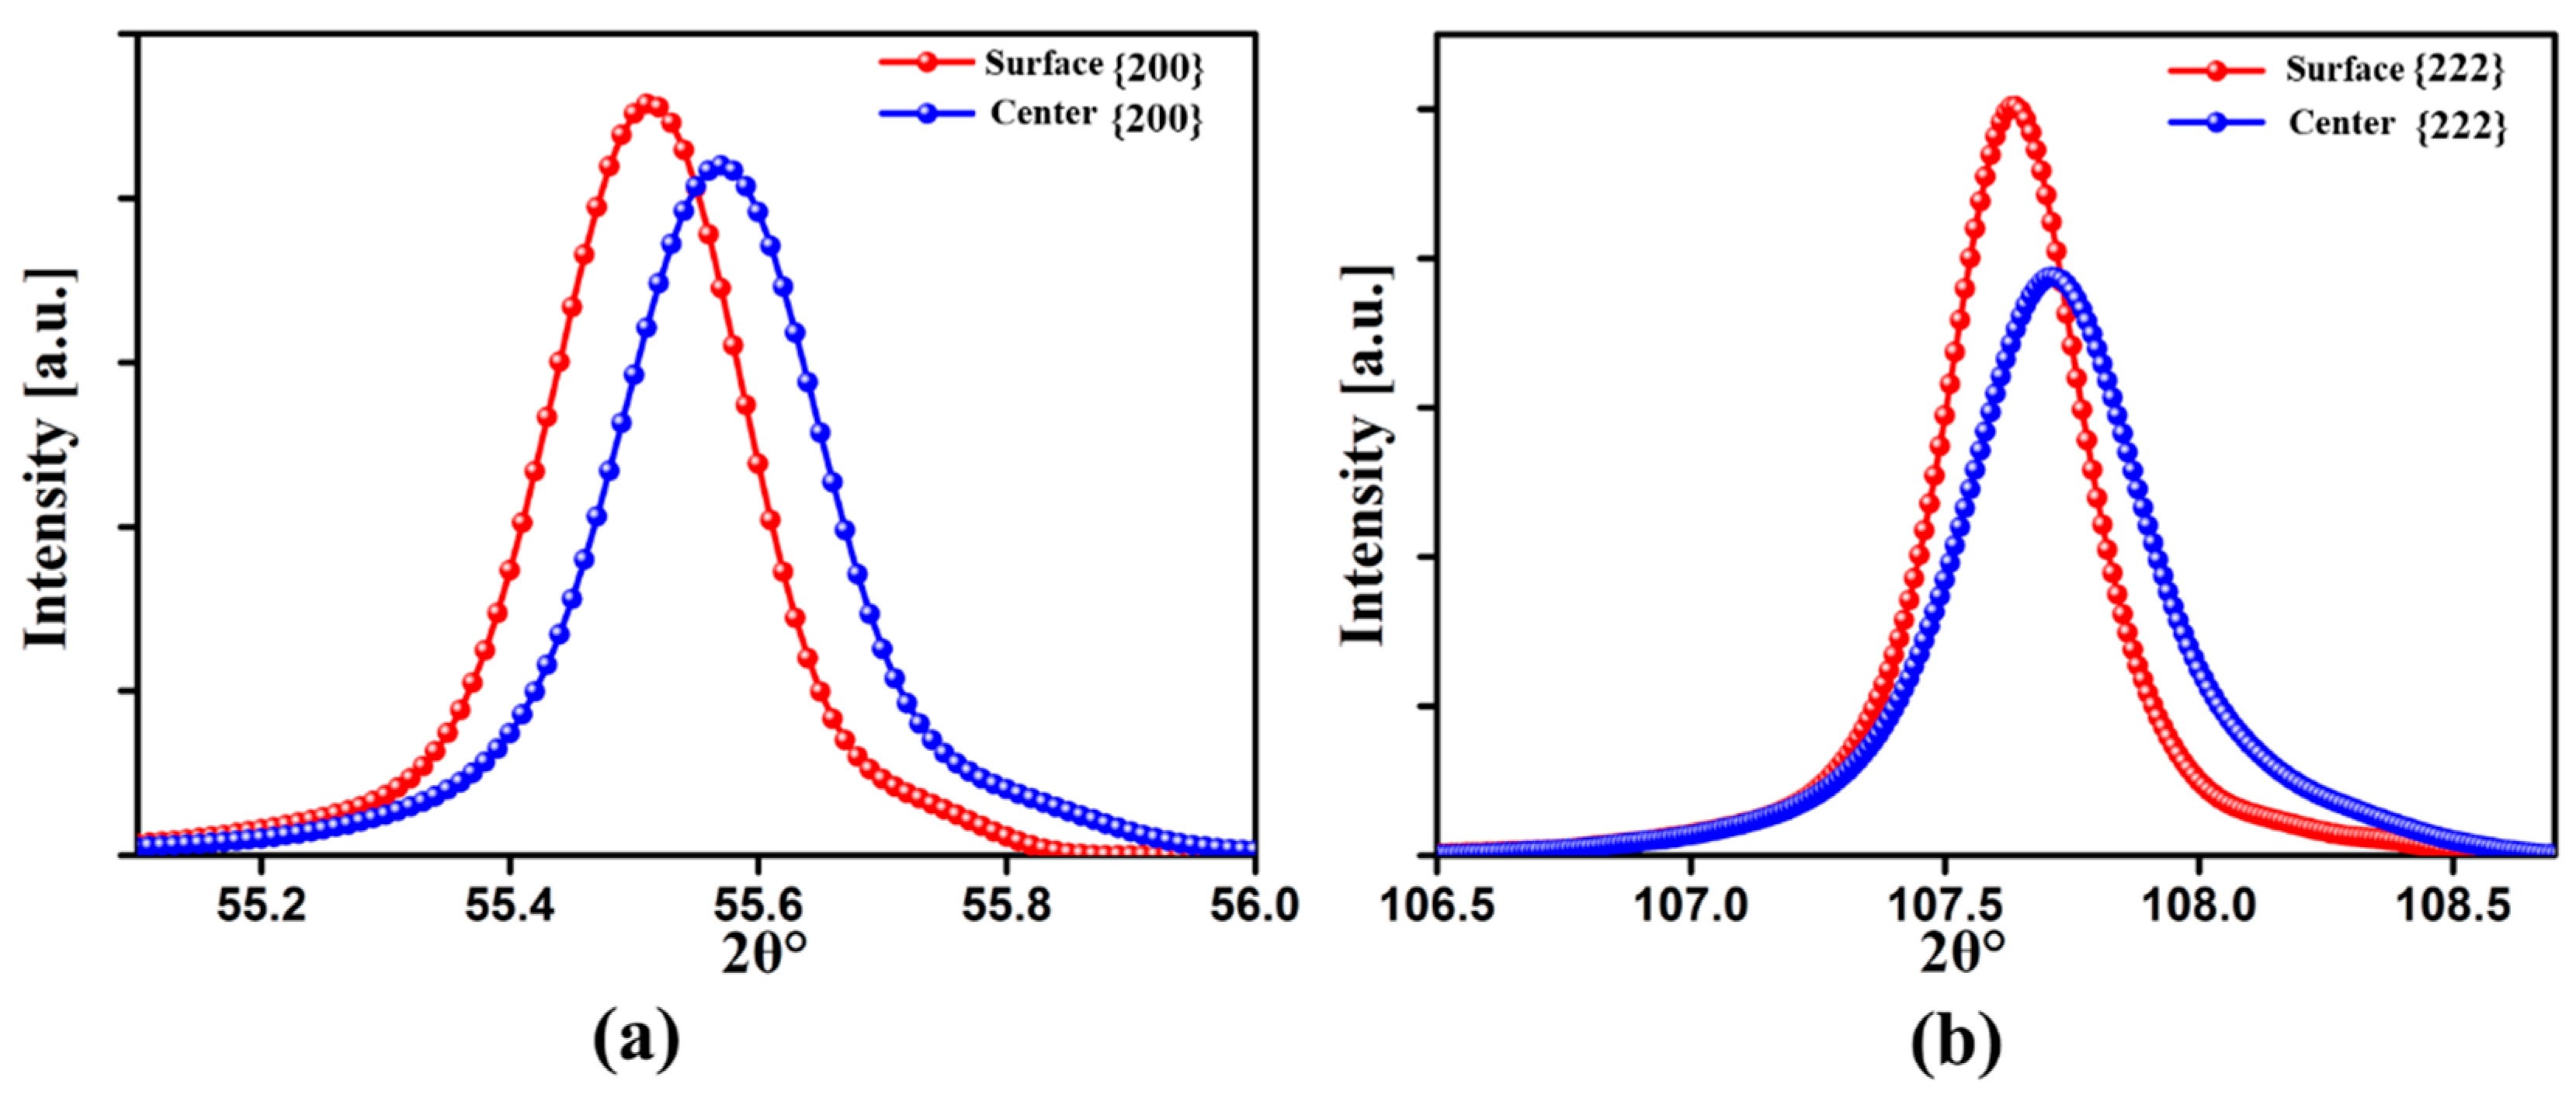
The strain state during a deformation process is not constant, but varies gradually along the thickness direction, resulting in the significant difference in the deformation stored energy at different thickness layer. The presence of microscopic stress, causing large variation in the lattice spacings, can lead to the broadening of X-ray diffraction lines [13]. Therefore, XRD measurements can be used to evaluate the lattice distortion, i.e., stored energy, as shown in Figure 3. In the early years, Rajmohan et al. [14] have adopted a modified Stibitz formula [15] for calculating the stored energy along different crystallographic orientation using direction-dependent Young’s modulus Yhkl and Poisson’s ratio vhkl as follows:
S E h k l = 3 2 Y h k l ( B r 2 B a 2 ) / 4 t a n 2 θ ( 1 + 2 ν h k l 2 ) ,
where θ is the Bragg angle; Yhkl and vhkl are the orientation-dependent Young’s modulus and Poisson’s ratio, which are 145.6 GPa and 0.32 for θ fiber, and 284.4 GPa and 0.36 for γ fiber, respectively [16,17,18]; Br and Ba are the measured full widths at half maximum of the rolled and fully recrystallized Ta, respectively. The values of the stored energy along the planes {222} and {200} have been estimated using the direction-dependent Y{hkl} and v{hkl} and were presented in Table 2. Obviously, the stored energy distribution in the eight-passes sample through the thickness was extremely inhomogeneous, and the stored energy in the center layer was much higher than the surface layer. Besides, the stored energy difference between the {111} and {100} oriented grain was also significant.

3.2. Recrystallization Behavior

3.2.1. Microstructure Distribution when Annealed at 950 °C

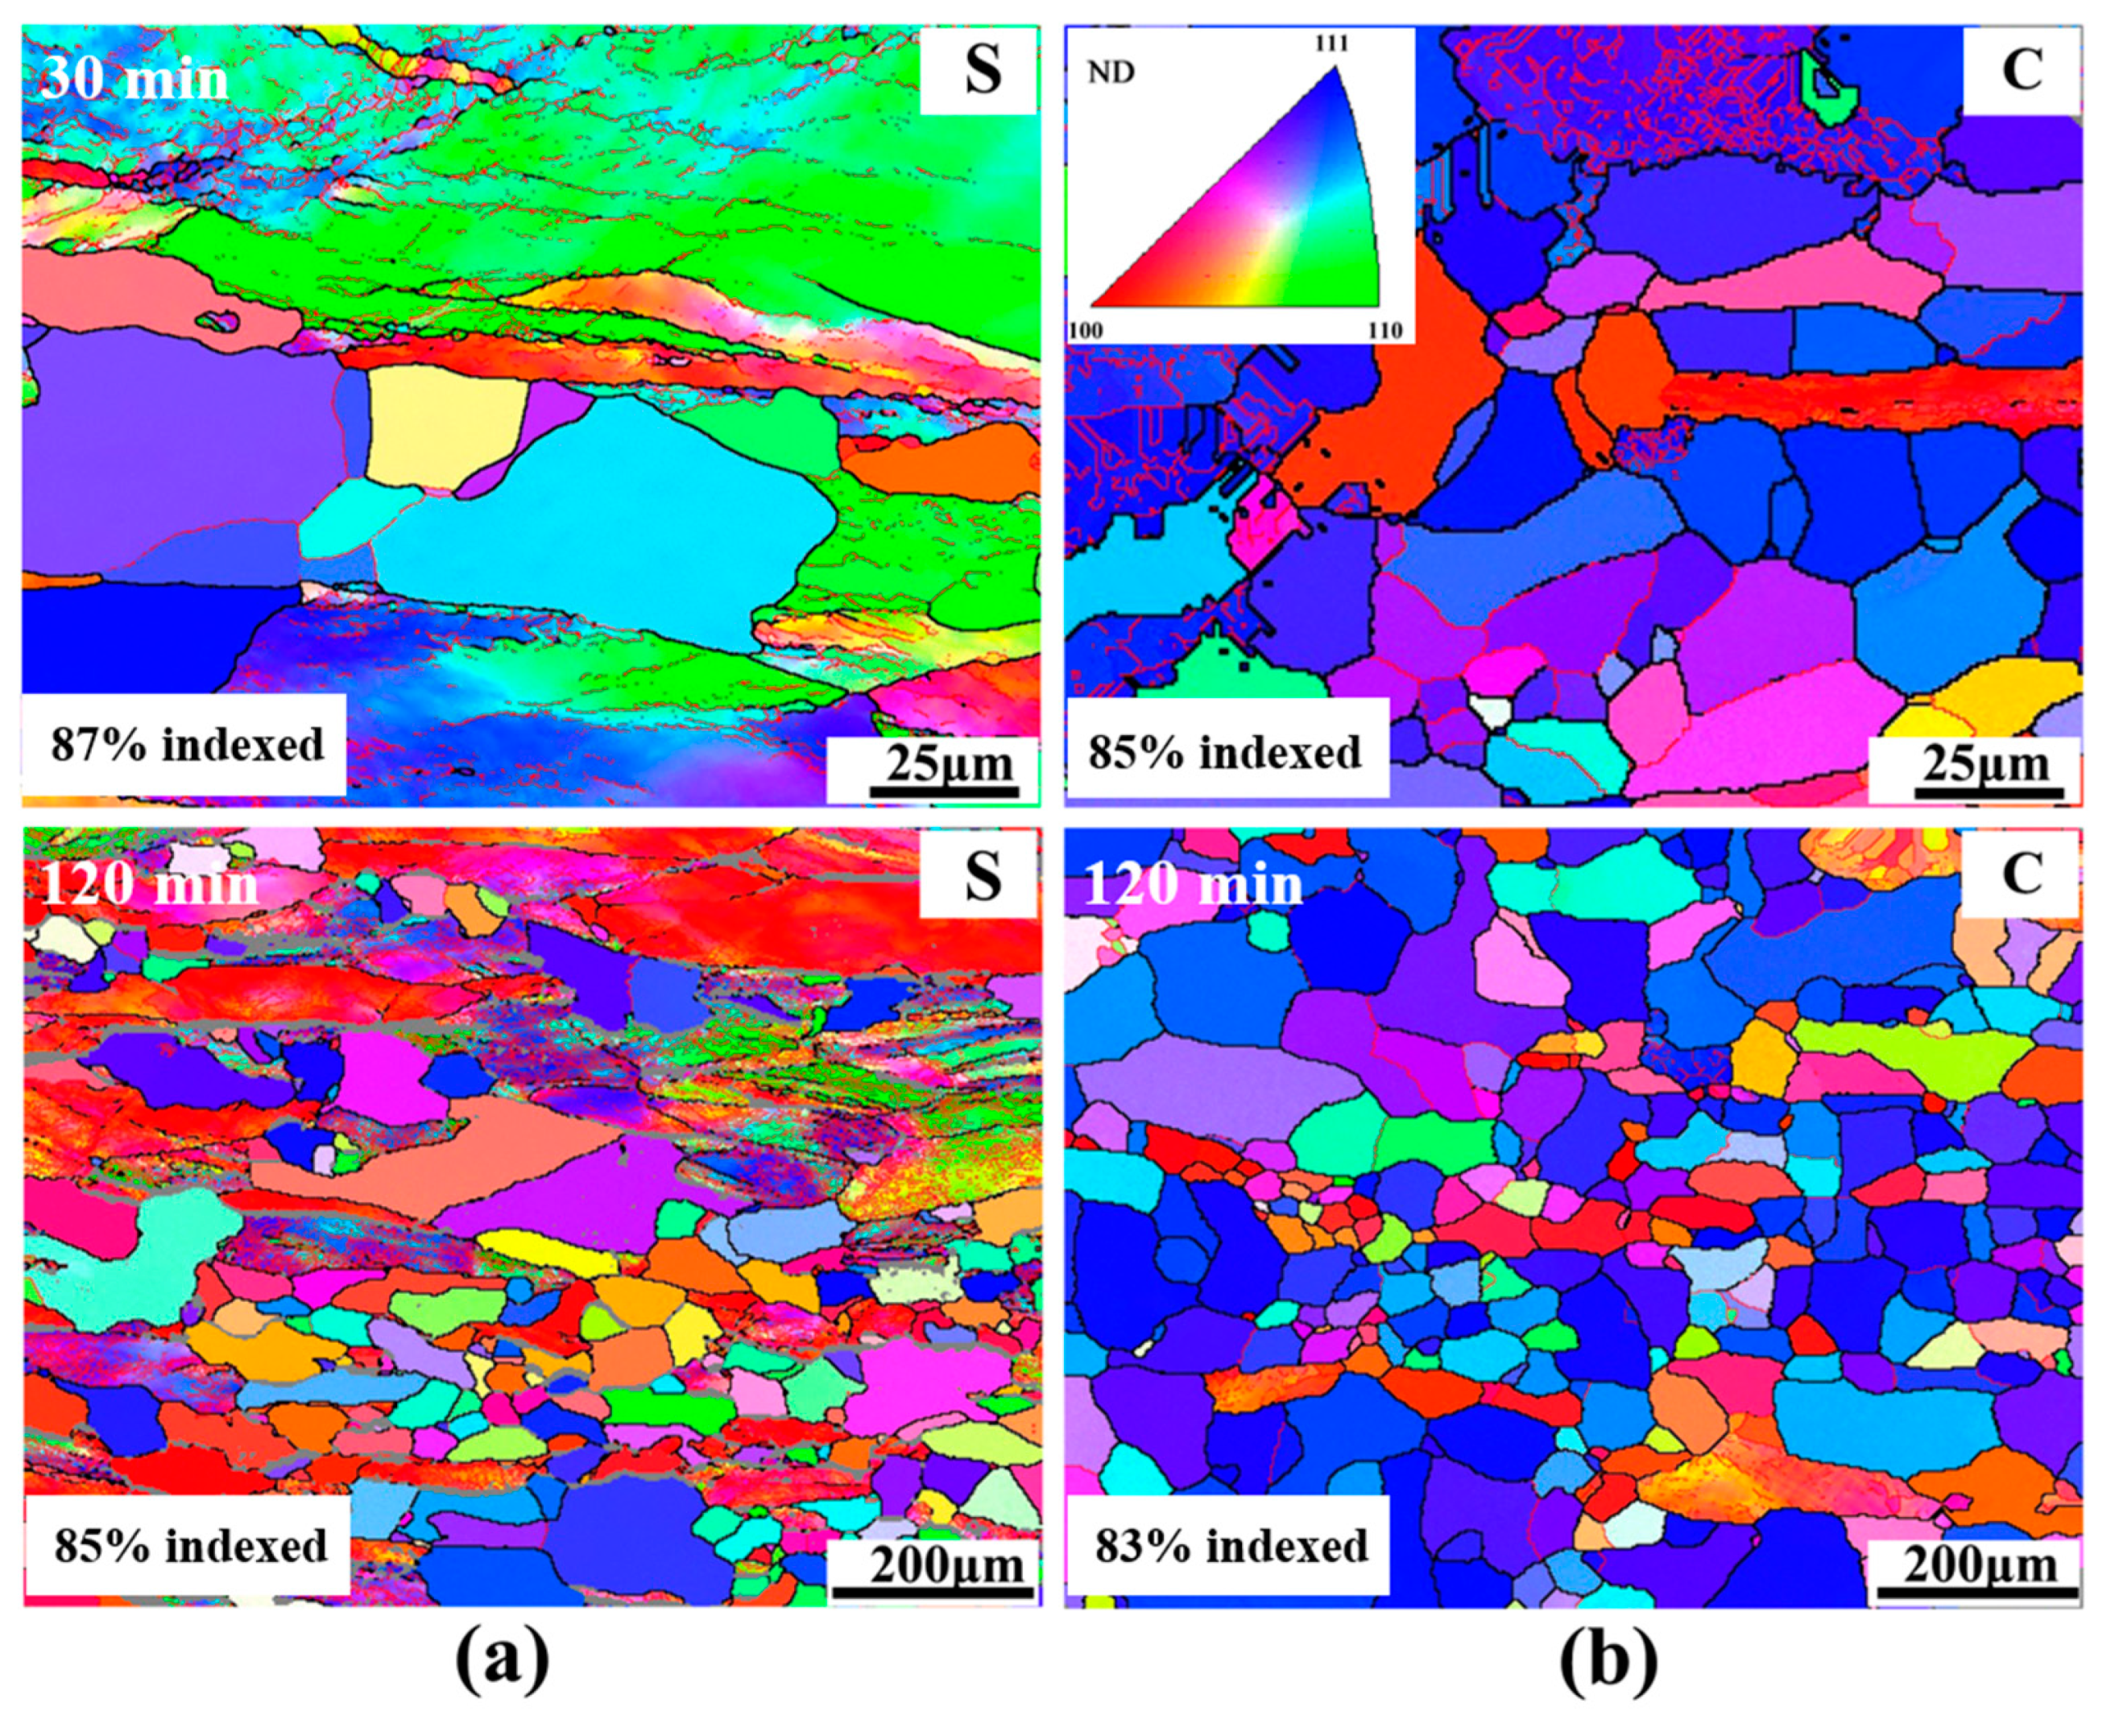
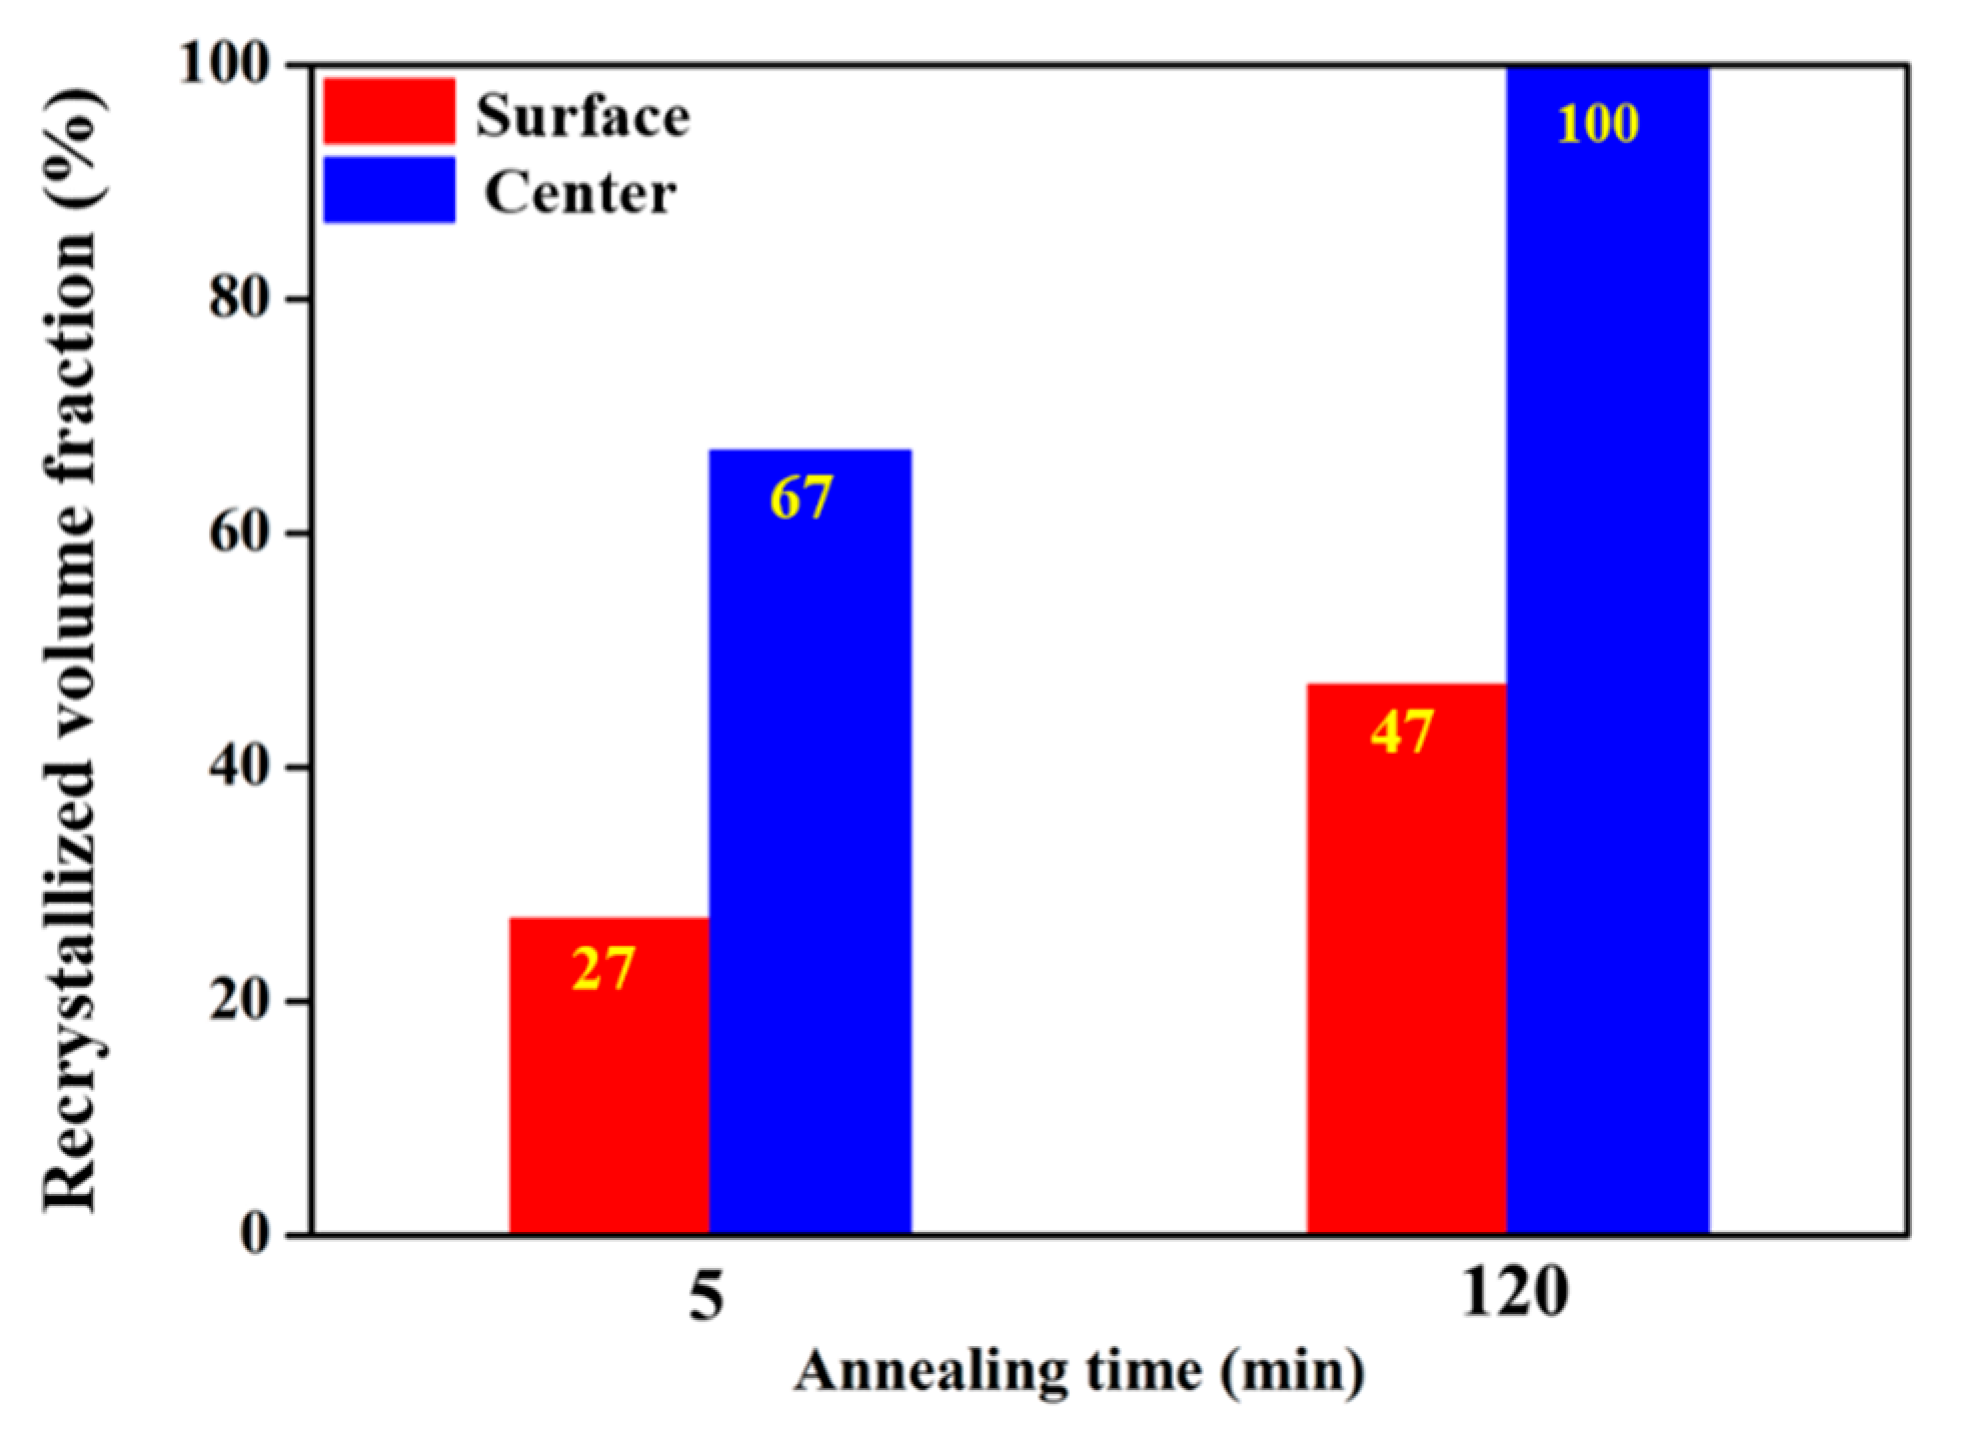
Figure 4 shows the recrystallized microstructure evolution of the sample along the thickness after annealing at 950 °C for 30 min and 120 min. Figure 5 is the corresponding recrystallization volume fraction. Note that the grain boundaries, with misorientation angles higher than 15°, are represented with dark solid lines. While the sub-grain boundaries, or sub-boundaries, with misorientation angles higher than 2° and less than 15°, are depicted by fuchsia solid lines. It can be seen that when the annealing time reached for 30 min, the recrystallization volume fraction of the surface layer was 27%, and the recrystallization fraction of the center layer reached 67%. Further extending annealing time to 120 min, recrystallization fraction in the surface layer accounted for 47% and many {100} elongated grains still remained in the surface layer, indicating a partial recrystallized state, while recrystallization has been finished completely in the center layer. Obviously, the center layer of the sample showed a much faster recrystallization rate than the surface layer.

3.2.2. Microstructure and Texture Distribution when Annealed at 1050 °C

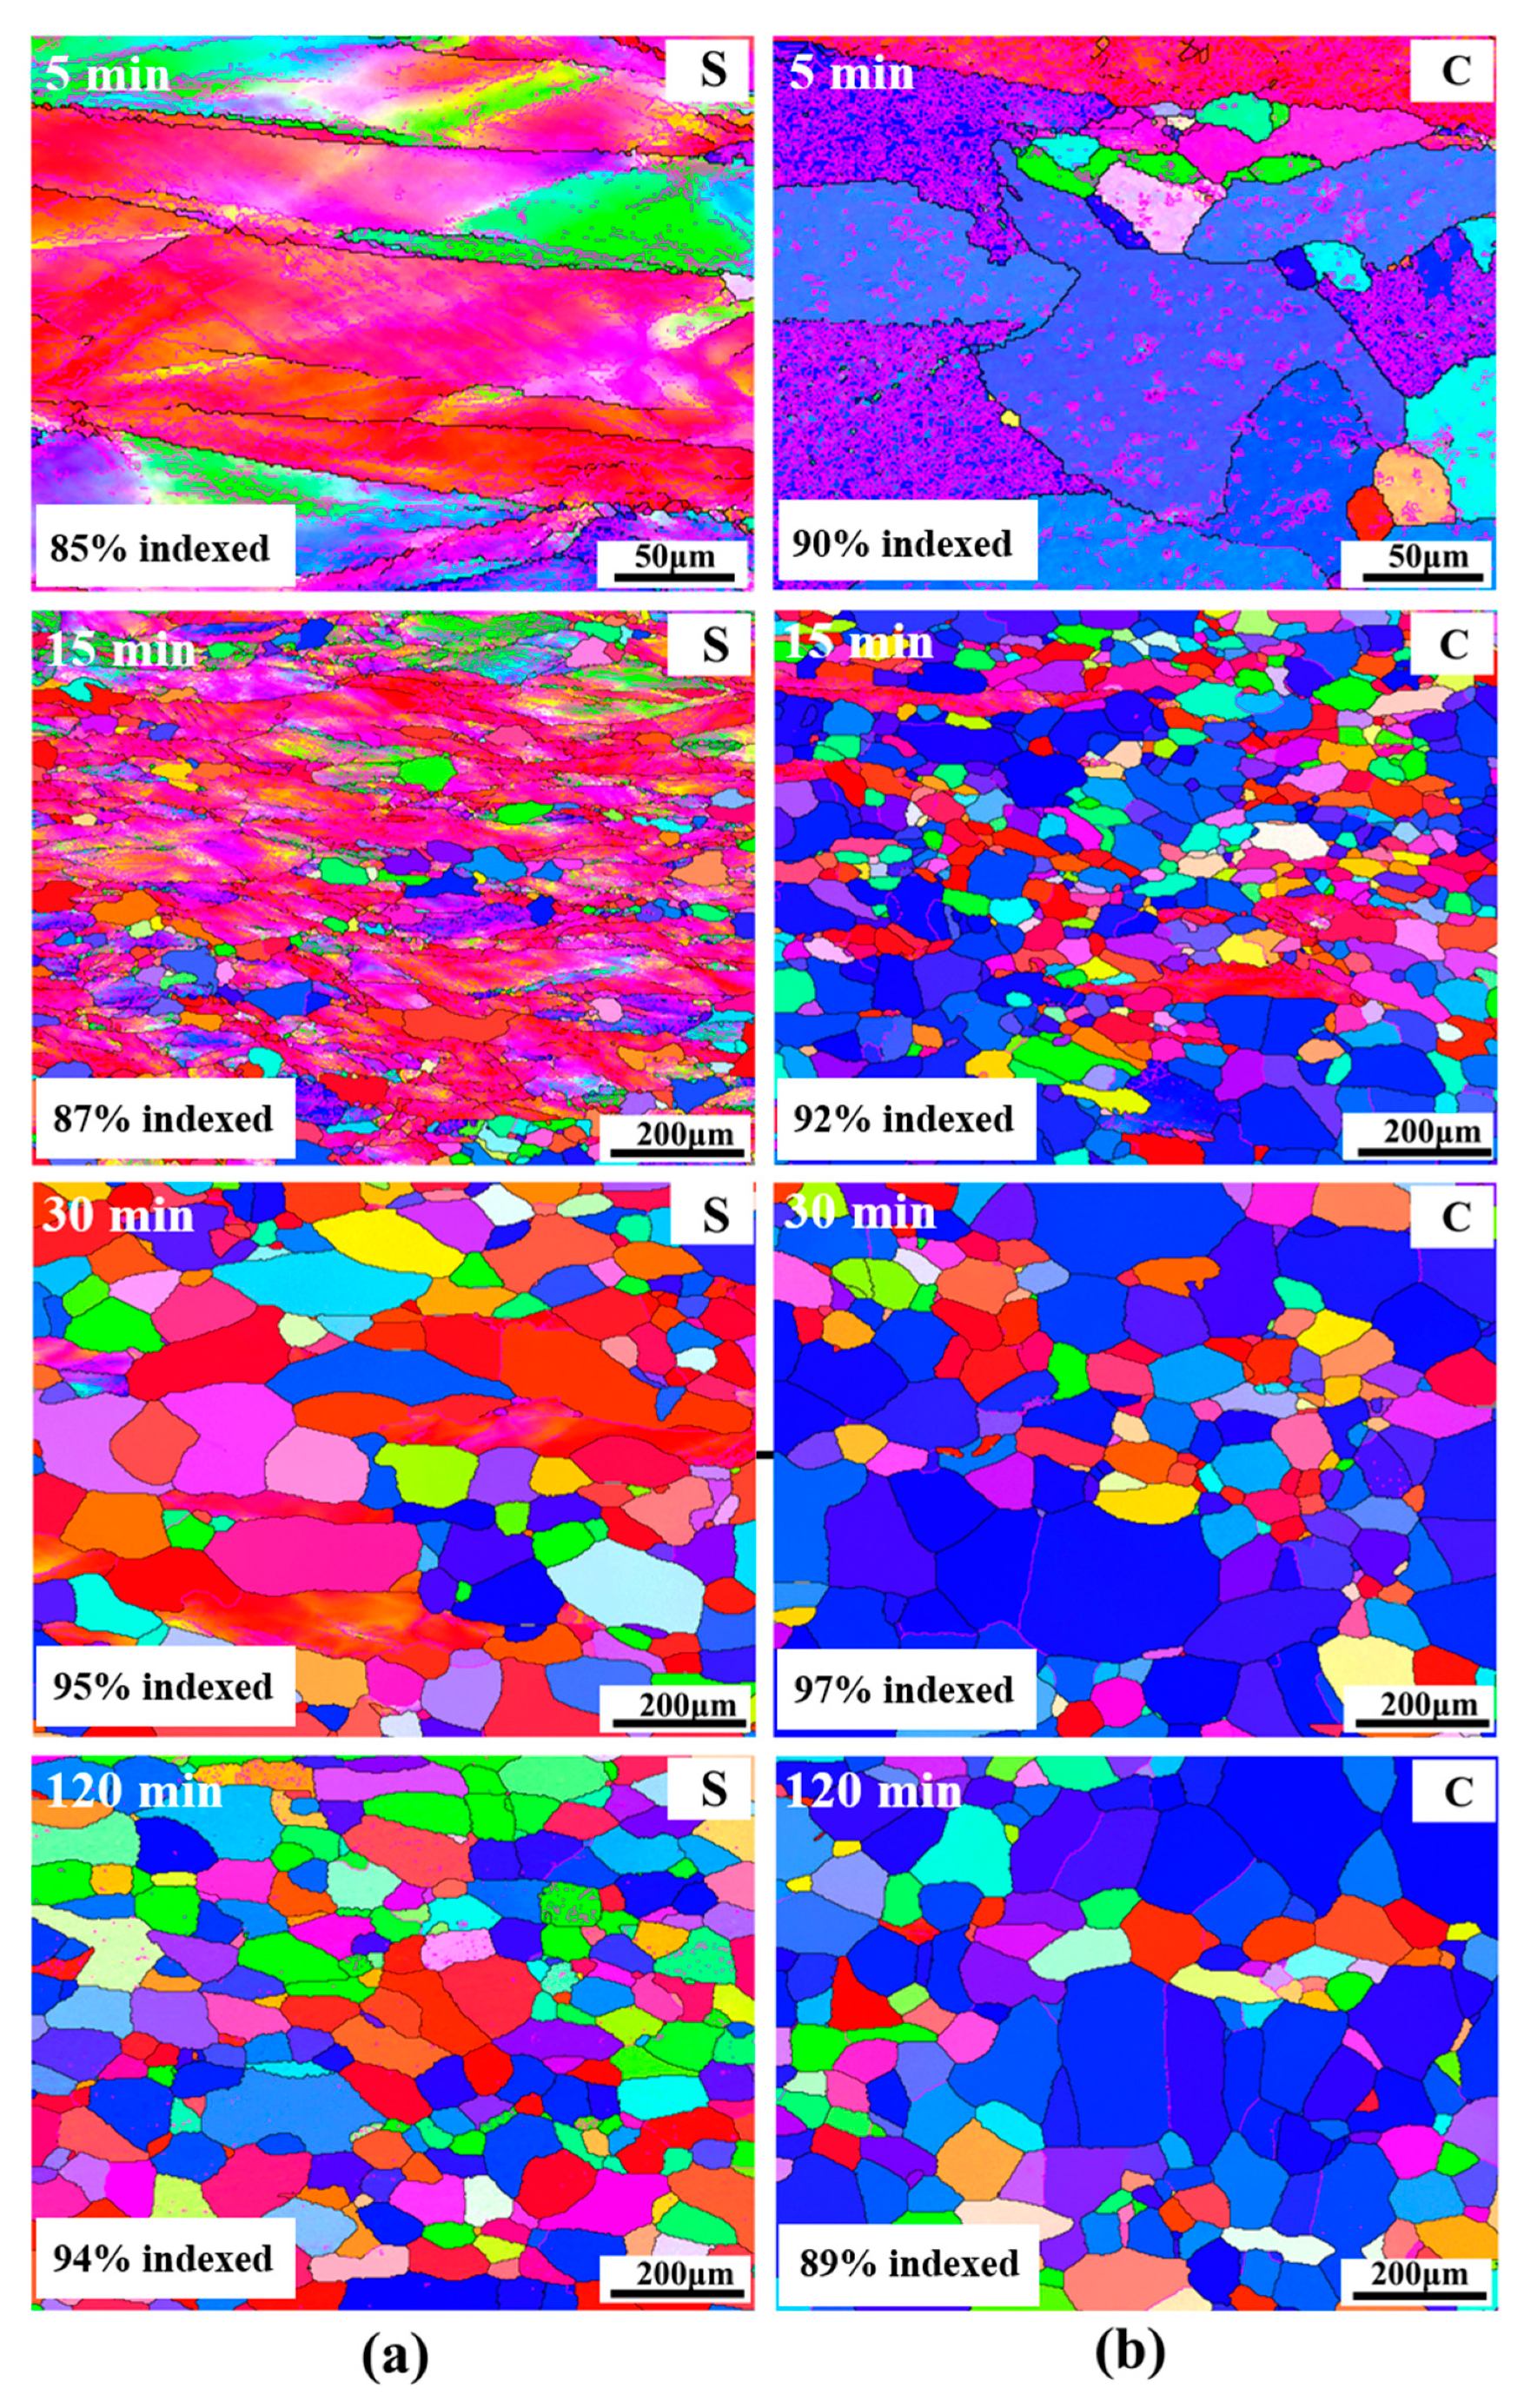
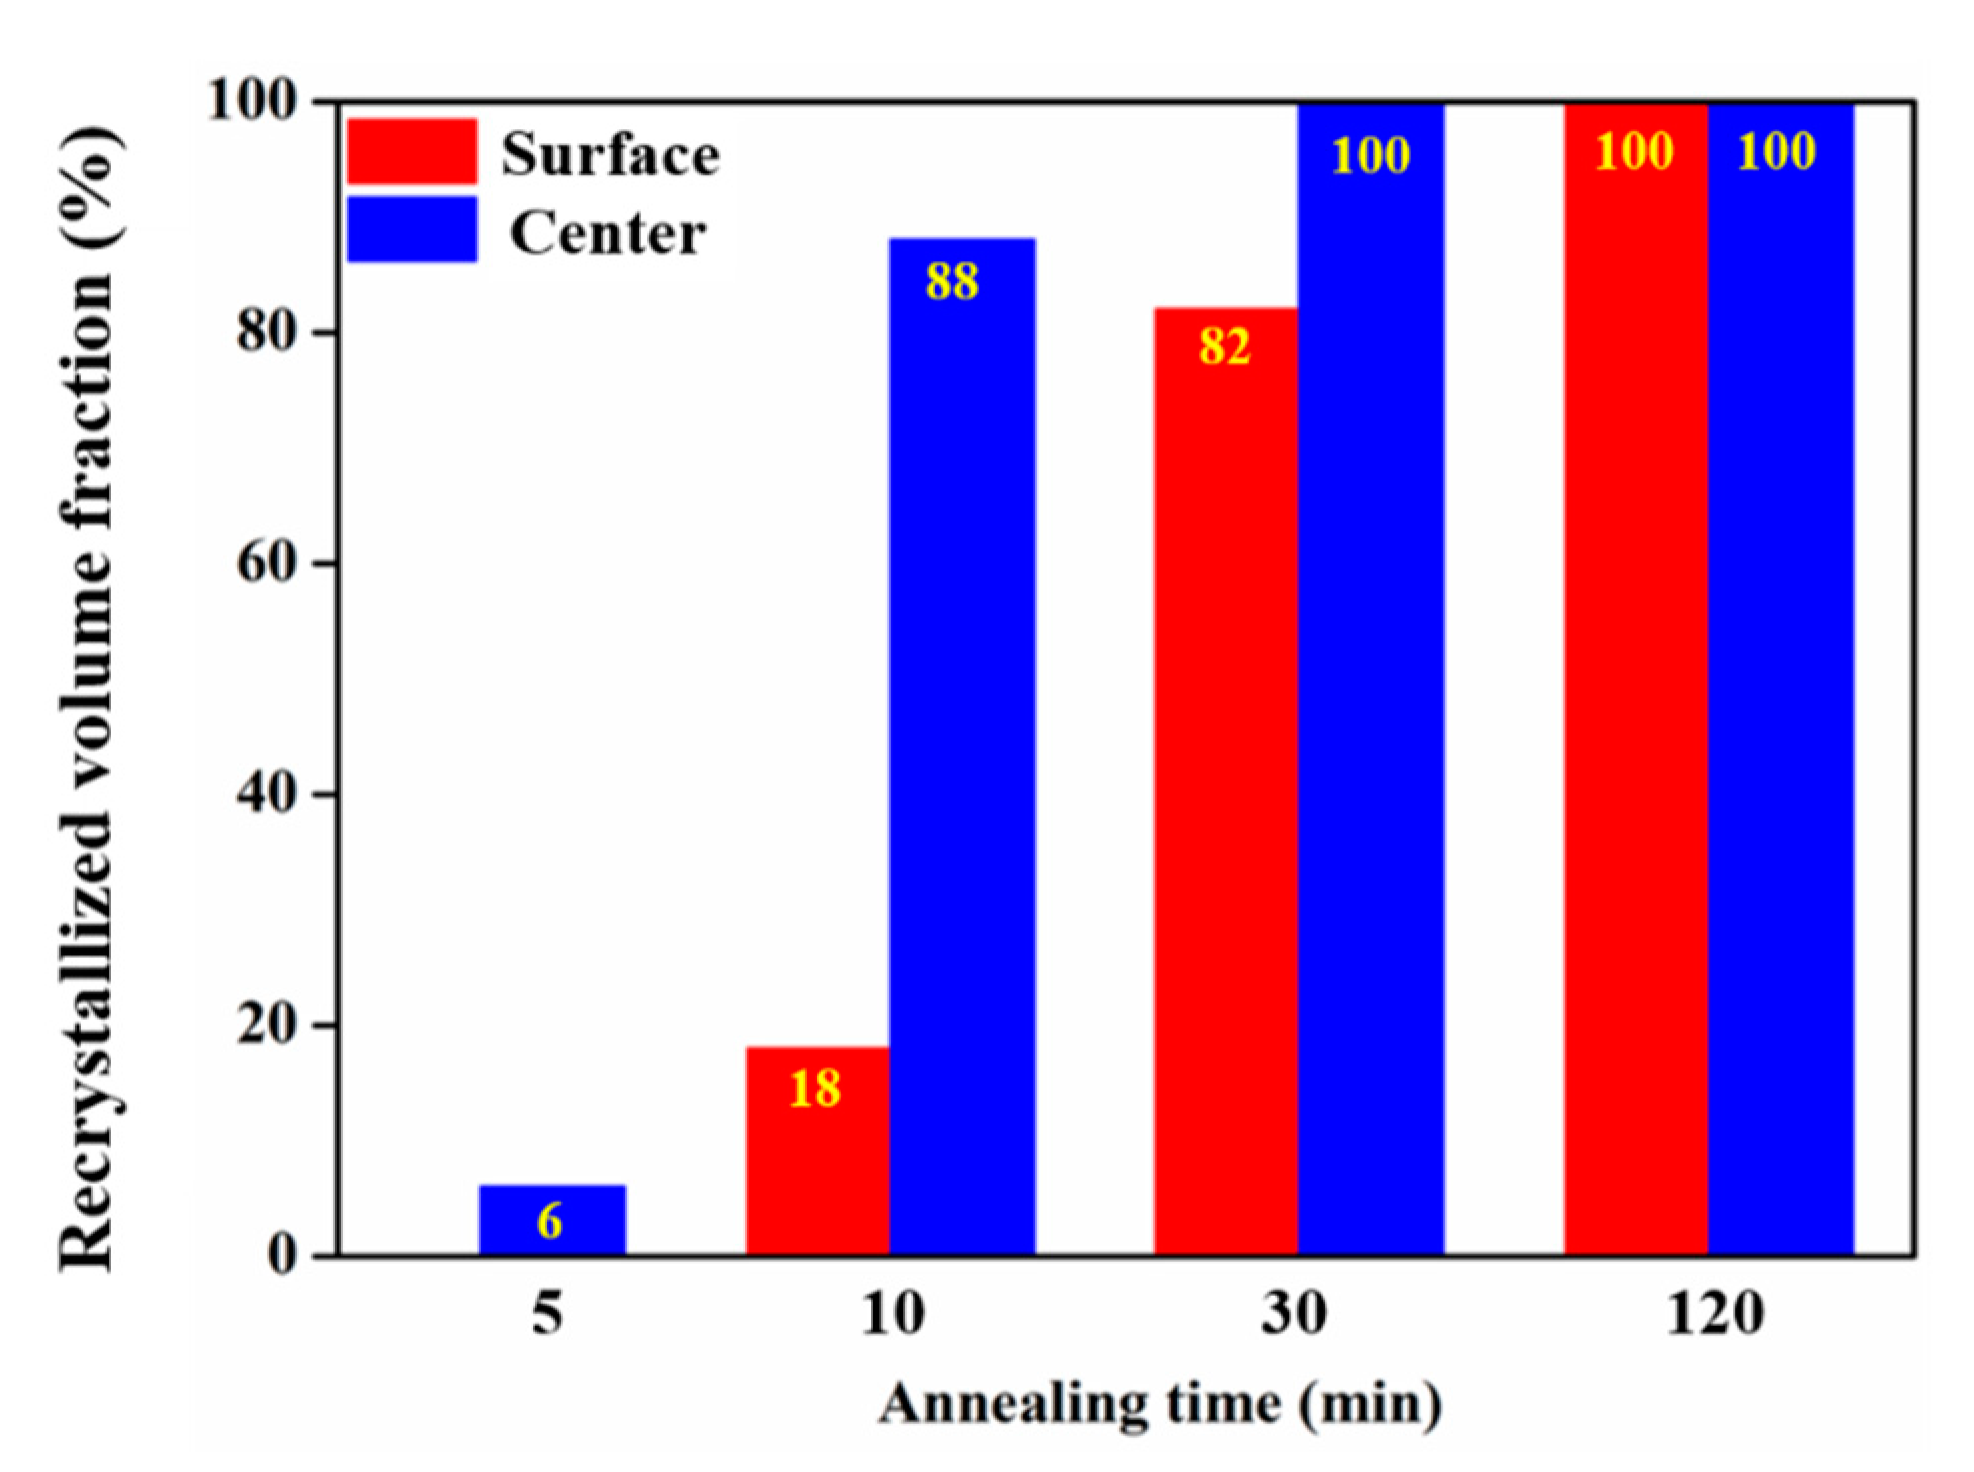
Figure 6 shows the recrystallization microstructure evolution of the sample along the thickness after annealing at 1050 °C for different times. Figure 7 is the corresponding recrystallization volume fraction. As explicitly presented in Figure 6, recrystallized grain with {111} orientation appeared in the center layer firstly and the recrystallization fraction was 6% when annealed for 5 min, while no recrystallization phenomenon occurred in the surface layer and grains were still in a deformed state. After annealing for 15 min, recrystallization fraction in the surface and center layers accounted for 18% and 88%, respectively. When annealing time increased to 30 min, the recrystallization fraction of the surface layer increased to 82% and the center layer was in complete recrystallization state. Extending annealing time to 120 min, the {100} deformed matrix in the center layer was consumed completely and annealed microstructure through the thickness consisted of fully recrystallized grains almost free of sub-boundaries, indicating a fully recrystallized state.
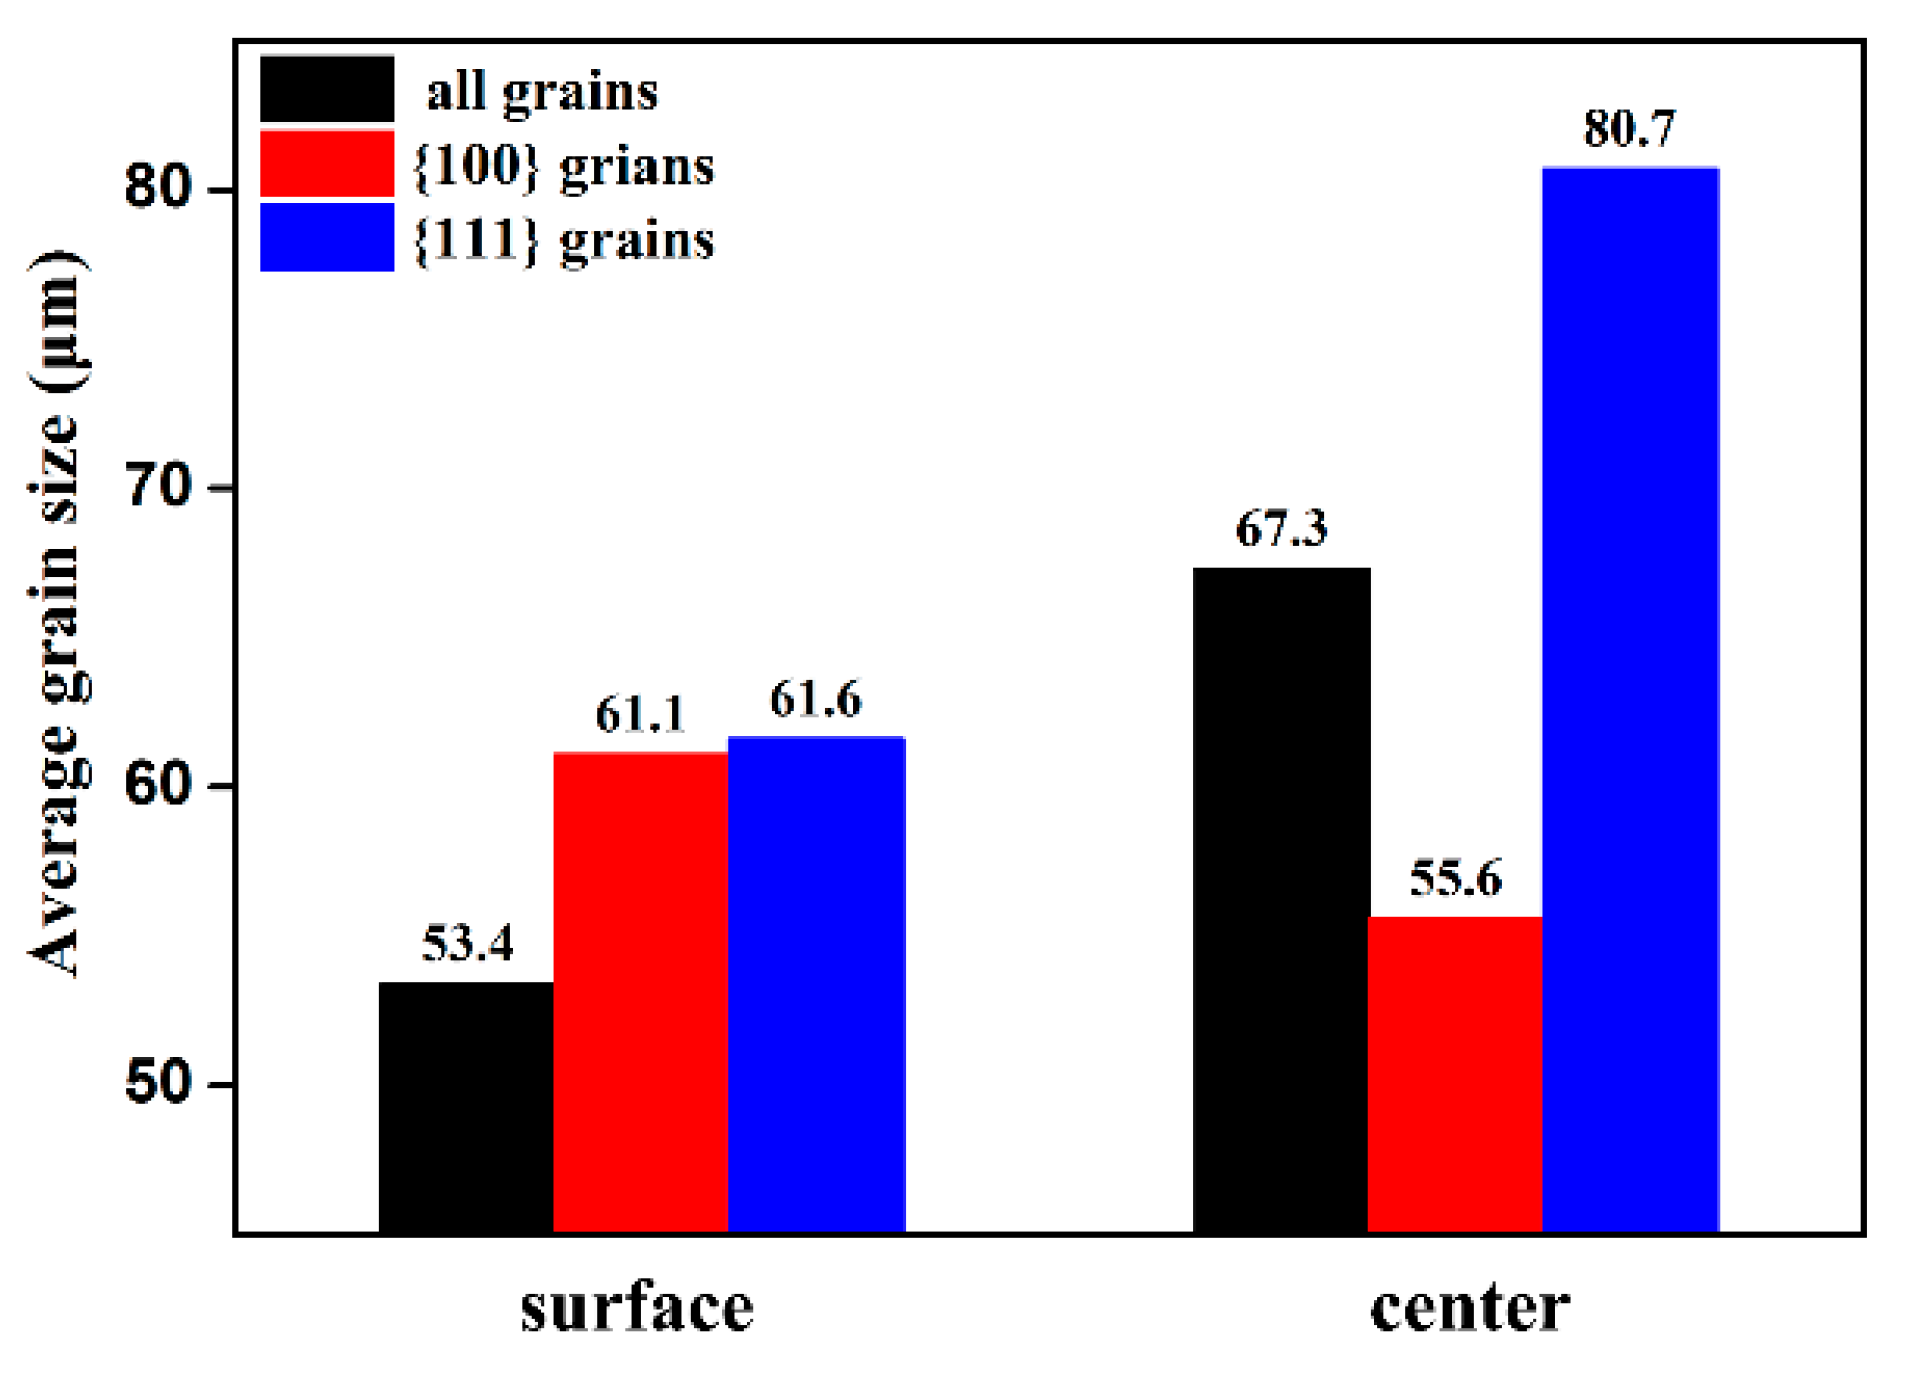
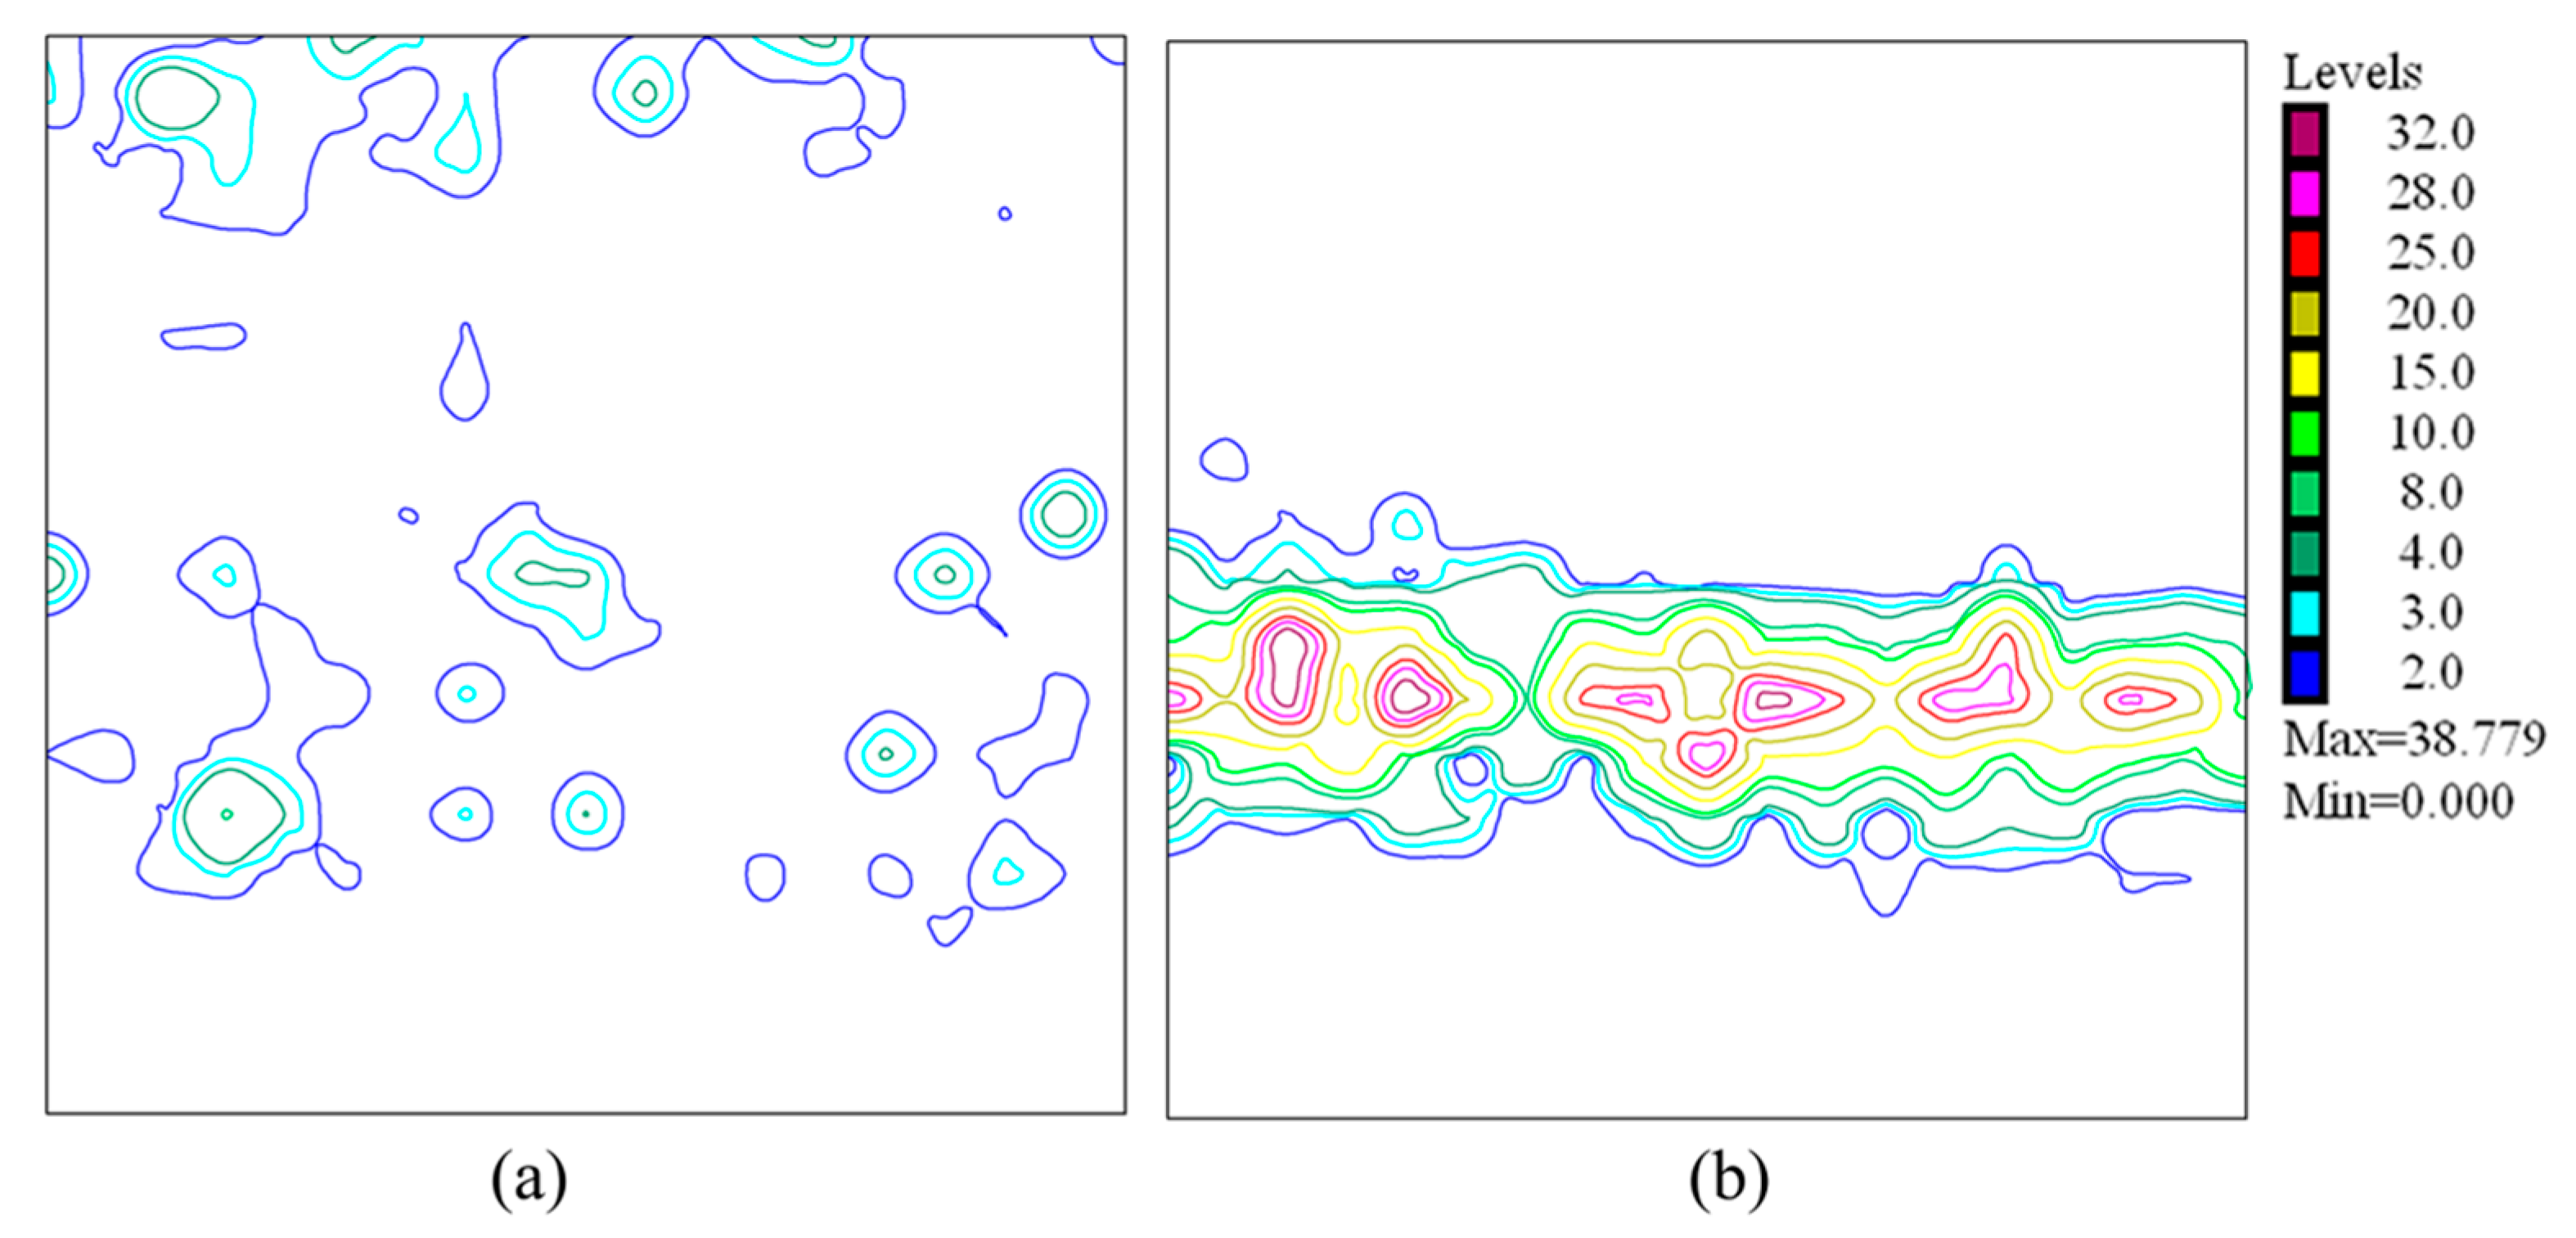
Figure 8 is the average recrystallization grain size of the surface and center layers when annealed at 1050 °C for 120 min. Obviously, the grain size distribution through the thickness was extremely inhomogeneous after complete recrystallization. More accurately, the average grain size of the center layer is larger than the surface, and the difference between them was 14 µm. Besides, it should be noted that the average size of the {111} grain in the center layer was much higher than the {100} grain, and the difference between them reached 25.1 µm. Further statistics on the recrystallized texture in the surface and center layers revealed that the γ-fiber texture was very strong in the center layer, and the maximum intensity f(g) value reached 38.7, while the θ-fiber texture was extremely minor (see Figure 9b). However, both the γ-fiber and θ-fiber texture were weak in the surface layer and the maximum intensity f(g) value was 7.5, as shown in Figure 9a.

3.2.3. Microstructure and Texture Distribution when Annealed at 1250 °C

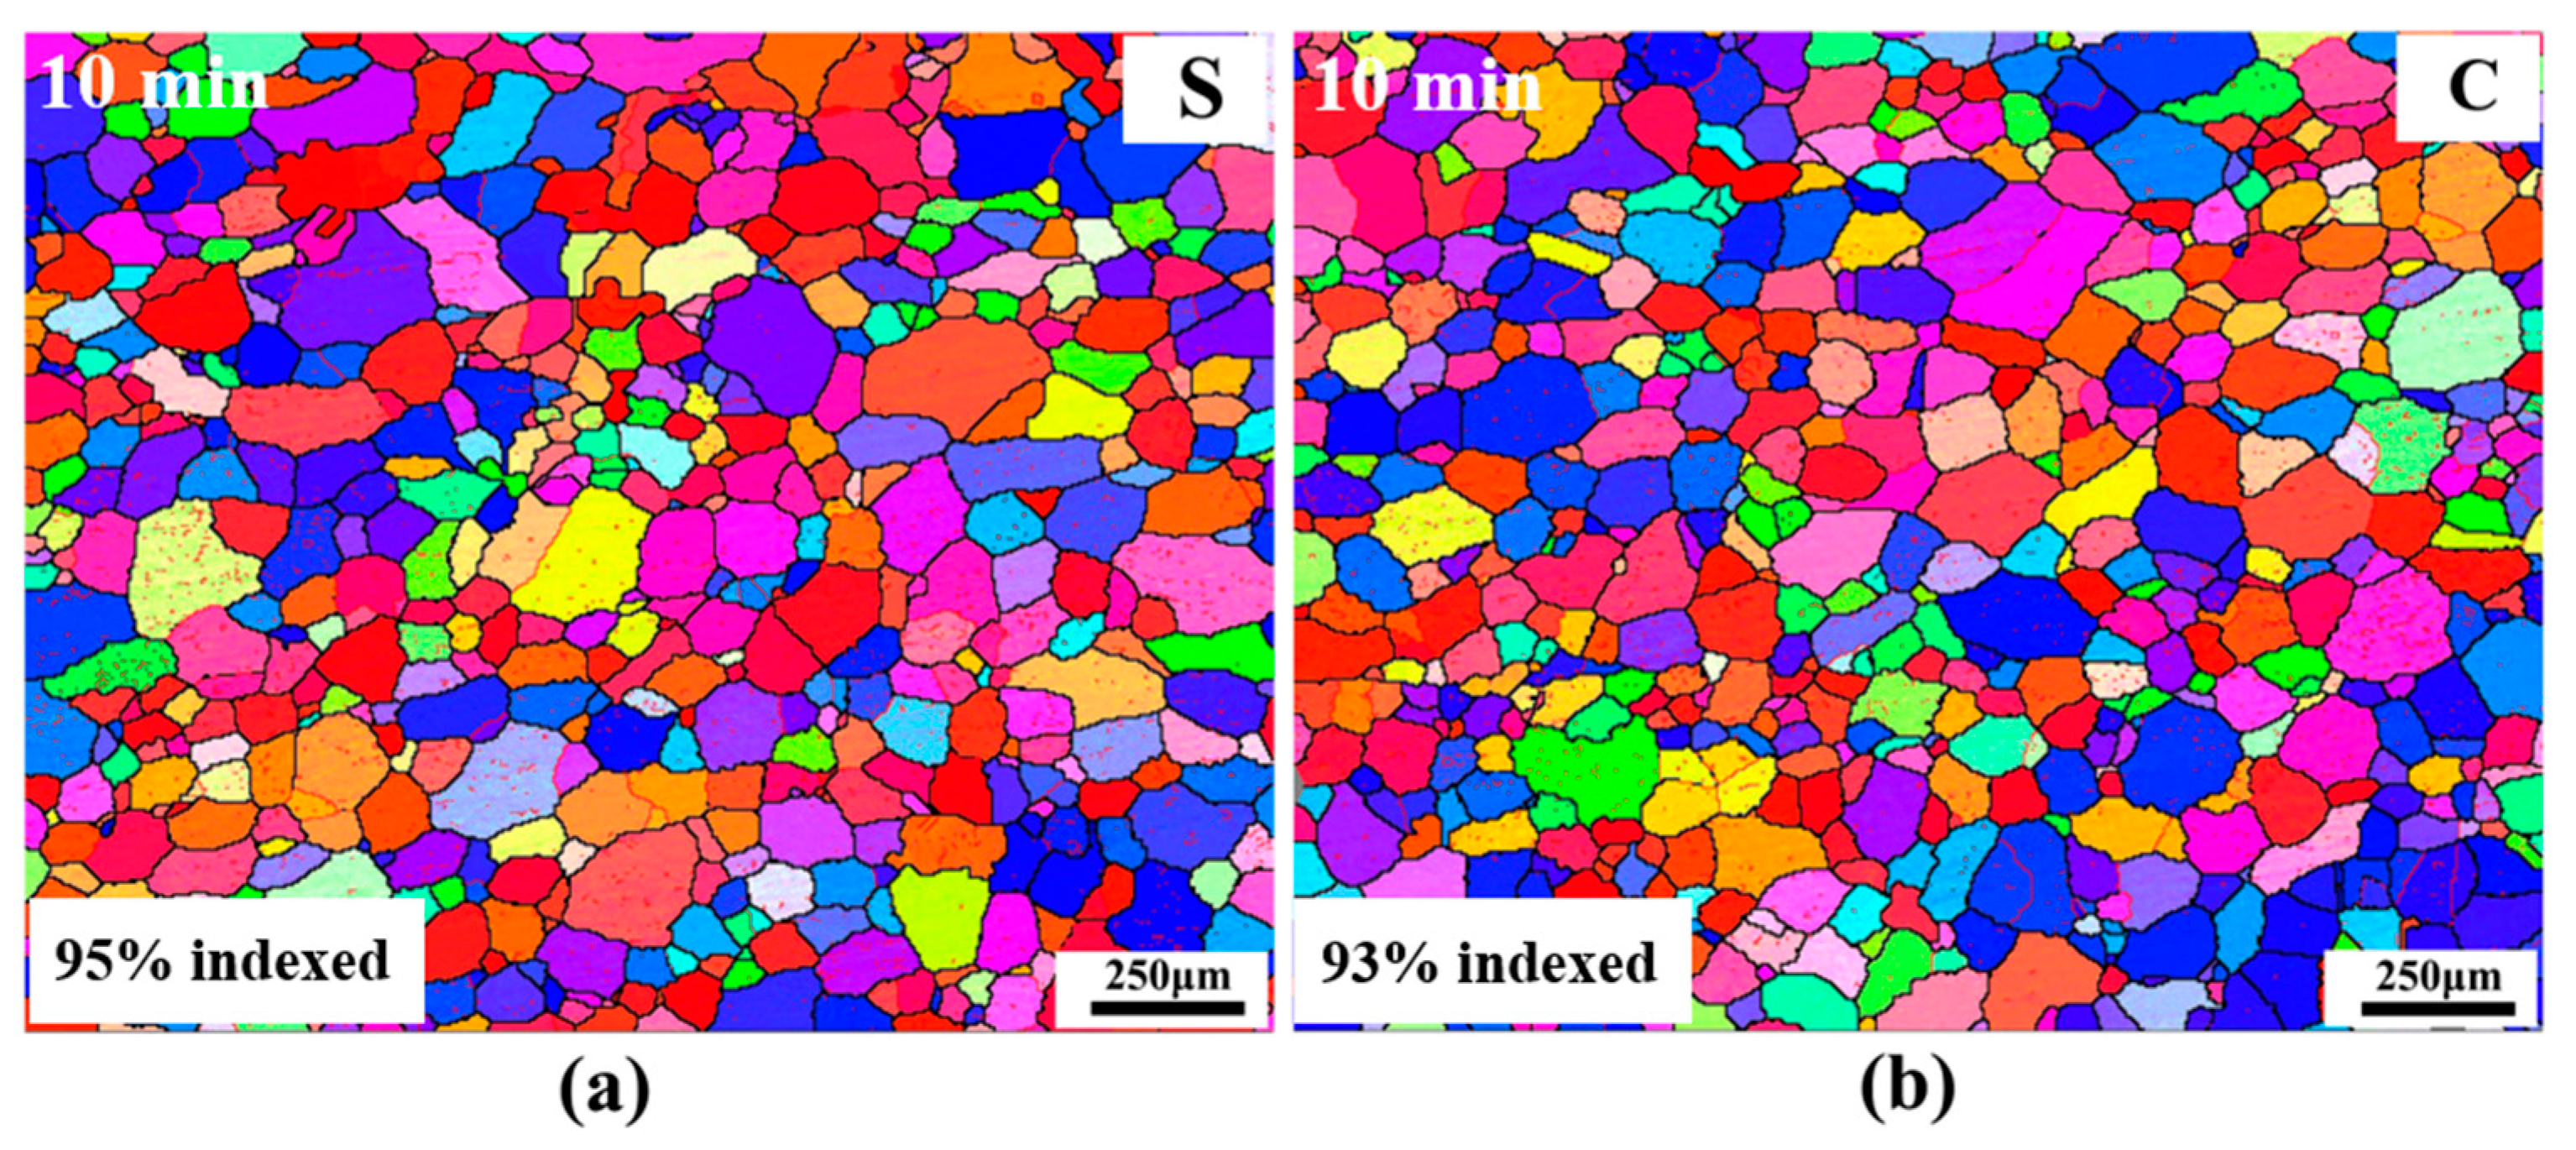
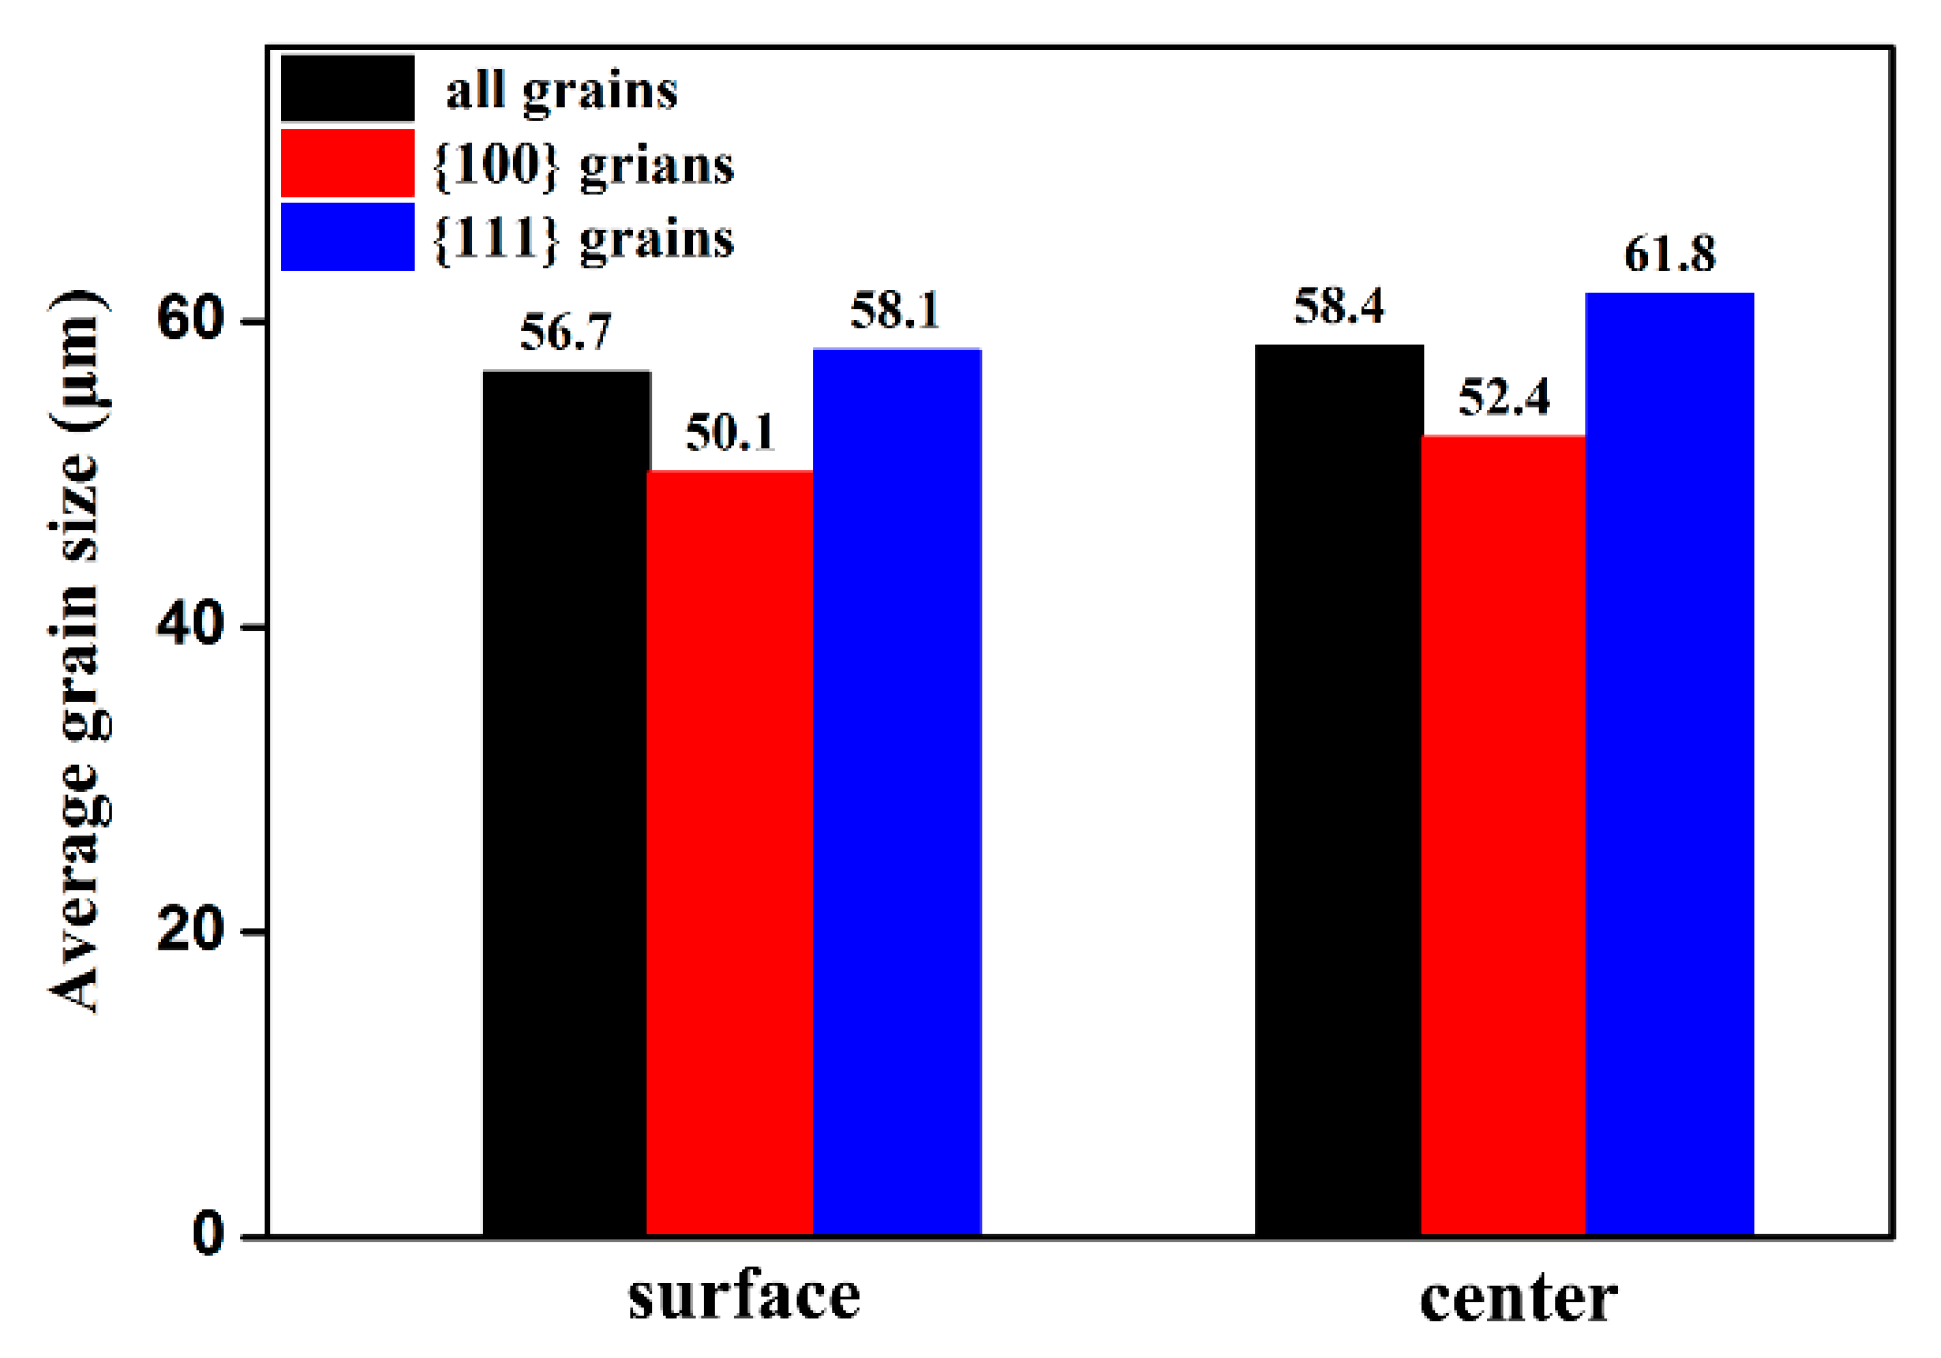
Figure 10 shows the recrystallization microstructure distribution of the sample along the thickness when annealed at 1250 °C for 10 min. Figure 11 is the corresponding average grain size distribution. After annealing for 10 min, the annealed microstructure in the surface and center layers consisted of equiaxed grains with relatively random orientation and almost free of sub-boundaries, indicating a fully recrystallized state. The average grain size difference in the surface and center layers was only 1.7 µm. In addition, the size difference in the {111} and {100} grains were also small, as shown in Figure 11.
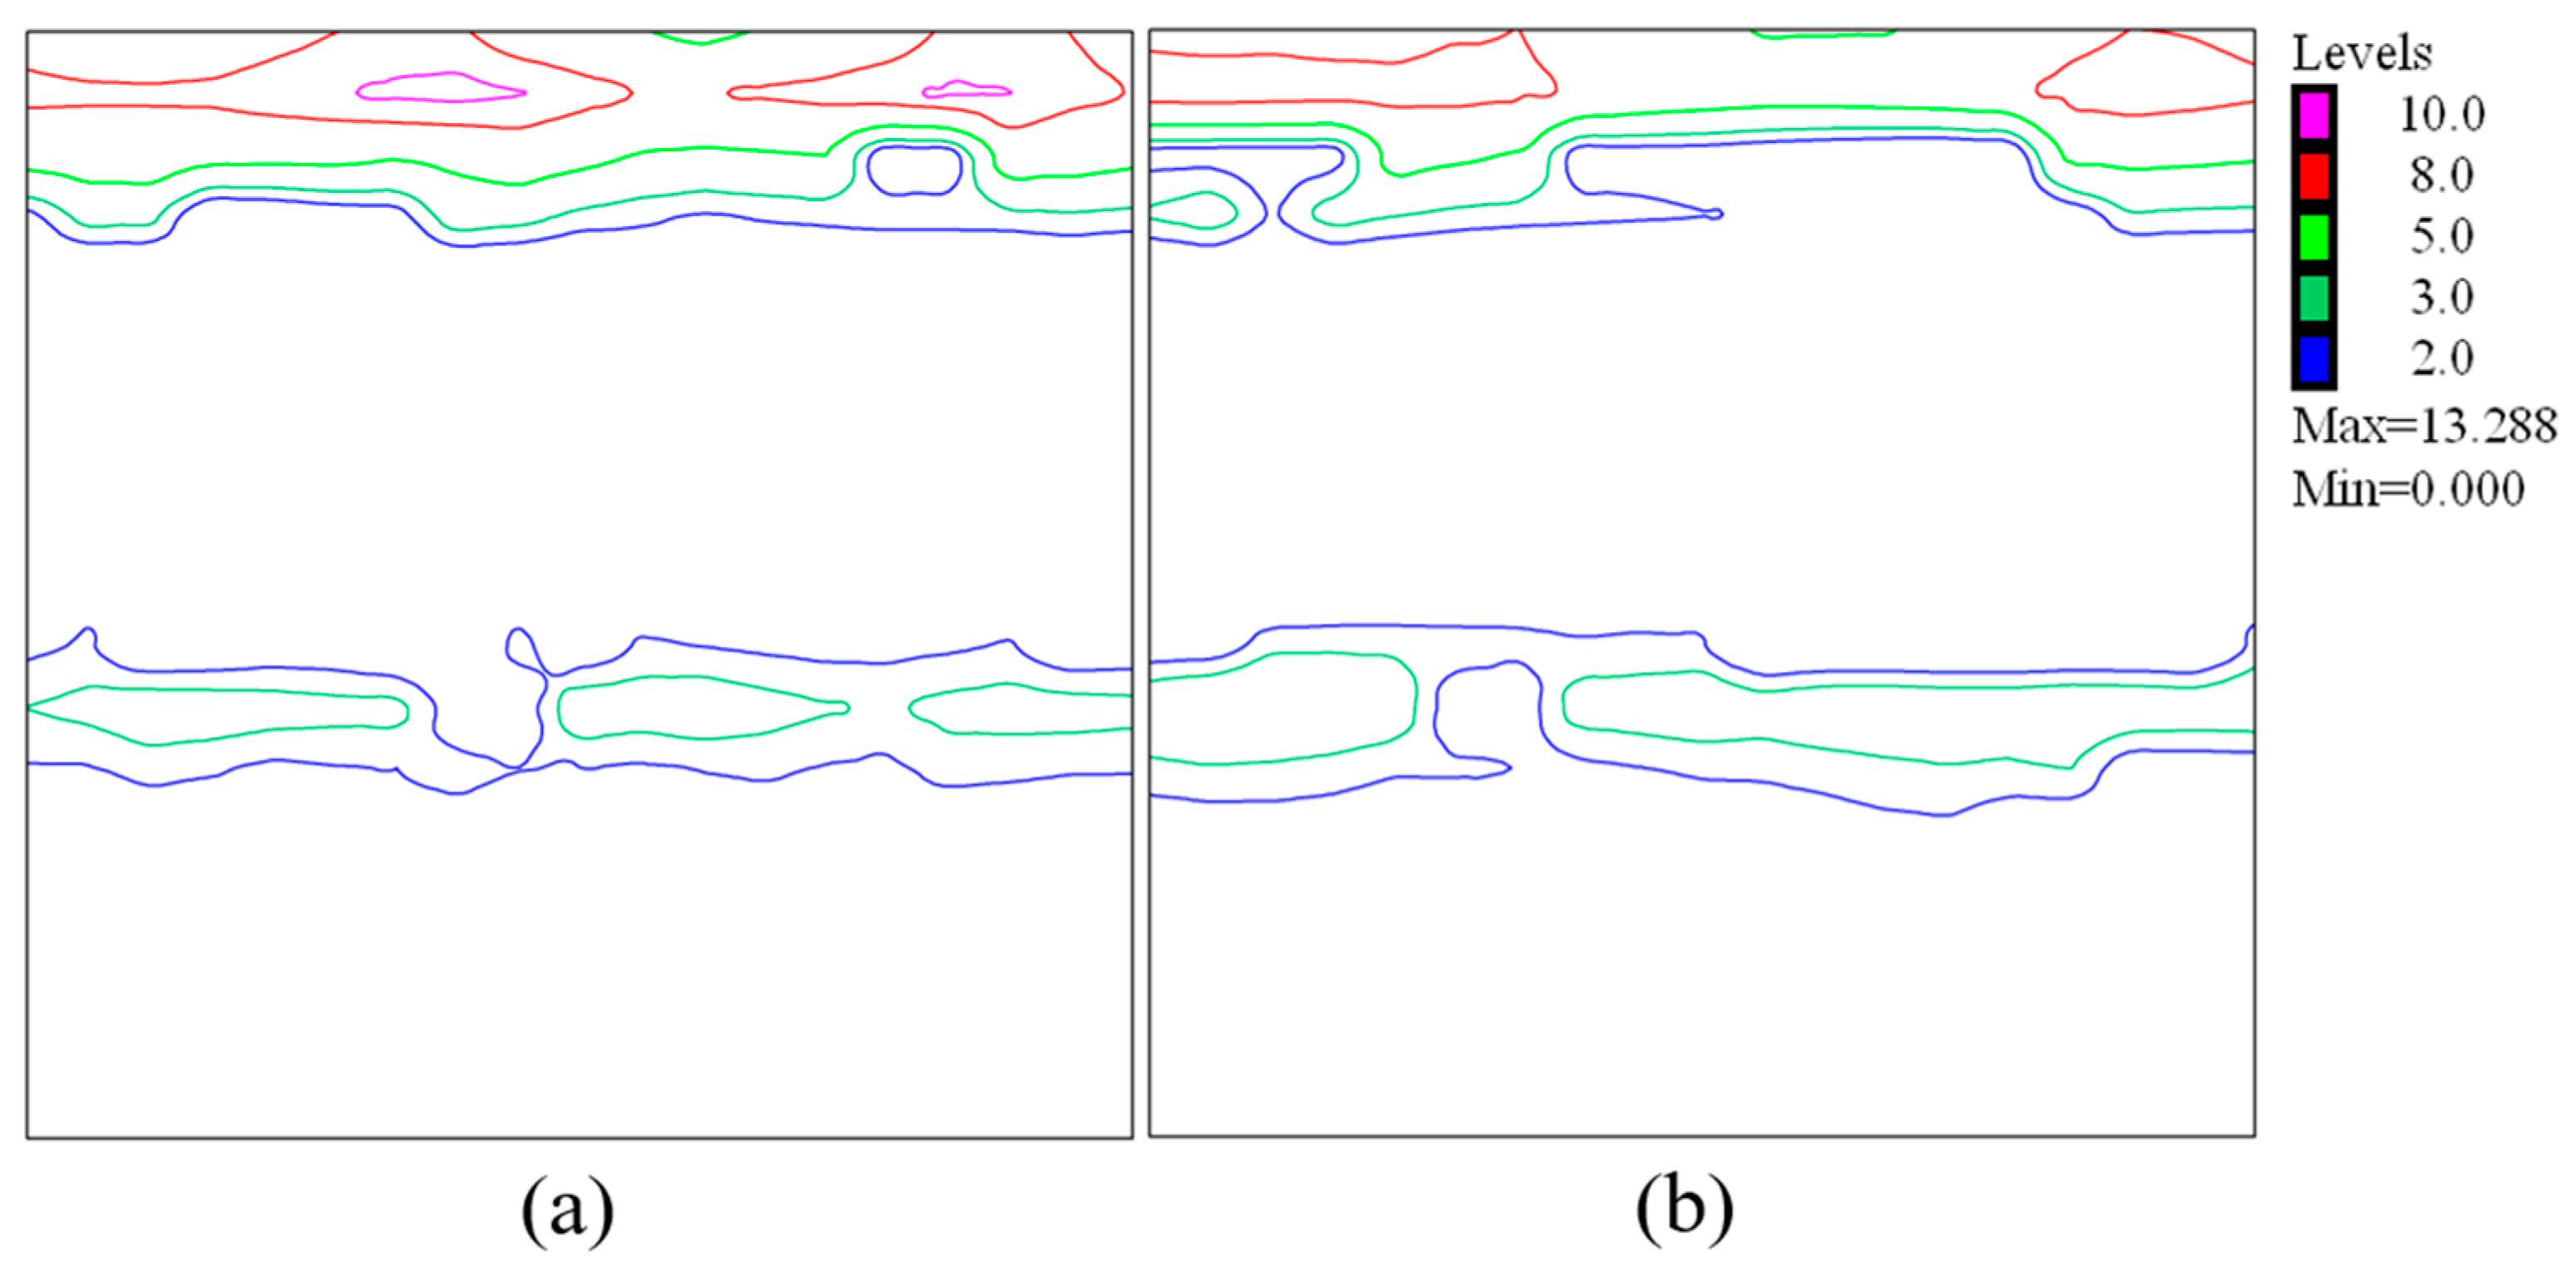
Figure 12 shows the texture distribution of 70% clock-rolled Ta plates in the surface and center layers after annealing at 1200 °C for 10 min. The texture distribution along the thickness consisted of a relatively uniform γ-fiber and θ-fiber, and the maximum intensity f(g) value reached 13.2.

4. Discussion

4.1. Initial Texture and Stored Energy Gradient

After eight passes of clock rolling, a plate (70% deformation) with a thickness of 6 mm was obtained. It can be seen from Figure 2 that the {111} texture intensity in the center layer is greatly improved with respect to the surface layer and the {100} texture intensity is decreased, indicating that the strong texture gradient exists along the thickness. The severe texture gradient is mainly caused by the difference in the local strain direction and strain rate caused by the uneven shearing force along the plate thickness during the deformation process [19,20,21]. It is well known that the rolling deformation in the center of sheets is characterized by a plane-strain state [21,22]. The friction and the roll-gap geometry do not affect the texture evolution in the center layer. Therefore, the initial orientation rotates toward a stable orientation during cold rolling, leading to an increase of γ fiber in the center layer. However, the shear deformation produced by the friction between the roll and the sample contact surface is maximum. The change of rolling direction in every pass necessarily causes a variation of shearing direction, leading to the occurrence of more random orientation in the surface layer. Besides, for metals with high stacking fault energy, such as aluminum, niobium, tantalum and their alloys, the texture gradient through the thickness is easily formed during cold rolling, but is not easy to be formed in metals with low stacking fault energy, such as brass [19,21,23].
Quantitative evaluation of the stored energy in the interior of grains with different orientations along the thickness by XLPA revealed that the stored energy in the center layer was significantly higher than that of the surface layer, and the stored energy of the {111} grains is much higher than the {100} grains, as shown in Table 2. On the one hand, the {111} grain is in a metastable state and has a high Schmid factor, and therefore is prone to splitting during deformation, resulting in the high dislocation density and stored energy. While the {100} grain possessing a low Schmid factor is much stable, which is not conducive to the activation of the primary slip system and deformation is more homogeneous during the rolling process, contributing to the low internal dislocation density and stored energy [8,24,25]. Borbély et al. [13] measured the stored energy of high-purity iron by X-ray and found that the stored energy of {111}<112> orientation in γ fiber was 3.3 times than the {100}<011> orientation in θ fiber after 88% rolling deformation. On the other hand, the starting sample consists mainly of the strong {111} texture in the center layer while the {100} texture dominates the surface layer. The rolled tantalum single crystals experiment [26] further shows that the {111} orientation is more unstable as compared with the {100} orientation, which easily causes stress concentration and then results in rotation and subdivision of the {111} matrix during rolling. Meanwhile, the fragmentation of the {111} matrix can also promote the split of its neighboring grain, such as {100} matrix, due to the interaction of grain, leading to relatively heavy deformation of grain in the center layer.

4.2. The Effect of Annealing Temperature on Recrystallization Microstructure

As shown in Figure 4 and Figure 6, the sample recrystallized slowly and had sufficient recovery time when annealed at low temperature (950 °C and 1050 °C). More precisely, the rearrangement of dislocations or the migration of low-angle boundaries gradually evolved into subgrains during recovery, leading to recrystallization dominated by subgrains nucleation mechanisms. It should be noted that recovery, a thermal activation process, typically occurs at low temperature affecting the microstructure evolution during annealing. In theory, recovery primarily affects nucleation and dislocation activity within the deformation grain. The annihilation and rearrangement of dislocations and the disappearance of point defects during recovery can greatly reduce the amount of stored energy [27] and adjust the dislocation alignment, which can affect the nucleation. Many subgrains with {111} orientation appear in the {111} deformed matrix, due to its high stored energy and preferential nucleation sites (i.e., strong {111}<uvw> rolling texture) in the center layer, and gradually grow into the effective {111} recrystallized nucleus when annealed at low temperature. The nucleus with {111} orientation can grow up preferentially, and therefore the {111} grain size and texture intensity are much higher than the {100} grain after complete recrystallization. While nuclei with other orientations, such as {100} nuclei are thermodynamically unstable as compared with the {111} nuclei, due to the shorter growth time, and are not easy to become the valid nuclei. Therefore, {100} recrystallization nuclei tend to be consumed when they encounter the mature {111} nuclei. Contrarily, the recrystallization rate in the surface layer is much slower, due to lower stored energy and unfavorable nuclei sites, and the growth ability of {111} nuclei is significantly weakened, contributing to the occurrence of random texture. Meanwhile, the release of stored energy within the deformation matrix, due to the recovery greatly reduces the driving force for grain growth and extends the annealing time, which further enlarges the microstructure (grain size and orientations) difference between the surface and center layers.
However, samples annealed at high temperature do not have enough time to undergo recovery, and the energy stored within the matrix is much higher. Thus, the HABs have sufficient driving force to generate migration, due to the insufficient recovery, and the grain growth rate of recrystallization nucleus is fast, due to high stored energy within the deformed matrix. Nuclei with other orientations, such as {100} orientation are not easily consumed by the {111} nuclei since the recrystallization time is greatly decreased, resulting in relatively uniform recrystallization microstructure along the thickness direction. Obviously, high-temperature annealing is beneficial to weaken and homogenize the Ta plate with strong texture gradient along the thickness, while low-temperature annealing notably improves the {111} <uvw> recrystallized texture intensity in the center layer.

5. Conclusions

In this paper, high purity Ta plates were clock-rolled to 70% reduction in thickness, and then annealed at different temperatures to observe the recrystallization microstructure evolution through the thickness. The primary results can be drawn as follows:
1. Diffuse {111} <uvw> and {100} <uvw> texture was formed in the surface layer in the clock-rolled sample with eight passes, while the strong {111} <uvw> texture appeared in the center layer.
2. X-ray line profile analysis (XLPA) shows that the stored energy distribution in the eight-passes sample through the thickness was extremely inhomogeneous, and the energy stored in the center layer was much higher than the surface layer.
3. The occurrence of strong {111} recrystallization texture in the center layer can be attributed to the subgrains nucleation mechanism at the low-temperature annealing. Contrarily, high-angle grain boundaries migration at the high temperature contributes to a more uniform microstructure and texture distribution along the thickness.

Author Contributions

Date analysis and writing-original draft, J.Z. (Jialin Zhu); Conceptualization, S.L. and C.D.; Funding acquisition, S.L.; Investigation and methodology, S.Y. and Y.Z.; Validation, J.Z. (Jing Zhang) and C.Z.

Funding

The present work was co-supported by the National Natural Science Foundation of China (Grants 51421001, 51,701,032 and 51504051), the Chongqing Research program of Basic Research and Frontier Technology (No. cstc2017jcyjAX0094) and the Fundamental Research Funds for the Central Universities (No. 2018CDPTCG0001/5).

Conflicts of Interest

The authors declare no conflict of interest.

References

  1. Cardonne, S.; Kumar, P.; Michaluk, C.; Schwartz, H. Tantalum and its alloys. Int. J. Refract. Met. Hard Mater. 1995, 13, 187–194. [Google Scholar] [CrossRef]
  2. Michaluk, C.A. Correlating discrete orientation and grain size to the sputter deposition properties of tantalum. J. electron. Mater. 2002, 31, 2–9. [Google Scholar] [CrossRef]
  3. Zhu, J.L.; Deng, C.; Liu, Y.H.; Lin, N.; Liu, S.F. Effects of Annealing Temperature on Recrystallization Texture and Microstructure Uniformity of High Purity Tantalum. Metals 2019, 9, 75. [Google Scholar] [CrossRef]
  4. Zhang, Z.; Kho, L.; Wickersham, C.E. Effect of grain orientation on tantalum magnetron sputtering yield. J. Vac. Sci. Technol. A 2006, 24, 1107. [Google Scholar] [CrossRef]
  5. Choi, G.S.; Lim, J.W.; Munirathnam, N.R.; Kim, I.H.; Kim, J.S. Preparation of 5N grade tantalum by electron beam melting. J. Alloys Compd. 2009, 469, 298–303. [Google Scholar] [CrossRef]
  6. Liu, S.F.; Fan, H.Y.; Deng, C.; Hao, X.B.; Guo, Y.; Liu, Q. Through-thickness texture in clock-rolled tantalum plate. Int. J. Refract. Met. Hard Mater. 2015, 48, 194–200. [Google Scholar] [CrossRef]
  7. Fan, H.Y.; Liu, S.F.; Li, L.J.; Deng, C.; Liu, Q. Largely alleviating the orientation dependence by sequentially changing strain paths. Mater. Design 2016, 97, 464–472. [Google Scholar] [CrossRef]
  8. Deng, C.; Liu, S.F.; Ji, J.L.; Hao, X.B.; Zhang, Z.Q.; Liu, Q. Texture evolution of high purity tantalum under different rolling paths. J. Mater. Process. Tech. 2014, 214, 462–469. [Google Scholar] [CrossRef]
  9. Huang, X.; Huang, G.J.; Xiao, D.P.; Liu, Q. Effect of Clock Rolling on Microstructures and Properties of AZ31 Magnesium Alloy Sheets. Mater. Sci. Forum. 2011, 686, 40–45. [Google Scholar] [CrossRef] [Green Version]
  10. Mccabe, R.J.; Proust, G.; Cerreta, E.K.; Misra, A. Quantitative analysis of deformation twinning in zirconium. Int. J. Plasticity. 2009, 25, 454–472. [Google Scholar] [CrossRef]
  11. Pawlik, K. Determination of the orientation distribution function from pole figures in arbitrarily defined cells. Phys. Stat. Sol. B. 1986, 134, 477–483. [Google Scholar] [CrossRef]
  12. Raabe, D. Simulation of rolling textures of b.c.c. metals considering grain interactions and crystallographic slip on {110}, {112} and {123} planes. Mater. Sci. Eng. A 1995, 197, 31–37. [Google Scholar] [CrossRef]
  13. Borbély, A.; Driver, J.H.; Ungár, T. An X-ray method for the determination of stored energies in texture components of deformed metals; application to cold worked ultra high purity iron. Acta Mater. 2000, 48, 2005–2016. [Google Scholar] [CrossRef]
  14. Rajmohan, N.; Hayakawa, Y.; Szpunar, J.A.; Root, J.H. Neutron diffraction method for stored energy measurement in interstitial free steel. Acta Mater. 1997, 45, 2485–2494. [Google Scholar] [CrossRef]
  15. Dey, S.; Gayathri, N.; Bhattacharya, M.; Mukherjee, P. In Situ XRD Studies of the Process Dynamics During Annealing in Cold-Rolled Copper. Metall. Mater. Trans. 2016, 47, 1–11. [Google Scholar] [CrossRef]
  16. Ruestes, C.J.; Stukowski, A.; Tang, Y.; Tramontina, D.R.; Erhart, P.; Remington, B.A.; Urbassek, H.M.; Meyers, M.A.; Bringa, E.M. Atomistic simulation of tantalum nanoindentation: Effects of indenter diameter, penetration velocity, and interatomic potentials on defect mechanisms and evolution. Mater. Sci. Eng. A 2014, 613, 390–403. [Google Scholar] [CrossRef]
  17. Ikehata, H.; Nagasako, N.; Kuramoto, S.; Saito, T. Designing New Structural Materials Using Density Functional Theory: The Example of Gum MetalTM. MRS Bulletin 2011, 31, 688–692. [Google Scholar] [CrossRef]
  18. Park, Y.B.; Lee, D.N.; Gottstein, G. The evolution of recrystallization textures in body centred cubic metals. Acta Mater. 1998, 46, 3371–3379. [Google Scholar] [CrossRef]
  19. Mishin, O.V.; Bay, B.; Jensen, D.J. Through-thickness texture gradients in cold-rolled aluminum. Metall. Mater. Trans. 2000, 31, 1653–1662. [Google Scholar] [CrossRef]
  20. Chen, J.Z.; Zhen, L.; Shao, W.Z.; Dai, S.L.; Cui, Y.X. Through-thickness texture gradient in AA 7055 aluminum alloy. Mater. Lett. 2008, 62, 88–90. [Google Scholar] [CrossRef]
  21. Engler, O.; Tomé, C.N.; Huh, M.Y. A study of through-thickness texture gradients in rolled sheets. Metall. Mater. Trans. 2000, 31, 2299–2315. [Google Scholar] [CrossRef]
  22. Choi, C.H.; Kwon, J.W.; Oh, K.H.; Lee, D.N. Analysis of deformation texture inhomogeneity and stability condition of shear components in f.c.c. metals. Acta Mater. 1997, 45, 5119–5128. [Google Scholar] [CrossRef]
  23. Deng, C.; Liu, S.F.; Hao, X.B.; Ji, J.L.; Liu, Q.; Fan, H.Y. Through-thickness texture gradient of tantalum sputtering target. Rare Metals 2017, 36, 523–526. [Google Scholar] [CrossRef]
  24. Deng, C.; Liu, S.F.; Hao, X.B.; Ji, J.L.; Zhang, Z.Q.; Liu, Q. Orientation dependence of stored energy release and microstructure evolution in cold rolled tantalum. Int. J. Refract. Met. Hard Mater. 2014, 46, 24–29. [Google Scholar] [CrossRef]
  25. Liu, Y.H.; Liu, S.F.; Zhu, J.L.; Deng, C.; Fan, H.Y.; Cao, L.F.; Liu, Q. Strain path dependence of microstructure and annealing behavior in high purity tantalum. Mater. Sci. Eng. A 2017, 707, 518–530. [Google Scholar] [CrossRef]
  26. Vandermeer, R.A.; Snyder, W.B. Recovery and recrystallization in rolled tantalum single crystals. Metall. Trans. A 1979, 10, 1031–1044. [Google Scholar] [CrossRef]
  27. Zhang, Z.; Zhang, Y.; Mishin, O.V.; Tao, N.; Pantleon, W.; Juul Jensen, D. Microstructural Analysis of Orientation-Dependent Recovery and Recrystallization in a Modified 9Cr-1Mo Steel Deformed by Compression at a High Strain Rate. Metall. Mater. Trans. A 2016, 47, 4682–4693. [Google Scholar] [CrossRef] [Green Version]
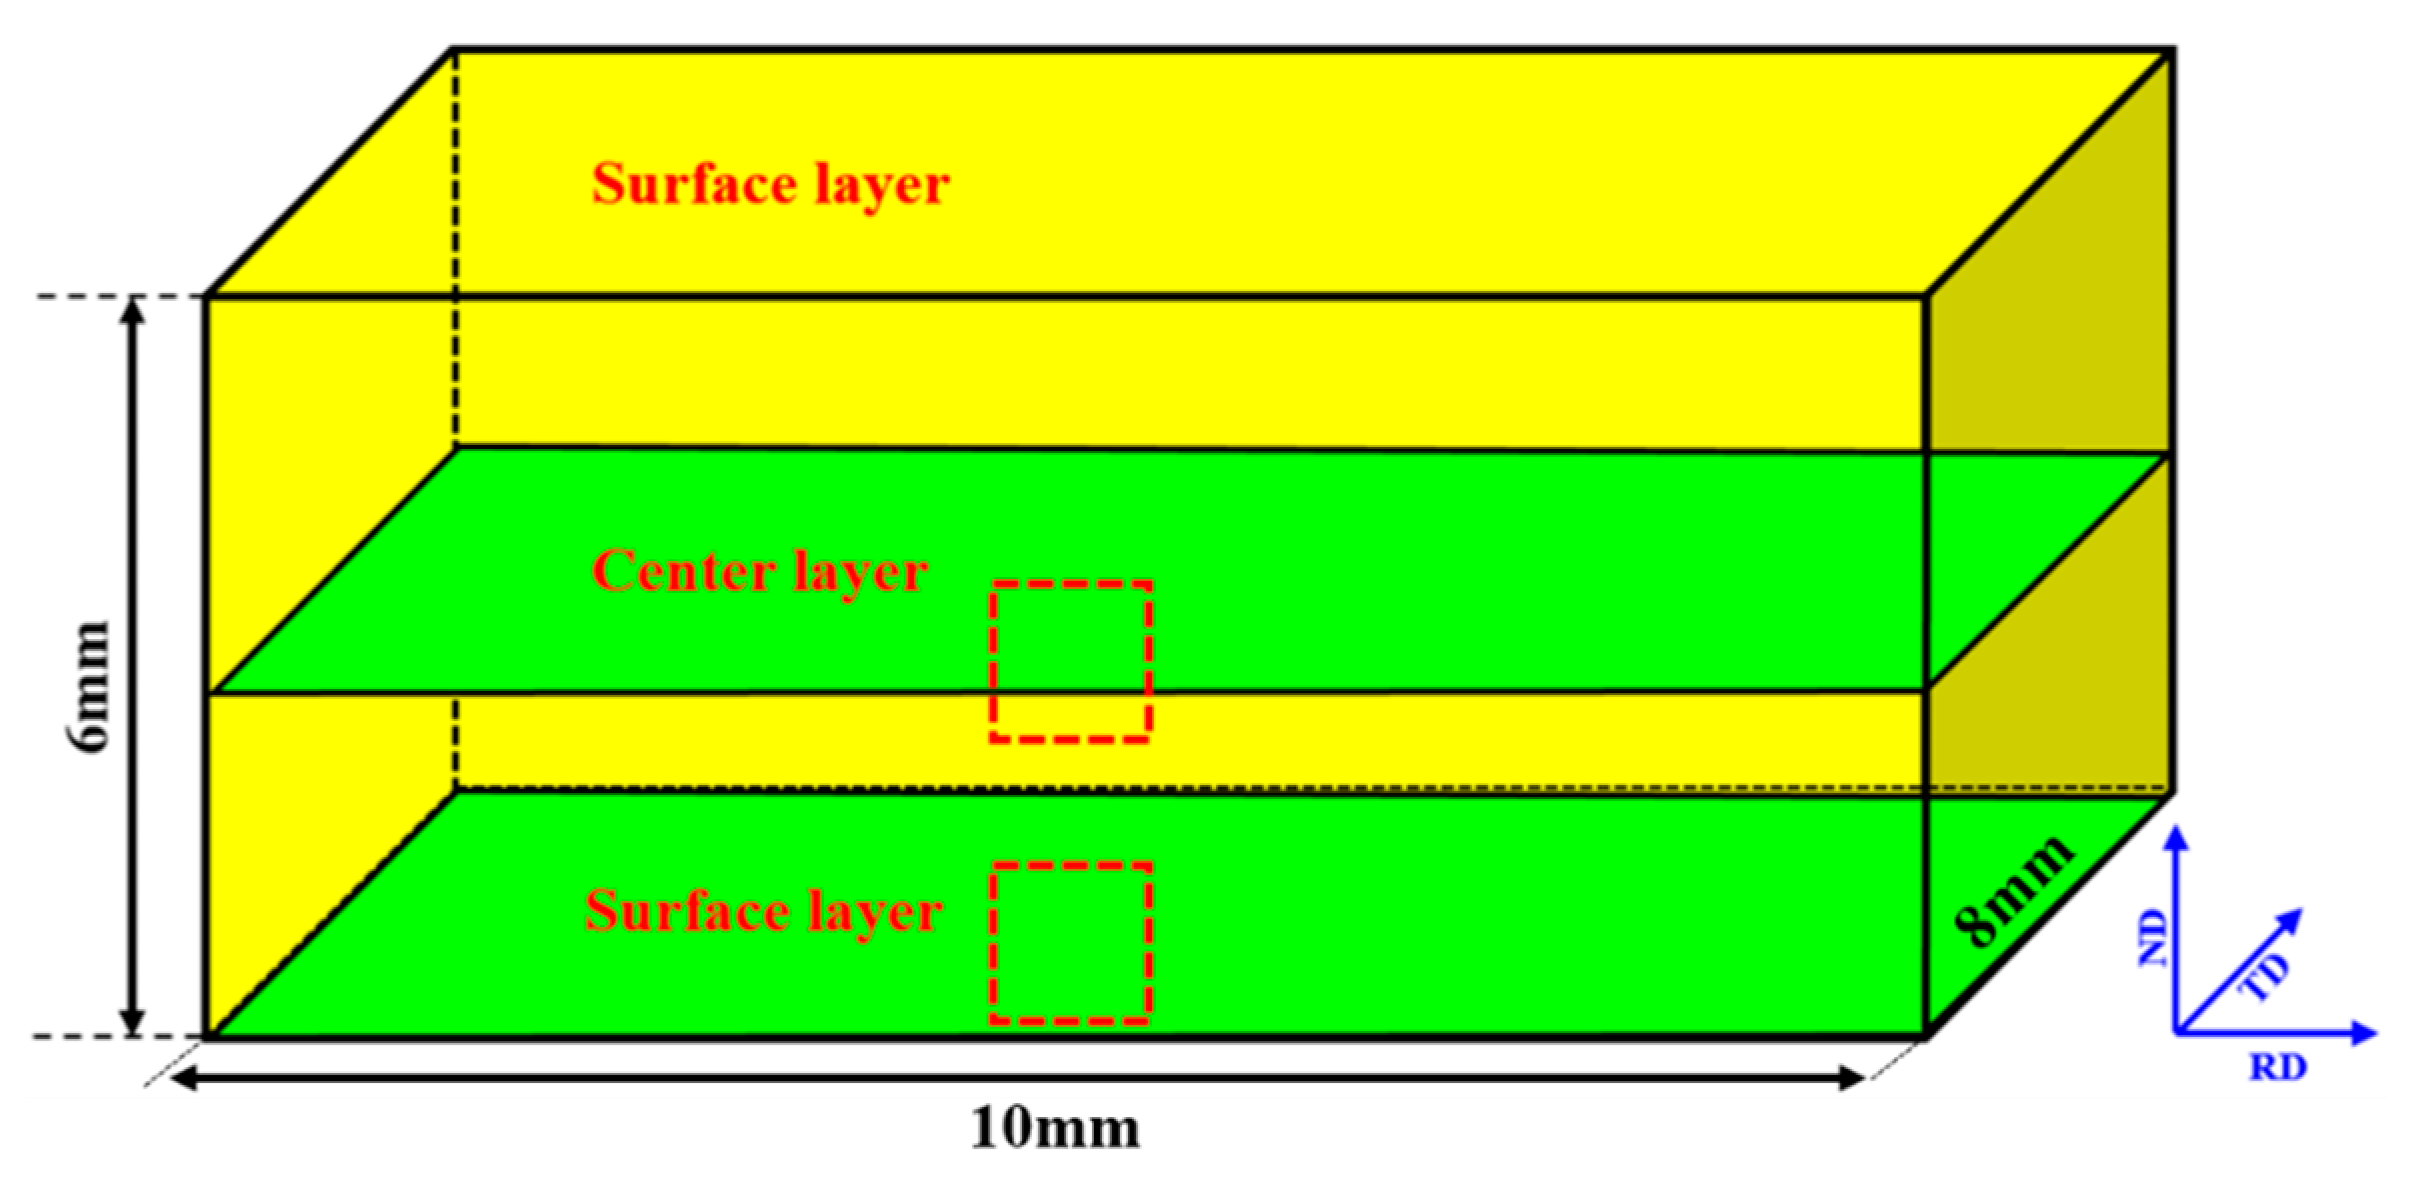
Figure 1. Examined positions for X-ray diffraction (XRD) and electron backscatter diffraction (EBSD) (XRD examined zone is the green shaded plane, while the red dashed frame stands for the EBSD examined plane).
Metals 09 00358 g001
Figure 2. The Orientation distribution function (ODF) sections (φ2 = 45°) of 70% clock-rolled Ta plates along the thickness: (a) Surface layer, (b) center layer.
Metals 09 00358 g002
Figure 3. Fitted (200) and (222) diffraction peaks of Ta in the surface and center layers, respectively. (a) (200) diffraction peak (b) (222) diffraction peak.
Metals 09 00358 g003
Figure 4. Orientation imaging map (OIM) of 70% clock-rolled Ta when annealed at 950 °C for different times (30 min and 120 min) (a) surface layer (b) central layer. Note that “S” and “C” represent “surface layer” and “center layer”, respectively.
Metals 09 00358 g004
Figure 5. Recrystallization volume fraction of the surface and central layers of 70% clock-rolled Ta with different annealing times at 950 °C.
Metals 09 00358 g005
Figure 6. OIM of 70% clock-rolled Ta when annealed at 1050 °C for different times (5 min, 15 min, 30 min and 120 min): (a) Surface layer, (b) center layer.
Metals 09 00358 g006
Figure 7. Recrystallization volume fraction of 70% clock-rolled Ta in the surface and center layers when annealed at 1050 °C for different times.
Metals 09 00358 g007
Figure 8. Average grain size of 70% clock-rolled Ta when annealed at 1050 °C for 120 min. Note that “all grains” mean the grains with all orientations in the OIM.
Metals 09 00358 g008
Figure 9. The ODF sections (φ2 = 45°) of 70% clock-rolled Ta plates in the surface and center layers when annealed at 1050 °C for 120 min: (a) Surface layer, (b) center layer.
Metals 09 00358 g009
Figure 10. OIM of 70% clock-rolled Ta after annealing at 1250 °C for 10 min (a) surface layer (b) center layer.
Metals 09 00358 g010
Figure 11. Average grain size of 70% clock-rolled Ta when annealed at 1250 °C for 10 min.
Metals 09 00358 g011
Figure 12. The ODF sections (φ2 = 45°) of 70% clock-rolled Ta plates along the thickness after annealing at 1250 °C for 10 min: (a) Surface layer, (b) center layer.
Metals 09 00358 g012
Table 1. The annealing parameters of the 70% clock-rolled Ta plate.
Annealing TemperatureAnnealing Times
950 °C30 min, 120 min
1050 °C5 min, 10 min, 30 min, 120 min
1250 °C10 min
Table 2. Orientation-dependent stored energies by XRD and relevant parameters [16,17,18] used for stored energy calculation.
PositionhklYhkl/GPaνhklBrBaSEhkl/(J.mol−1)
Surface layer(200)145.60.320.1700.1202.248
(222)284.40.360.3040.1164.113
Center layer(200)145.60.320.2010.1204.024
(222)284.40.360.4480.1169.727