Article

Recovery of Platinum from Spent Petroleum Catalysts: Optimization Using Response Surface Methodology

1
Institute for Advanced Materials and Technology, University of Science and Technology Beijing, Beijing 100083, China
2
Nuclear Chemistry and Industrial Material Recycling, Department of Chemistry and Chemical Engineering, Chalmers University of Technology, 41296 Gothenburg, Sweden
3
Yunlong Country Platinum Cui Precious Metals Technology Co., Ltd., Dali 672711, China
*
Author to whom correspondence should be addressed.
Metals 2019, 9(3), 354; https://doi.org/10.3390/met9030354
Submission received: 14 February 2019 / Revised: 14 March 2019 / Accepted: 14 March 2019 / Published: 20 March 2019

Abstract

:
The global yield of platinum (Pt) recovery from spent catalysts is about 30%. Pt recovery from spent catalysts is one of the most significant methods to reduce its supply risk and meet future demand. The current hydro-leaching processes always involve extremely high acidity (c(H+) > 6.0 mol/L), causing serious environmental issues and consuming large amounts of reagents. This paper studied the recovery of Pt from spent petroleum catalysts in a mild leaching solution (c(H+) = 1.0−2.0 mol/L). The HCl and NaCl were used as leaching agents, while H2O2 was used for oxidation of Pt. The leaching factors, including solid/liquid ratio (S/L), acidity, leaching temperature, and H2O2 usage, were studied. The leaching efficiency of Pt was 95.7% under the conditions of S/L of 1:5 g/mL, HCl of 1.0 mol/L, NaCl of 5.0 mol/L, 10% H2O2/spent catalysts of 0.6 mL/g, and temperature of 90 °C for 2 h. The leaching kinetic of platinum fits best to the Avrami equation. The apparent activation energy for leaching platinum was 114.9 kJ/mol. Furthermore, the effects of the operating variables were assessed and optimized by employing a response surface methodology based on Box-Behnken Design. The result shows that HCl concentration had the greatest impact on the leaching efficiency as compared to the H2O2 concentration and S/L ratio. Pt leaching efficiency was increased to 98.1% at the optimized conditions of HCl of 1.45 mol/L, NaCl of 4.55 mol/L, 10% H2O2/spent catalysts of 0.66 mL/g, and S/L of 1:4.85. The purity of Pt is over 90% by the reduction of iron powder.

1. Introduction

Platinum (Pt) is a crucial element of catalysts in converters, chemical and petroleum refining, cancer therapy, and electronics [1]. The consumption of Pt reached 210 tons in 2017 [2], which increased along with the development of technologies [3]. However, the reserves of Pt are geopolitically highly concentrated in South Africa, Russia, Zimbabwe, Canada, and United States, which endangers the supply to other countries and regions [4]. European Union and U.S. Department of Energy have defined Pt as a critical raw material depending on the risk of supply shortage. Therefore, it is essential to recycle Pt from secondary resources (e.g., spent catalysts, electronic waste, jewelry) to reduce primary mining and supply risks [5].
Large amounts of catalysts are used in the fluid catalytic cracking, residue fluid catalytic cracking, dehydrogenation, reforming and hydrogenation in petroleum refining, and petrochemical industries [6], which consumed about 20.2 tons of Pt in 2015 [7]. Catalysts are discarded as solid waste after deactivation resulting from fouling, poisoning, and thermal degradation/sintering [8]. Spent catalysts are important sources of Pt. However, they often contain coke, vanadium, lead, nickel, and organics that may cause serious pollution to soil and water. As a consequence, they are classified as hazardous wastes with restricted disposal in landfills. Recovery of Pt from spent petroleum catalysts with the consideration of environmentally is of great significance.
Pt is the main active component of catalysts and disperses spontaneously on the surface of the supports. Although the content of Pt loading on the catalysts is only approximately 0.05–1.0 wt.%, it is the dominant attraction for recycling spent catalysts due to the high economic value. Hydrometallurgical and pyrometallurgical have been applied for recovering precious metals from wastes [9,10]. Pyrometallurgical process is normally used for concentrating Pt since their contents are extremely low in the spent catalysts. In this process, crushed spent catalysts mixed with fluxes (Al2O3, CaO, or SiO2), collector, and reductant are smelted in a blast furnace or electric furnace [11]. The support materials are oxidized or directly entered into the slag phase, while Pt forms alloy and will be collected in the metal phase. This method is more suitable for larger plants because of the huge investment and high energy consumption. Moreover, the dissolution of the alloy increases the cost and pyrometallurgical process also generates large amounts of slags.
To avoid the disadvantages of pyrometallurgical process, hydrometallurgical technologies have raised great attention [12]. Leaching step is critical when hydrometallurgy is involved. It should promote the efficient dissolution of Pt and minimize the leaching of supports. Chloride media are frequently used for leaching precious metals. Oxidants, such as NaClO3, Cl2, H2O2, HNO3, and Cu2+ are used to dissolve metallic PGMs (platinum group metals) into ionic state [13,14]. The ionic state of platinum depends on the concentrations of hydrogen and chloride ions, and temperature [15]. The complexes of Pt(II) and Pt(IV) are stable in strong acidic solution (pH <3). Hydrolysis may take place under reduction of free acidity (increase in pH value). Therefore, acidity is sufficient to activate the complexation reactions and the concentration of hydrogen ions is always over 6.0 mol/L, as shown in Table 1. The high acidity in the leaching process causes worse working circumstances (generation of acid fog and Cl2) and increases the dissolution of impurities (e.g., Al2O3, V2O5, ZrO2, etc.). Moreover, a large amount of unconsumed acid are generated in the effluent. Pt recovery is performed by chemical reduction, solvent extraction, or ion-exchange [16]. In this stage, efficient and selective separation of the desired metals from leaching solution economically is essential [17]. However, high acidic leaching reduced the efficiency of the process since large amounts of reductants are consumed by acid or the impurities decreased the selectivity of solvent extraction or ion-exchange.
The aim of this work is to increase the leaching efficiency of Pt at low acidic solution. First, the organics carbon deposit were removed by calcination. Hydrochloric acid is partly replaced by sodium chloride since Cl promotes the dissolution of Pt. The calcination temperature, leaching temperature, S/L ratio, concentration of hydrogen ion, and dosage of hydrogen peroxide were investigated. The leaching kinetic was studied, and the activation energy for Pt leaching was determined. Finally, the effects of the HCl concentration, S/L ratio, and H2O2 usage were assessed and optimized by employing response surface methodology.

2. Materials and Methods

2.1. Materials

The employed spent petroleum catalysts were collected from Sinopec Hainan Refining and Chemical Limited Company, Danzhou, China, which were used in catalytic reforming units. The samples were ground into 10–100 μm particles before running the experiments. The content of Pt in the spent catalysts analyzed by ICP-OES (inductively coupled plasma-optical emission spectrometry) was 2117.5 g/t.
Hydrogen peroxide (H2O2) was taken as the oxidizing agent, hydrochloric acid (HCl) was taken as the leaching agent, sodium chloride (NaCl) was employed to provide Cl for platinum complexing, and iron powder was used to reduce Pt from leaching solution. H2O2 was diluted to 10% by deionized water before experiments. Iron powder (−300 mesh) was used to reduce Pt from leaching solution. All are analytical reagent and purchased from Sinopharm Chemical Reagent Co., Ltd, Beijing, China. All of the solutions were prepared in deionized water.

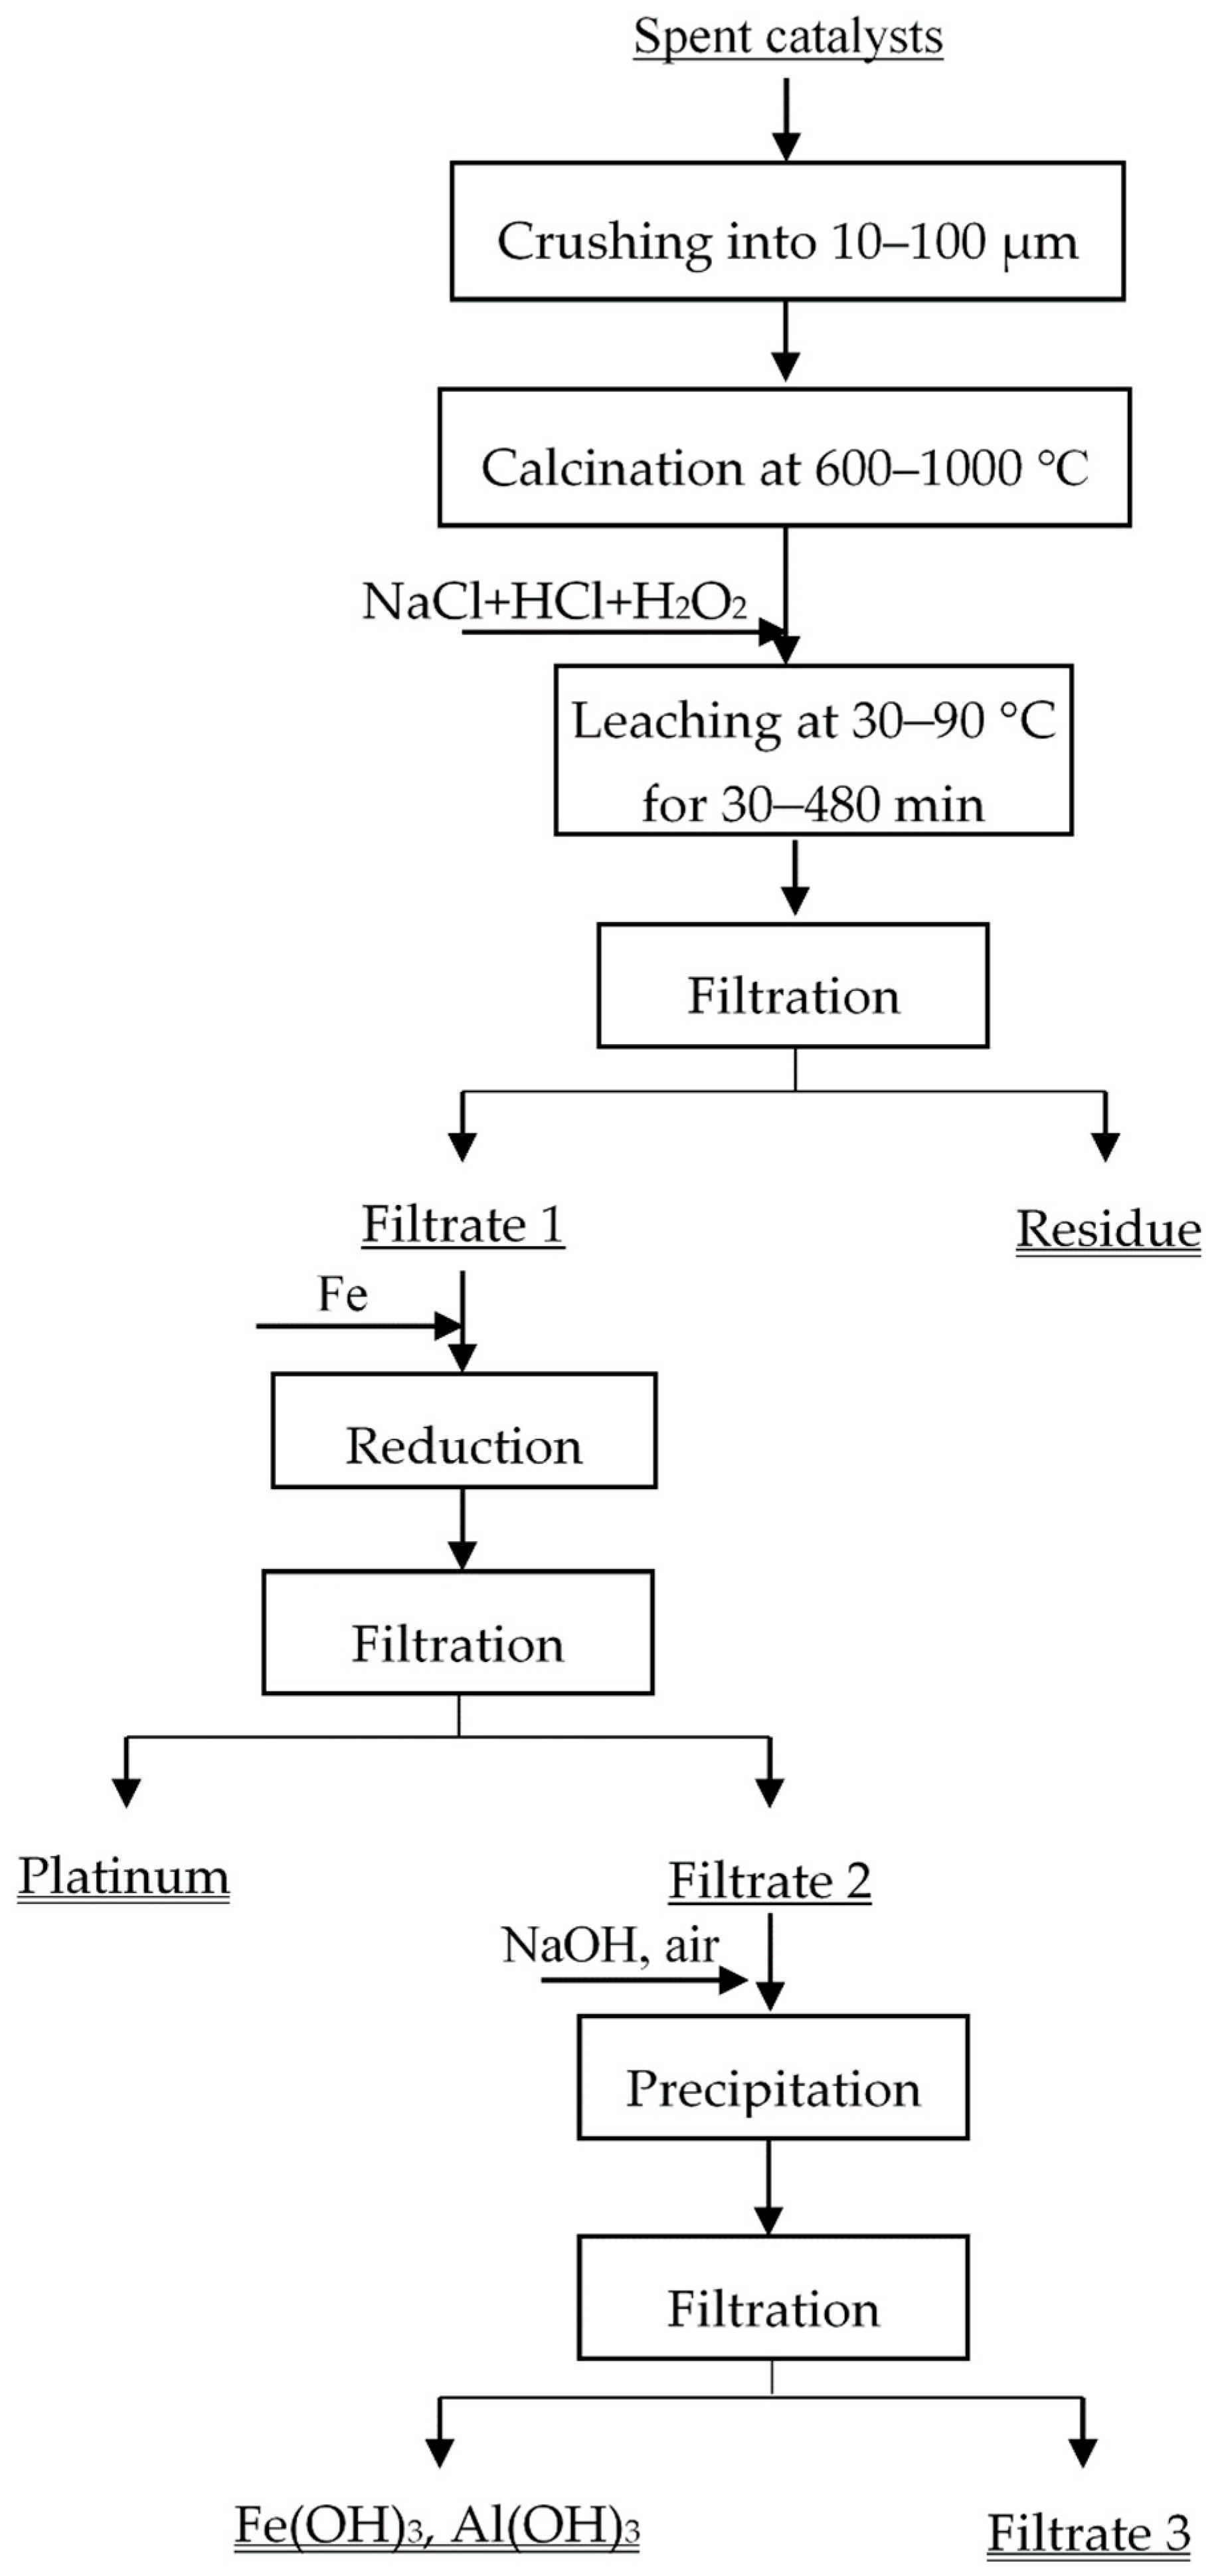
2.2. Experimental Procedures

The effort of this study is to recover Pt by using less corrosive reagents and optimizing the leaching process. As the oxidation potential of Pt is high, it is very stable and hard to dissolve in acid solution. The formation of corresponding chloro-complex (PtCl62−) can reduce the electrode potentials of Pt. The standard electrode potential is [24]:
PtCl62− + 4e → Pt + 6Cl  (ε0 = 0.74 V)
H2O2 is always used to dissolve Pt from spent catalysts owing to its high oxidizing capacity [19,22,23]. The dissolution reaction of Pt in aqueous chloride media is given as reaction (2).
Pt + 2H2O2 + 4H+ + 6Cl → PtCl62− + 4H2O
According to reaction (2), the dissolution behavior of Pt is determined by the concentrations of H2O2, H+, and Cl. Higher concentrations of H2O2, H+, and Cl promote the oxidation of Pt, which results in higher leaching efficiency of Pt. Meanwhile, in order to decrease the dissolution of Al2O3 supports and generation of hazardous gases (e.g., Cl2), the concentration of HCl is strictly controlled. HSC chemistry 6.0 (Outokumpu Research Oy, Helsinki, Finland) was implemented to calculate leaching conditions of chemical equilibrium between species and draw the Eh–pH diagram of Pt–Cl–H2O system at 25 °C (as shown in Figure 1). In this study, the concentrations of Pt and Cl were around 10−3 mol/L and 6.0 mol/L, respectively.
The flowsheet for the recovery of Pt from spent catalysts is shown in Figure 2. Before leaching, spent catalysts were calcinated at 600–1000 °C for 2 h to remove the deposits of coke and organics. The heating rate was 10 °C/min. H2O2, HCl, and NaCl were used as the leaching agents.
All the leaching experiments were carried out in beaker. The beaker was placed in a water bath to control the reaction temperature. The leaching experiments were run at 30–90 °C for 30–480 min under magnetic stirring (60 rpm). The beaker was covered to reduce the loss of water by evaporation. A total of 50 g of spent catalysts after calcination were put into the beaker, as well as the mixture solutions of HCl and NaCl at different concentrations. The total concentration of Cl was 6.0 mol/L. H2O2 (10%) was added into the leaching system by dripping slowly after the temperature raised to target temperature. After leaching, the insoluble supports and leachate were separated via filtering. The concentration of Pt in leachate was used to calculate the leaching efficiencies. Finally, Pt was precipitated and recovered by the reduction of iron powder. The metal ions (such as Fe2+ and Al3+) in Filtrate 2 were precipitated by NaOH in air atmosphere. The main chemical component in Filtrate 3 was NaCl, and it can be reused during the leaching process. The recovery process has low environmental impact.

2.3. Analytical Methods

The compositions of spent catalysts before and after calcination were analyzed by using X-ray diffraction (XRD, Rigaku D/max-2550 V, Tokyo, Japan). The chemical component of spent catalysts was analyzed by X-ray Fluorescence (XRF-1800, Shimadzu, Kyoto, Japan). Thermogravimetric analysis and differential scanning calorimetry (TG/DSC, SDT Q600, TA Instruments, New Castle, DE, USA) were utilized to determine the optimum temperature for calcination of the spent petrochemical catalysts. The measurements were performed in a flow air at a heating rate of 10 °C/min. A scanning electron microscope (SEM, SU3500, Hitachi, Tokyo, Japan) associated with an energy dispersive spectrometer (EDS, GENESIS XM, EDAX Inc., Mahwah, NJ, USA) was used to observe the morphology and to determine the elemental composition of the recovered Pt. Inductively Coupled Plasma Optical Emission Spectrometer (ICP-OES Avio 200 & Optima 8000, PerkinElmer instruments, Waltham, MA, USA) was employed to analyze the content of Pt. Before ICP-OES analysis, all the aqueous samples were co-precipitated with SnCl2 and TeCl4. For solid samples, they were digested by aqua regia at 120 ℃ for 6 h in the autoclave. Then the precipitates were dissolved by aqua regia, followed by concentrated and transferred to a 50 mL volumetric flsk. The error of measurement was controlled within 3%.

3. Results and Discussion

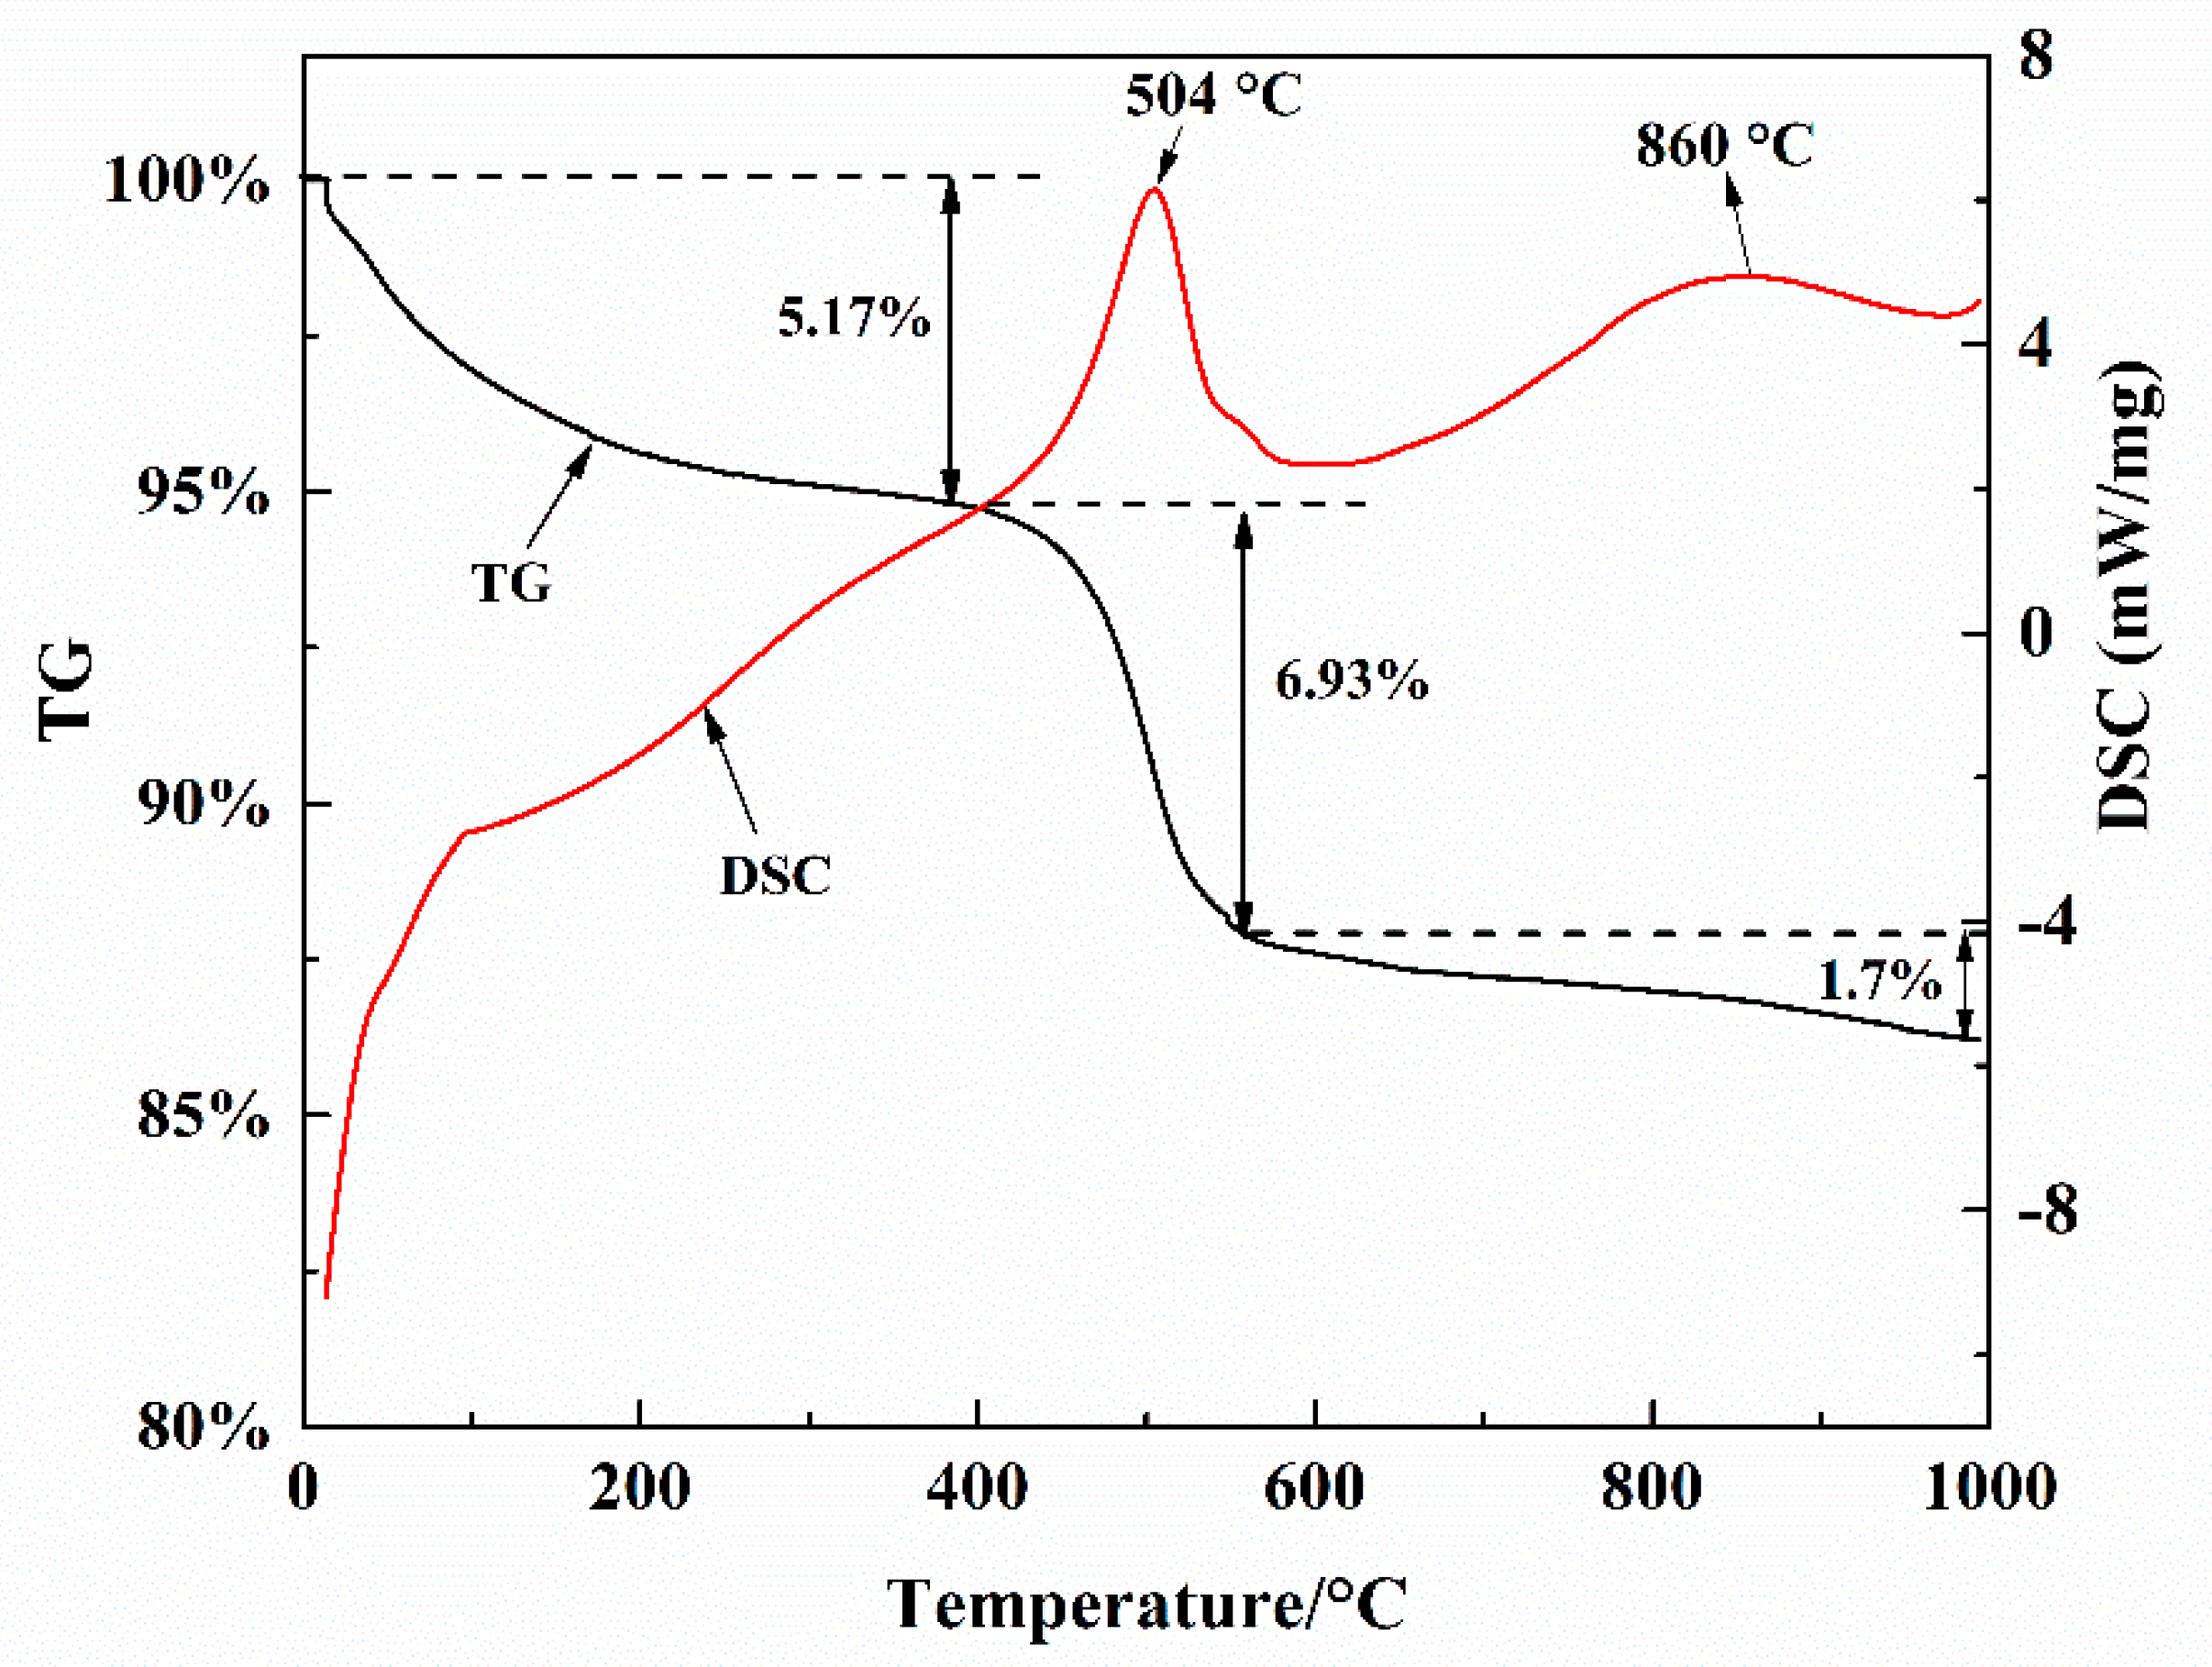
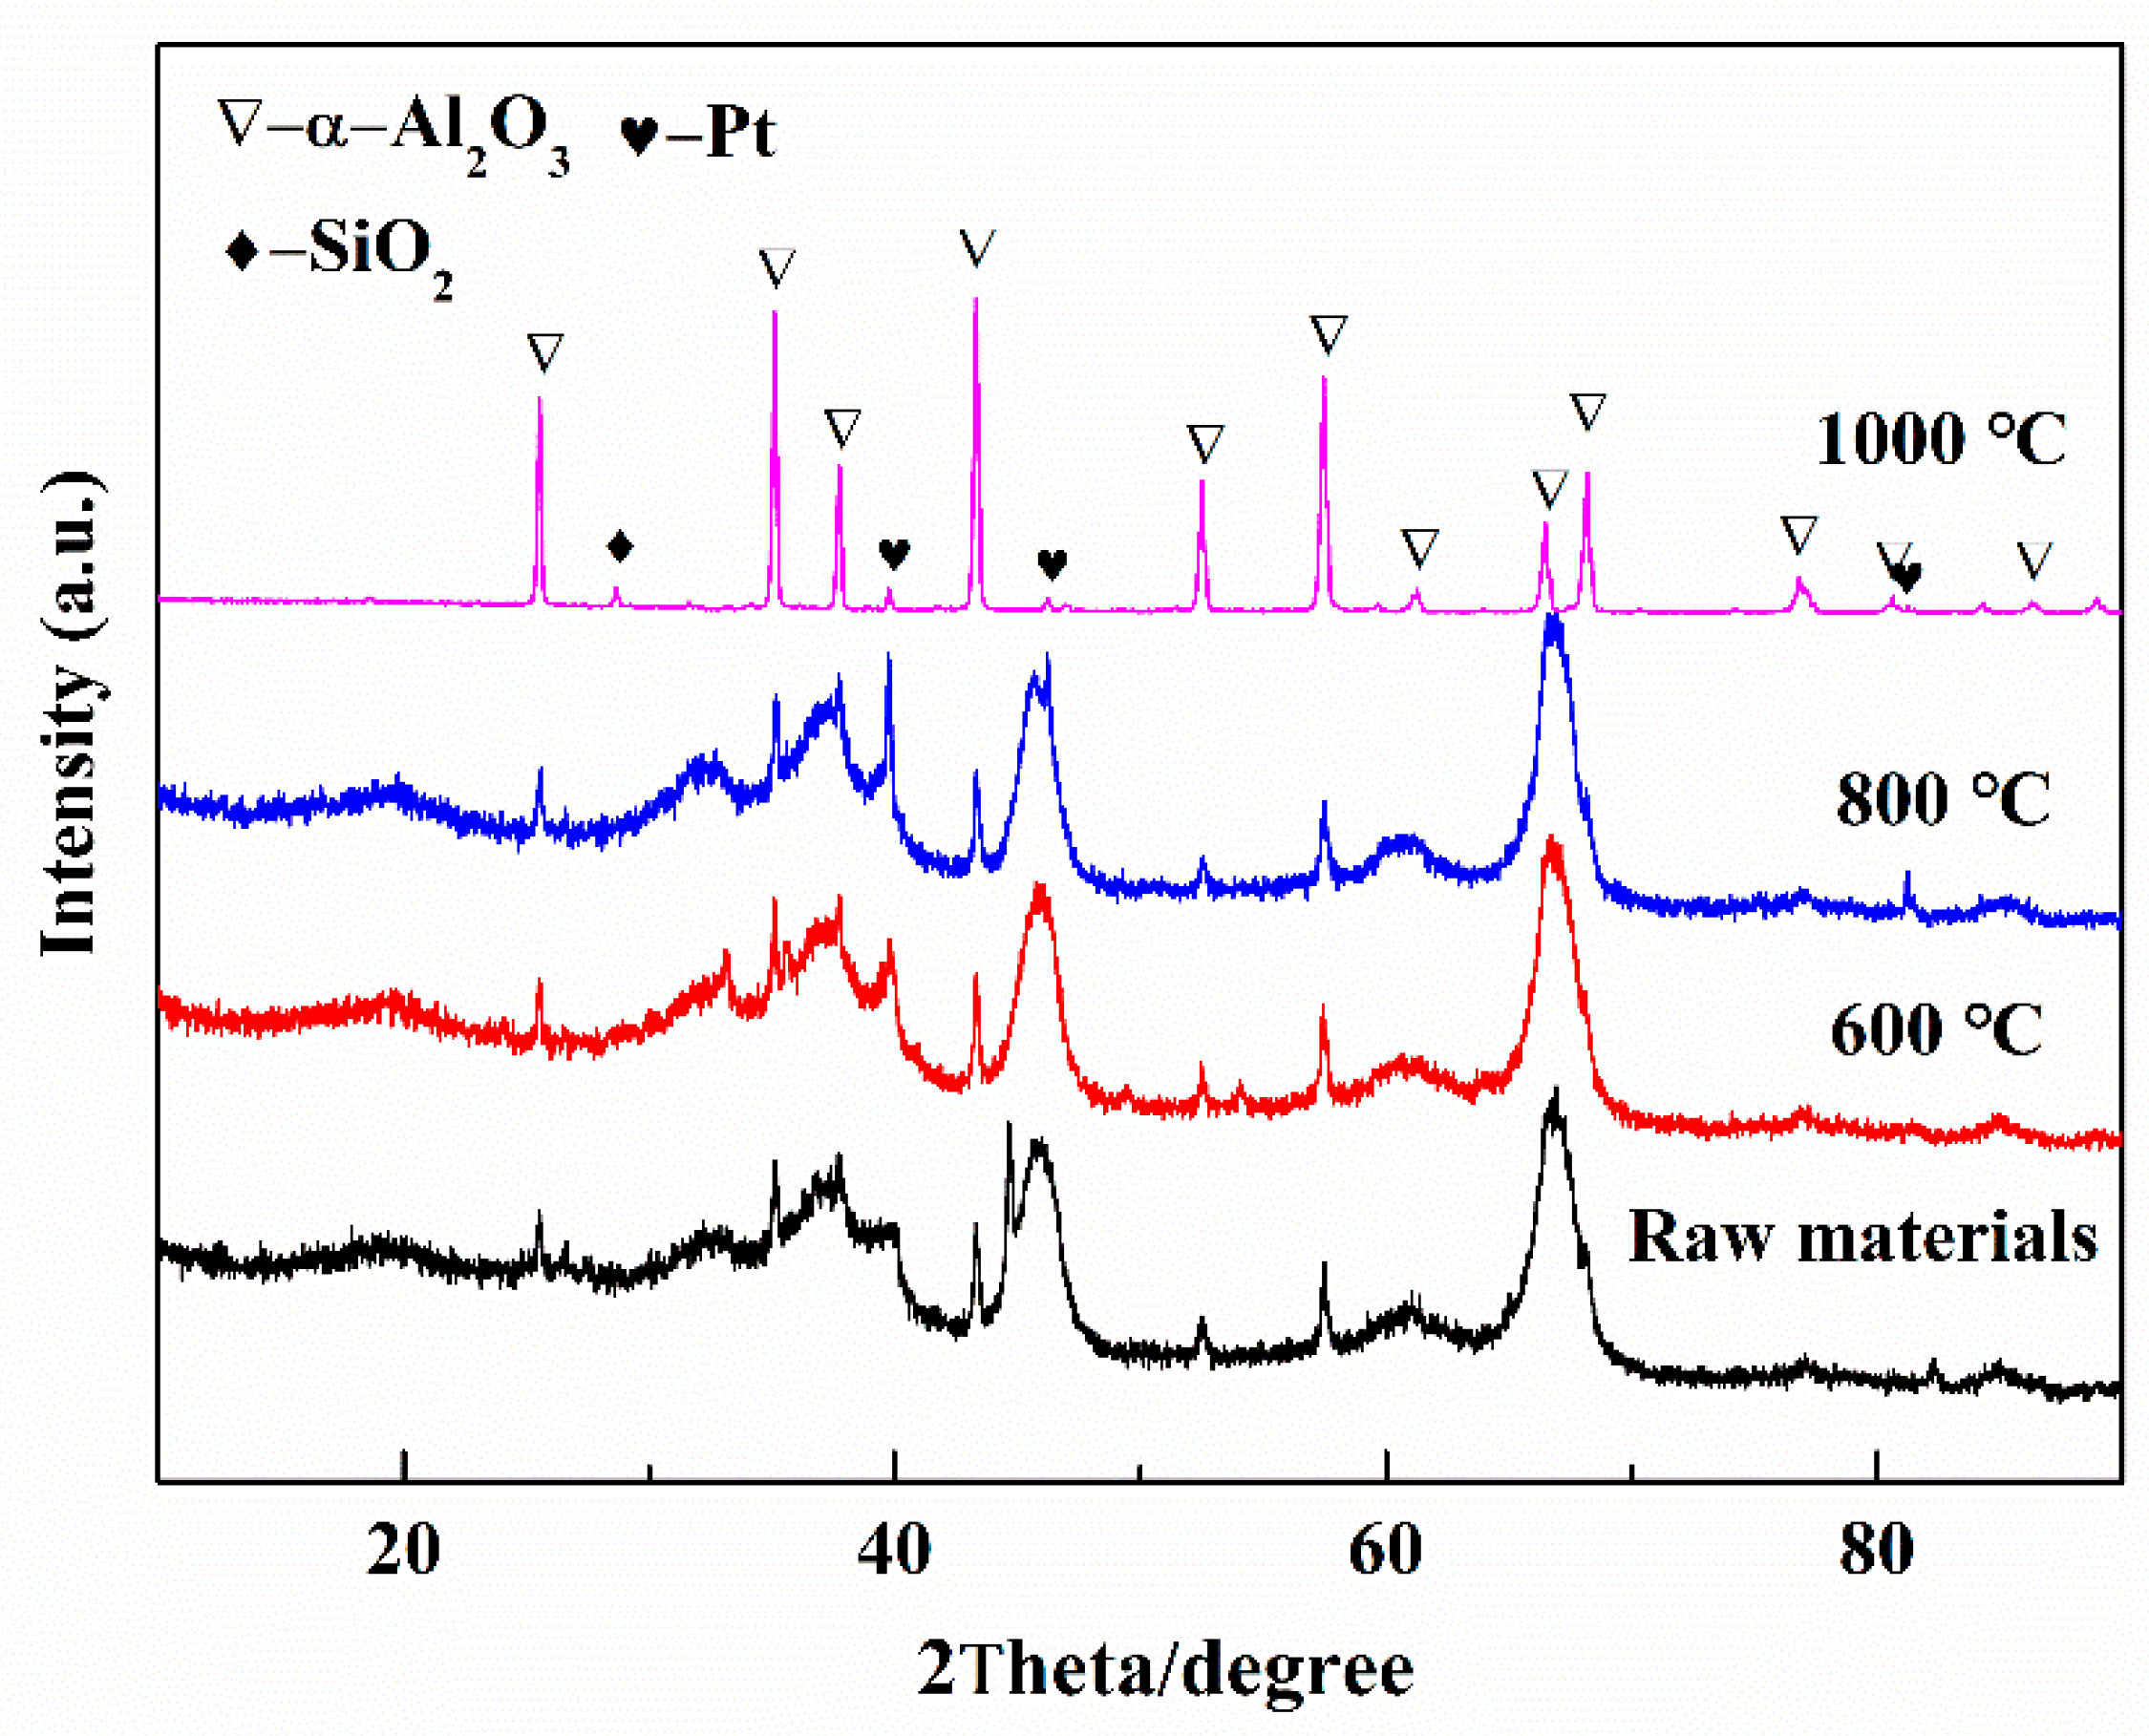
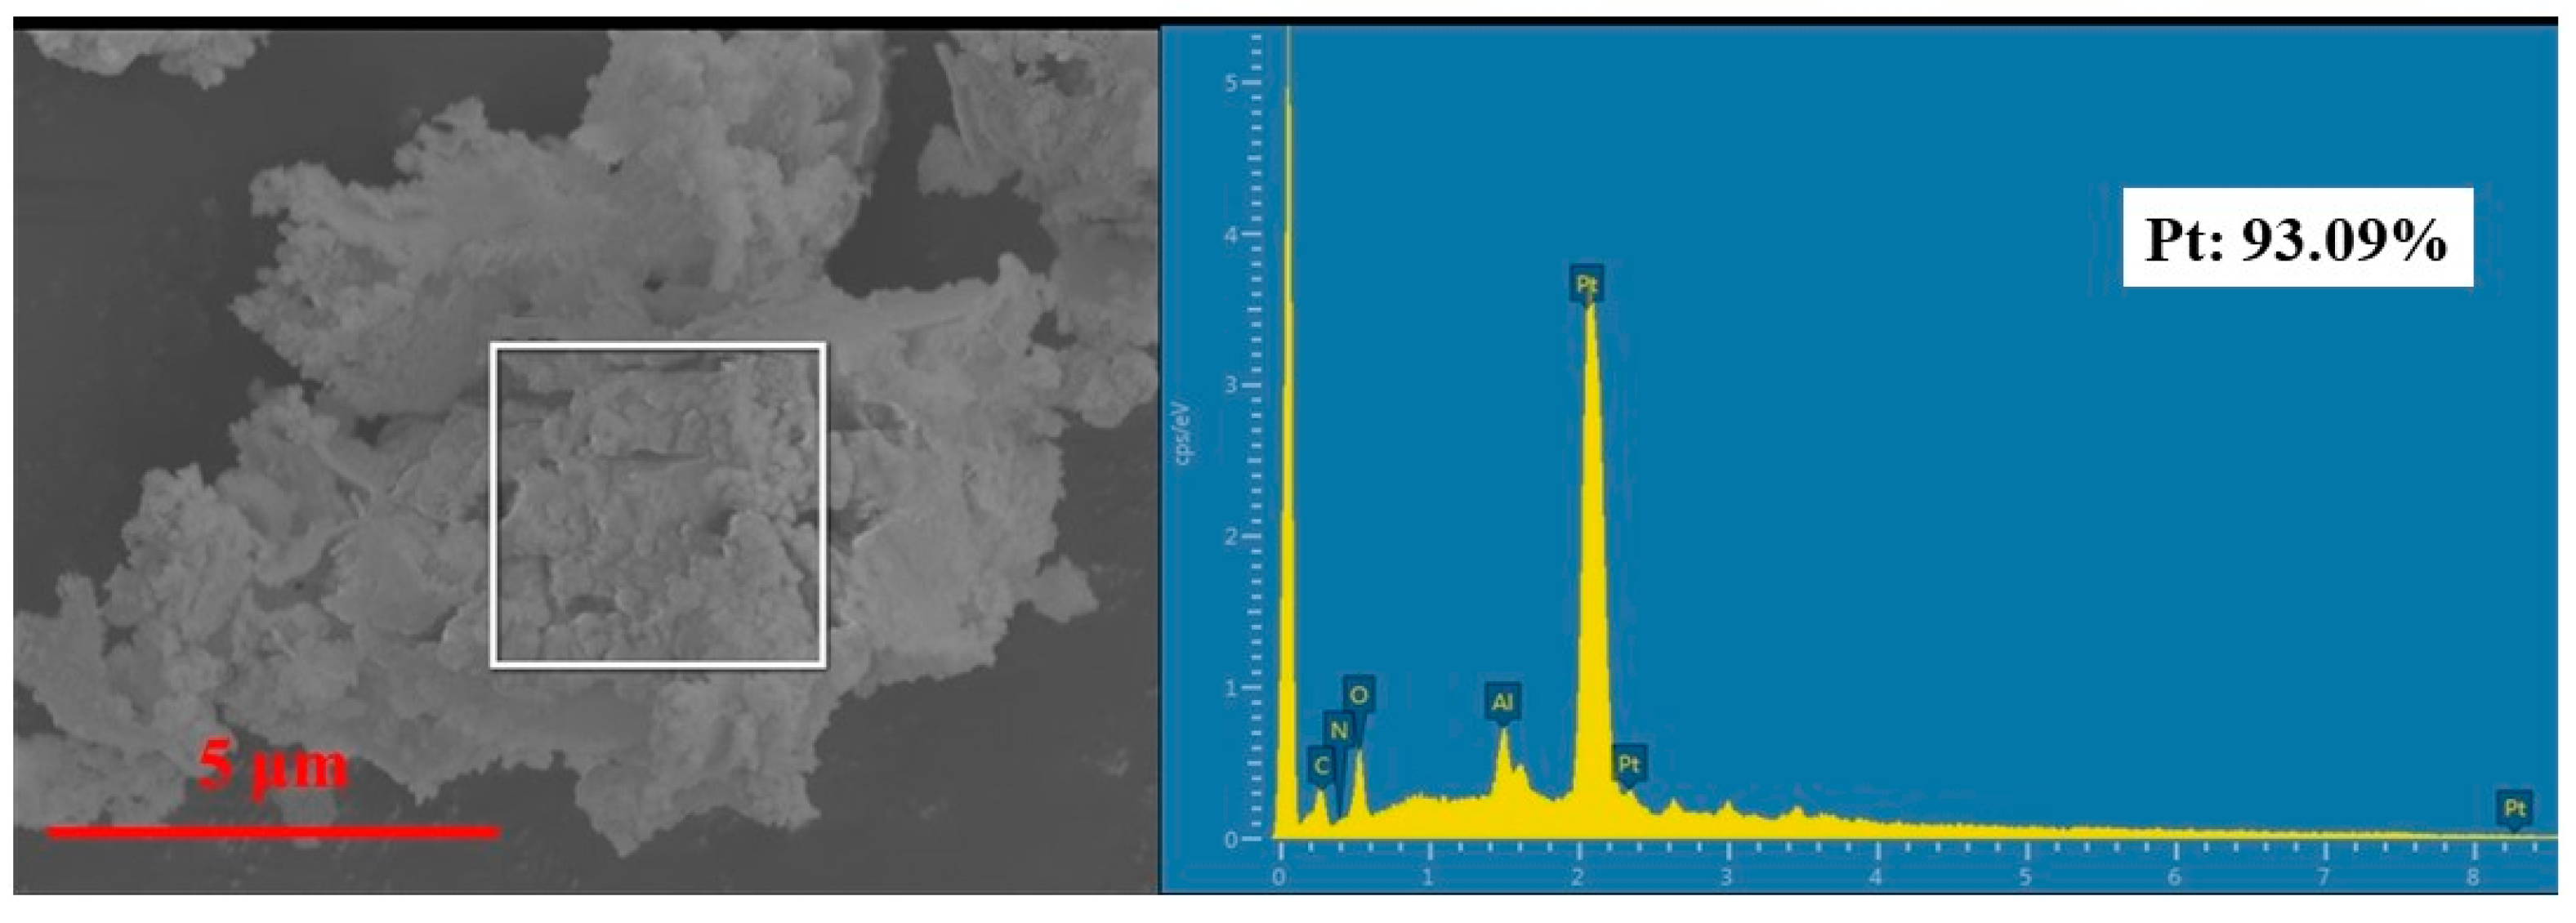
3.1. Characterization of Spent Catalysts

The spent catalysts include 89.97% Al2O3, 2.86% Fe2O3, 1.74% MoO3, 1.27% Cl, 0.97% SiO2, and other elements are less than 0.5% (Please see in Table S2). Figure 3 shows the thermal behavior of spent catalysts during calcination in the air atmosphere. The TG curve shows that there were three main weight-loss regions at 25–390 °C, 390–580 °C, and 580–1000 °C, respectively (the DTG (derivative thermogravimetry) curve is shown in Figure S1). The first weight-loss region (between 25 and 390 °C), arises from the loss of bound water and volatile organic compound (5.17 wt.%). The weight-loss (6.93 wt.%) between 390 and 580 °C was because of the decomposition and combustion of organics. The exothermic DSC peaked at 504 °C, which likely corresponds to the burning of organic matter. In the third weight-loss region (between 580 °C and 1000 °C), it was most likely due to the coke combustion (1.7 wt.%). The color changed from dark to grey at 600 °C and to white at 1000 °C (as shown in Figure S2). Therefore, the optimum calcination temperature was between 600 °C and 1000 °C.
Figure 4 shows the XRD patterns of the spent catalysts before and after calcination at 600 °C, 800 °C, and 1000 °C for 2 h. There was no obvious difference when roasted at 600 °C, and the main phase of Al2O3 was amorphous. When the temperature increased to 800 °C, characteristic peaks of Pt were found. Amorphous Al2O3 has been transferred into α-Al2O3 after calcination at 1000 °C. The metallic Pt can be clearly found because of grain growth as the calcination temperature increased to 1000 °C.

3.2. Platinum Leaching

3.2.1. Effect of Calcination Temperature

As deposits of organics and carbon may absorb precious metals during leaching experiments, it is necessary to calcinate the spent catalysts before leaching. Meanwhile, α-Al2O3 was formed after calcination, which can decrease the dissolution of Al2O3. Hence, the influence of calcination temperature on leaching behavior of Pt from spent catalysts was primarily investigated under the invariable leaching conditions of 6.0 mol/L HCl, liquid/solid ratio (L/S) of 10 mL/g, 10% H2O2: spent catalysts of 0.6 mL/g, and temperature of 90 °C for 2 h. The results presented in Table 2 clearly demonstrate the significance of calcination temperature on Pt leaching.
As shown in Table 2, the leaching efficiency of Pt could be enhanced from 77.4% to 99.9% by increasing the calcination temperature from 600 °C to 800 °C. However, it decreased to 82.5% when the calcination temperature was 1000 °C. The content of Pt in the leaching residues was analyzed through aqua regia hydrothermal dissolution. However, the total Pt in the leachate and residue was only 77.6% when calcination at 600 °C. After the residue was calcinated at 800 °C, the content of Pt was found to be 604.5 g/t (22.3% of total amount in spent catalysts). The result indicated that a portion of Pt in spent catalysts may exist as PtO2 since it could not be dissolved in aqua regia. The relationship between Gibbs free energy of the reaction and temperature is shown in Figure S3. When the calcination temperature was above 600 °C, PtO2 decomposed into metallic Pt and O2. As the calcination temperature increased to 1000 °C, grain growth and recrystallization happened on the micro- and nanoscale Pt particles. The process reduced the superficial area of Pt particles and decreased their reactivity. Therefore, the optimum calcination temperature was 800 °C.

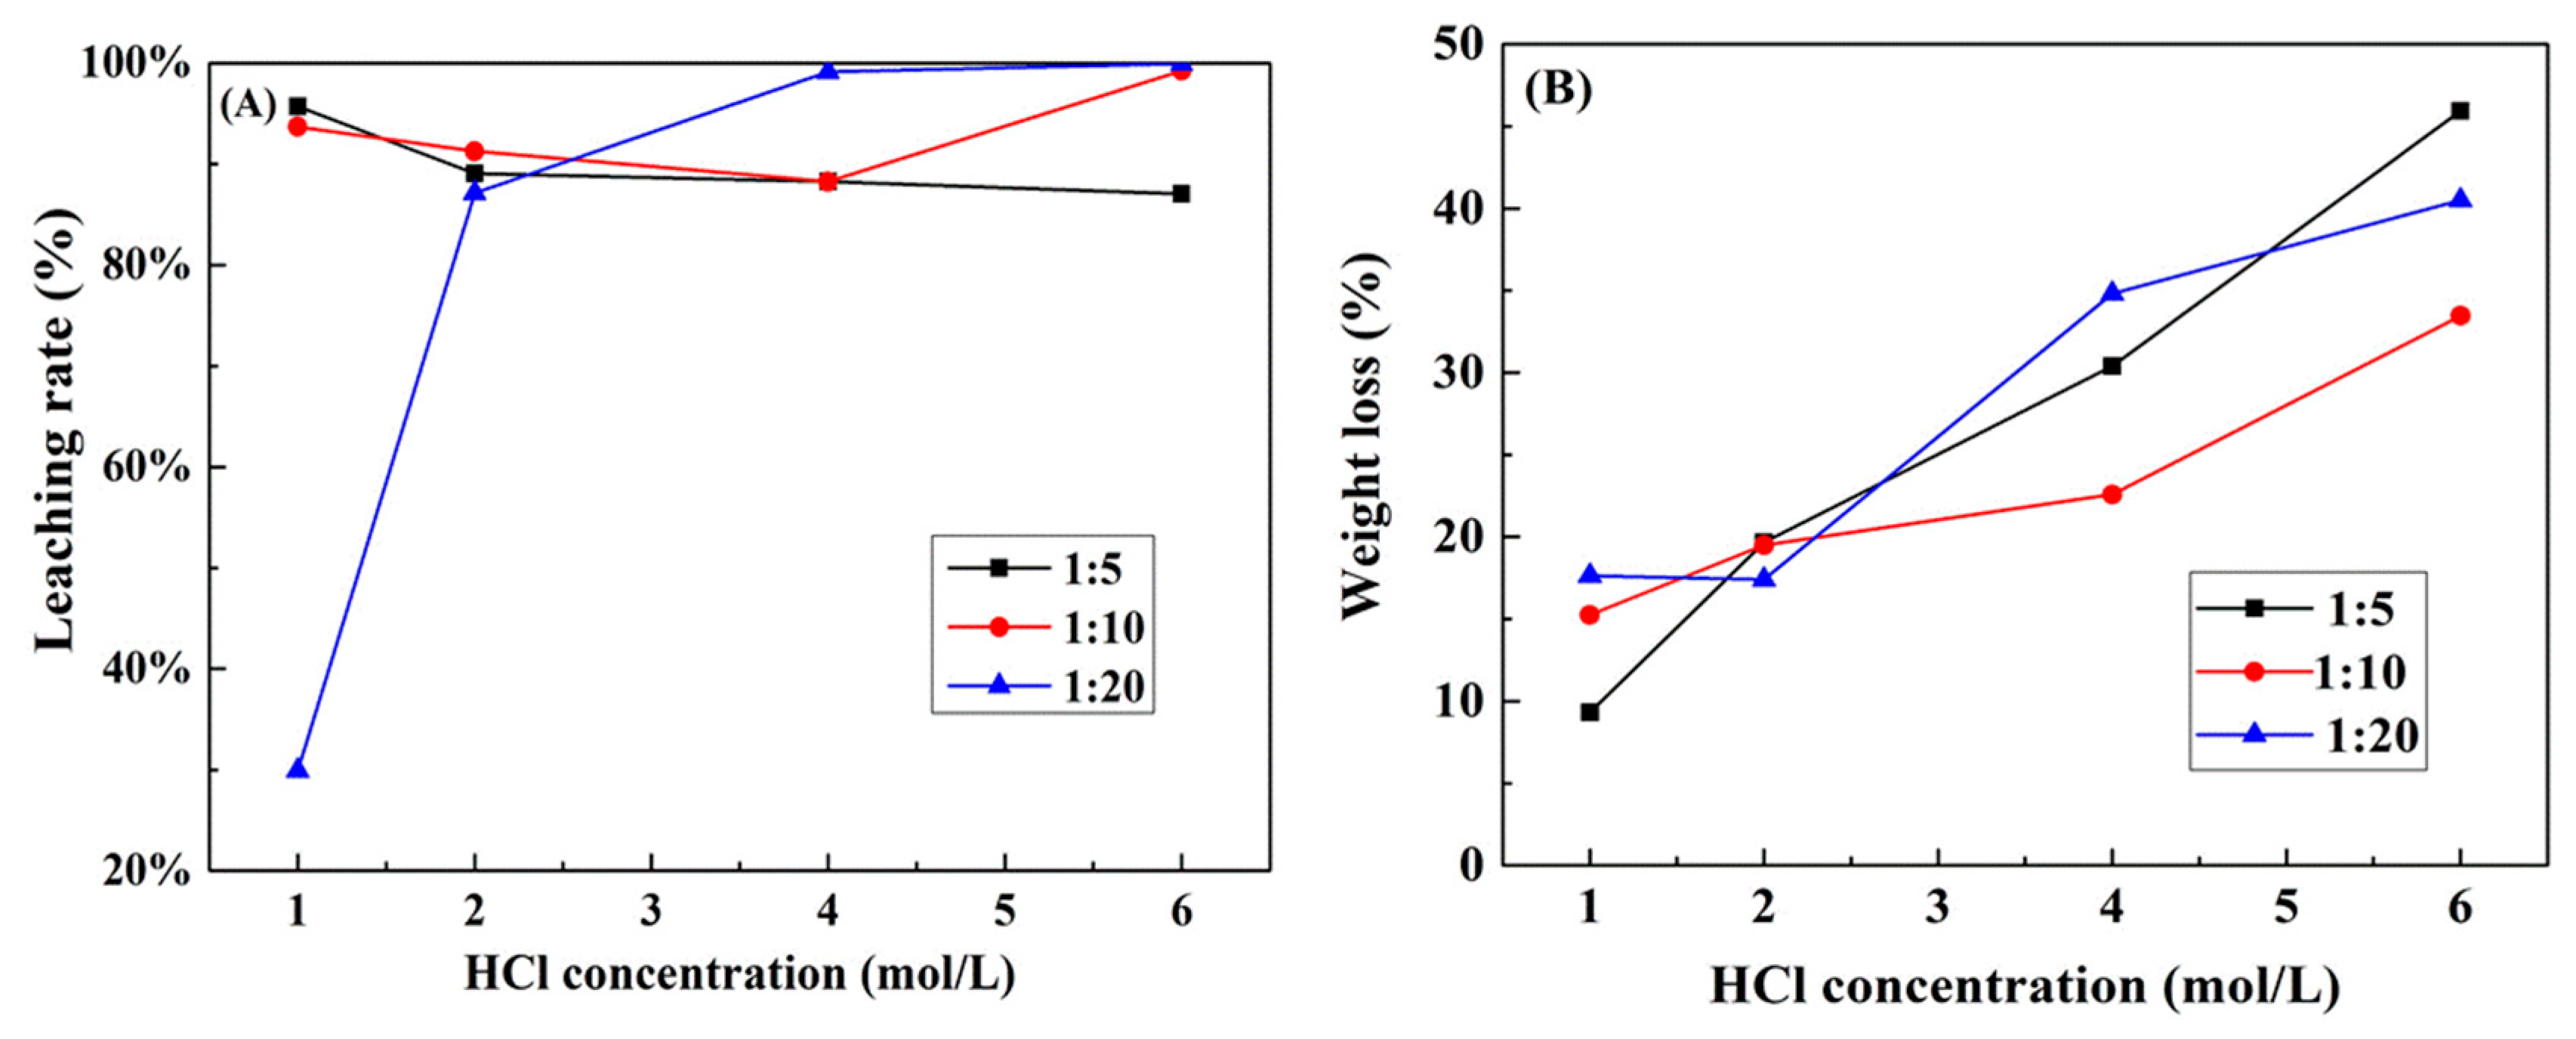
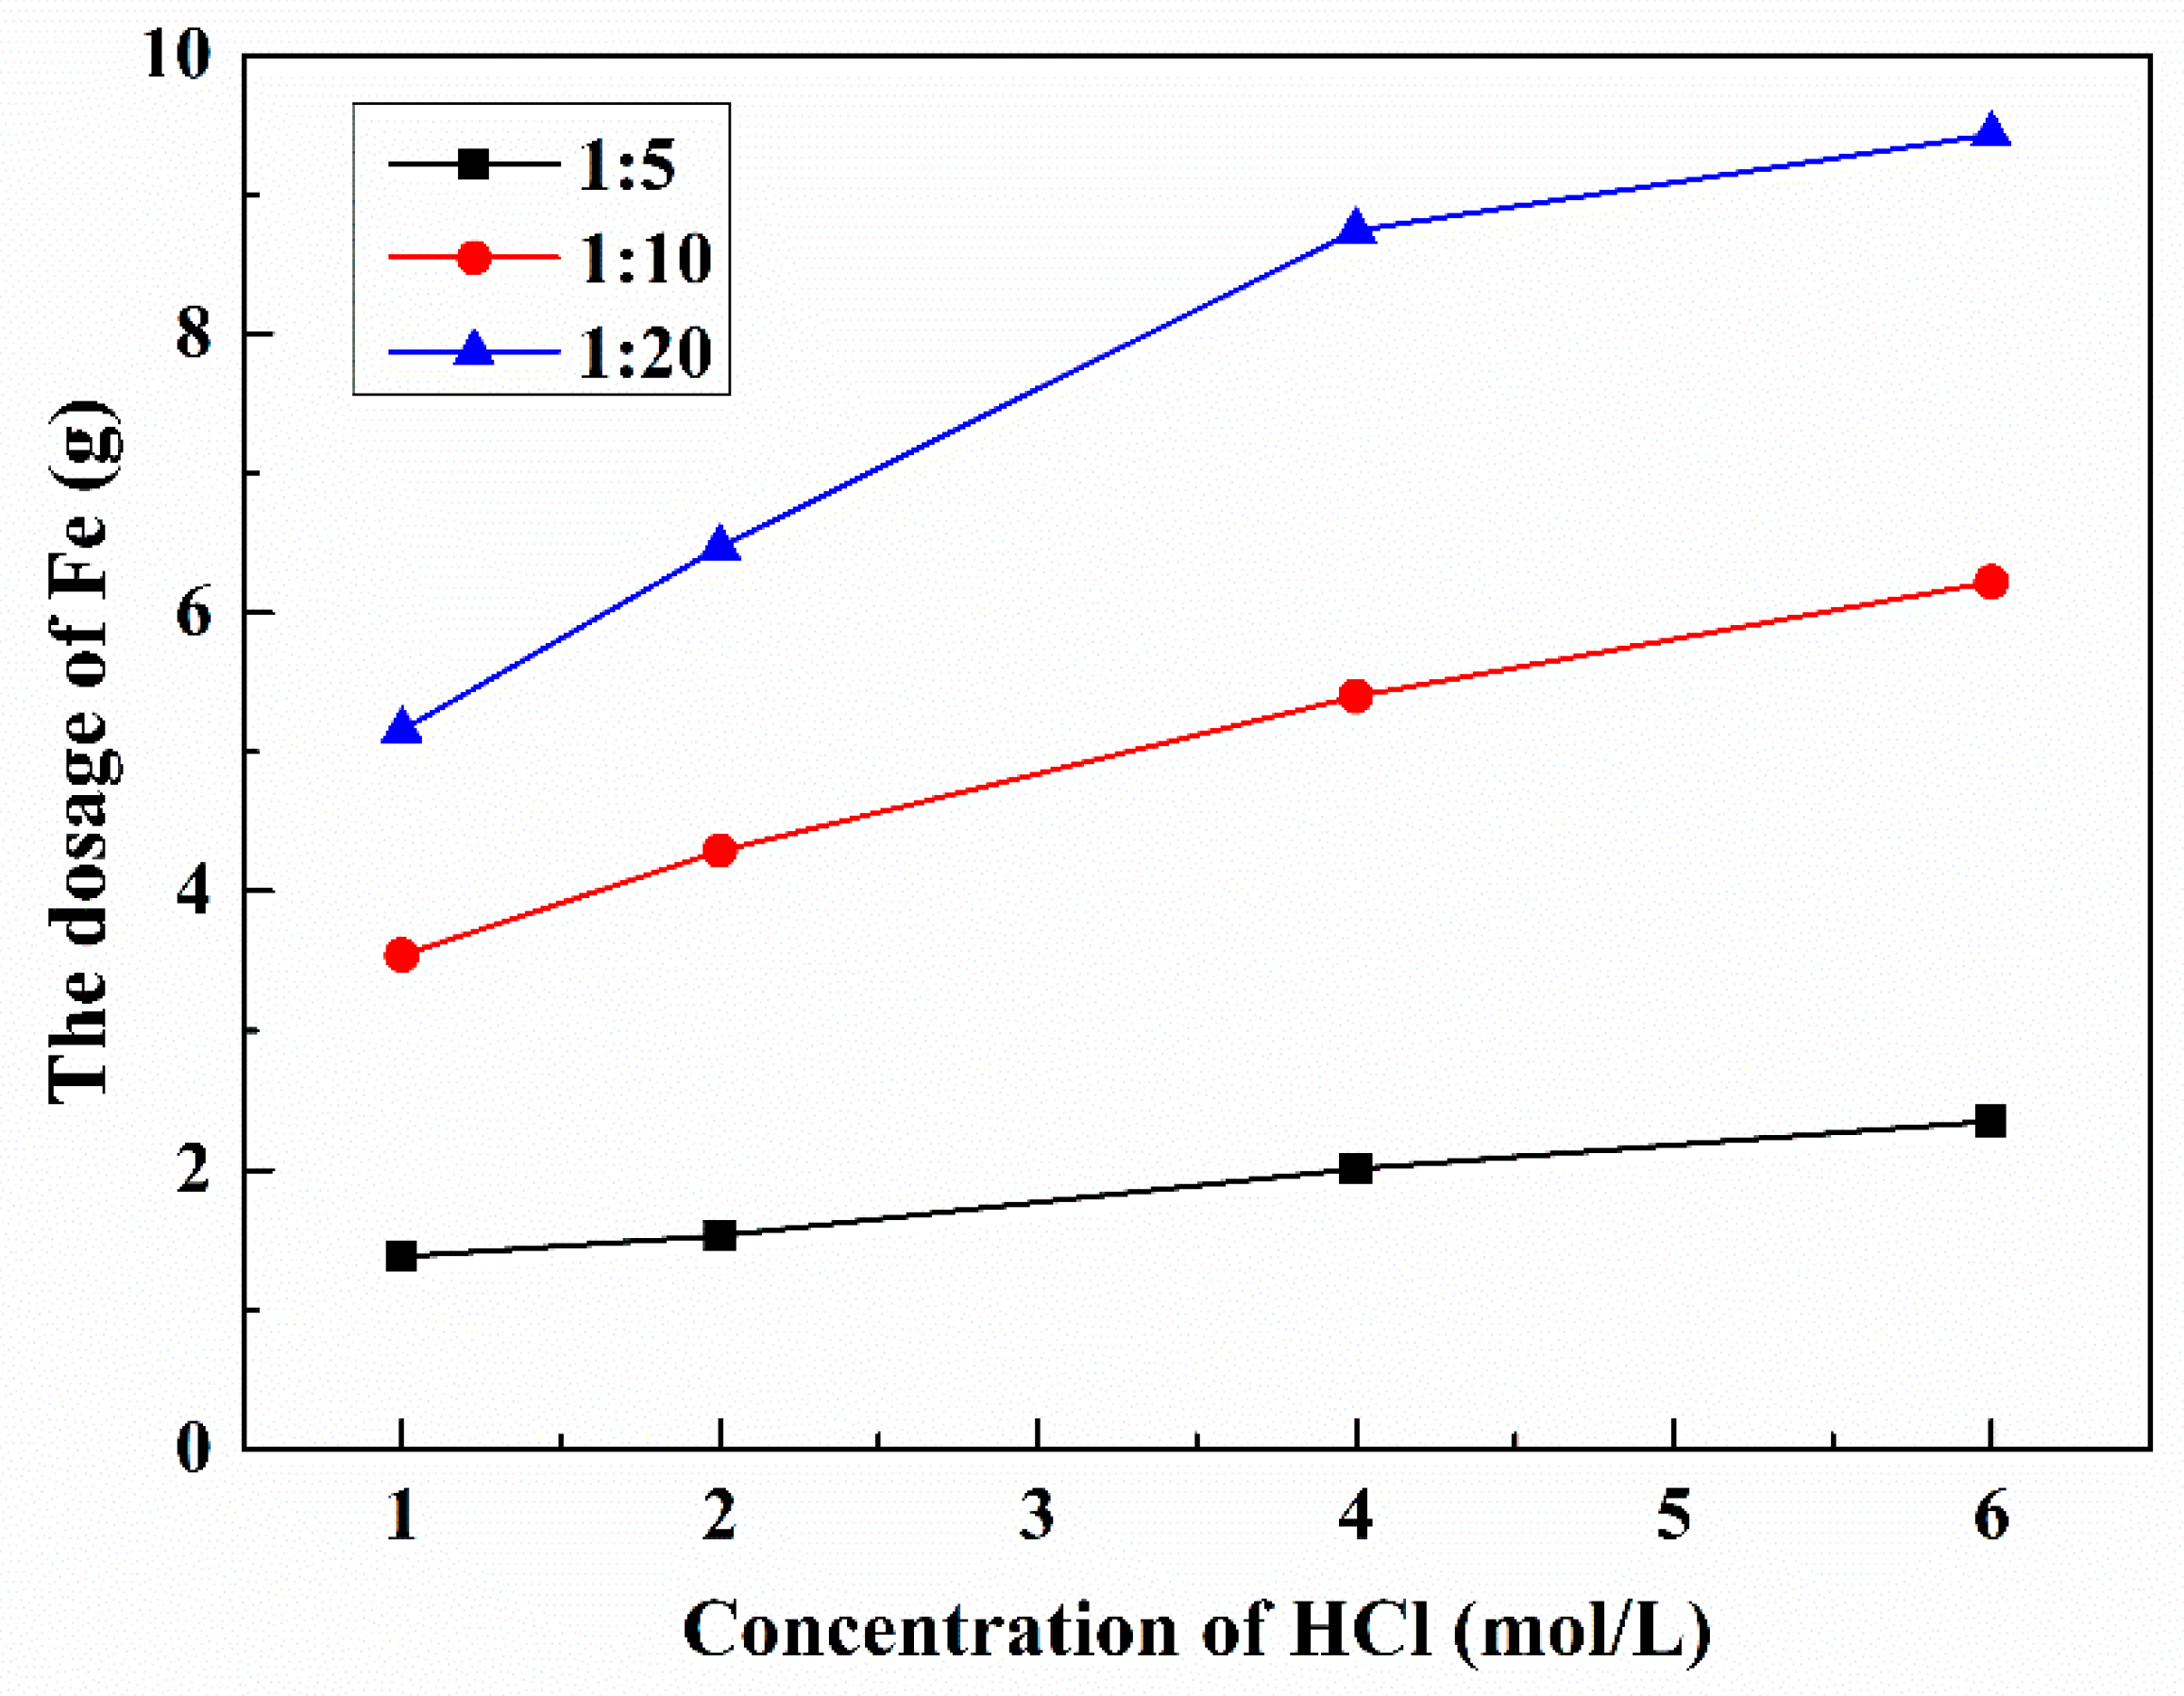
3.2.2. Effect of S/L and HCl Concentration

In order to reduce the generation of Cl2, improve the working conditions during Pt leaching, and decrease the consumption of reductant in the reduction process, NaCl was used as a chloride source to partly replace HCl. The effect of HCl concentration was evaluated in a series of tests where the total chloride ion concentration maintained constant (6.0 mol/L), by replacing the HCl concentration with different S/L (g/mL). Figure 5A illustrates the results obtained from the leaching experiments. The replacement of HCl by NaCl had significant influence on Pt leaching efficiency, especially when the S/L were 1:10 and 1:20 g/mL. When concentration of HCl was no more than 2.0 mol/L, Pt leaching efficiency was higher with a higher S/L ratio. However, the situation of Pt leaching rate was, on the contrary, at higher HCl concentration.
When the S/L ratio was 1:5, the leaching rate of Pt decreased slowly with the increasing acid concentration. The highest leaching efficiency was 95.7% when the HCl concentration was 1.0 mol/L. The oxidation of Pt mainly depended on the concentration of H2O2 and the dissolution of chlorine. A large amount of Cl2 was generated by the reaction of H2O2 and HCl and then discharged when the concentration of HCl was high. As the addition of H2O2 was constant, the oxidation of Pt would stop once H2O2 run out. This is the reason the leaching rate of Pt decreased at higher HCl concentrations. When the S/L was 1:10, Pt leaching rate was similar with that of 1:5 when HCl concentration was no more than 4.0 mol/L. For 6.0 mol/L HCl, more than 99% of Pt was recovered because a higher S/L ratio can dissolve more chlorine. As the S/L ratio increased to 1:20, Pt leaching efficiency increased sharply from 30.0% to 99.9% with HCl concentration increasing from 1.0 to 6.0 mol/L. For 1.0 mol/L HCl, the concentration of H2O2 was the dominant factor affecting Pt leaching. However, when the concentration of H2O2 was less than 0.01 mol/L, Pt leaching efficiency was only 30.0%. With the concentration of HCl increasing, the dissolution of chlorine started to dominate the leaching process. When HCl concentration was above 4.0 mol/L, over 99% of Pt was dissolved in the leaching system.
The weight loss of spent catalysts was calculated during the leaching process, as shown in Figure 5B. The main loss was the dissolution of Al2O3 since it accounted for more than 90% of the total mass of raw materials. A continuous increase of weight loss was observed as the HCl content increased, demonstrating that the use of NaCl can effectively improve the selectivity for Pt leaching. When the concentration of HCl was 1.0 mol/L, the weight loss was only 9.3% with the S/L ratio 1:5. More than 30% of Al2O3 was dissolved when HCl concentration was 6.0 mol/L. Hence, the optimum leachant maximizing Pt leaching and minimizing the Al2O3 dissolution was composed of 1.0 mol/L HCl and 5.0 mol/L NaCl, and the S/L ratio was 1:5.

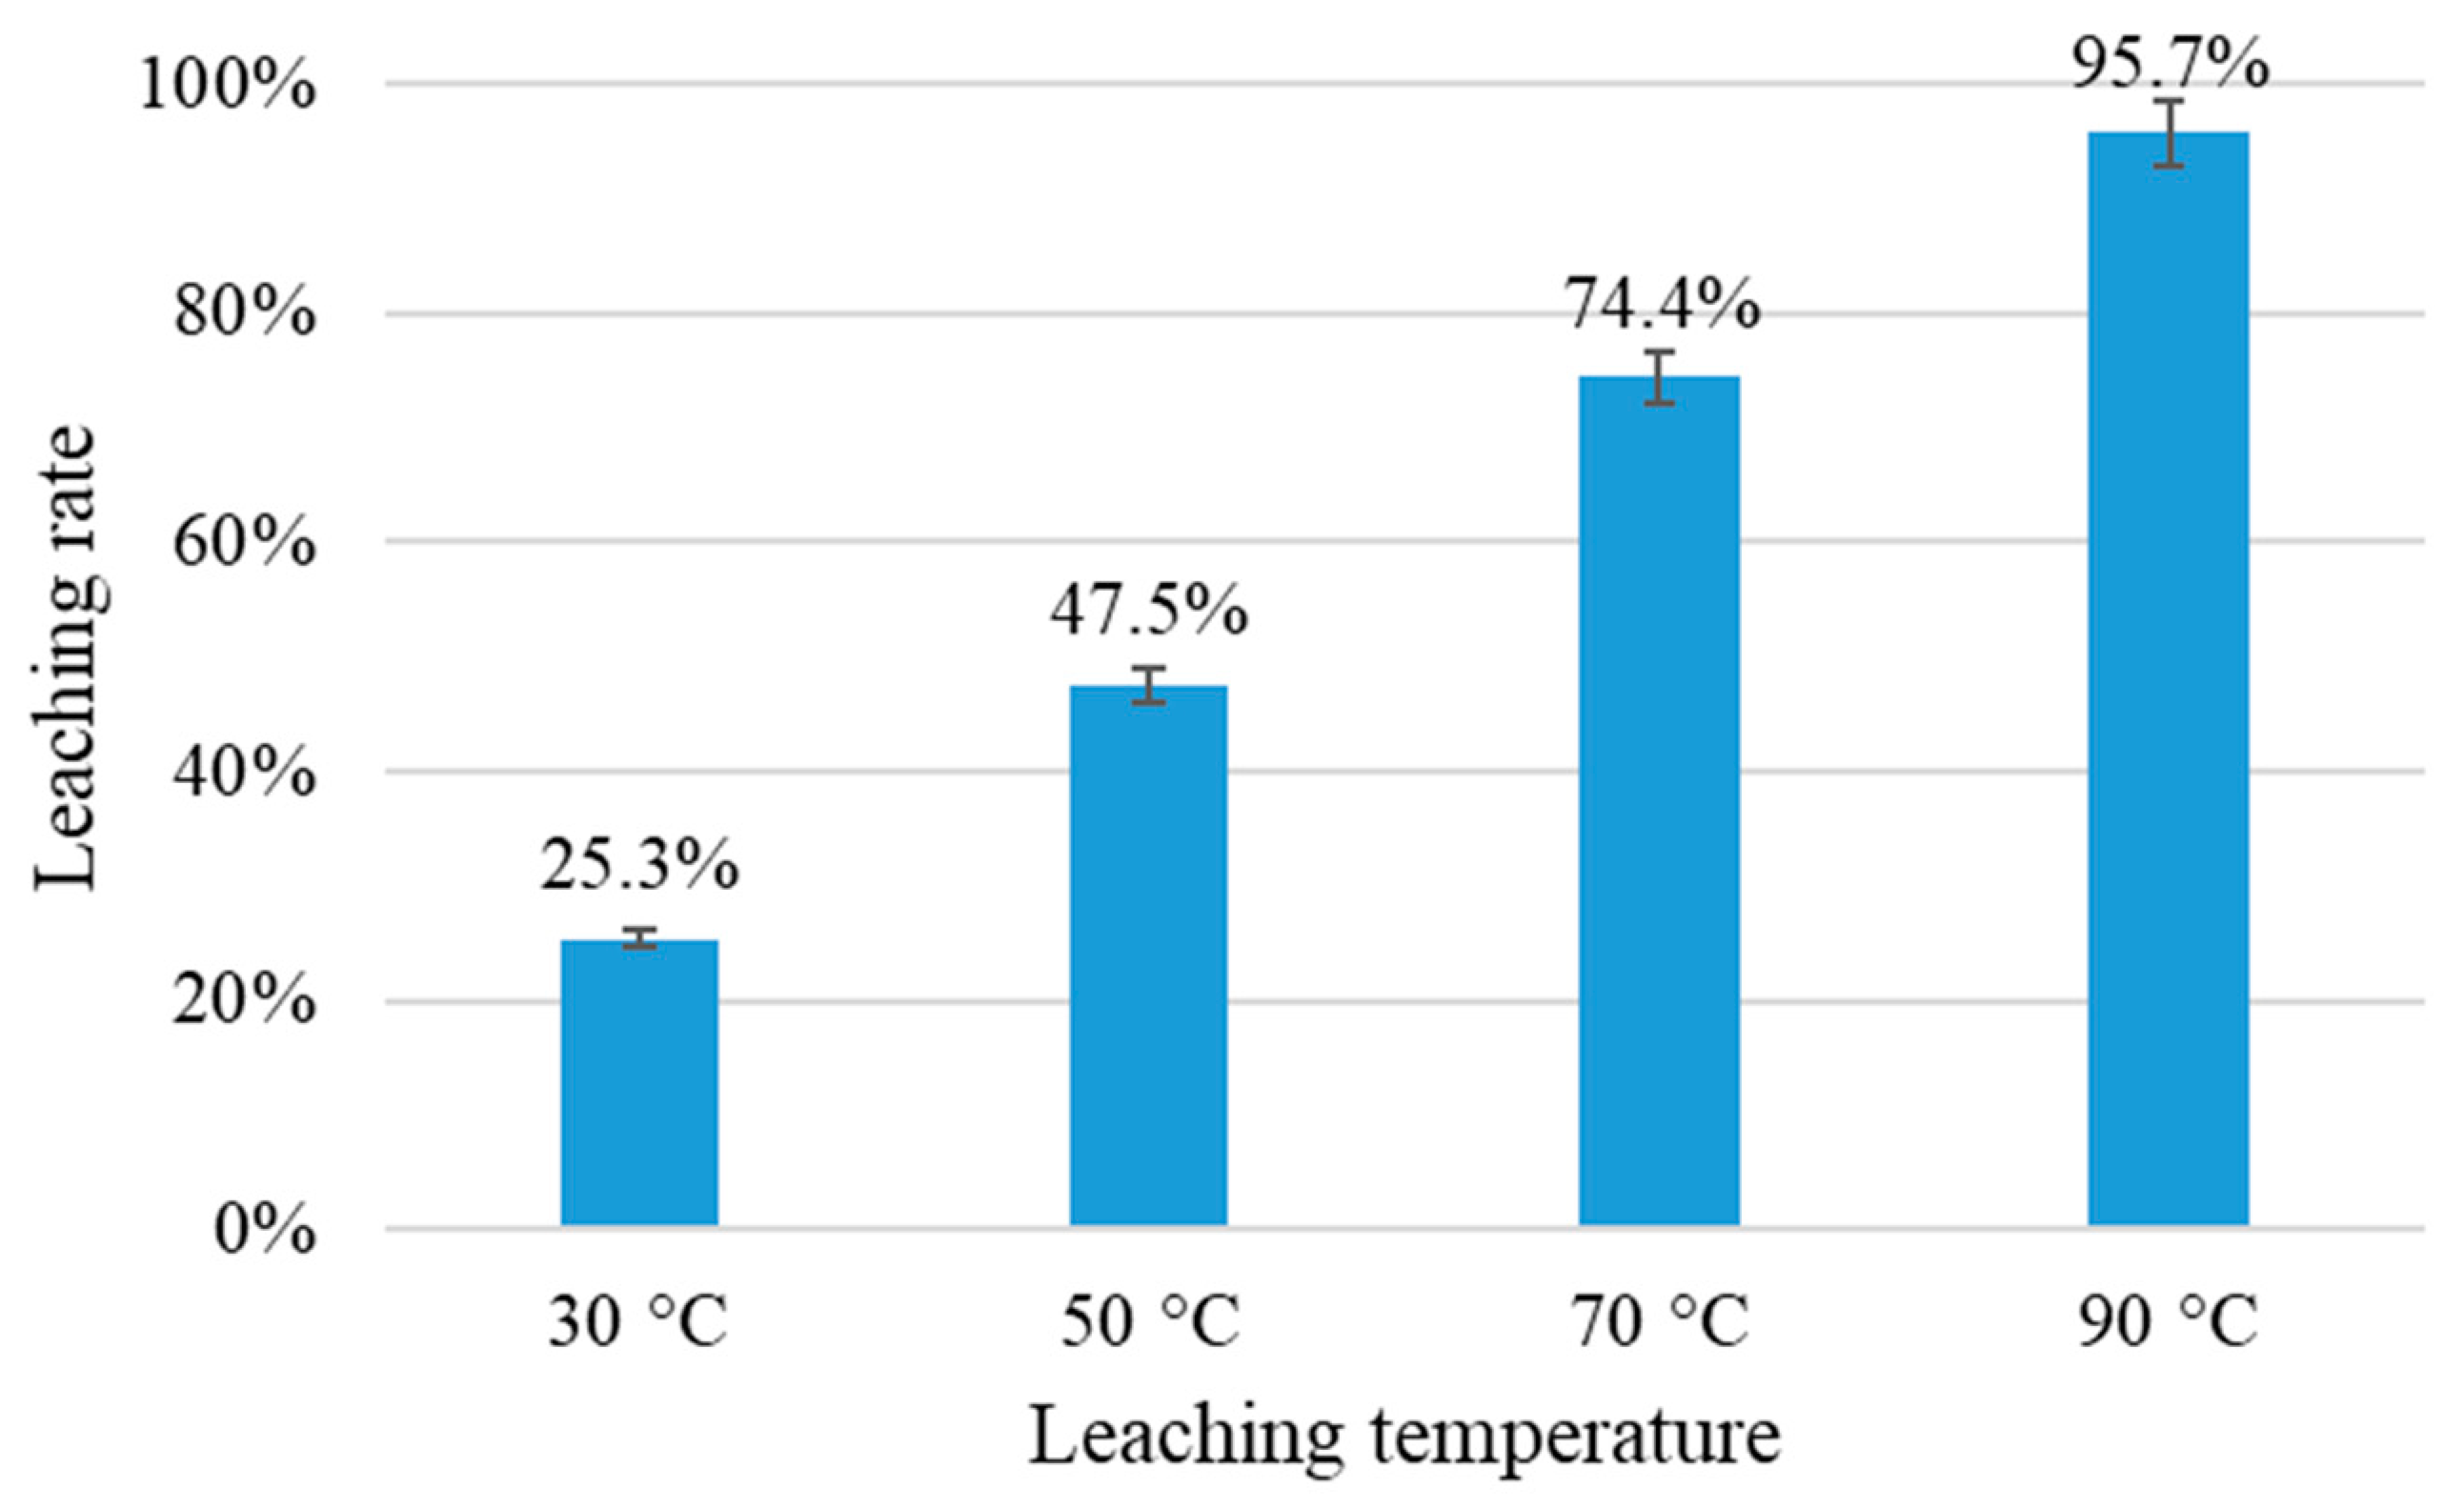
3.2.3. Effect of Leaching Temperature

The effect of temperature on the leaching efficiency of Pt was also investigated. The temperature varied from 30 to 90 °C, and the other conditions were HCl 1.0 mol/L, NaCl 5.0 mol/L, 10% H2O2/spent catalysts = 0.6 mL/g, S/L = 1:5, and leaching time of 2 h. Figure 6 shows that the leaching rate of Pt increased rapidly to over 95% at 90 °C. Only 25.3% of Pt was leached at 30 °C. A temperature of 90 °C is therefore suitable for the leaching process.

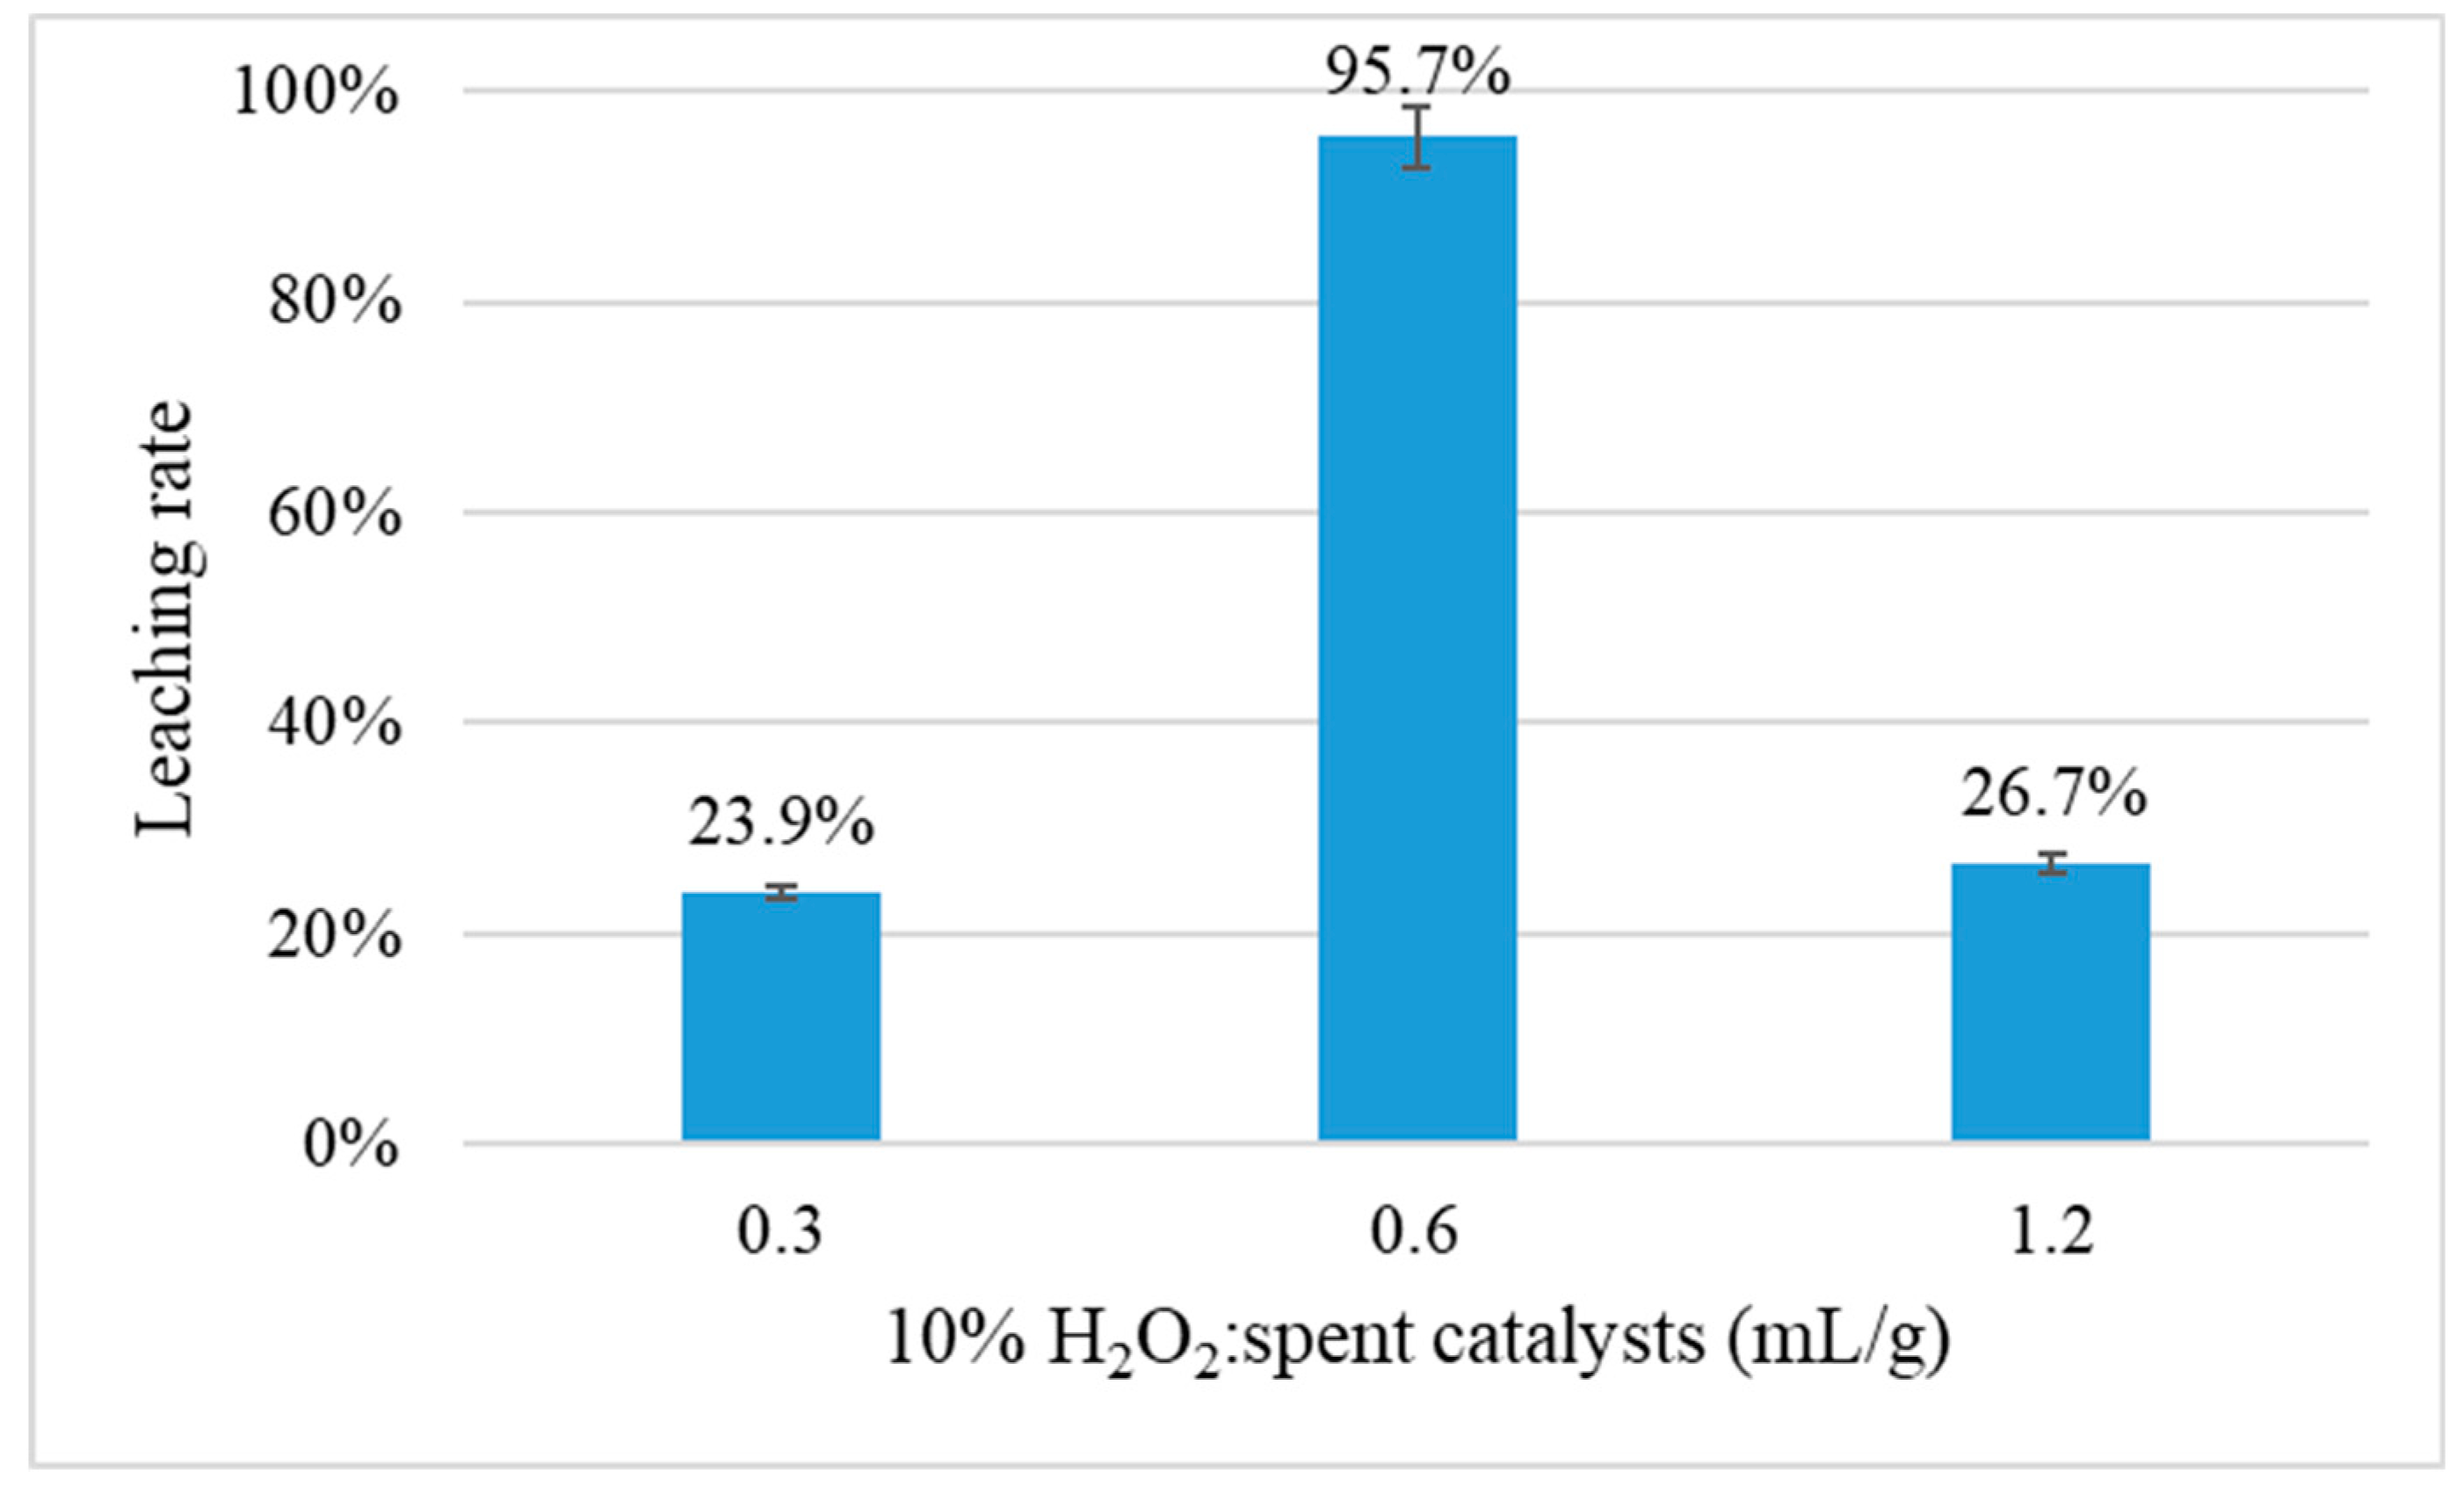
3.2.4. Effect of Hydrogen Peroxide Dosage

Figure 7 shows the effect of the usage of H2O2 on Pt leaching rate for a leaching time of 2 h at 90 °C with the solution of 1.0 mol/L HCl and 5.0 mol/L NaCl. Only 23.9% of Pt was dissolved when the ratio of 10% H2O2: spent catalysts (mL/g) was 0.3. The leaching efficiencies of Pt increased to 95.72% with the ratio of 10% H2O2: spent catalysts increasing from 0.3 to 0.6. It indicated that more H2O2 could promote the oxidation of Pt. However, the leaching efficiencies decreased dramatically to 26.7% as the ratio increased to 1:2. As analyzed above, H2O2 would react with HCl, which increased pH value of leaching solution. After the reactions finished, the pH values were 0.87, 2.15, and 3.52 for dosages of 10% H2O2: spent catalyst of 0.3, 0.6, and 1.2, respectively. The dissolved Pt complexes were not stable and then hydrolysis, resulting in the low leaching efficiency of Pt. The addition of H2O2 is sufficient for the leaching process when the ratio of 10% H2O2: spent catalysts was 0.6 mL/g.

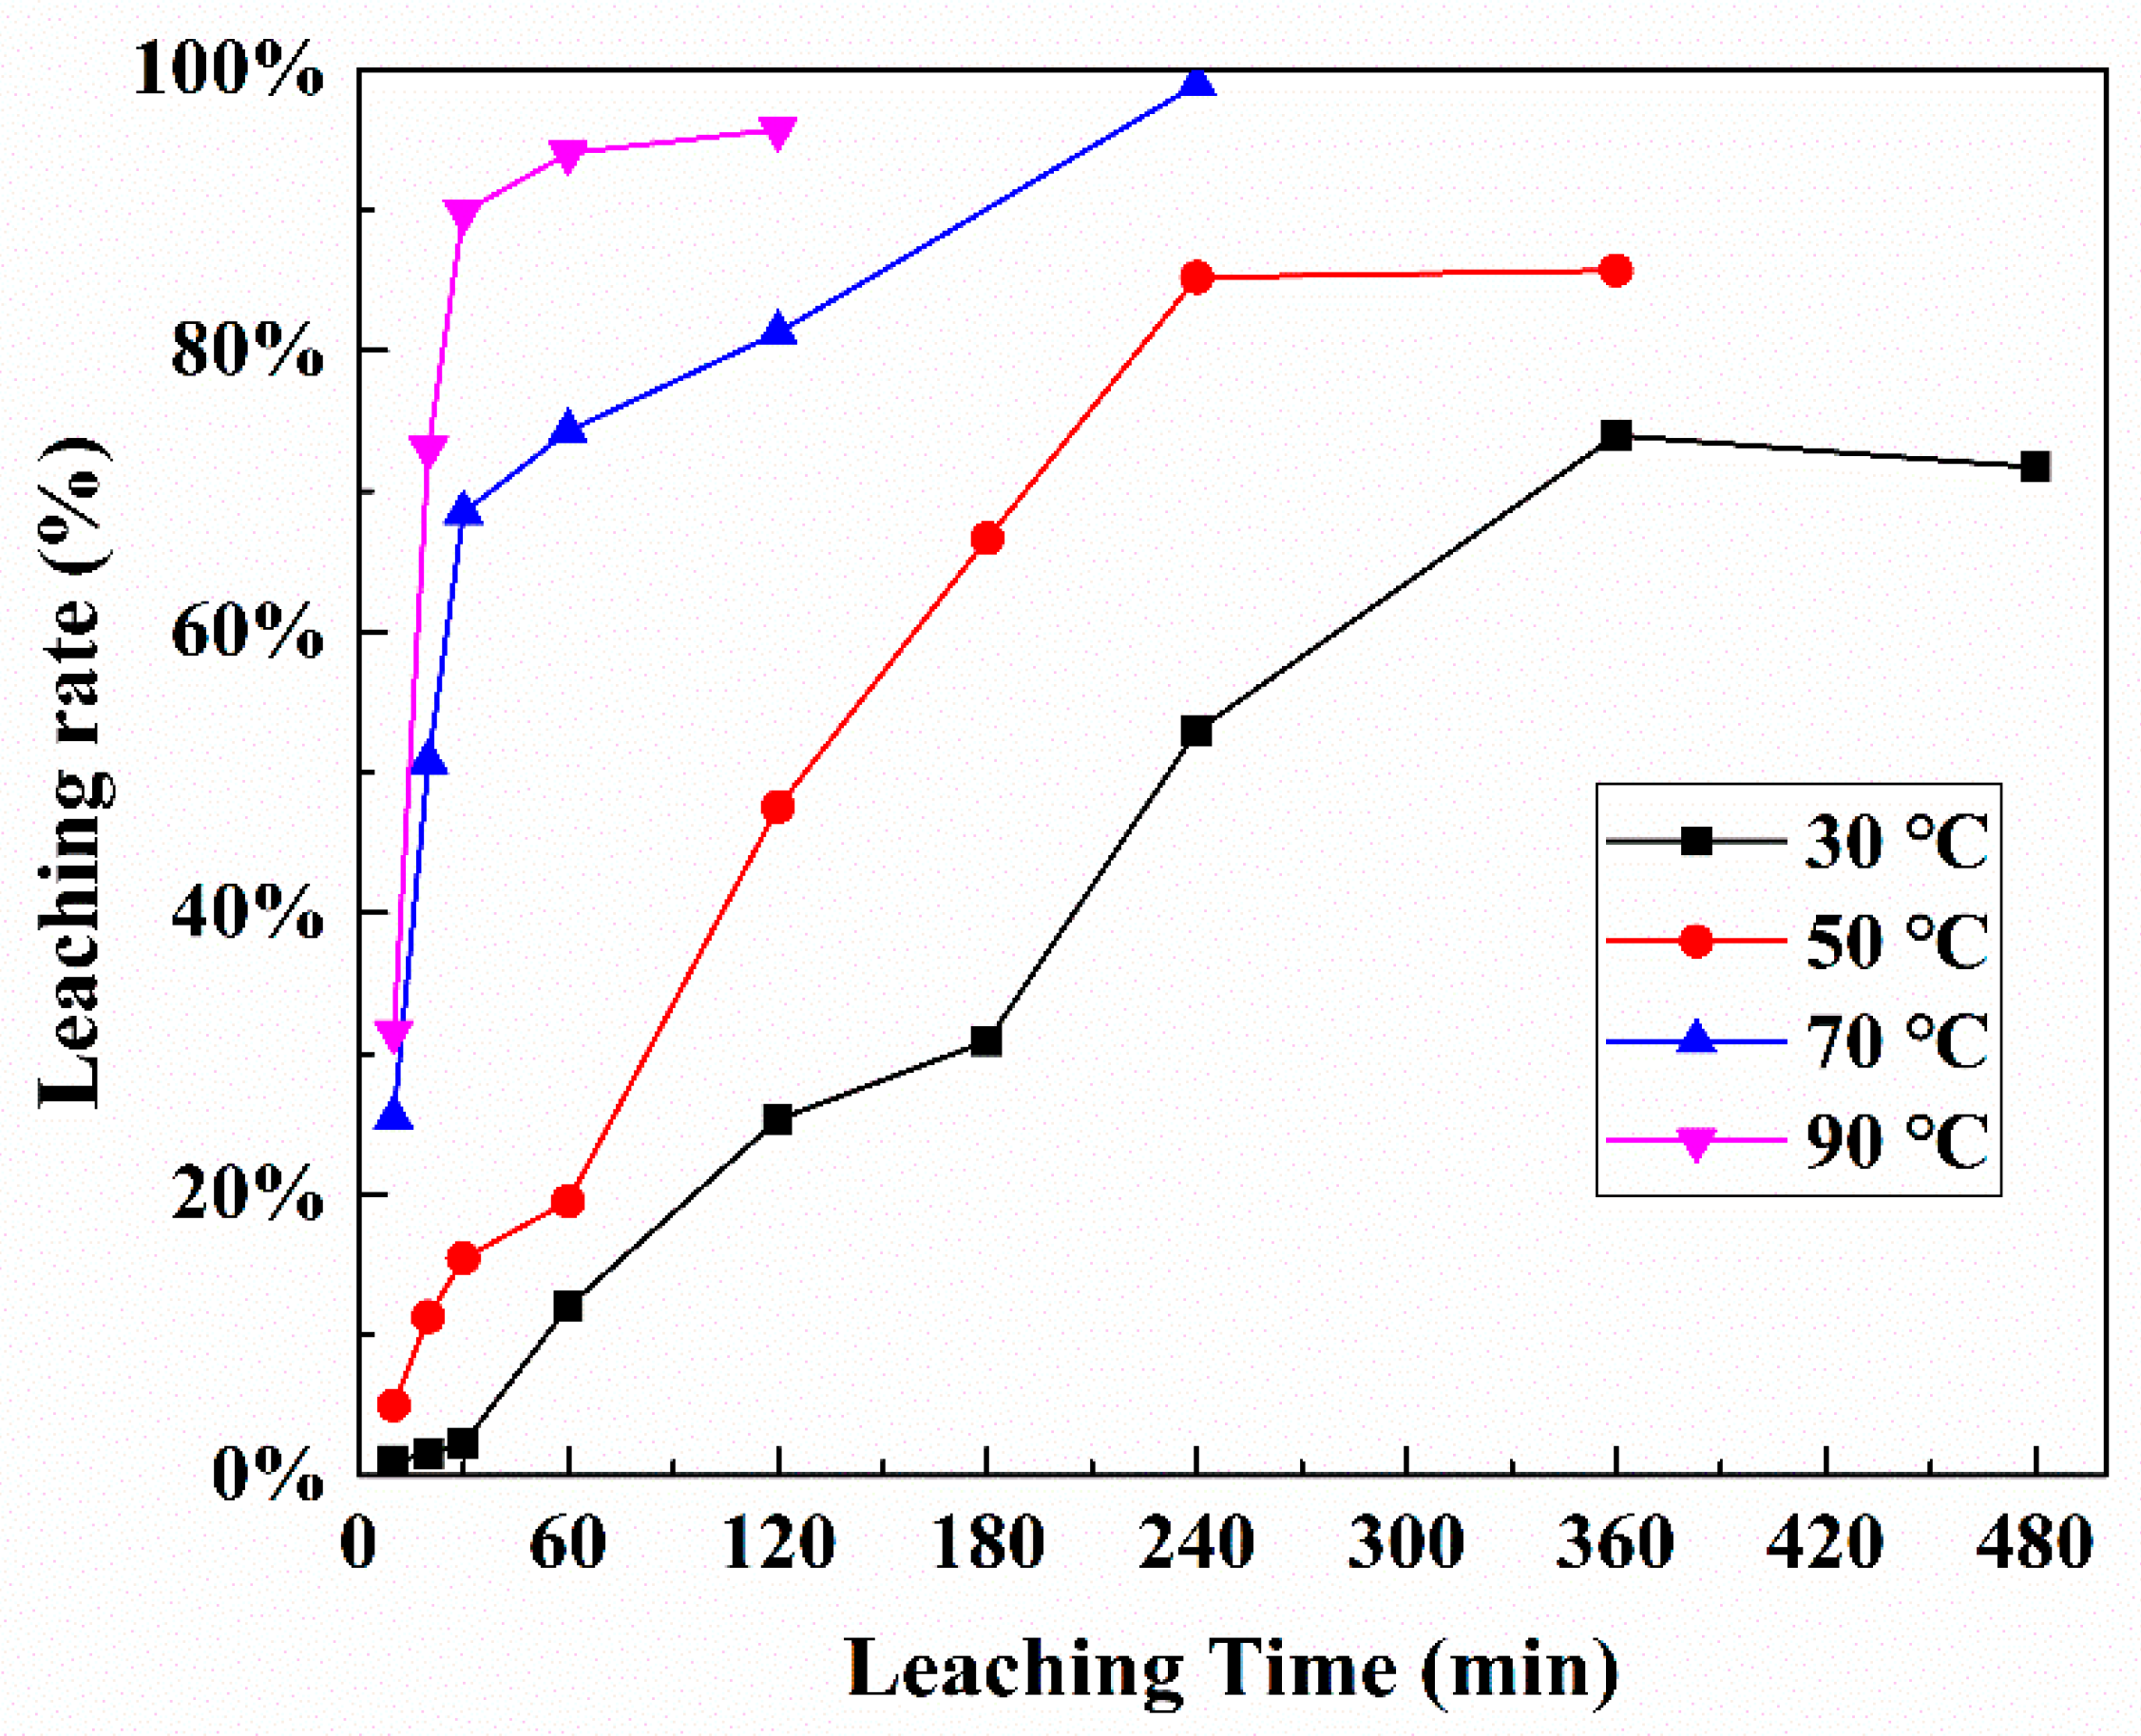
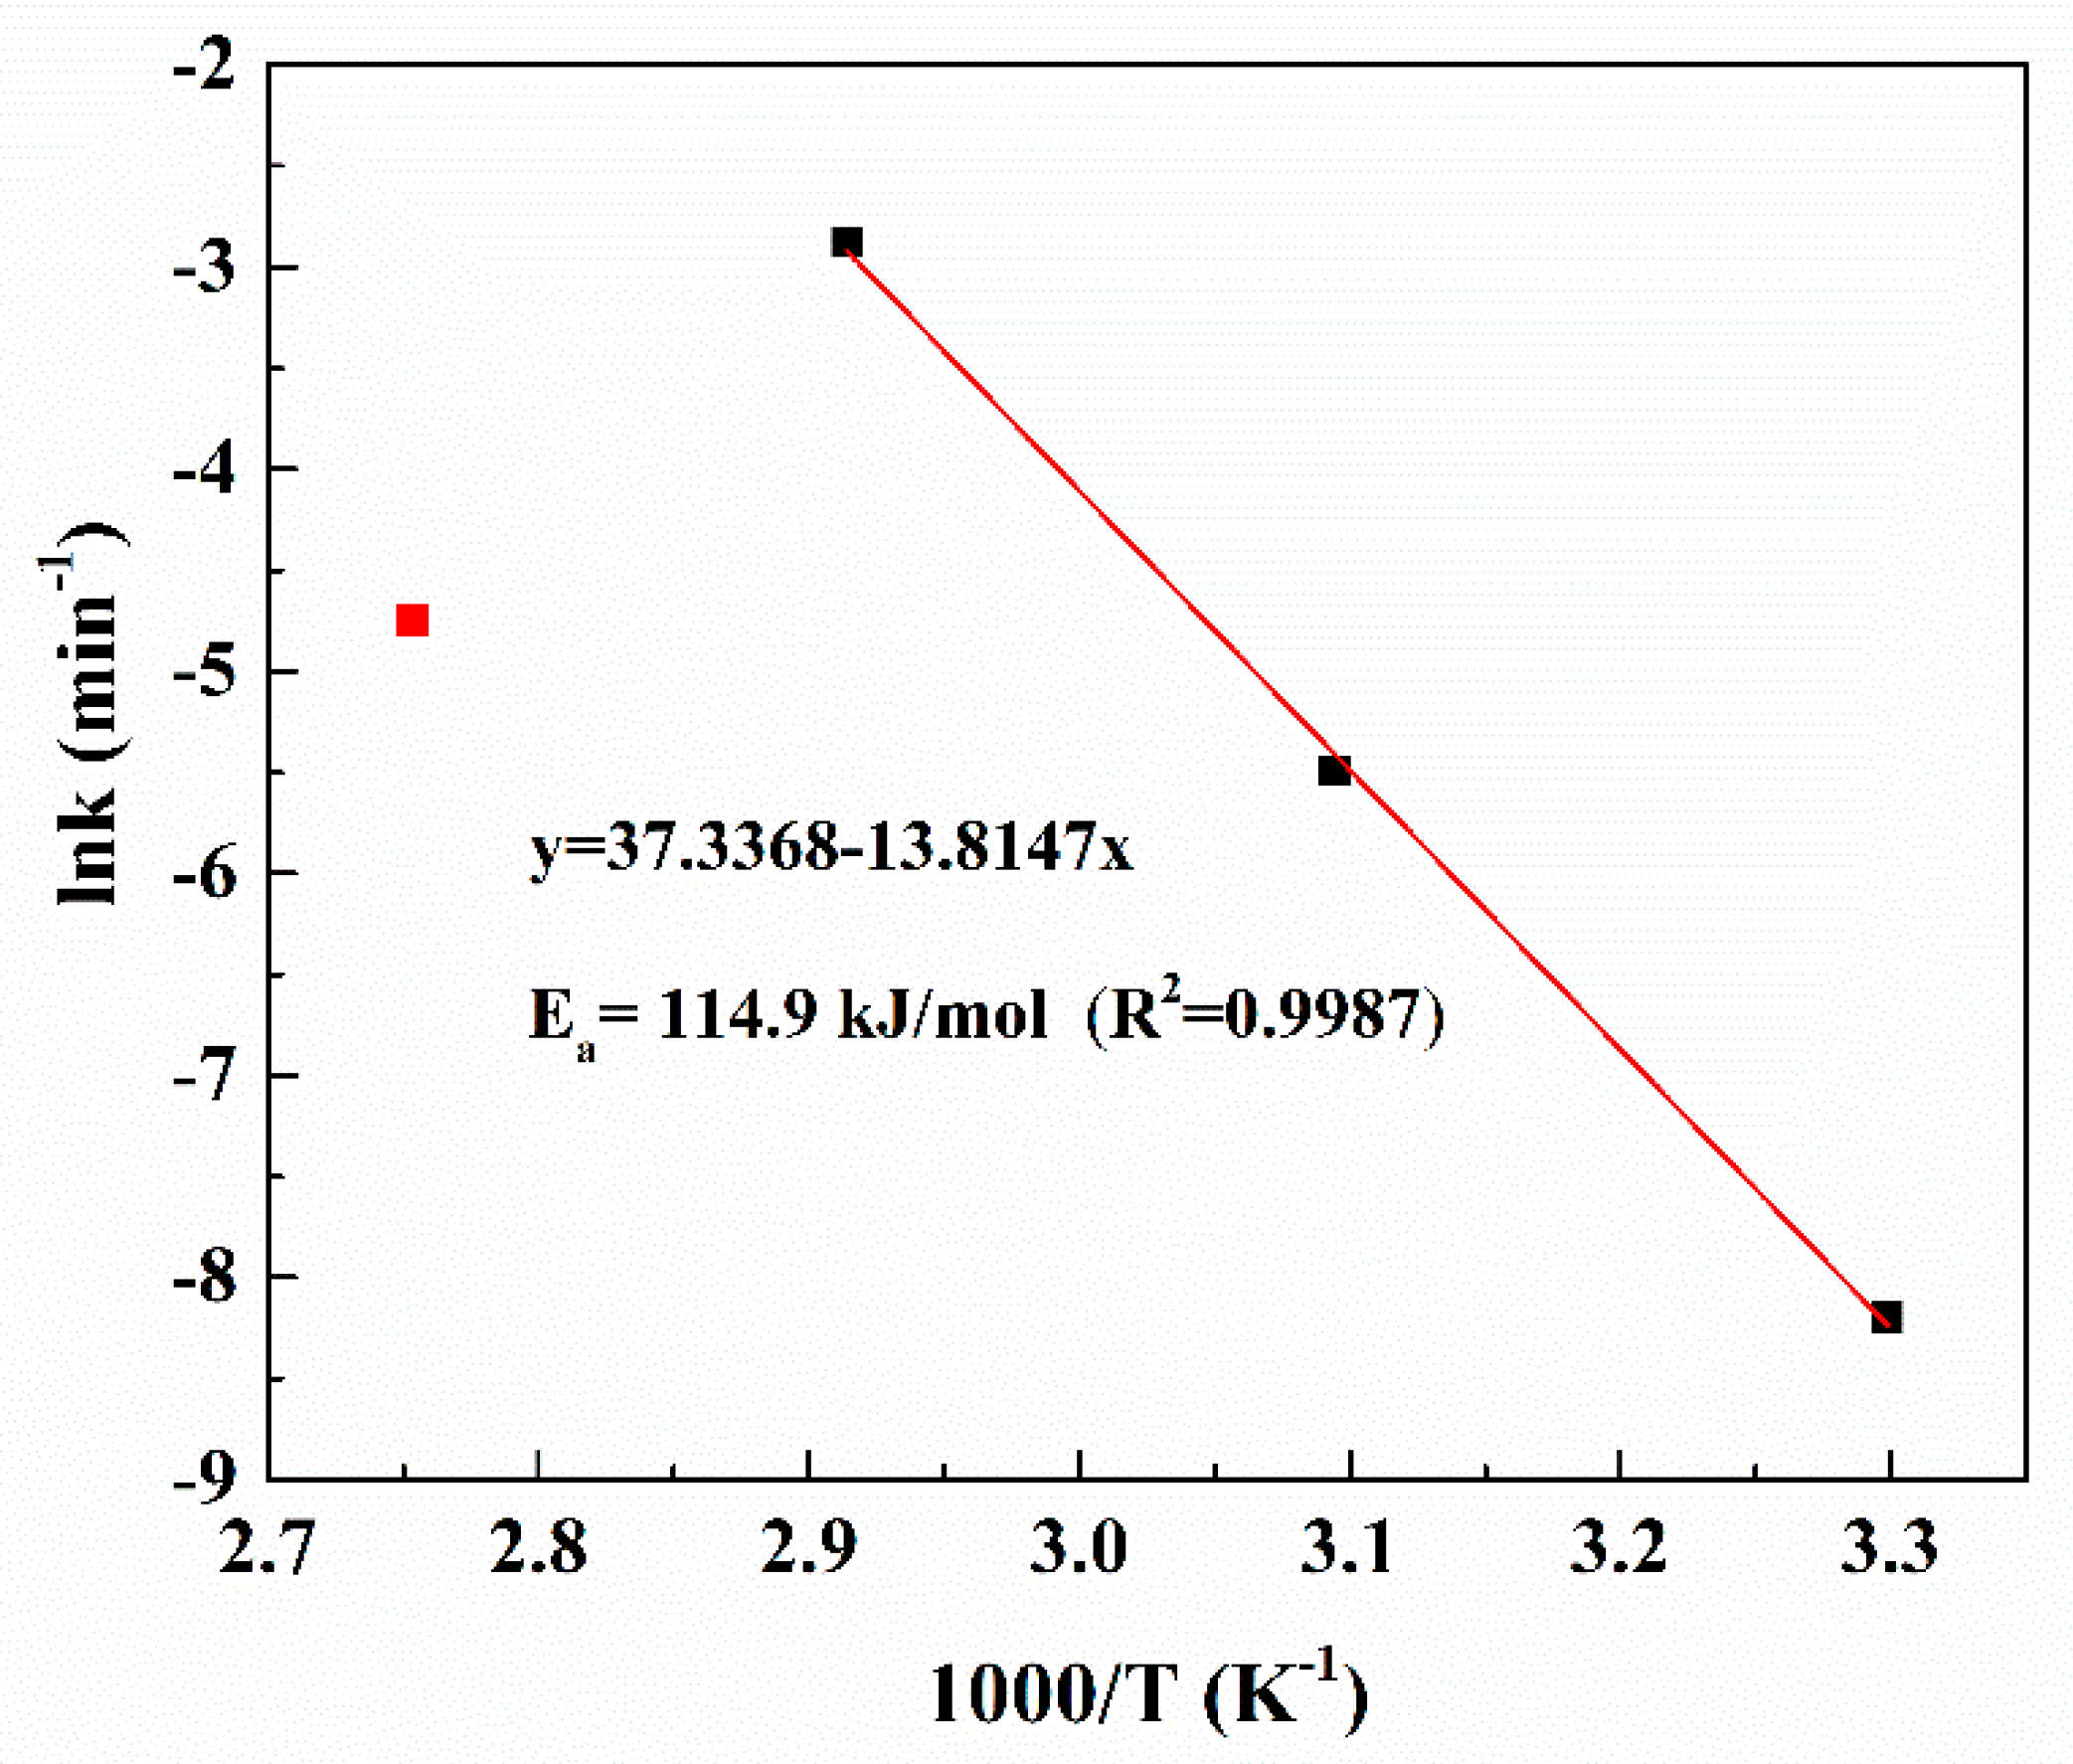
3.3. Kinetics Analysis of Platinum Leaching

Kinetics analysis of Pt leaching was investigated at different temperatures (30–90 °C) for different times (10–480 min). The leaching conditions were as follows: HCl 1.0 mol/L, NaCl 5.0 mol/L, S/L ratio of 1:5, 10% H2O2: spent catalysts 0.6 mL/g. The results are shown in Figure 8.
Leaching Pt from spent petroleum catalysts is a solid–liquid heterogeneous reaction. The shrinking-core model and Avrami equation have been always applied to describe the leaching kinetics [25,26]. However, Pt leaching data showed that it did not fit various shrinking-core models (Figure 8, Figures S4 and S5 in Supplementary). The dissolution of Pt can be considered as the reverse behavior of its crystallization. Therefore, Pt the leaching kinetic is explained by Avrami equation:
ln[−ln(1−x)] = lnk + n lnt
where x is leaching rate, k is the reaction rate constant (min−1), n is a suitable parameter, and t is the leaching time (min). The plot of ln[−ln(1−x)] versus lnt at different temperatures is shown in Figure 9. The plot shows good linear relationships with R2 values all larger than 0.95 (Table 3). It indicates that leaching data fit well to the Avrami equation. Significantly, it can be found that the value for lnk at 90 °C is lower than that at 70 °C. The leaching efficiency of Pt decreases at 90 °C, which can be attributed to the decomposition of H2O2 when the leaching temperature is higher than 70 °C.
Therefore, in the range of 30–70 °C, the relationship between the reaction rate constant and the temperature can be described by the Arrhenius equation:
K = Ae−Ea/RT
where A is the pre-exponential factor, k (min−1) is the reaction rate constant, Ea (kJ/mol) is the apparent activation energy, R (8.314 J/K/mol) is the gas constant, and T (K) is the absolute temperature. The activation energy is usually calculated by the linear form of the Arrhenius equation:
lnk = lnA − Ea/RT
By plotting lnk versus 1000/T in Figure 10, the apparent activation energy for the leaching of Pt was 114.9 kJ/mol in the temperature range of 303.15–343.15 K. The relatively high values of Ea indicate that the rate-controlling step of this leaching process is surface chemical reactions.

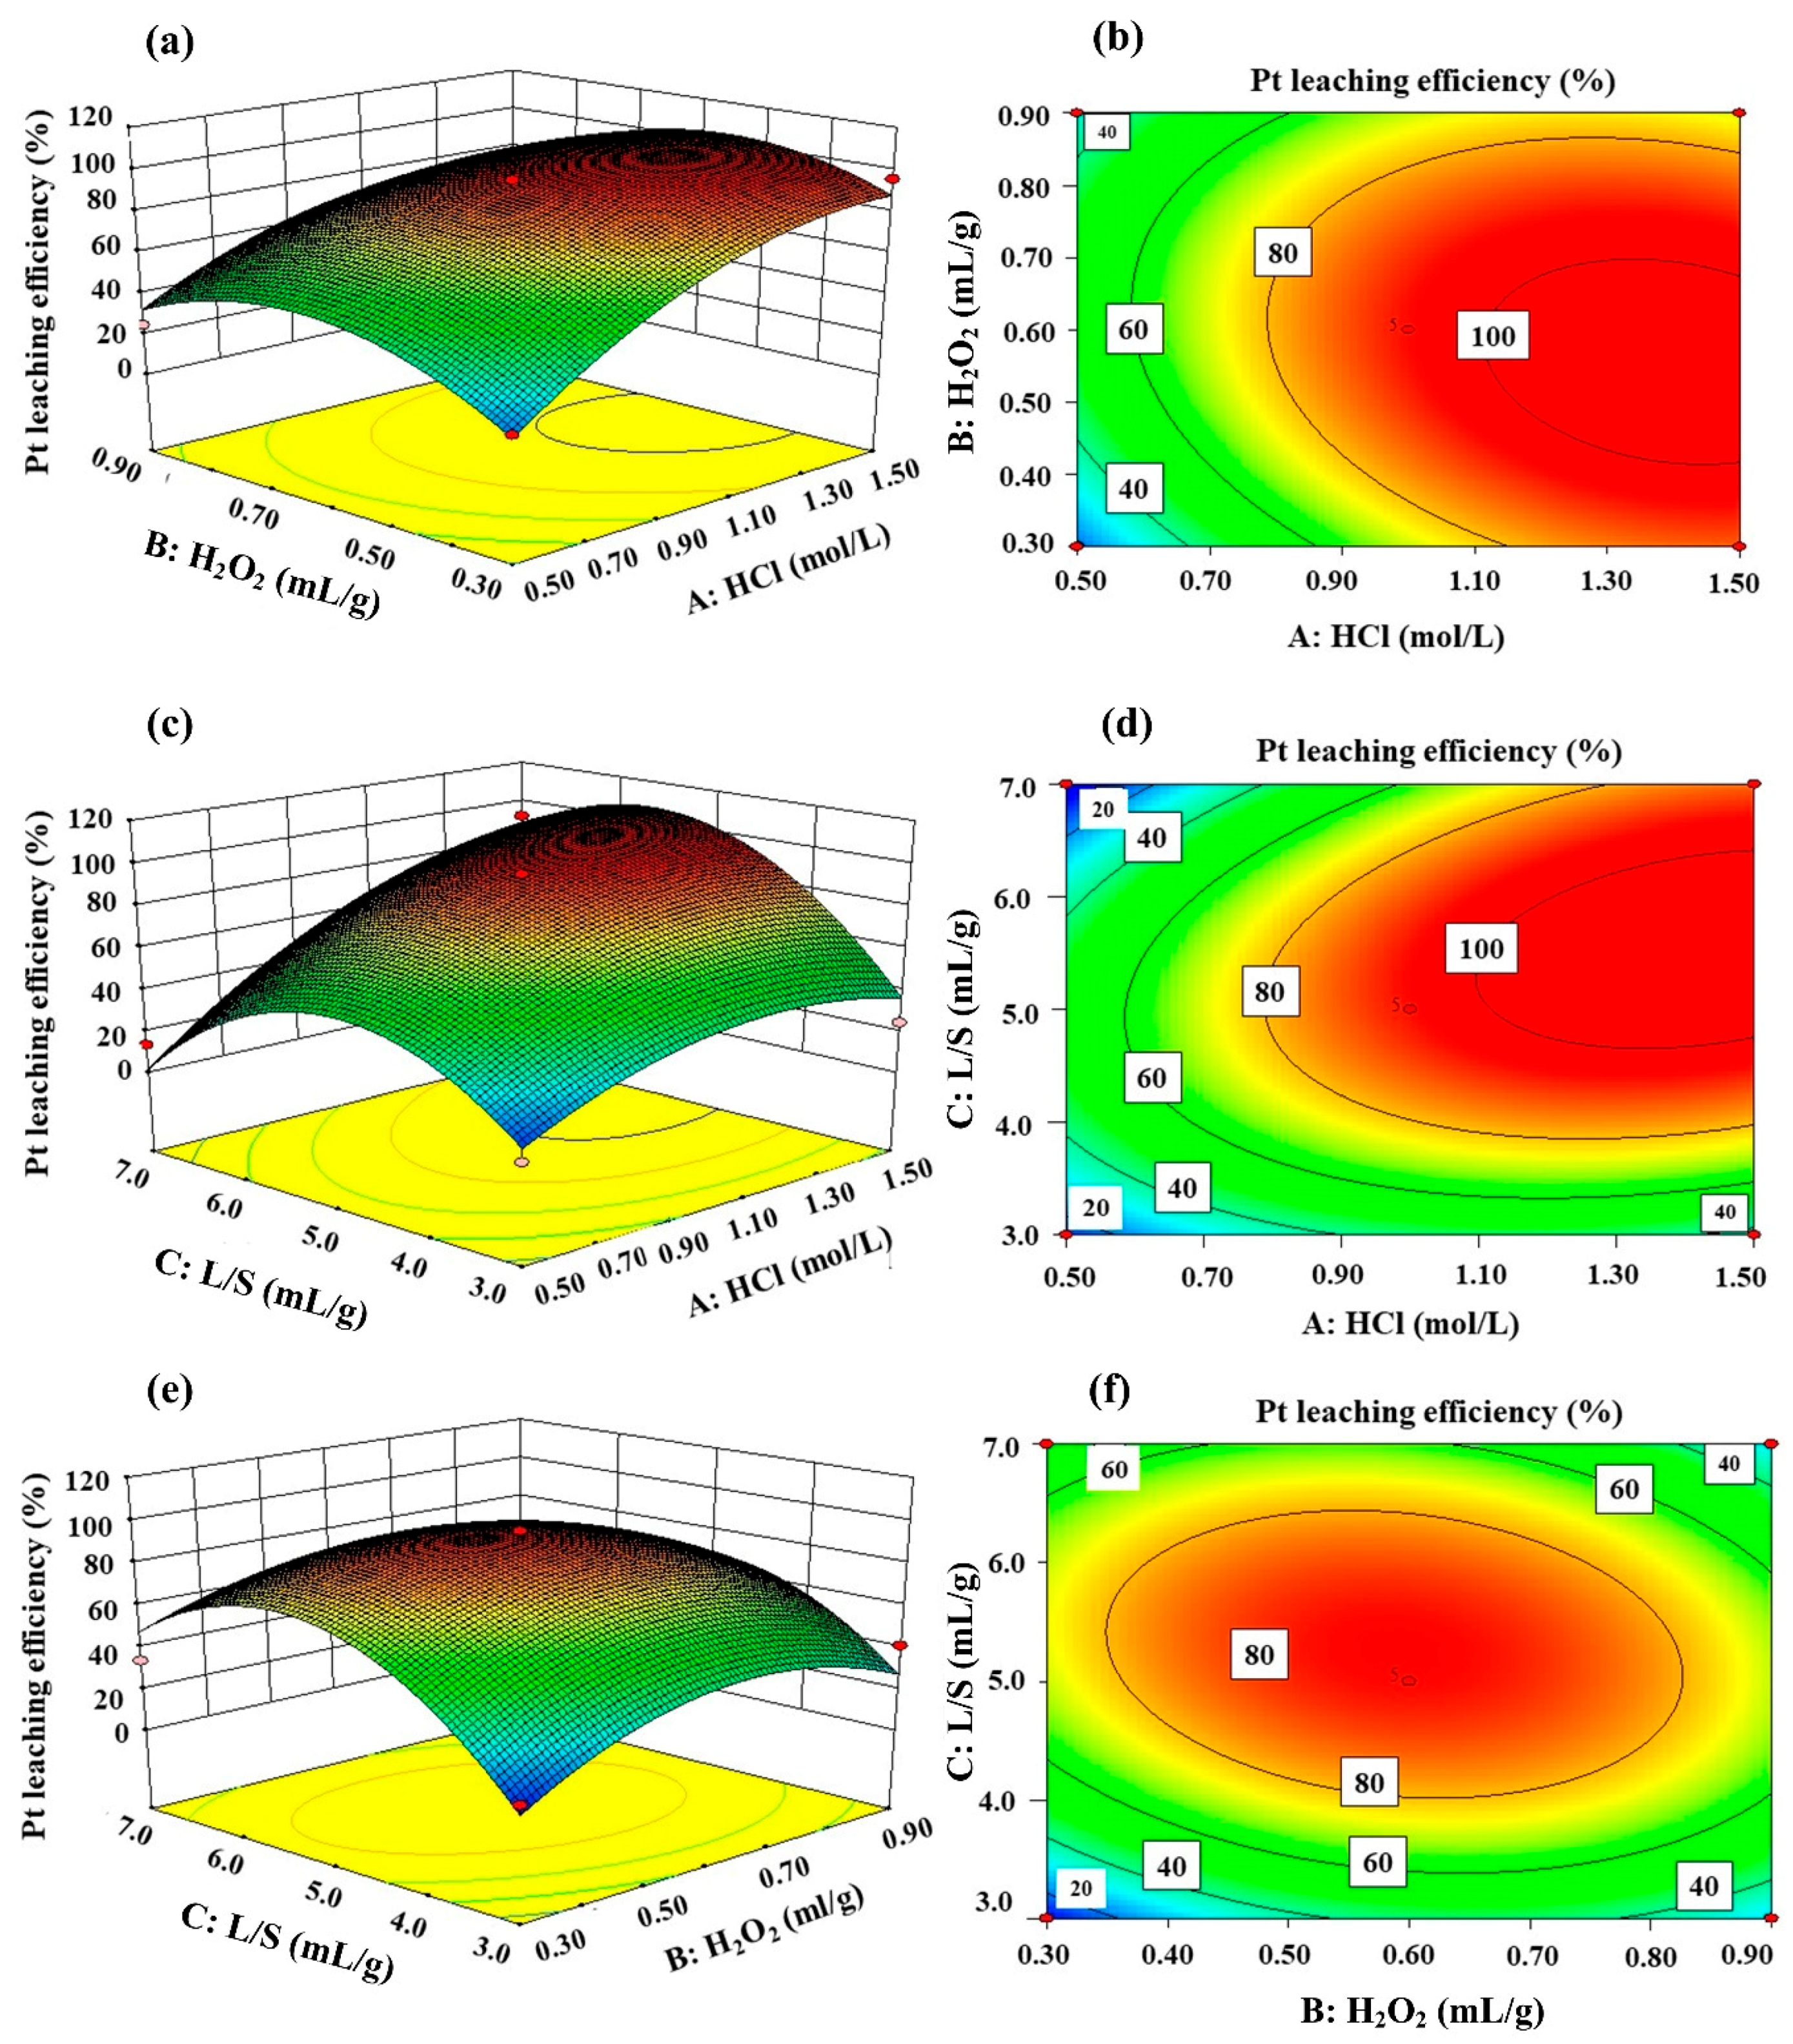
3.4. Optimization Design by Using Response Surface Methodology

In order to investigate the interactive effects of parameters on the leaching of Pt, response surface methodology (RSM) was employed for the optimization the effects of concentration of HCl, dosage of H2O2, and L/S ratio on Pt leaching. The design of experiments was conducted in the RSM design called Box-Behnken Design (BBD) by Design-Expert software (version 8.0.6, Stat-Ease, Inc., Minneapolis, MN, USA). The leaching rate of Pt was chosen as the response of these factors. Table 4 shows the coded levels and ranges of the operating variables. Coded values for the factors were used to facilitate the regression with +1 as the maximum level and −1 as the minimum level. Altogether, 17 experimental combinations are shown in Table 5, consisting of eight fractional factorials (2k), six axial runs (2k), and three replicates designed at the center point, while k was the number of factors.
The response values were recorded from the results of leaching experiments, which vary from 7.4% to 95.7%. The analysis of ANOVA is given in Table 6, indicating that Pt leaching-rate response surface quadratic model was significant at an F value of 17.50 and a P value of 0.0005. F value for lack of fit was significant when the F value and p-value were 1137.16 and <0.0001, respectively. An adequate precision ratio of 10.620 (>4) indicated an adequate signal-to-noise ratio and indicated that this model can be used to navigate the design space [27]. The R2 value of 0.9574 showed that 95.7% of the variations that occurred for Pt leaching were explained by the proposed model. The close values of R2 (0.9574) and adjusted R2 (0.9027) indicated the proposed model was adequate for predicting Pt leaching efficiency.
The impacts of HCl concentration (0.0005 of p-value) and L/S (0.0551 of p-value) were greater than that of 10% H2O2/spent catalysts (0.8332 of p-value). The quadratic polynomial equation in terms of coded values to predict Pt leaching efficiency are presented in equation (6), where y is the response factor of Pt leaching. The equation shows that the linear factors of A and C and the interaction AC had positive influences on the response, whereas negative coefficients indicated unfavorable effects on Pt leaching efficiency.
Y = 94.68 + 26.94A − 0.89B + 9.32C − 8.04AB + 15.48AC − 9.85BC − 17.91A2 − 24.63B2 − 42.41C2
The interaction effects of two factors on Pt leaching rate were illustrated through 3D response surface 2D contour plots, as shown in Figure 11. Pt leaching rate was more sensitive to HCl concentration and liquid/solid ratio than H2O2 dosage. The leaching rate of Pt increased with HCl concentration. As shown in Figure 11b, when B and C fixed at 0.60 mL/g and 5 mL/g, respectively, increasing A from 0.5 to 1.5 mol/L, the leaching rate of Pt increased from 50.1% to 100%. Pt leaching rate first increased and decreased afterwards with the increasing of the liquid/solid ratio, as shown in Figure 11d. However, the dosage of H2O2 ranging from 0.3 to 0.9 mL/g hardly influenced the leaching efficiency of Pt, as shown in Figure 11e.
Numerical optimization was conducted with the maximum goal of Pt leaching rate, minimum goal of L/S, and lower consumption of reagents. The best leaching efficiency of Pt was 100% under the conditions of 1.45 mol/L, 10% H2O2/spent catalysts of 0.66 mL/g, and L/S of 4.85:1. Based on the above results, a test was carried out under the optimal conditions. The leaching rate of Pt was 98.1%, which agreed with the prediction.

3.5. Recovery of Platinum from Leaching Solution

Pt was dissolved in the solution by HCl–NaCl–H2O2 leaching. After filtration, it was reduced as metallic Pt particles by iron powder. The effects of the HCl concentration and S/L ratio on the consumption of reductant were investigated at 90 °C, and the results are shown in Figure 12. During the reduction process, the key problem was to determine the reaction end point. By adding 5.0 mL of 4.0 mol/L HCl, 3.0 mL of 0.4 mol/L SnCl2, and 5.0 mL of ethyl acetate into 5.0 mL of the leaching solution in turn, the result is shown in Figure S6 with different usage of Fe. If the solution contains any [PtCln]2−n (n = 1–4), it will be extracted and enters into organic phase (ethyl acetate). The color in ethyl acetate phase will change from yellow-orange to colorless once the reduction reaction is over. Hence, we added the iron powder slowly in the Pt leaching solution and checked the end point of reduction reaction in time until the ethyl acetate phase was colorless. The concentration of Pt remaining in leaching solution varied from 0.45 mg/L to 1.03 mg/L, indicating that the recovery rates of Pt were over 99.5%.
As we can see from Figure 12, the initial HCl concentration and S/L ratio affected the usage of Fe significantly. The volume of leaching solution and concentration of Pt was shown in Table S3. According to the stoichiometric molar ratio of Pt and Fe (Pt:Fe = 1:2), the stoichiometric amount of iron needed to reduce platinum was about 0.07 g. The consumption of Fe was found to increase with increasing HCl concentration, which was more obvious when it was below 4.0 mol/L. In fact, most reductant reacts with HCl, and higher HCl concentration will consume more iron powder. The usage of Fe increased proportionally with the increasing S/L ratio. For example, the used Fe was about 20 times more than stoichiometric amount of iron needed when the S/L of 1:5, HCl concentration of 1.0 mol/L, and its consumption was over 100 times when the S/L of 1:20, concentration of 6.0 mol/L. This is in accordance with the previous results since higher S/L ratio means more HCl in the solution. To reduce the consumption of reducing agent in recovery process, 1.0 mol/L HCl, 5.0 mol/L NaCl, and S/L ratio of 1:5 were selected as the optimal lixivium and S/L ratio, respectively. The conditions were consistent with the leaching experiments.
The recovered Pt was analyzed by SEM and EDS, as shown in Figure 13. The SEM image clearly shows that the samples were irregular particles (about 10 μm). The EDS result indicates the main component of the samples was metallic Pt, which accounts for over 93% of the total weight. Impurities, such as Al and O elements, were detected in the particles because of the absorption of little leaching solution.

4. Conclusions

Recovery of Pt from spent petroleum catalysts was investigated. The main parameters affecting the Pt chloride leaching were systematically assessed, aiming to achieve a satisfactory recovery rate of Pt with minimum reagent consumption and environmental pollution.
Calcination pretreatment not only removed the coke and organics, but also decomposed PtO2 when the temperature was over 600 °C, and enhanced the leaching efficiency of Pt. The grain growth of Pt at 1000 °C decreased its chemical reactivity. Therefore, the optimum calcination temperature was 800 °C. Pt leaching rate was increased steadily with the increasing leaching temperature and reached 95.72% at 90 °C (other conditions being 1.0 mol/L HCl, 5.0 mol/L NaCl, S/L of 1:5, 10% H2O2: spent catalysts of 0.6 mL/g). When 10% H2O2: spent catalysts was 0.6 mL/g, the dosage of H2O2 was optimal since the acidity decreased with H2O2 addition. Pt leaching rate increased with S/L increasing when the concentration of H+ was ≥4.0 mol/L, while decreased in low acidity (<4.0 mol/L). The dissolution of supports was only 9.3% when leached in 1.0 mol/L HCl and 5.0 mol/L NaCl with L/S of 5 mL/g.
The operating variables on platinum leaching efficiency were optimized by employing a response surface methodology. Pt leaching efficiency was over 98% under the optimized conditions: HCl of 1.45 mol/L, NaCl of 4.55 mol/L, 10% H2O2/spent catalysts of 0.66 mL/g, and L/S of 4.85:1. Meanwhile, HCl concentration had the greatest impact on the leaching efficiency as compared to the H2O2 concentration and L/S ratio.
More than 99.5% of Pt was reduced from leaching solution by iron powder. The consumption of iron powder increased with both higher acidity and L/S ratio. The leaching kinetic of Pt can be explained by the Avrami equation. The activation energy for leaching Pt was 114.9 kJ/mol and the process was controlled by the chemical reaction.

Supplementary Materials

The following are available online at https://www.mdpi.com/2075-4701/9/3/354/s1, Figure S1: The DTG curve of spent petrochemical catalysts; Figure S2: Color changes of spent catalysts at different calcination temperature; Figure S3: The relationship between Gibbs free energy of the decomposition of PtO2 and temperature; Figure S4: Plots of 1 − (1 − x)1/3 vs. time under different leaching temperatures; Figure S5: Plots of 1 − 3(1 − x)2/3 + 2(1 − x) vs. time under different leaching temperatures; Figure S6: The color changes in ethyl acetate phase with different usage of Fe. Table S1: The Gibbs free energy of the decomposition of PtO2; Table S2: The XRF analysis of spent catalysts (before calcination) in form of oxides; Table S3: The volume of leaching solution and concentration of Pt.

Author Contributions

Conceptualization, S.Z. and Y.D.; methodology, H.Z.; validation J.L. and B.L.; formal analysis, C.E.; investigation, Y.D.; resources, Z.J.; data curation, Y.D.; writing—original draft preparation, Y.D.; supervision, S.Z.; funding acquisition, S.Z.

Funding

This research was sponsored by the National Natural Science Foundation of China (51472030, 51672024 and 515102014).

Conflicts of Interest

The authors declare no conflict of interest.

References

  1. Hennebel, T.; Boon, N.; Maes, S.; Lenz, M. Biotechnologies for critical raw material recovery from primary and secondary sources: R&D priorities and future perspectives. New Biotechnol. 2015, 32, 121–127. [Google Scholar]
  2. US Geological Survey (USGS). Platinum-Group Metals Statistics and Information. In Mineral Commodity Summaries; 2018. Available online: https://minerals.usgs.gov/minerals/pubs/commodity/platinum/mcs-2018-plati.pdf (accessed on 2 February 2019).
  3. Sverdrup, H.U.; Ragnarsdottir, K.V. A system dynamics model for platinum group metal supply, market price, depletion of extractable amounts, ore grade, recycling and stocks-in-use. Resour. Conserv. Recycl. 2016, 114, 130–152. [Google Scholar] [CrossRef]
  4. Graedel, T.E.; Harper, E.M.; Nassar, N.T.; Nuss, P.; Reck, B.K. Criticality of metals and metalloids. Proc. Natl. Acad. Sci. USA 2015, 112, 4257–4262. [Google Scholar] [CrossRef] [PubMed] [Green Version]
  5. Westerhoff, P.; Lee, S.; Yang, Y.; Gordon, G.W.; Hristovski, K.; Halden, R.U.; Herckes, P. Characterization, Recovery Opportunities, and Valuation of Metals in Municipal Sludges from U.S. Wastewater Treatment Plants Nationwide. Environ. Sci. Technol. 2015, 49, 9479–9488. [Google Scholar] [CrossRef] [PubMed]
  6. Ferella, F.; Innocenzi, V.; Maggiore, F. Oil refining spent catalysts: A review of possible recycling technologies. Resour. Conserv. Recycl. 2016, 108, 10–20. [Google Scholar] [CrossRef]
  7. US Geological Survey (USGS). Platinum-Group Metals Statistics and Information. In Minerals Yearbook of Platinum-Group Metals; 2015. Available online: https://minerals.usgs.gov/minerals/pubs/commodity/platinum/myb1-2015-plati.pdf (accessed on 2 February 2019).
  8. Marafi, M.; Stanislaus, A. Spent catalyst waste management: A review: Part I—Developments in hydro-processing catalyst waste reduction and use. Resour. Conserv. Recycl. 2008, 52, 859–873. [Google Scholar] [CrossRef]
  9. Akcil, A.; Vegliò, F.; Ferella, F.; Okudan, M.D.; Tuncuk, A. A review of metal recovery from spent petroleum catalysts and ash. Waste Manag. 2015, 45, 420–433. [Google Scholar] [CrossRef]
  10. Mahmoud, M.H.H. Leaching platinum-group metals in a sulfuric acid/chloride solution. JOM 2003, 55, 37–40. [Google Scholar] [CrossRef]
  11. He, X.; Li, Y.; Wu, X.; Zhao, Y.; Wang, H.; Liu, W. Study on the Process of Enrichment Platinum Group Metals by Plasma Melting Technology. Precious Met. 2016, 37, 1–5. [Google Scholar]
  12. Rumpold, R.; Antrekowitsch, J. Recycling of platinum group metals from automotive catalysts by an acidic leaching process. S. Afr. Inst. Min. Metall. Platinum 2012, 1, 695–714. [Google Scholar]
  13. Jha, M.K.; Lee, J.C.; Kim, M.S.; Jeong, J.; Kim, B.S.; Kumar, V. Hydrometallurgical Recovery/Recycling of Platinum by the Leaching of Spent Catalysts: A review. Hydrometallurgy 2013, 133, 23–32. [Google Scholar] [CrossRef]
  14. Sun, P.P.; Lee, M.S. Separation of Pt (IV) and Pd (II) from the loaded Alamine 336 by stripping. Hydrometallurgy 2011, 109, 181–184. [Google Scholar] [CrossRef]
  15. Hubicki, Z.; Wójcik, G. Studies of removal of platinum (IV) ion microquantities from the model solutions of aluminium, copper, iron, nickel and zinc chloride macroquantities on the anion exchanger Duolite S 37. J. Hazard. Mater. 2006, 136, 770–775. [Google Scholar] [CrossRef]
  16. Marinho, R.S.; Afonso, J.C.; da Cunha, J.W.S.D. Recovery of platinum from spent catalysts by liquid–liquid extraction in chloride medium. J. Hazard. Mater. 2010, 179, 488–494. [Google Scholar] [CrossRef]
  17. Paiva, A.P.; Ortet, O.; Carvalho, G.I.; Nogueira, C.A. Recovery of palladium from a spent industrial catalyst through leaching and solvent extraction. Hydrometallurgy 2017, 171, 394–401. [Google Scholar] [CrossRef]
  18. Marinho, R.S.; Da, S.C.; Afonso, J.C.; Da, C.J. Recovery of platinum, tin and indium from spent catalysts in chloride medium using strong basic anion exchange resins. J. Hazard. Mater. 2011, 192, 1155–1160. [Google Scholar] [CrossRef]
  19. Hammadi, M.Q.; Yassen, R.S.; Abid, K.N. Recovery of Platinum and Palladium from Scrap Automotive Catalytic Converters. Al-Khwarizmi Eng. J. 2017, 13, 131–141. [Google Scholar]
  20. Britton, L.A.; Markarian, G.Z. Method for platinum recovery from materials containing rhenium and platinum metals. US9702021B2, 11 July 2017. [Google Scholar]
  21. Nogueira, C.A.; Paiva, A.P.; Oliveira, P.C.; Costa, M.C.; Da, C.A. Oxidative leaching process with cupric ion in hydrochloric acid media for recovery of Pd and Rh from spent catalytic converters. J. Hazard. Mater. 2014, 278, 82–90. [Google Scholar] [CrossRef] [Green Version]
  22. Aberasturi, D.J.; Pinedo, R.; Larramendi, I.R.; Larramendi, J.I.; Rojo, T. Recovery by hydrometallurgical extraction of the platinum-group metals from car catalytic converters. Miner. Eng. 2011, 24, 505–513. [Google Scholar] [CrossRef]
  23. Kizilaslan, E.; Aktaş, S.; Şeşen, M.K. Towards environmentally safe recovery of platinum from scrap automotive catalytic converters. Tur. J. Eng. Environ. Sci. 2010, 33, 83–90. [Google Scholar]
  24. Haynes, W.M. CRC Handbook of Chemistry and Physics; CRC Press: Boca Raton, FL, USA, 2014. [Google Scholar]
  25. Li, L.; Fan, E.; Guan, Y.; Zhang, X.X.; Xue, Q.; Wei, L.; Wu, F.; Chen, R.J. Sustainable recovery of cathode materials from spent lithium-ion batteries using lactic acid leaching system. ACS Sustain. Chem. Eng. 2017, 5, 5224–5233. [Google Scholar] [CrossRef]
  26. Li, G.H.; Rao, M.J.; Jiang, T.; Huang, Q.Q.; Peng, Z.W. Leaching of limonitic laterite ore by acidic thiosulfate solution. Miner. Eng. 2011, 24, 859–863. [Google Scholar] [CrossRef]
  27. Bahrami, H.; Eslami, A.; Nabizadeh, R.; Mohseni-Bandpi, A.; Asadi, A.; Sillanpää, M. Degradation of trichloroethylene by sonophotolytic-activated persulfate processes: Optimization using response surface methodology. J. Clean. Prod. 2018, 198, 1210–1218. [Google Scholar] [CrossRef]
Figure 1. The Eh–pH diagram of Pt–Cl–H2O system at 25 °C using HSC software. (c(Pt) = 0.001 mol/L, c(Cl) = 6.0 mol/L).
Metals 09 00354 g001
Figure 2. The process of platinum recycling from spent petroleum catalysts.
Metals 09 00354 g002
Figure 3. The thermogravimetric analysis (TG) and differential scanning calorimetry (DSC) curves of spent petrochemical catalysts.
Metals 09 00354 g003
Figure 4. XRD patterns of spent petrochemical catalysts before and after calcination at 600 °C, 800 °C, and 1000 °C for 2 h in air atmosphere.
Metals 09 00354 g004
Figure 5. Effect of solid/liquid (S/L) ratio and HCl concentration on (A) Pt leaching rate and (B) weight loss of spent catalysts (Calcination temperature 800 °C, 10% H2O2/spent catalysts = 0.6 mL/g, total (Cl) 6 mol/L, leaching temperature 90 °C, leaching time 2 h).
Metals 09 00354 g005
Figure 6. Leaching rates of Pt at different leaching temperature (HCl 1.0 mol/L, NaCl 5.0 mol/L, S/L = 1:5, 10% H2O2: spent catalysts = 0.6 mL/g).
Metals 09 00354 g006
Figure 7. Effect of H2O2 dosage on Pt leaching rate (HCl 1.0 mol/L, NaCl 5.0 mol/L, S/L ratio of 1:5, 90 °C for 2 h).
Metals 09 00354 g007
Figure 8. Leaching rate of Pt under different reaction temperatures and times.
Metals 09 00354 g008
Figure 9. Plots of ln(−ln(1−x)) vs. lnt at different leaching temperatures.
Metals 09 00354 g009
Figure 10. Arrhenius plot for leaching of Pt in the temperature range of 303.15–363.15 K.
Metals 09 00354 g010
Figure 11. The 3D response surface and 2D contour plots for the interaction effects on the platinum leaching rate. In (a,b), C: L/S = 5.0 mL/g; in (c,d), B: 10% H2O2/spent catalysts = 0.6 mL/g; and in (e,f), A: c(HCl) = 1.0 mol/L.
Metals 09 00354 g011
Figure 12. Effect of HCl concentration and S/L ratio on the consumption of Fe during Pt recovery at 90 °C.
Metals 09 00354 g012
Figure 13. SEM–EDS of recovered Pt particles.
Metals 09 00354 g013
Table 1. Some typical leaching of platinum group metals (PGMs) from spent catalysts.
MaterialsLeaching ConditionsRecovery RateReferences
ReagentsTemp. (°C)TimeS/L (g/mL)
Spent catalystsAqua regia7520 min1:4Pt 97%[18]
Spent auto-catalystsaqua regia1002 h1:20Pt 97.58%[19]
Super alloysH2SO4 800 g/L, 35% H2O280–9035 h1:20Pt 99.98%[20]
Spent catalytic convertersHCl 6 mol/L, Cu2+ 0.3 mol/L804 h1:20Pd 95%, Rh 86%[21]
Industrial catalystH2SO4 60%, NaCl 0.1 mol/L12510 h1:100Pt 99%[10]
Car catalytic convertersHCl 12 mol/L, H2O2 7% and H2SO4 2.0 mol/L906 h1:3Pt >95%[22]
Scrap automotive catalytic converters10 HCl (37%): 1 H2O2 (36%)802 h1:20Pt 95%[23]
Spent petroleum catalystsHCl 1.45 mol/L, NaCl 4.55 mol/L, 10% H2O2/spent catalysts of 0.66 mL/g902 h1:4.85Pt 98.1%This study
Table 2. The leaching behavior of platinum (Pt) at different calcination temperature (Leaching condition: HCl 6.0 mol/L, L/S = 10, 10% H2O2: spent catalysts = 0.6 mL/g, 90 °C, 2 h).
Temperature600 °C800 °C1000 °C
Leaching efficiency77.4%99.9%82.5%
Pt in leaching residue0.2%0.03%17.4%
Table 3. Kinetic parameters during the Pt leaching process using the Avrami model.
T/°CnlnkR2
301.43027−8.197040.97262
501.07385−5.491410.96562
700.80941−2.880150.95073
901.65294−4.750540.99106
Table 4. Experimental design for Pt leaching, and their coded and actual levels.
FactorsCoded Levels
−101
A: HCl concentration (mol/L)0.511.5
B: 10% H2O2/spent catalysts (mL/g)0.30.60.9
C: Liquid/solid ratio 357
Table 5. Factors and response values of Pt leaching.
RunFactor 1
HCl Concentration (mol/L)
Factor 2
H2O2 Dosage (mL/g)
Factor 3
Liquid/Solid (L/S)
Response
Pt Leaching Rate (%)
11.00.3313.9%
20.50.3519.8%
31.00.3733.9%
41.50.3595.7%
51.00.6593.9%
61.00.9341.1%
71.00.6594.4%
81.00.6595.1%
91.00.9721.7%
100.50.9524.7%
111.00.6594.8%
121.50.9568.5%
131.50.6792.3%
140.50.637.4%
151.00.6595.2%
160.50.6713.4%
171.50.6324.4%
Table 6. ANOVA results of reduced quadratic model for the Pt leaching efficiency.
SourceSun of SquaresdfMean SquareF Valuep Value
Model20710.349695.5647.52<0.0001
A5805.0313892.27265.93<0.0001
B6.2813.390.230.6449
C695.091123.328.430.0229
AB258.7313.310.230.6488
AC958.21158.984.030.0847
BC388.0917.050.480.5101
A21350.3012071.80141.55<0.0001
B22553.33113.570.930.3677
C27571.48157.173.910.0887
Residual920.57714.64
Lack of fit919.49334.05453.29<0.0001
Pure error1.0840.075
Cor total21630.9216

