Abstract
The quenching and partitioning (Q&P) process of lean medium Mn steels is a novel approach for producing ultra-high strength and good formable steels. First, the steel is fully austenitized, followed by quenching to a specific quenching temperature (TQ) in order to adjust an appropriate amount of initial martensite (α’initial). Subsequently, the steel is reheated to a partitioning temperature (TP) in order to ensure C-partitioning from α’initial to remaining austenite (γremain) and thus retained austenite (RA) stabilization. After isothermal holding, the steel is quenched to room temperature (RT), in order to achieve a martensitic-austenitic microstructure, where the meta-stable RA undergoes the strain-induced martensitic transformation by the so-called transformation induced plasticity (TRIP) effect. This paper systematically investigates the influence of the Q&P process on the isothermal bainitic transformation (IBT) kinetics in a 0.2C-4.5Mn-1.3Al lean medium Mn steel by means of dilatometry. Therefore, the Q&P annealing approach was precisely compared to the TRIP-aided bainitic ferrite (TBF) process, where the samples were directly quenched to the temperature of the IBT after full austenitization. The results indicated an accelerated IBT for the Q&P samples, caused by the formation of α’initial during quenching below the martensite start (MS) temperature. Furthermore, a significant influence of the annealing parameters, such as TQ and TP, was observed with regard to the transformation behavior. For further characterization, light optical microscopy (LOM) and scanning electron microscopy (SEM) were applied, showing a microstructure consisting of a martensitic-bainitic matrix with finely distributed RA islands. Saturation magnetization method (SMM) was used to determine the amount of RA, which was primarily depending on TQ. Furthermore, the hardness according to Vickers revealed a remarkable impact of the annealing parameters, such as TQ and TP, on the predicted mechanical properties.
1. Introduction
Both environmental and safety regulations force the automotive industry to the application of new steel grades [1,2]. In order to meet the challenging requirements concerning crashworthiness, formability, and reduction of CO2 emissions, “Advanced High Strength Steels” (AHSS) are currently under development [3,4,5]. By the increase of the material strength without a deterioration of ductility, the sheet thickness can be downgauged, resulting in a significant weight reduction of the body structures [1,6]. Furthermore, the combination of both high strength and ductility is of vital importance in order to manufacture complex automotive parts. Therefore, a high research effort has been put into the further development of AHSS.
The 1st generation AHSS, being already in industrial application, is represented by Dual Phase (DP), TRIP, and Complex Phase (CP) steels [6]. These steels mainly have a multiphase structure, resulting in tensile strengths up to 1200 MPa and total elongations up to 40% [7,8,9]. Typically, they are characterized by RmxA80 up to 20,000 MPa% [6]. The 2nd generation AHSS includes Twinning Induced Plasticity (TWIP), Nano-TWIP, Duplex, and Triplex steels, which are characterized by highly promising mechanical properties, especially an excellent combination of strength and ductility with RmxA80 between 40,000 and 60,000 MPa% [10]. However, due to the high alloying costs and challenging processing they are hardly used in industrial applications [11].
Currently, recent research activities focus on the development of steels belonging to the 3rd generation AHSS, including the concepts of Q&P and medium Mn steels, to fill the property gap between the 1st and 2nd generation AHSS [9,12,13,14].
The Q&P process has been proposed as a promising approach for steel grades having the microstructure consisting of a carbon-depleted martensitic matrix and retained austenitic islands [15]. In this process, the steel is fully austenitized followed by quenching to a specific temperature below the MS temperature, where the optimal amount of RA can be adjusted. Subsequent reheating and holding in the over-ageing region triggers the α’ tempering, whereby the cementite formation during this stage will be significantly postponed by the Si and/or Al additions. Therefore, C can partition to remaining γ resulting in its appropriate stabilization upon final cooling to room temperature (RT) [16,17].
The medium Mn steels typically contain between 3 and 10 wt.% Mn and their microstructure consists of an ultrafine-grained ferritic matrix (with a typical grain size below 1 µm) and approximately 30 vol.% of RA. These steel grades are characterized by an excellent combination of tensile strength and total elongation achieving the product of RmxA80 exceeding 30,000 MPa% [12,14,18].
In the present case, the concept of lean medium Mn Q&P steels combines both the approach of medium Mn steels and the Q&P process, leading to a microstructure consisting of a tempered martensitic matrix with an increased amount of RA islands. The RA can be stabilized by the combination of the C and Mn enrichment, ensuring an optimum strain-induced γ to α’ transformation (TRIP-effect). Moreover, the presence of the hard C-depleted martensitic matrix ensures the superior performance of these steels in the forming operations such as sheet cutting, bending and hole expansion, since the ability to resist high local strains is linked to the hardness gradients in the microstructure [19].
In order to predict the amount of RA depending on TQ, the constrained carbon equilibrium (CCE) model proposed by Speer et al. [20] can be applied. This simplified model allows the calculation of the C-content in γ and therefore the prediction of the amount of RA under three main conditions: (1) All of the C partitions to γ and the partitioning kinetics are ignored, meaning the partitioning is already complete; (2) no phase boundary movement during the partitioning process; and (3) no competing reactions like carbide or αB formation take place during the Q&P process [20].
However, the decomposition from γ to αB during the C-partitioning step has been observed in some instances [21,22,23]. Clarke et al. [24] showed that the formation of carbide-free bainite (αB) during the partitioning process led to a reduced RA fraction in the Q&P samples compared to the amounts predicted by the CCE-model. However, in some cases, the formation of αB can contribute to the stabilization of γ by its C-enrichment.
Therefore, in the present paper, the transformation behavior of a 0.2-4.5Mn-1.3Al steel was studied for both Q&P and TBF processes in order to evaluate the influence of the presence of α’initial on IBT. Several annealing parameters were varied (TQ, TP), in order to examine their influence on the transformation kinetics and thus the volume fraction of the individual constituents, i.e., α’, αB, and RA, in the final microstructure.
2. Materials and Methods
Table 1 shows the chemical composition of the investigated steel grade in wt.%. The steel was melted in a medium frequency induction furnace and cast under laboratory conditions in an ingot of 80 kg. First the material was hot rolled to a thickness of 4 mm, followed by tempering in a batch-annealing-like furnace at a temperature of 550 °C for 16 h. Finally, the material was cold rolled to a thickness of 1 mm.

Table 1.
Chemical composition of the investigated steel Fe-C-Mn-Al in wt.%.
The transformation behavior and the influence of the different annealing parameters were investigated by means of dilatometry using a Bähr 805 A/D dilatometer. Therefore, specimens with dimensions of 10 × 4 × 1 mm³ were produced by wire-electrical discharge machining. Figure 1 shows the applied time-temperature schedules for the Q&P (a) and the TBF (b) heat-treatments, adapted to suit an industrially feasible continuous annealing line. All samples were fully austenitized at a Tan of 900 °C for 120 s (tan) with a heating rate HR1 of 10 K/s. For the Q&P process, the austenitization was followed by quenching to various TQ in the range of 130 °C–330 °C with a 20 °C step using a cooling rate CR1 of 50 K/s. The TQ was held for 10s and subsequently the samples were reheated with 20 K/s (HR2) to a certain TP, which was varied between 350, 400, and 450 °C and held for 600 s (tp), respectively. In contrast, the TBF samples were directly cooled to a TB of 350, 400, or 450 °C and held for 600 s (tB). Finally, both Q&P and TBF samples were cooled to RT with a cooling rate CR2 of 50 K/s.
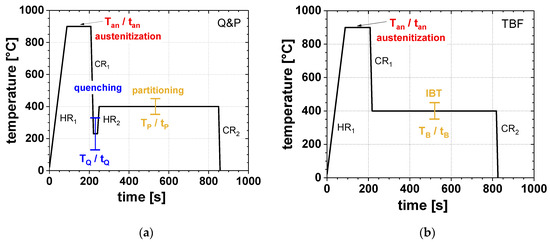
Figure 1.
Time-temperature regimes used for (a) the quenching and partitioning (Q&P) and (b) the transformation induced plasticity (TRIP) aided bainitic ferrite (TBF) heat-treatments.
The microstructure was characterized by means of light optical microscopy (LOM) using LePera etching [25]. Furthermore, the samples were electrochemically polished for the SEM investigations. Vickers hardness testing (HV1) was performed on polished samples using an Emco Test DuraScan 20 device. The volume fraction of RA was determined by the use of SMM [26]. Furthermore, the RA content depending on the TQ was calculated using the CCE-model proposed by Speer et al. [20]. Therefore, first the volume fraction of α’ formed during quenching to TQ was determined by the Koistinen-Marburger (KM) equation, which can be used to predict the γ to α’ transformation rate and is given by [27]:
fM = 1 − e−0.011(MS − TQ)
Here, fM is the fraction of α’ transformed during quenching from the γ-region to the TQ. MS is the martensite start temperature, which was calculated according to Mahieu et al. [28]:
MS = 539 − 423C − 30.4Mn − 7.5Si + 30Al
Figure 2a displays the phase fractions of α’ and γ determined using the CCE-model and Figure 2b represents the related Q&P heat-treatment. Both, KM- and MS-formula are applied twice in the CCE-model. First, the MS temperature of the initial γ is calculated, followed by the determination of the α’ fraction formed during quenching to a certain TQ using the KM equation (blue line). The orange curve represents the remaining initial γ after quenching. Subsequently, the MS temperature of the C-enriched γ after the partitioning step is calculated assuming full C-partitioning from α’. Given that, using the KM equation once again, the amount of α’ formed upon final cooling to RT is calculated (red line). The resulting RA fraction as a function of the TQ is indicated in green. It is evident that the largest fraction of γ can be retained at that TQ where no fresh α’ is formed upon final cooling. However, it must be taken into account that this applied CCE-model does not consider a phase transformation from γ to αB during isothermal holding at TP. Since this contribution focusses on the investigation of the bainitic transformation kinetics during Q&P processing, it can be expected that the amount of retained austenite stabilized to RT will be smaller, compared to the calculated one.
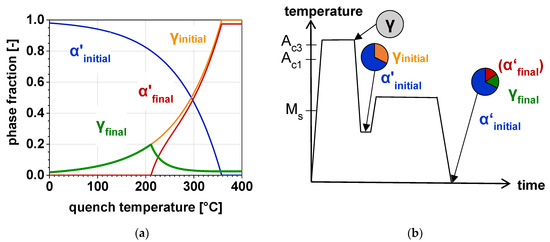
Figure 2.
(a) Calculated phase fractions of martensite (α’) and austenite (γ) depending on the TQ and (b) the related Q&P heat-treatment with the schematic microstructural evolution; the phase fractions are indicated for the initial quench to TQ and for the final quench to room temperature (RT).
3. Results
3.1. Transformation Behavior
The annealing parameters, especially TQ and TP, remarkably influenced the transformation behavior of the investigated steel. Figure 3 shows the influence of the TP-variation in a range of 350–450 °C on the dilatometric curves using the Q&P heat-treatment with a TQ of 310 °C (Figure 3a) compared to the TBF cycles (Figure 3b). After full austenitization at 900 °C, the dilatometric samples were cooled to TQ or TB, depending on the applied heat-treatment. In the case of the Q&P regime, α’initial was formed during quenching to TQ, since the MS temperature was approximately 325 °C (Figure 3a). Although the CCE-model, describing the microstructural development during Q&P processing, assumes full C-partitioning from γ to α’ without the occurrence of any phase transformations during isothermal holding at TP, in the present case after reheating to TP, γ partially transformed to αB during isothermal holding, accompanied by a linear expansion visible in the dilatometric curves. Further, it is obvious that the amount of αB described by the volume expansion during isothermal holding decreased with increasing TP. As a result, TP directly influenced the formation of α’final during cooling to RT. For the Q&P sample heat-treated at a TP of 350 °C, no α’final was formed, whereas at an increased TP of 400 and 450 °C, a γ → α’final transformation was observed by a deviation from the linearity of the dilatometric curves during final cooling. In contrast, for the TBF samples, the largest amount of αB was formed at a TB of 400 °C, whereas its smallest amount was contemplated at 450 °C. The correlation between the amount of αB and α’final was proven for the TBF regime as well. Thus, the largest amount of α’final was transformed at a TB of 450 °C, whereas the lowest α’ formation was obtained at 400 °C.
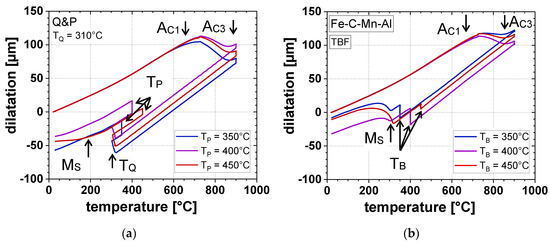
Figure 3.
Dilatometric curves at different TP (TB) of (a) Q&P heat-treatment (TQ = 310 °C) and (b) TBF heat-treatment.
The influence of TP or TB on the αB formation during isothermal holding for the Q&P (TQ = 310 °C) and TBF process is displayed in detail in Figure 4. For both the Q&P and TBF regimes, an increasing TP and TB led to accelerated IBT kinetics. However, with an increase of TP and TB, the αB formation saturated already after shorter times. In the case of the Q&P samples, this behavior led to the largest amount of αB at a TP of 350 °C, whereas with increasing TP, lower αB fractions were formed during isothermal holding. On the one hand, the IBT in the TBF regime was remarkably slower compared to that of the Q&P process. On the other hand, the IBT did not saturate at a TB of 350 °C and 400 °C, even after a tB of 600 s.
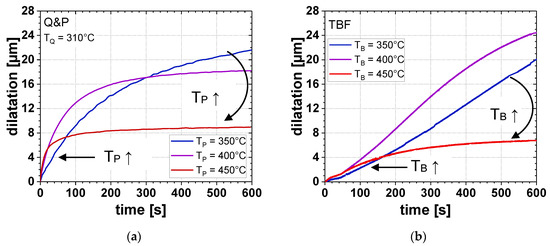
Figure 4.
Dilatation due to αB formation as a function of isothermal holding time at different TP (TB) for (a) Q&P steel (TQ = 310 °C) and (b) TBF steel.
Furthermore, an influence of TQ on the transformation behavior could be determined by means of dilatometry (Figure 5). With increasing TQ, the amount of α’initial decreased, whereas the amount of αB formed during isothermal holding at TP increased. However, too high TQ led to the formation of α’final during final cooling to RT, especially at a TP of 450 °C.
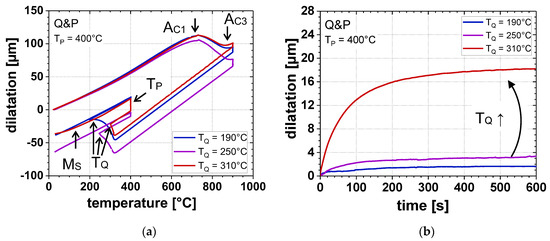
Figure 5.
(a) Dilatometric curves at different TQ (TP = 400 °C) and (b) dilatation due to αB formation as a function of isothermal holding time at different TQ (TP = 400 °C).
3.2. Microstructure
The annealing parameters, especially TQ, significantly influenced the microstructural constitution of the investigated samples. Figure 6a–c shows the LOM images of the Q&P samples, quenched to a temperature of 190, 250, and 310 °C, respectively. In comparison, the microstructure of the sample annealed in the TBF regime is shown in Figure 6d. All four conditions were heat-treated at a TP (TB) of 400 °C. For the Q&P steels, the matrix consisted of a mixture of α’initial and αB, which appeared as bluish and brownish areas in the micrographs. Furthermore, RA and/or α’final islands (white and brownish areas) could be observed as finely distributed in the matrix. At the lowest TQ of 190 °C, the secondary phase only consisted of RA, whereas the increase of TQ led to the pronounced formation of α’final. The microstructure, especially at a TQ of 250 and 310 °C exhibited a banded structure, resulting from the segregation of alloying elements such as Mn during casting and subsequent solidification. In contrast, the microstructure of the TBF samples consisted of a ferritic-bainitc matrix with small amounts of finely distributed RA islands, surrounded by large fractions of α’final.
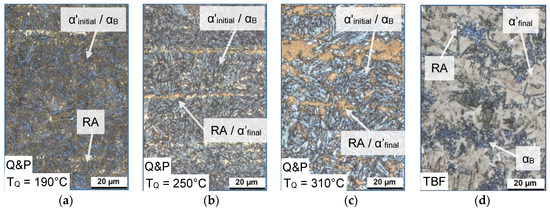
Figure 6.
Light optical microscopy (LOM) images of the (a–c) Q&P samples (TQ = 190, 250, and 310 °C) and (d) TBF sample at a TP (TB) of 400 °C (magnification 1000×).
For higher resolution investigations, the microstructure was further characterized by SEM. The SEM images of the Q&P samples quenched to a TQ of 190, 250, and 310 °C are displayed in Figure 7a–c, whereas in Figure 7d the microstructure after the TBF heat-treatment is shown for comparison. In the case of the Q&P samples, the microstructure contained cementite precipitates with an obvious triaxial alignment, which means that the precipitations are arranged in an angle of 120°. This indicates the presence of tempered α’initial. Furthermore, the fraction of αB in the matrix rose along with the amount of α’final with increasing TQ. In comparison, the microstructure of the TBF steel consisted of a αB-matrix with large amounts of α’final and low fractions of RA.
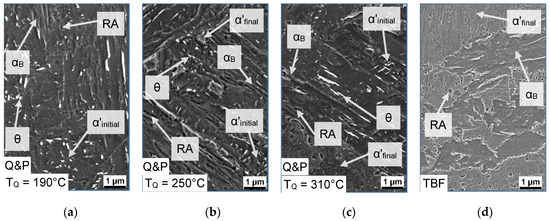
Figure 7.
SEM images of the (a–c) Q&P samples (TQ = 190, 250, and 310 °C) and (d) TBF sample at a TP (TB) of 400 °C (magnification 5000×).
Figure 8 depicts the amount of RA, determined by SMM, for the TBF samples (dotted lines) and the Q&P samples at a TP of 350, 400, and 450 °C, respectively. In addition, the RA fraction calculated according to the CCE-model proposed by Speer et al. [20] is presented in the diagram. The CCE-model proposed a RA maximum (RAmax) of 19.7 vol.% at a TQ of 210 °C. In accordance with the model calculations, the experiments also confirmed the shape of the RA evolution as a function of TQ. At lower TQ the formation of high amounts of α’initial led to lower RA fractions. By a further increase of the TQ, the RAmax was achieved followed by a decrease of the RA. This was due to its lower stabilization and therefore the formation of α’final upon cooling to RT. Furthermore, the experiments showed an influence of TP on the amount of RA: with increasing TP, RAmax rose from 14.8 to 19.0 vol.%. In this context, at the TP of 450 °C, the amount of RA correlated well with the model calculations. On the contrary, at the TP of 350 °C and 400 °C, a lower amount of RA was achieved compared to the model predictions. Moreover, the TQ at which the RAmax occurred, was shifted to higher temperatures by up to 80 °C compared to the CCE-model. It is evident that the RA contents of the TBF samples were lower compared to the Q&P samples: 7.1 vol.% RA at a TB of 350 °C, 9.7 vol.% RA at TB = 400 °C, and 3.6 vol.% RA at TB = 450 °C.
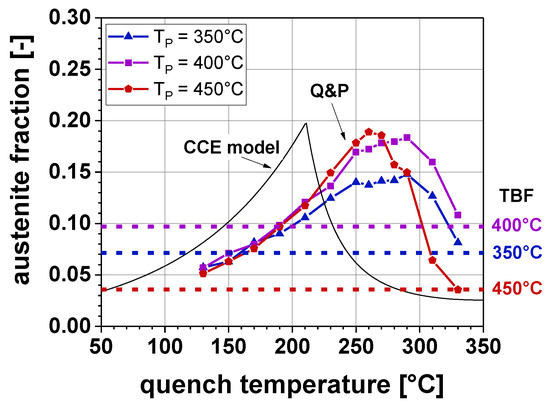
Figure 8.
Retained austenite (RA) content as a function of TQ for a TP (TB) of 350, 400, and 450 °C.
Figure 9 represents microstructure charts, where the phase fractions are plotted as a function of TQ for different TP. In addition, the bar charts, situated close to the right rim of each diagram, depict the microstructural constitution for the TBF steel. In case of the Q&P samples, the decrease of TQ led to a considerable increase of α’initial. As a consequence, a lower amount of αB was formed during IBT, regardless of TP. However, particularly at higher TQ, a vivid influence of TP is obvious: the increase of TP led to a decreasing fraction of αB, resulting in the formation of α’final upon cooling to RT. Therefore, the RA content steadily rose with increasing TQ until the onset of the formation of α’final occured. For the TBF samples, it is evident that the largest amount of αB was formed at a TB of 400 °C as already shown by dilatometry (Figure 4b). Due to the lowest αB fraction at a TB of 450 °C, the largest amount of γ transformed to α’final during final cooling, resulting in the lowest amount of RA, followed by the samples heat-treated at a TB of 350 °C and 400 °C.
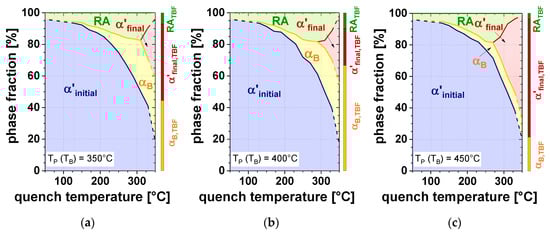
Figure 9.
Phase fraction as a function of TQ for a TP (TB) of (a) 350 °C, (b) 400 °C, and (c) 450 °C.
3.3. Hardness
The results of the hardness measurements according to Vickers are plotted as a function of TQ in Figure 10. When the TQ was in the range of 130 to 250 °C, both increasing TQ and TP led to a slightly decreasing hardness. However, at TQ exceeding 250 °C, the hardness rose with TQ, especially at a TP of 450 °C. For this reason, in case of the Q&P samples, the hardness was between approximately 350 and 460 HV1. In contrast, for the TBF samples the lowest hardness of 445 HV1 was measured at a TB of 400 °C, whereas at a TB of 350 and 450 °C the hardness reached approximately 470 and 475 HV1, respectively.
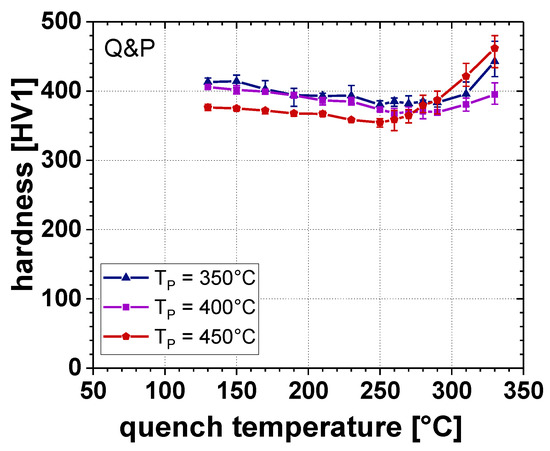
Figure 10.
Vickers hardness as a function of TQ for a TP of 350, 400, and 450 °C.
4. Discussion
The time-temperature-transformation (TTT) diagrams for isothermal holding at different TP (TB) depict the comparison between the Q&P heat-treatment (Figure 11a–c) at different TQ (190, 250, and 310 °C) and the TBF processing route (Figure 11d). It is obvious that the application of the Q&P process resulted in an evident acceleration of the αB formation. This is in agreement with Wang et al. [29], since the presence of α’initial pronouncedly accelerated the IBT due to the enhanced nucleation rate by the presence of geometrically necessary dislocations. At higher TQ, the amount of αB significantly increased, in particular at the lower TP of 350 and 400 °C. According to Smanio and Sourmail [30], this relation can be explained by the fact that at higher TQ lower amounts of α’initial were formed, which was also confirmed by the LOM and SEM investigations (Figure 6 and Figure 7). As a result, a larger amount of γ was present in the microstructure at the onset of isothermal holding, from which a larger amount of αB could be formed, compared to lower TQ. For this reason, the largest αB formation was observed in the TBF samples, where especially a lower TB of 350 °C led to increased αB fractions up to 80 vol.% after the investigated holding time. Furthermore, a general impact of the TP (TB) on the transformation kinetics was found: especially at a TP (TB) of 400 and 450 °C the transformation kinetics was evidently accelerated due to the faster C diffusion into the remaining γ. In general, the increase of TP and TB led to lower fractions of αB, which is in analogy with the T0-concept [31]. Thereby, the difference between the Gibbs free energies of γ and α decreases with an increase of temperature. As a consequence, the driving force for αB formation diminishes with temperature.
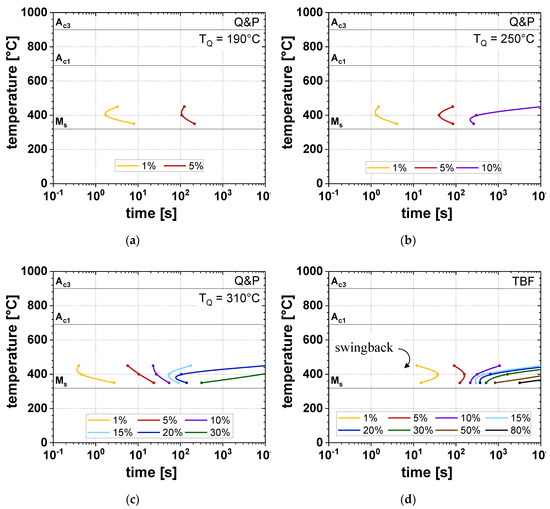
Figure 11.
Time-temperature-transformation (TTT) diagrams for (a–c) Q&P steels (TQ = 190, 250, and 310 °C) and (d) TBF steels.
In the case of the TBF samples, the swing back phenomenon could be contemplated, which is in accordance with Oka and Okamoto [32]. This effect describes the accelerated formation of αB due to the formation of thin-plate isothermal α’ in a temperature range just above MS. Therefore, at a TB of 350 °C, the onset of the αB formation was observed at shorter times compared to a TB of 400 °C.
Considering the RA investigations, a significant difference between the calculated CCE-model and experimental data was determined. This was particularly apparent for the amount of RA and optimal TQ. In analogy to the present results, these observations have already been reported in the literature [24,33,34]. The CCE-model assumes full C-partitioning from α’initial into the remaining γ. However, in the present study the microstructural investigations have shown the presence of cementite precipitates in the tempered α’initial (Figure 7), which contradicts this assumption. The insufficient C-partitioning led to a reduced C-content in the remaining γ, resulting in a lower amount of RA due to the formation of α’final, caused by the lower chemical RA stability. In particular, for the TP of 350 °C, the RAmax was remarkably lower than the predicted one. According to Clarke et al. [24], the αB formation, which predominantly occurred at a TP of 350 °C in the present study, led to a pronounced decrease in RA as the aftermath of the reduction of untransformed γ during isothermal holding.
Furthermore, the microstructural changes were reflected in hardness according to Vickers, as well (Figure 9 and Figure 10). With increasing RA, content hardness steadily decreased, resulting in the lowest hardness for those samples containing the largest amount of RA. Since with increasing TP the volume fraction of RA stabilized to RT rose, the lowest hardness values could be obtained at TP = 450 °C. However, the increased RA content at higher TP led to the lower chemical RA stability, and thus to an intensified formation of α’final. Therefore, especially at TP = 450 °C, hardness drastically increased at TQ, exceeding that temperature where the maximum RA content was measured. This is in agreement with [35], where a comparable correlation between the microstructural constituents (i.e., RA and α’final) and resulting hardness was found for lean medium Mn steels.
The evident shift of the RAmax to higher TQ than predicted could be explained by the fact that γ is stabilized by both chemical and mechanical factors, whereas the CCE-model only takes the chemical stabilization into account [36]. Furthermore, the CCE-model includes two empirical formulas, describing the α’ kinetics and the MS temperature. According to Kim et al. [37], slight differences in the chemical composition or the initial microstructure could therefore lead to deviations from the model, as well. In the present contribution, small deviations between the MS temperature calculated according to Mahieu et al. (MS = 350 °C) and the MS temperature determined by means of dilatometry (MS = 325 °C, Figure 5a) could be observed, as well. Therefore, an adjustment of the applied MS-formula with an improved validity for increased Mn and C contents is intended for future investigations. Nevertheless, the CCE-model proposed by Speer et al. [20] is a vital tool for the first estimation of applicable annealing parameters in the case of Q&P steels.
5. Conclusions
The results of the present contribution give conclusive evidence that the Q&P process significantly influences the transformation behavior of the investigated lean medium Mn steel. Both TQ and TP must be carefully adjusted, since they have a substantial impact on the microstructural evolution during steel processing.
The main findings of the present study are as follows:
- The Q&P heat-treatment accelerated the transformation kinetics during isothermal holding in the partitioning step due to the presence of α’initial, which acted as nucleation sites for the αB formation.
- For both Q&P and TBF grades, the increase of TP (TB) resulted in lower amounts of αB, although the transformation kinetics was accelerated.
- With increasing TQ, smaller amounts of α’initial and larger amounts of αB were formed, leading to an increased RA content. At too high TQ, α’final was formed, resulting in a sharp decrease in RA. Therefore, the microstructure of the Q&P samples consisted of tempered α’initial, RA, and at higher TQ partially of αB and α’final.
- The microstructure of the TBF samples with the present lean medium Mn composition consisted of a ferritic-bainitic matrix with large amounts of α’final and low fractions of RA.
- The comparison of the CCE-model and the experimental data showed a significant deviation of the maximum RA content, in particular at lower TP. Furthermore, the optimum TQ was shifted to higher temperatures compared to the CCE-model predictions.
Author Contributions
Conceptualization, R.S., D.K., and C.S.; methodology, S.K.; software, S.K.; validation, D.K. and R.S.; formal analysis, S.K.; investigation, S.K.; resources, D.K., R.S., and S.K.; data curation, S.K., R.S., D.K., C.B., and C.S.; writing—original draft preparation, S.K.; writing—review and editing, R.S., D.K., C.B., and C.S.; visualization, S.K.; supervision, R.S., D.K., C.B., and C.S.; project administration, D.K., R.S., and C.S.; funding acquisition, D.K.
Funding
This research was funded by the Austrian Research Promotion Agency (FFG), grant number 860188, “Upscaling of medium Mn-TRIP steels”.
Conflicts of Interest
The authors declare no conflict of interest. The funders had no role in the design of the study; in the collection, analyses, or interpretation of data; in the writing of the manuscript, or in the decision to publish the results.
References
- Kwon, O.; Lee, K.; Kim, G.; Chin, K. New trends in advanced high strength steel—Developments for automotive application. Mater. Sci. Forum 2010, 638–642, 136–141. [Google Scholar] [CrossRef]
- Spenger, F.; Hebesberger, T.; Pichler, A.; Krempaszky, C.; Werner, E.; Doppler, C. AHSS steel grades: Strain hardening and damage as material design criteria. In Proceedings of the International Conference on New Developments in Advanced High Strength Sheet Steels, Orlando, FL, USA, 15–18 June 2008; pp. 39–49. [Google Scholar]
- Jacques, P.J.; Petein, A.; Harlet, P. Improvement of mechanical properties through concurrent deformation and transformation: New steels for the 21st century. In Proceedings of the International Conference on TRIP-aided High Strength Ferrous Alloys, Aachen, Germany, 19–21 June 2002; pp. 281–285. [Google Scholar]
- Hashimoto, K.; Yamasaki, M.; Fujimura, K.; Matsui, T.; Izumiya, K. Global CO2 recycling—Novel materials and prospect for prevention of global warming and abundant energy supply. Mater. Sci. Eng. A 1999, 267, 200–206. [Google Scholar] [CrossRef]
- Zaefferer, S.; Ohlert, J.; Bleck, W. A study of microstructure, transformation mechanisms and correlation between microstructure and mechanical properties of a low alloyed TRIP steel. Acta Mater. 2004, 52, 2765–2778. [Google Scholar] [CrossRef]
- Matlock, D.; Speer, J.; De Moor, E.; Gibbs, P. Recent developments in advanced high strength steels for automotive applications: An overview. JESTECH 2012, 15, 1–12. [Google Scholar]
- De Cooman, B.C. Structure-properties relationship in TRIP steels containing carbide-free bainite. Solid State Mater. Sci. 2004, 8, 285–303. [Google Scholar] [CrossRef]
- Hairer, F.; Krempaszky, C.; Tsipouridis, P.; Werner, E.; Satzinger, K.; Hebesberger, T.; Pichler, A. Effects of heat treatment on microstructure and mechanical properties of bainitic single- and complex-phase steel. Proc. MS&T 2009, 2009, 1391–1401. [Google Scholar]
- Samek, L.; Krizan, D. Steel—Material of choice for automotive lightweight applications. In Proceedings of the International Conference on Metals, Brno, Czech Republic, 23–25 May 2012; pp. 6–12. [Google Scholar]
- De Cooman, B.C.; Chin, K.; Kim, J. High Mn TWIP steels for automotive applications. In New Trends and Developments in Automotive System Engineering; Chiaberge, M., Ed.; InTech: Rijeka, Croatia, 2010; pp. 101–128. [Google Scholar]
- Bracke, L.; Verbeken, K.; Kestens, L.; Penning, J. Microstructure and texture evolution during cold rolling and annealing of a high Mn TWIP steel. Acta Mater. 2009, 57, 1512–1524. [Google Scholar] [CrossRef]
- Steineder, K.; Schneider, R.; Krizan, D.; Bèal, C.; Sommitsch, C. Microstructural evolution of two low-carbon steels with a medium manganese content. In Proceedings of the 2nd HMnS Conference, Aachen, Germany, 31 August–4 September 2014; pp. 351–354. [Google Scholar]
- De Cooman, B.C.; Speer, J. Quench and partitioning steel: A new AHSS concept for automotive anti-intrusion applications. Steel Res. Int. 2006, 77, 634–640. [Google Scholar] [CrossRef]
- Steineder, K.; Krizan, D.; Schneider, R.; Bèal, C.; Sommitsch, C. On the microstructural characteristics influencing the yielding behavior of ultra-fine grained medium-Mn steels. Acta Mater. 2017, 139, 39–50. [Google Scholar] [CrossRef]
- Speer, J.; Matlock, D.; De Cooman, B.C.; Schroth, J. Carbon partitioning into austenite after martensite transformation. Acta Mater. 2003, 51, 2611–2622. [Google Scholar] [CrossRef]
- Speer, J.; Aussunção, F.; Matlock, D.; Edmonds, D. The “quenching and partitioning” process: Background and recent progress. Mater. Res. 2005, 8, 417–423. [Google Scholar] [CrossRef]
- Edmonds, D.; He, K.; Rizzo, F.; De Cooman, B.C.; Matlock, D.; Speer, J. Quenching and partitioning martensite—A novel steel heat treatment. Mater. Sci. Eng. A 2006, 438–440, 25–34. [Google Scholar] [CrossRef]
- Arlazarov, A.; Gouné, M.; Bouaziz, O.; Hazotte, A.; Petitgand, G.; Barges, P. Evolution of microstructure and mechanical properties of medium Mn steels during double annealing. Mater. Sci. Eng. A 2012, 542, 31–39. [Google Scholar] [CrossRef]
- Huyghe, P.; Dépinoy, S.; Caruso, M.; Mercier, D.; Georges, C.; Malet, L.; Godet, S. On the effect of Q&P processing on the stretch-flange-formability of 0.2C Ultra-high Strength Steel Sheets. ISIJ Int. 2018, 58, 1341–1350. [Google Scholar]
- Speer, J.; Streicher, A.; Matlock, D.; Rizzo, F. Quenching and partitioning: A fundamentally new process to create high strength TRIP sheet microstructures. In Proceedings of the Austenite Formation and Decomposition, Chicago, IL, USA, 9–12 November 2003; pp. 505–522. [Google Scholar]
- Van Bohemen, S.; Santofimia, M.; Sietsma, J. Experimental evidence for bainite formation below MS in Fe-0.66C. Scr. Mater. 2009, 58, 488–491. [Google Scholar] [CrossRef]
- Somani, M.; Porter, D.; Karjalainen, L.; Misra, R. On various aspects of decomposition of austenite in a high-silicon steel during quenching and partitioning. Metall. Mater. Trans. A 2013, 45, 1247–1257. [Google Scholar] [CrossRef]
- Kim, D.; Speer, J.; De Cooman, B.C. Isothermal transformation of a CMnSi steel below the MS temperature. Metall. Mater. Trans. A 2011, 42, 1575–1585. [Google Scholar] [CrossRef]
- Clarke, A.; Speer, J.; Miller, M.; Hackenberg, R.; Edmonds, D.; Matlock, D.; Rizzo, F.; Clarke, K.; De Moor, E. Carbon partitioning to austenite from martensite or bainite during the quench and partition (Q&P) process: A crictial assessment. Acta Mater. 2008, 56, 16–22. [Google Scholar]
- Zakerinia, H.; Kermanpur, A.; Najafizadeh, A. Color metallography: A suitable method for characterization of martensite and bainite in multiphase steels. Int. J. ISSI 2009, 6, 14–18. [Google Scholar]
- Wirthl, E.; Pichler, A.; Angerer, R.; Stiaszny, P.; Hauzenberger, K.; Titovets, Y.F.; Hackl, M. Determination of the volume amount of retained austenite and ferrite in small specimens by magnetic measurements. In Proceedings of the International Conference on TRIP-aided high strength ferrous alloys, Ghent, Belgium, 19–21 June 2002; pp. 61–64. [Google Scholar]
- Koistinen, D.; Marburger, R. A general equation prescribing the extent of the austenite-martensite transformation in pure iron-carbon alloys and plain carbon steels. Acta Metall. 1959, 7, 59–60. [Google Scholar] [CrossRef]
- Mahieu, J.; Maki, J.; De Cooman, B.C.; Claessens, S. Phase transformation and mechanical properties of Si-free CMnAl transformation-induced plasticity-aided steel. Metall. Mater. Trans. A 2002, 33, 2573–2580. [Google Scholar] [CrossRef]
- Wang, G.; Chen, S.; Liu, C.; Wang, C.; Zhao, X.; Xu, W. Correlation of isothermal bainite transformation and austenite stability in quenching and partitioning steels. J. Iron Steel Res. Int. 2017, 24, 1095–1103. [Google Scholar]
- Smanio, V.; Sourmail, T. Effect of partial martensite transformation on bainite reaction kinetics in different 1%C steels. Solid State Phenom. 2011, 172–174, 821–826. [Google Scholar] [CrossRef]
- Bhadeshia, H.K.D.H.; Honeycombe, R. The bainite reaction. In Steels—Microstructure and Properties, 3rd ed.; Edward Arnold: London, UK, 2006; pp. 121–124. [Google Scholar]
- Oka, M.; Okamoto, H. Swing back in kinetics near MS in hypereutectoid steels. Metall. Trans. A 1988, 19, 447. [Google Scholar] [CrossRef]
- Steineder, K.; Schneider, R.; Krizan, D.; Bèal, C.; Sommitsch, C. Investigation on the microstructural evolution in a medium-Mn steel (X10Mn5) after intercritical annealing. HTM 2015, 70, 19–25. [Google Scholar] [CrossRef]
- De Moor, E.; Lacroix, S.; Clarke, A.; Penning, J.; Speer, J. Effect of retained austenite stabilized via quench and partitioning on the strain hardening of martensitic steels. Metall. Mater. Trans. A 2008, 39, 2586–2595. [Google Scholar] [CrossRef]
- Grajcar, A.; Skrzypczyk, P.; Kozlowska, A. Effects of temperature and time of isothermal holding on retained austenite stability in medium-Mn steels. Appl. Sci. 2018, 8, 2156. [Google Scholar] [CrossRef]
- Jimenez-Melero, E.; Van Dijk, N.; Zhao, L.; Sietsma, J.; Offerman, S.; Wright, J.; Van der Zwaag, S. Martensitic transformation of individual grains in low-alloyed TRIP steels. Scr. Mater. 2007, 56, 421–424. [Google Scholar] [CrossRef]
- Kim, S.; Lee, J.; Barlat, F.; Lee, M.G. Transformation kinetics and density models of quenching and partitioning (Q&P) steels. Acta Mater. 2016, 109, 394–404. [Google Scholar]


© 2019 by the authors. Licensee MDPI, Basel, Switzerland. This article is an open access article distributed under the terms and conditions of the Creative Commons Attribution (CC BY) license (http://creativecommons.org/licenses/by/4.0/).