Article

Continuous Estimation of the Crack Growth Rate during Rotating‒Bending Fatigue Testing

by
Gabriela Martinez-Cazares
1,
Rafael Mercado-Solis
2,
Yaneth Bedolla-Gil
1 and
Diego Lozano
1,*
1
Departamento de Ingeniería, Universidad de Monterrey, Av. Morones Prieto 4500, San Pedro Garza García 66238, Mexico
2
Facultad de Ingeniería Mecánica y Eléctrica, Universidad Autónoma de Nuevo León, Pedro de Alba s/n, San Nicolás de los Garza 66455, Mexico
*
Author to whom correspondence should be addressed.
Metals 2019, 9(3), 275; https://doi.org/10.3390/met9030275
Submission received: 24 January 2019 / Revised: 18 February 2019 / Accepted: 25 February 2019 / Published: 28 February 2019

Abstract

:
A method for estimating the crack growth rate in steel during rotating‒bending fatigue testing is presented. Constant deflection tests were conducted in which the initial load remained constant prior to crack nucleation, when it decreased as the crack grew. In the proposed approach, steel samples were sharp-notched to produce a characteristic circular fracture upon loading and the final fracture area was correlated with a ratio of the load prior to fracture and the initial load. In this method, the deflection imposed is a function of a material’s elastic modulus rather than its yield strength and the correlation obtained to estimate the average crack length as a function of the instantaneous load is independent of the applied stress or steel grade.

1. Introduction

The basic principle of rotating‒bending fatigue (RBF) tests is that a bending moment is exerted on a specimen at a critical location as the specimen is rotated about its longitudinal axis, resulting in a single fully reversed stress cycle for each rotation (R = −1). The fatigue life can be expressed as the number of cycles (nf) of a particular stress amplitude (Sa) that the specimen can withstand before undergoing complete fracture [1,2,3,4,5]. Although RBF tests are mostly used for stress-based fatigue studies, they are generally not stress-controlled. Instead, a constant force amplitude is used in most tests: weights are suspended from the specimen to exert the bending moment. In many instruments designed for such testing, the bending moment is applied as a constant deflection amplitude [1,6,7,8]. In both cases, however, the stress conditions during the fatigue test differ from the initial stress conditions due to cyclic changes in the specimen such as softening, hardening, or cracking. An increase in the ultimate strength after cyclic loading prior to crack nucleation is reported in [9].
Thus, such cyclic changes are generally overlooked in RBF tests. Their use is typically limited to deriving S-n curves for stress-based total-fatigue-life evaluations. This type of fatigue testing and the effects of the loading mode are described in further detail elsewhere [1,2,3]. The standardized rotating-bar bending-fatigue testing is described in the ISO 1143 [4] and JIS Z 2274 [5], which are procedures that generally yield the fatigue life (nf for a particular Sa), and can be used to construct S-n diagrams. However, information about the crack behavior, which is another important parameter for determining the fracture toughness of a material, cannot be obtained using these methods.
The ASTM E647 Standard Test Method for Measurement of Fatigue Crack Growth Rates is commonly used to determine the crack growth rate by measuring the crack using optical techniques or equivalent methods [10]. However, continuous crack measurements during a rotating‒bending test are not feasible due to the testing configuration. Usually, a test must be interrupted several times to take measurements, whether to extract replicas of the surface from which the arc length of the initial crack can be measured [11,12,13], or to record the angle of the crack on the surface with an angular micrometer [14], or estimate the crack depth based on the potential drop technique [15,16,17,18]. Potential drop technique has been also used for real-time measurements in axial loading configuration [19] or pure bending [20]. Additionally, the surface crack length has been monitored by optical measurement, while the shape, size, and depth of the crack were inferred by an area-compliance method [21]. In other fatigue configurations it is possible to use digital image correlation (DIC) to analyze the crack growth rates and crack tip displacement fields, taking images every certain number of cycles during the test [22,23]. Similar accuracy between DIC and potential drop methods has been reported in [24]. Also, fatigue crack growth has been described in diagrams of kinetic fatigue failure developed with the parameter of the energy dissipation of deformation [25] and has shown good results in components from old structures [26].
In this study, an approach to further extend RBF tests to be applicable for estimating the crack growth rate (da/dn) by continuous force sensing under constant displacement conditions is presented.

2. Materials and Methods

2.1. Calculations

During constant displacement testing, the load required to maintain a constant deflection decreases progressively from the onset of fatigue cracking until overload fracture. This load alteration is proportional to crack growth as follows.
The deflection in a specific geometry depends on the elastic modulus of the material being tested and the load [27]. The equation for the deflection at the free end of a cantilever beam is as follows:
δ = P L 3 / 3 E I ,
where P is the applied load, L is the distance between the load and the pivot point that produces the bending moment, E is the elastic modulus, and I is the moment of inertia based on the specimen’s geometry. The value of I for a round shaft is calculated as a function of its diameter as follows:
I = π d 4 / 64 ,
where d is the diameter of the shaft. Thus, the load required to produce a certain deflection for a specific geometry depends on the material’s elastic modulus. Moreover, the proposed method is independent of test stress or steel strength.
The nominal stress for a bending shaft can be calculated as follows:
σ n o m = M ( y ) / I = 32 M / π d 3 ,
where M(y) is the bending moment at the surface of the specimen.

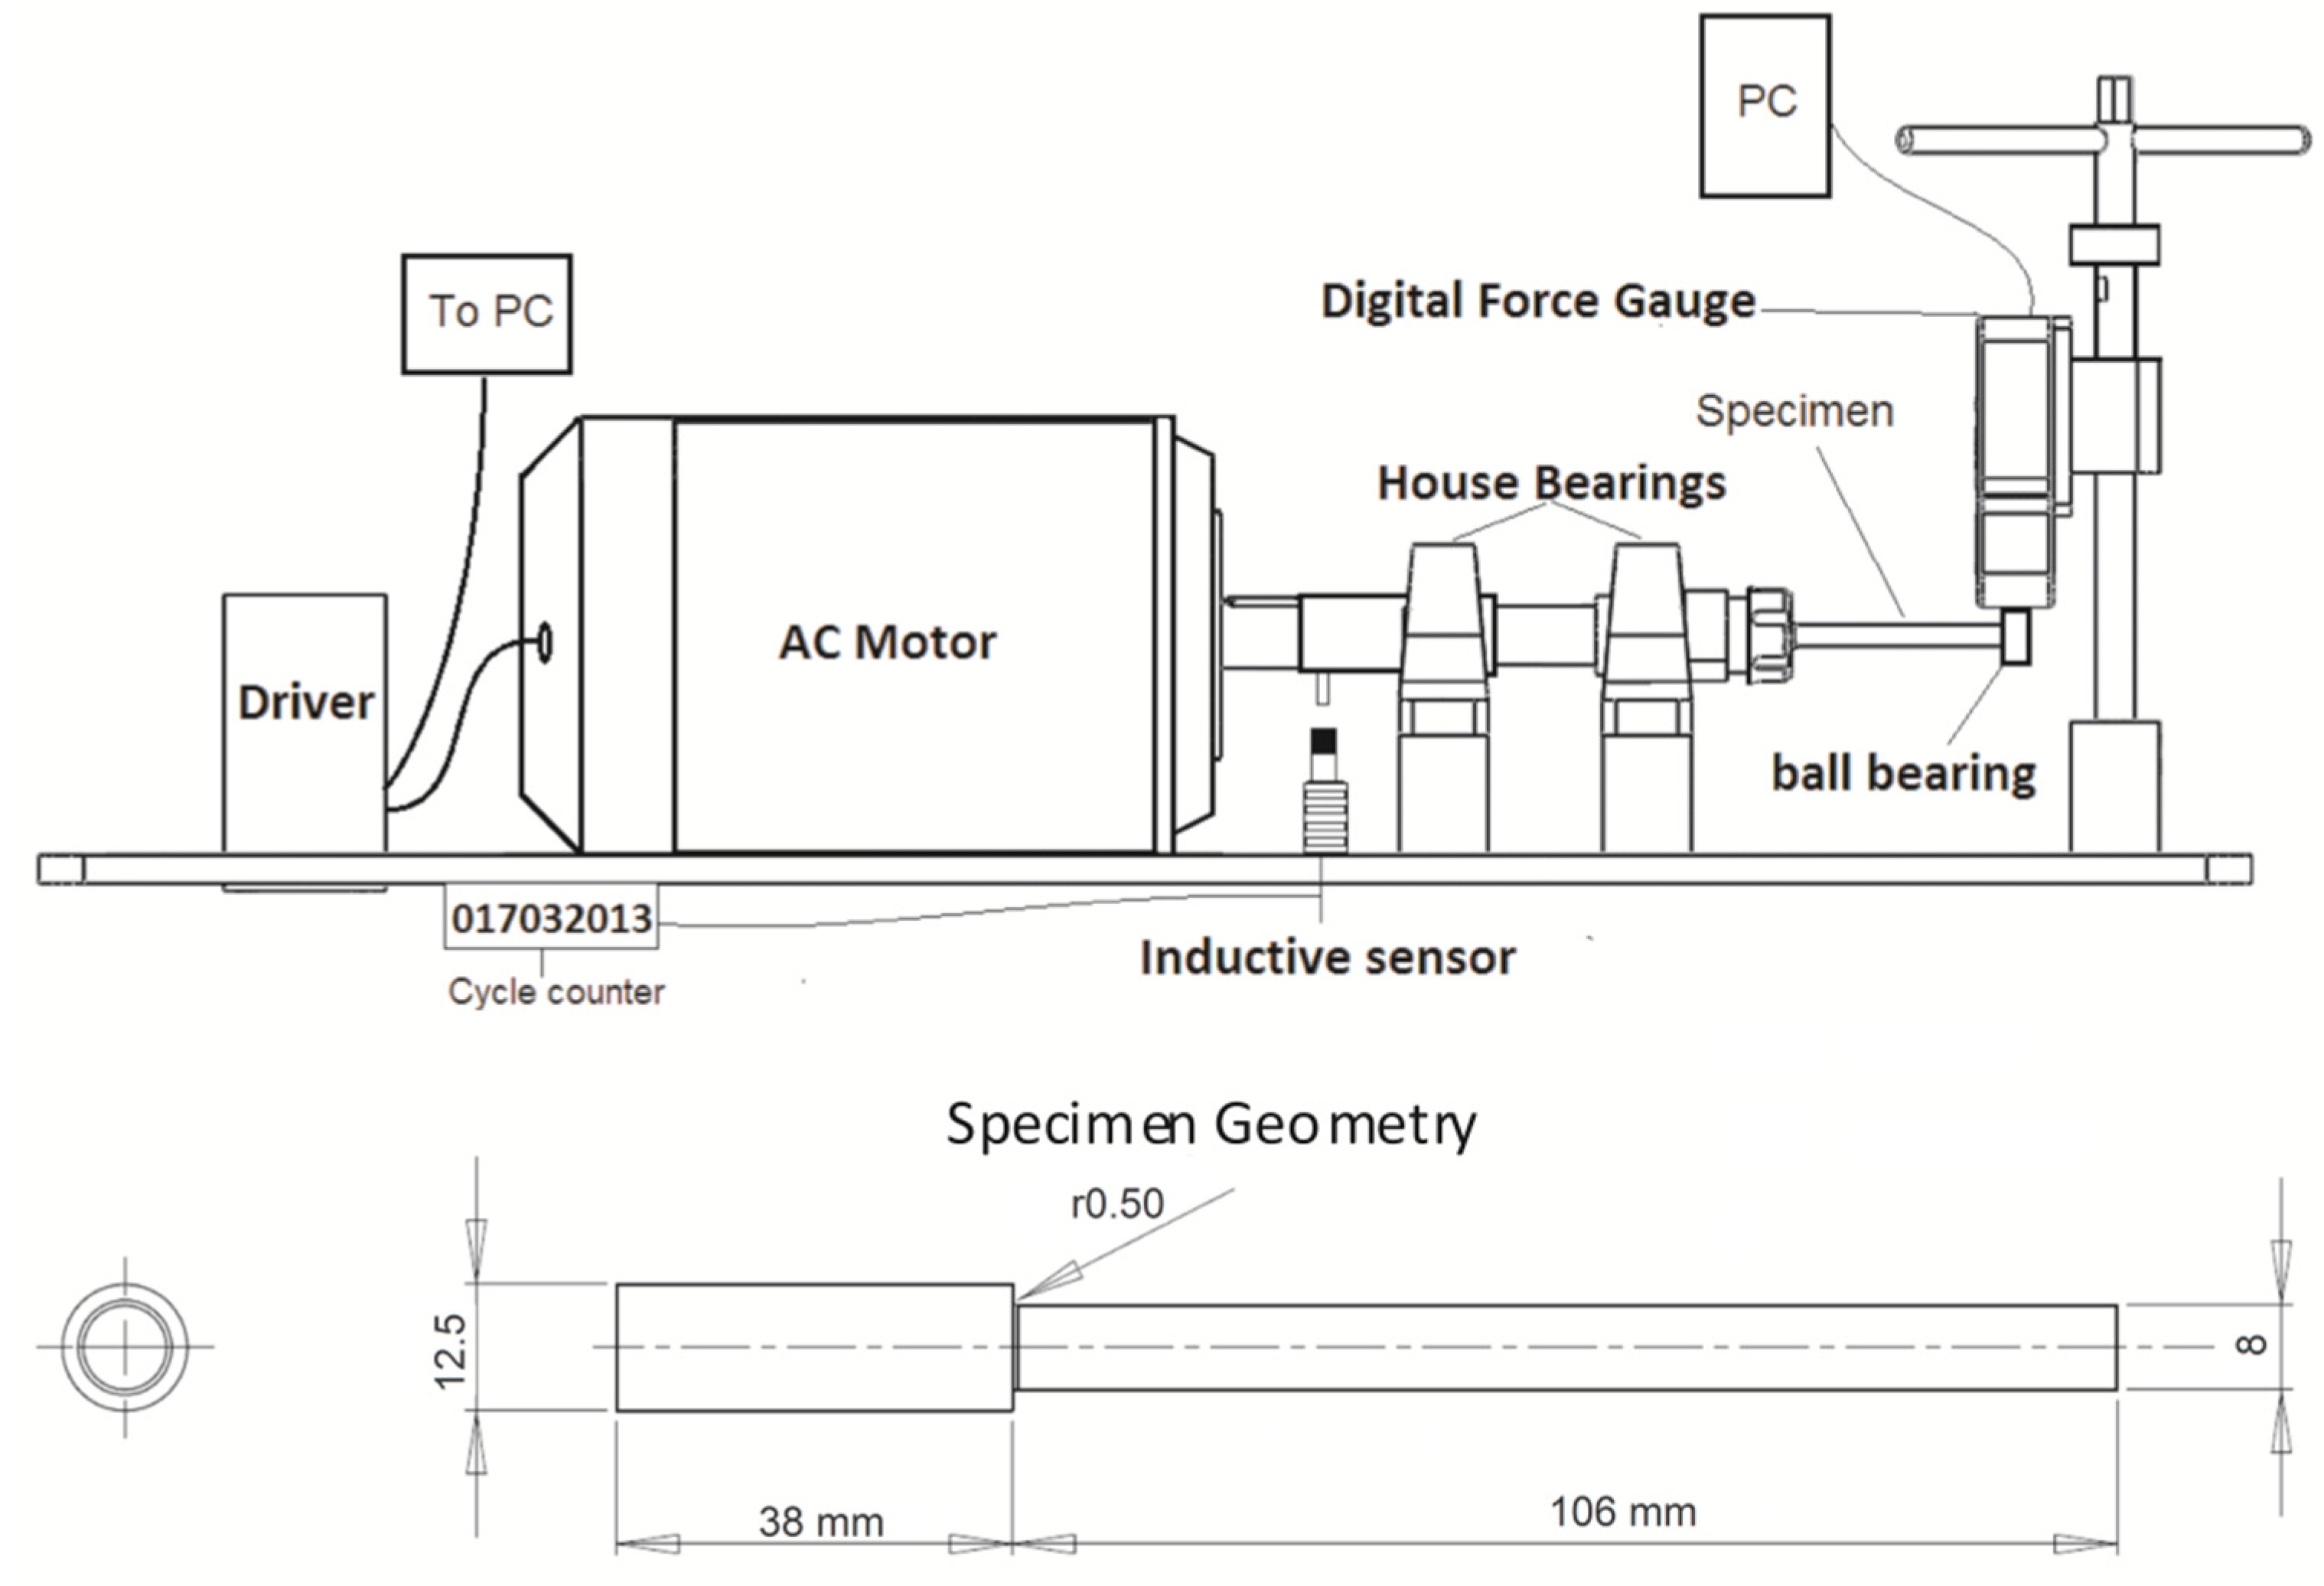
2.2. Test Conditions

The cantilever RBF testing machine and specimen geometry used in this study are shown schematically in Figure 1. The custom-built machine was a constant-displacement-type instrument in which the free end of the rotating specimen is deflected using the shaft of a digital force gauge.
The gauge is lowered by turning the hand wheel to cause a fixed deflection of the specimen. The load was continuously recorded at a sampling rate of 10 Hz and the rotation of specimen was 20 Hz. An inductive sensor and a digital cycle counter were employed to count the number of fatigue cycles over the course of the test.

Specimen Geometry and Heat Treatment

Each specimen was 144 mm long; 38 mm of this length was used for clamping with a collet chuck (type ER-25). The bending arm length from the point of loading to the shoulder fillet was 106 mm. Specimens were designed with a sharp notch in order to promote cracking from the entire circumference towards the center and form a circular pattern; the notch root radius was 0.5 mm, corresponding to a theoretical stress concentration factor (Kt) for this geometry of 2.2 according to [28].
The chemical composition of the AISI/SAE 5160 steel used is shown in Table 1. The samples were austenitized at 900 °C followed by water quenching and tempering at different temperatures—250 °C, 350 °C, 450 °C, and 550 °C—to attain different strength levels. The fatigue life at different tempering temperatures is shown in Table 2.

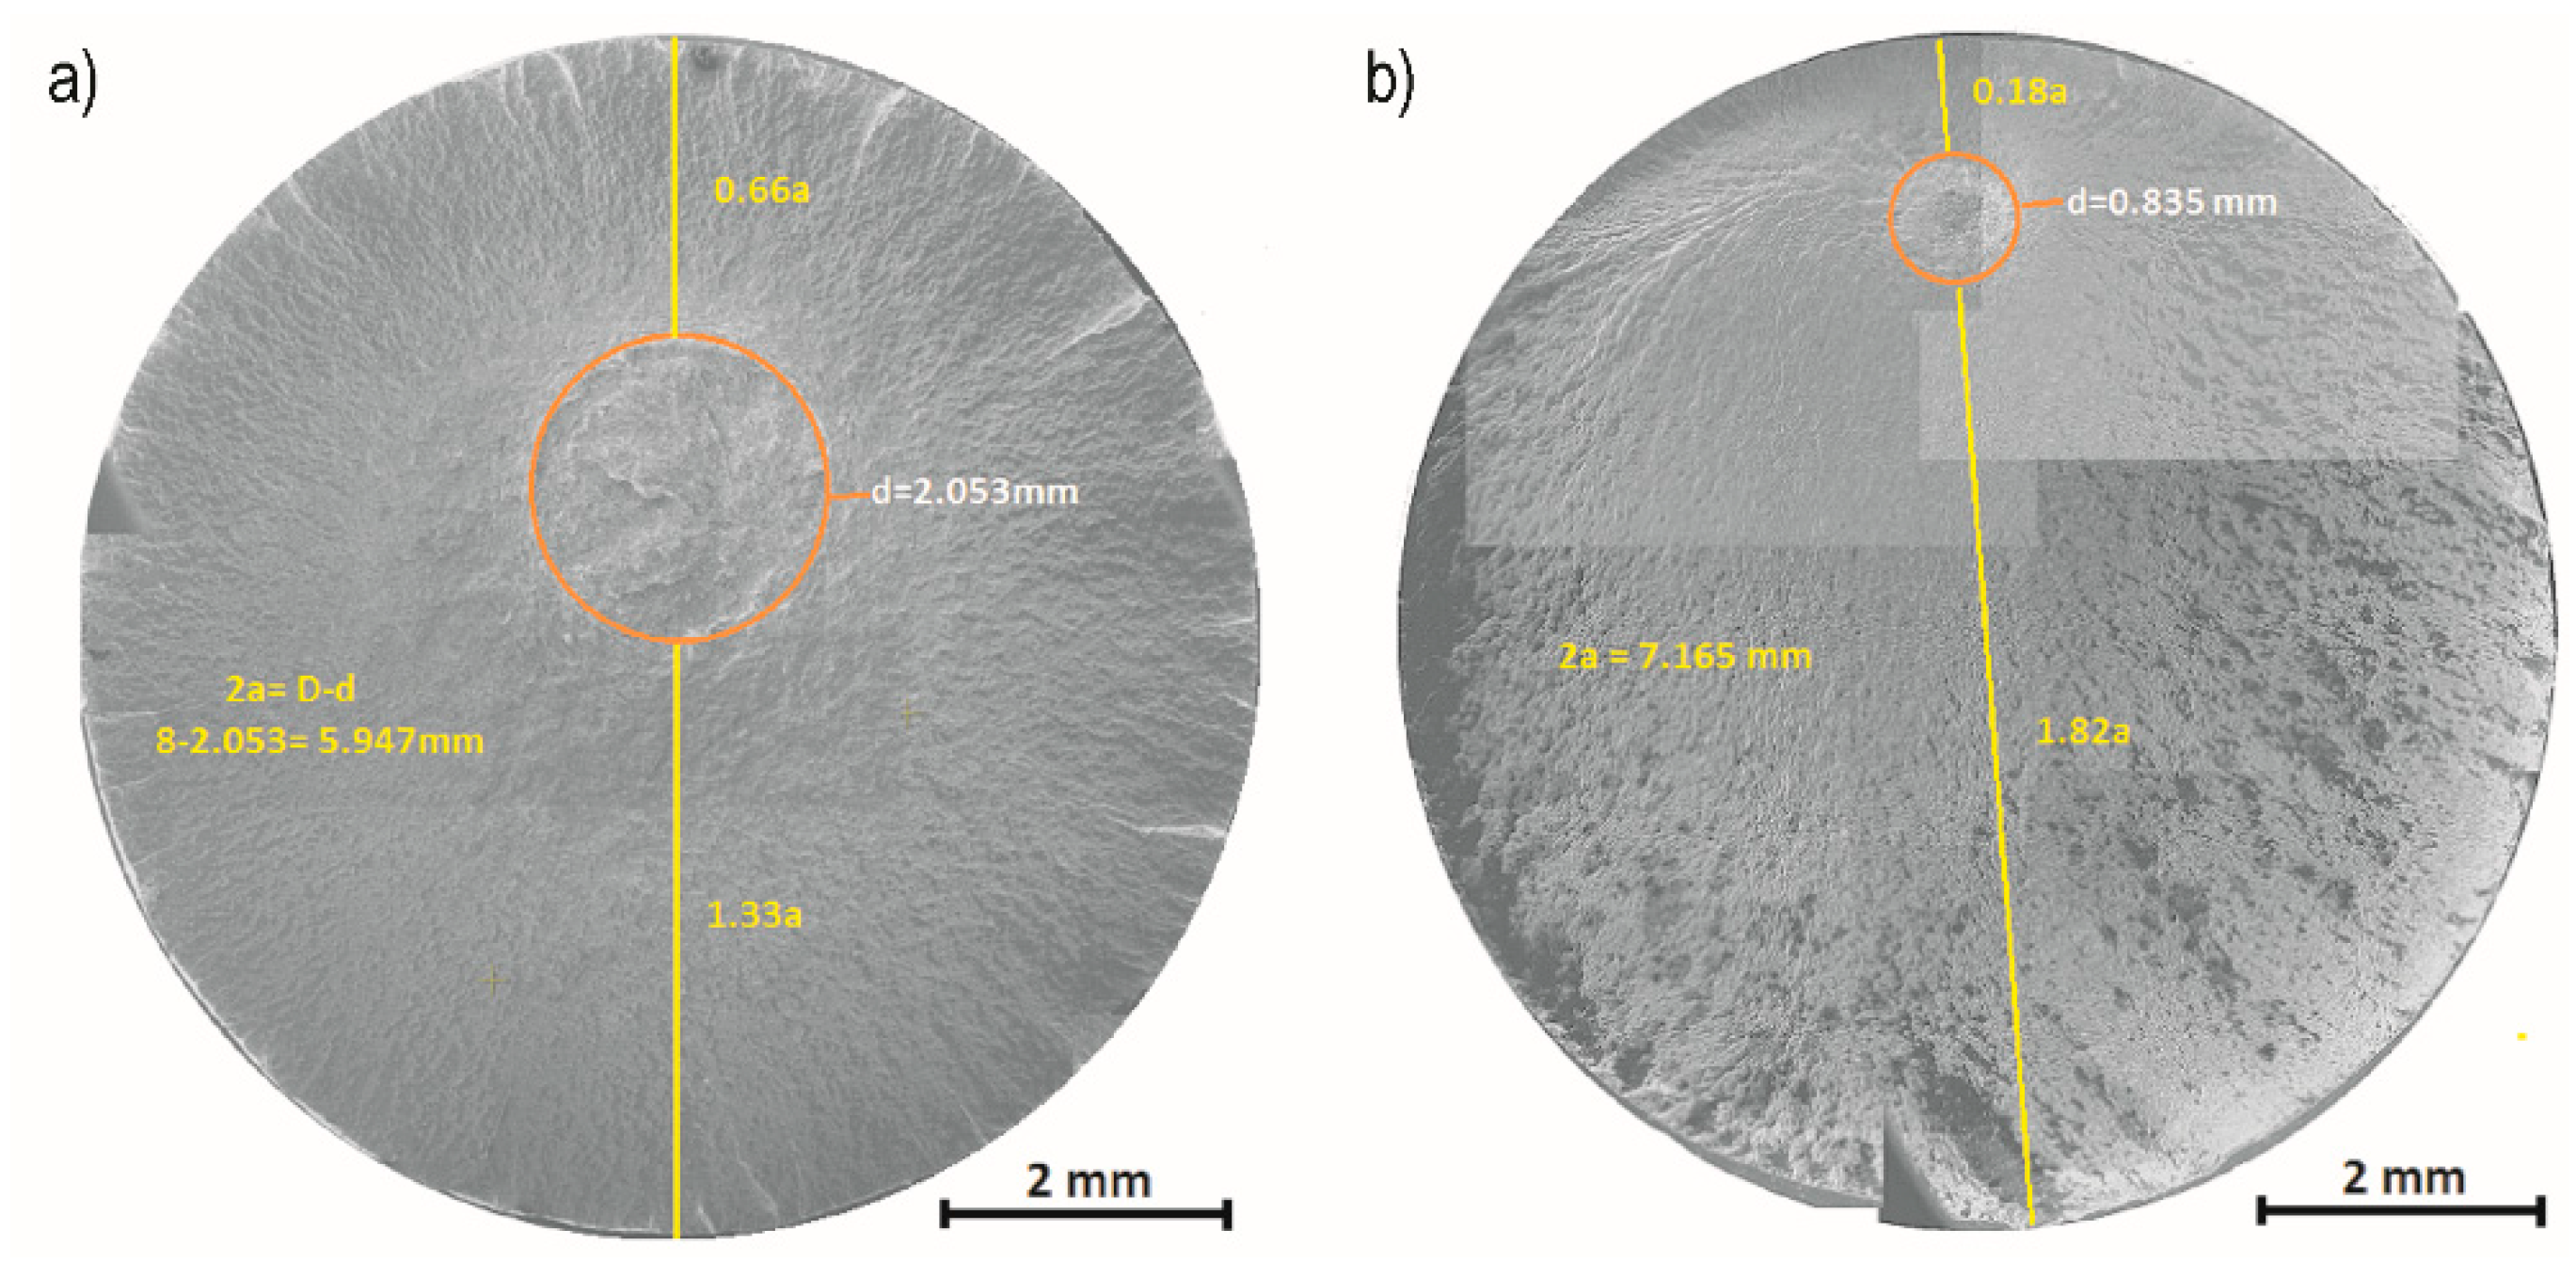
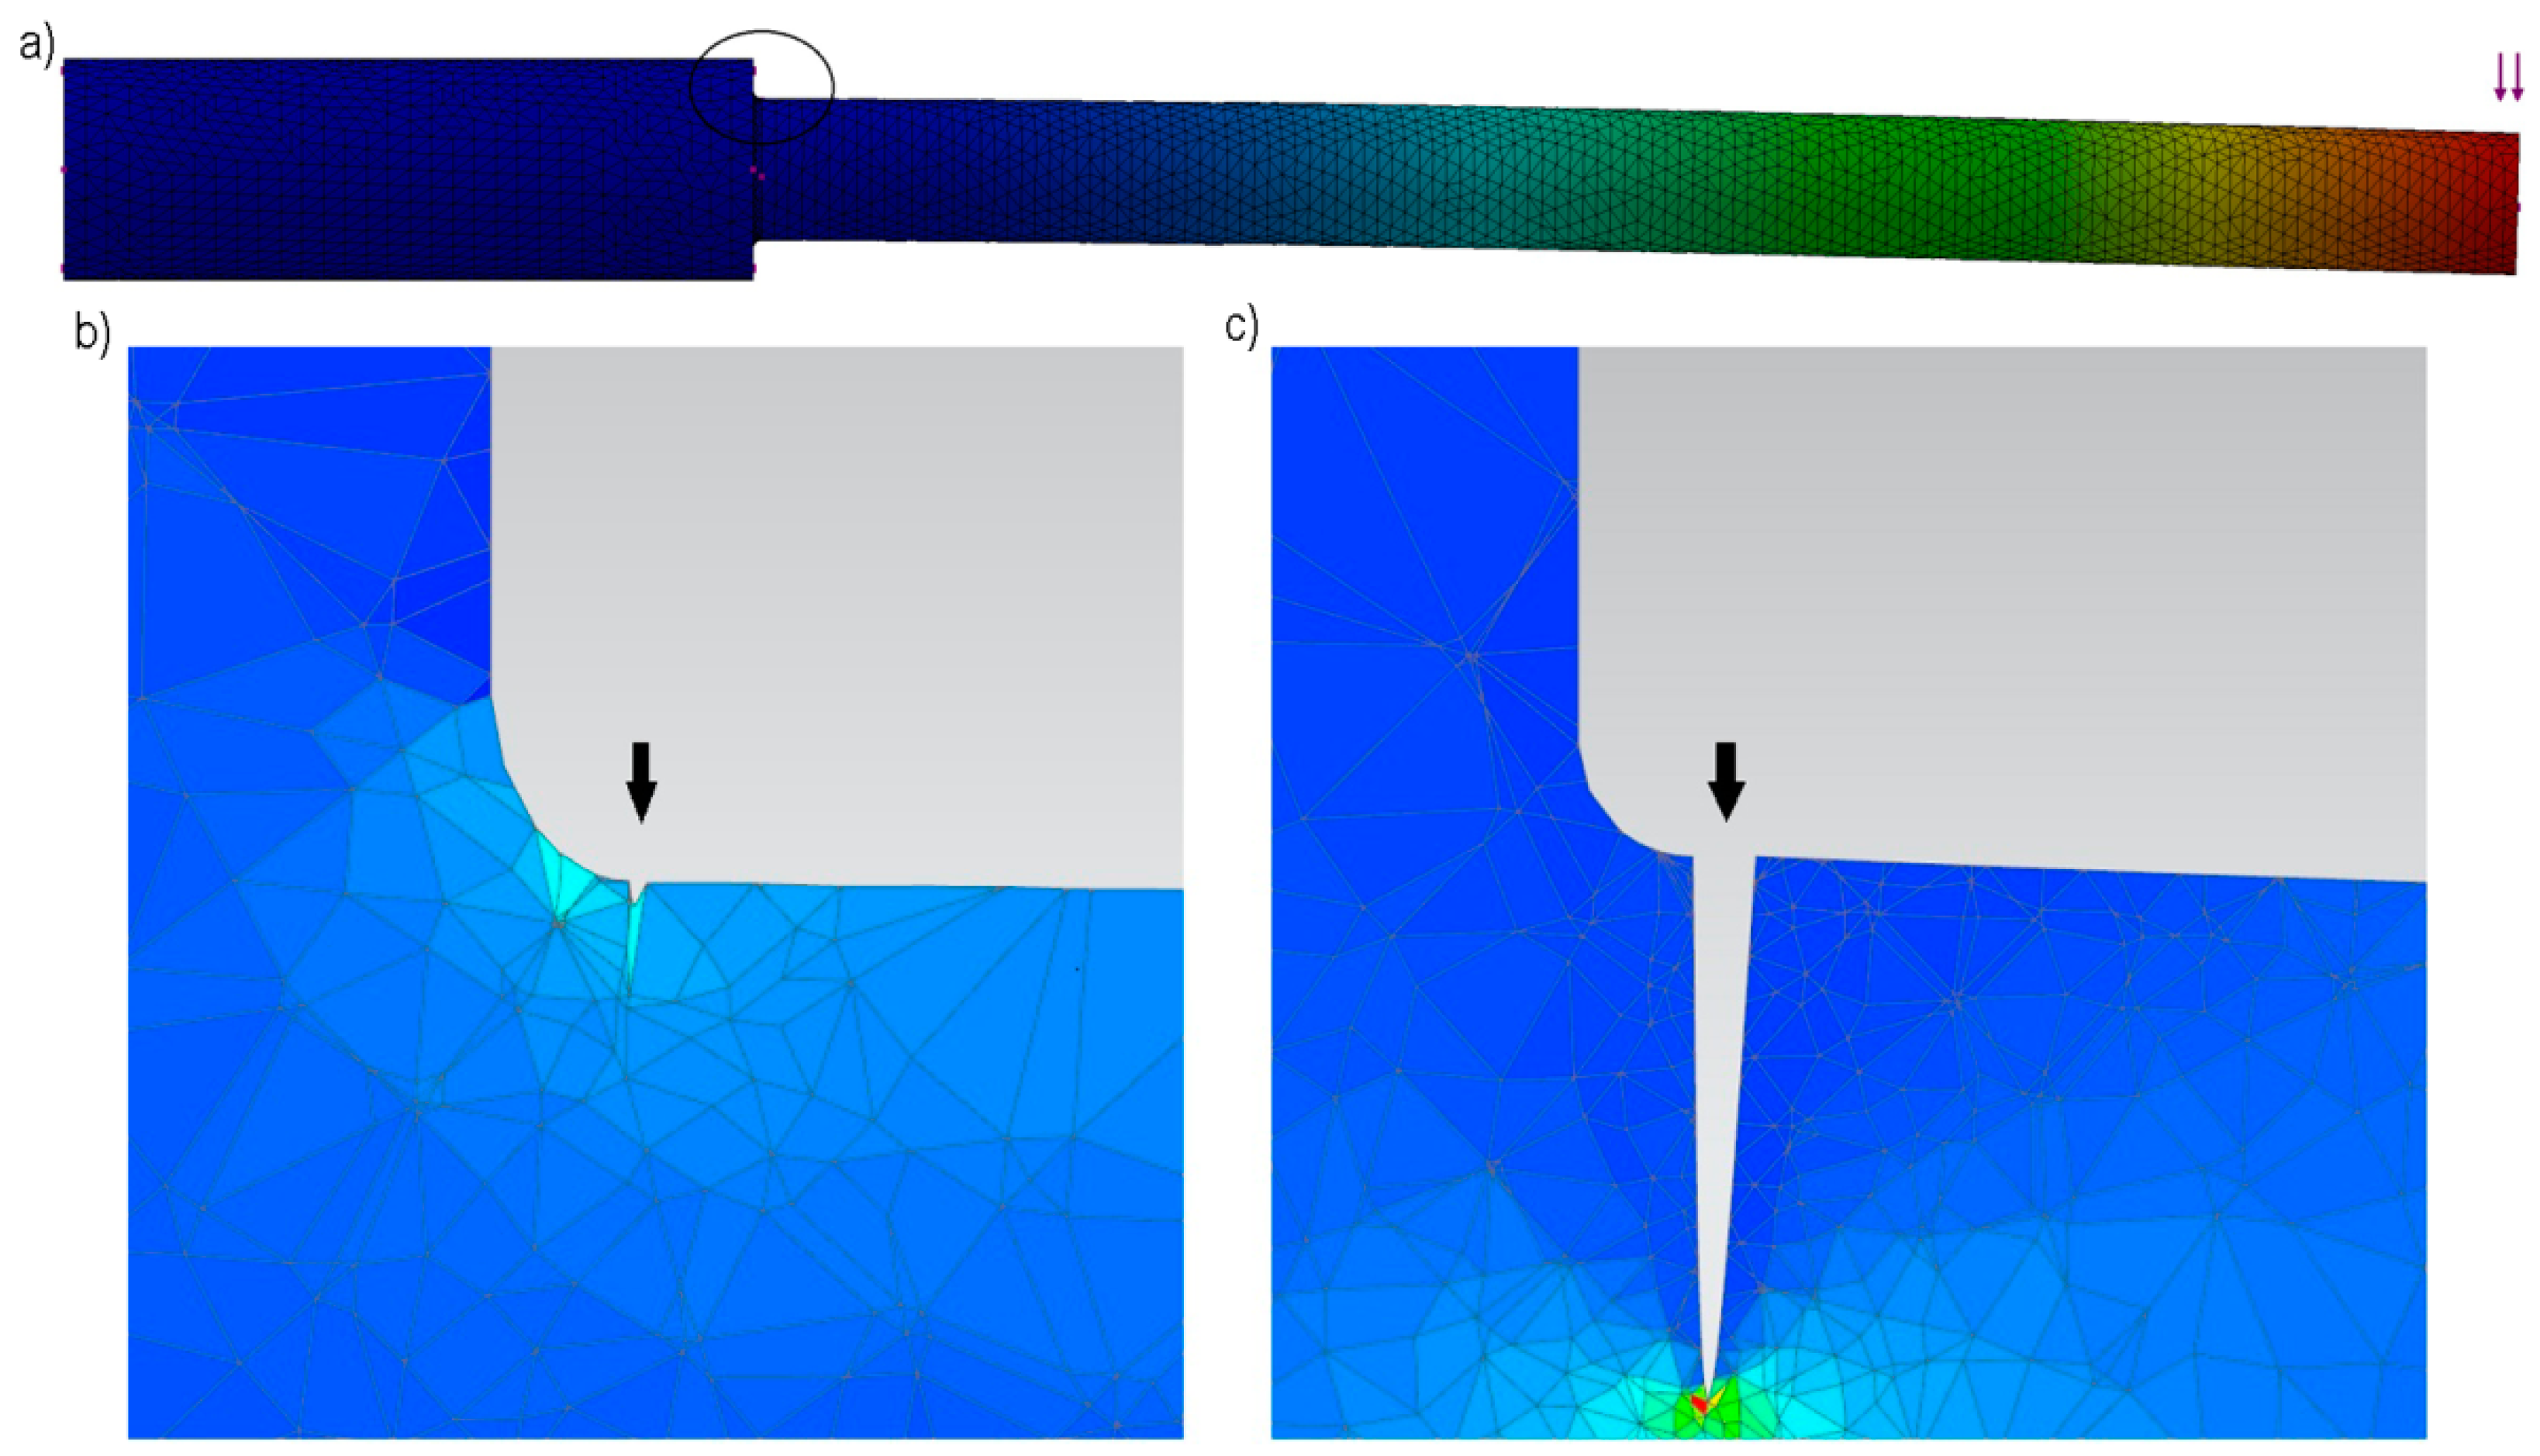
2.3. Crack Measurements and FEM

A series of crack measurements was performed physically on the fractured test specimens and the ratio between the initial load and the final load prior to fracture (Pf/P0) was correlated with the crack length. This approach provided information about the crack length at the point of fracture.
Figure 2 shows scanning electron microscope (SEM) images of typical samples. The orange circles delineate the well-defined fracture areas occurring around the sharp notch and the yellow lines indicate the path along which the two radial cracks would have extended from the notch root surface towards the final fracture area, passing through the center of the sample and the center of the fracture. In this way, the critical length of the radial cracks, 2a, was estimated by subtracting the diameter of the final fracture area (Dff) from the initial specimen diameter (D0). Thus, the fracture area is related to the average extension of the fatigue crack at fracture. The diameter ratios (Dff/D0 and Dn/D0) were obtained for each fracture analyzed.
Finite element modeling (FEM) in ANSYS Workbench was used to obtain the load ratio, Pn/P0, for several Dn/D0 ratios ranging from 0.3 to 1. The analysis was made with 67,795 nodes and 37,664 elements. The geometry was constrained from the grip area and a force was imposed at the free end. A static analysis was carried out in the original geometry to assess the deflection at the free end produced by different loads using an elastic modulus of 207 GPa. A crack at the notch root was introduced in a 2D model along the diameter with the crack tip towards the center (see Figure 3). The analysis was repeated using different crack sizes (depths) and constraining the part to the original deflection obtained for the uncracked specimen for each load without the crack. The reduced loads required to produce the same deflections for different crack sizes were determined. The ratios Pn/P0, for different Dn/D0 are displayed in Figure 4.

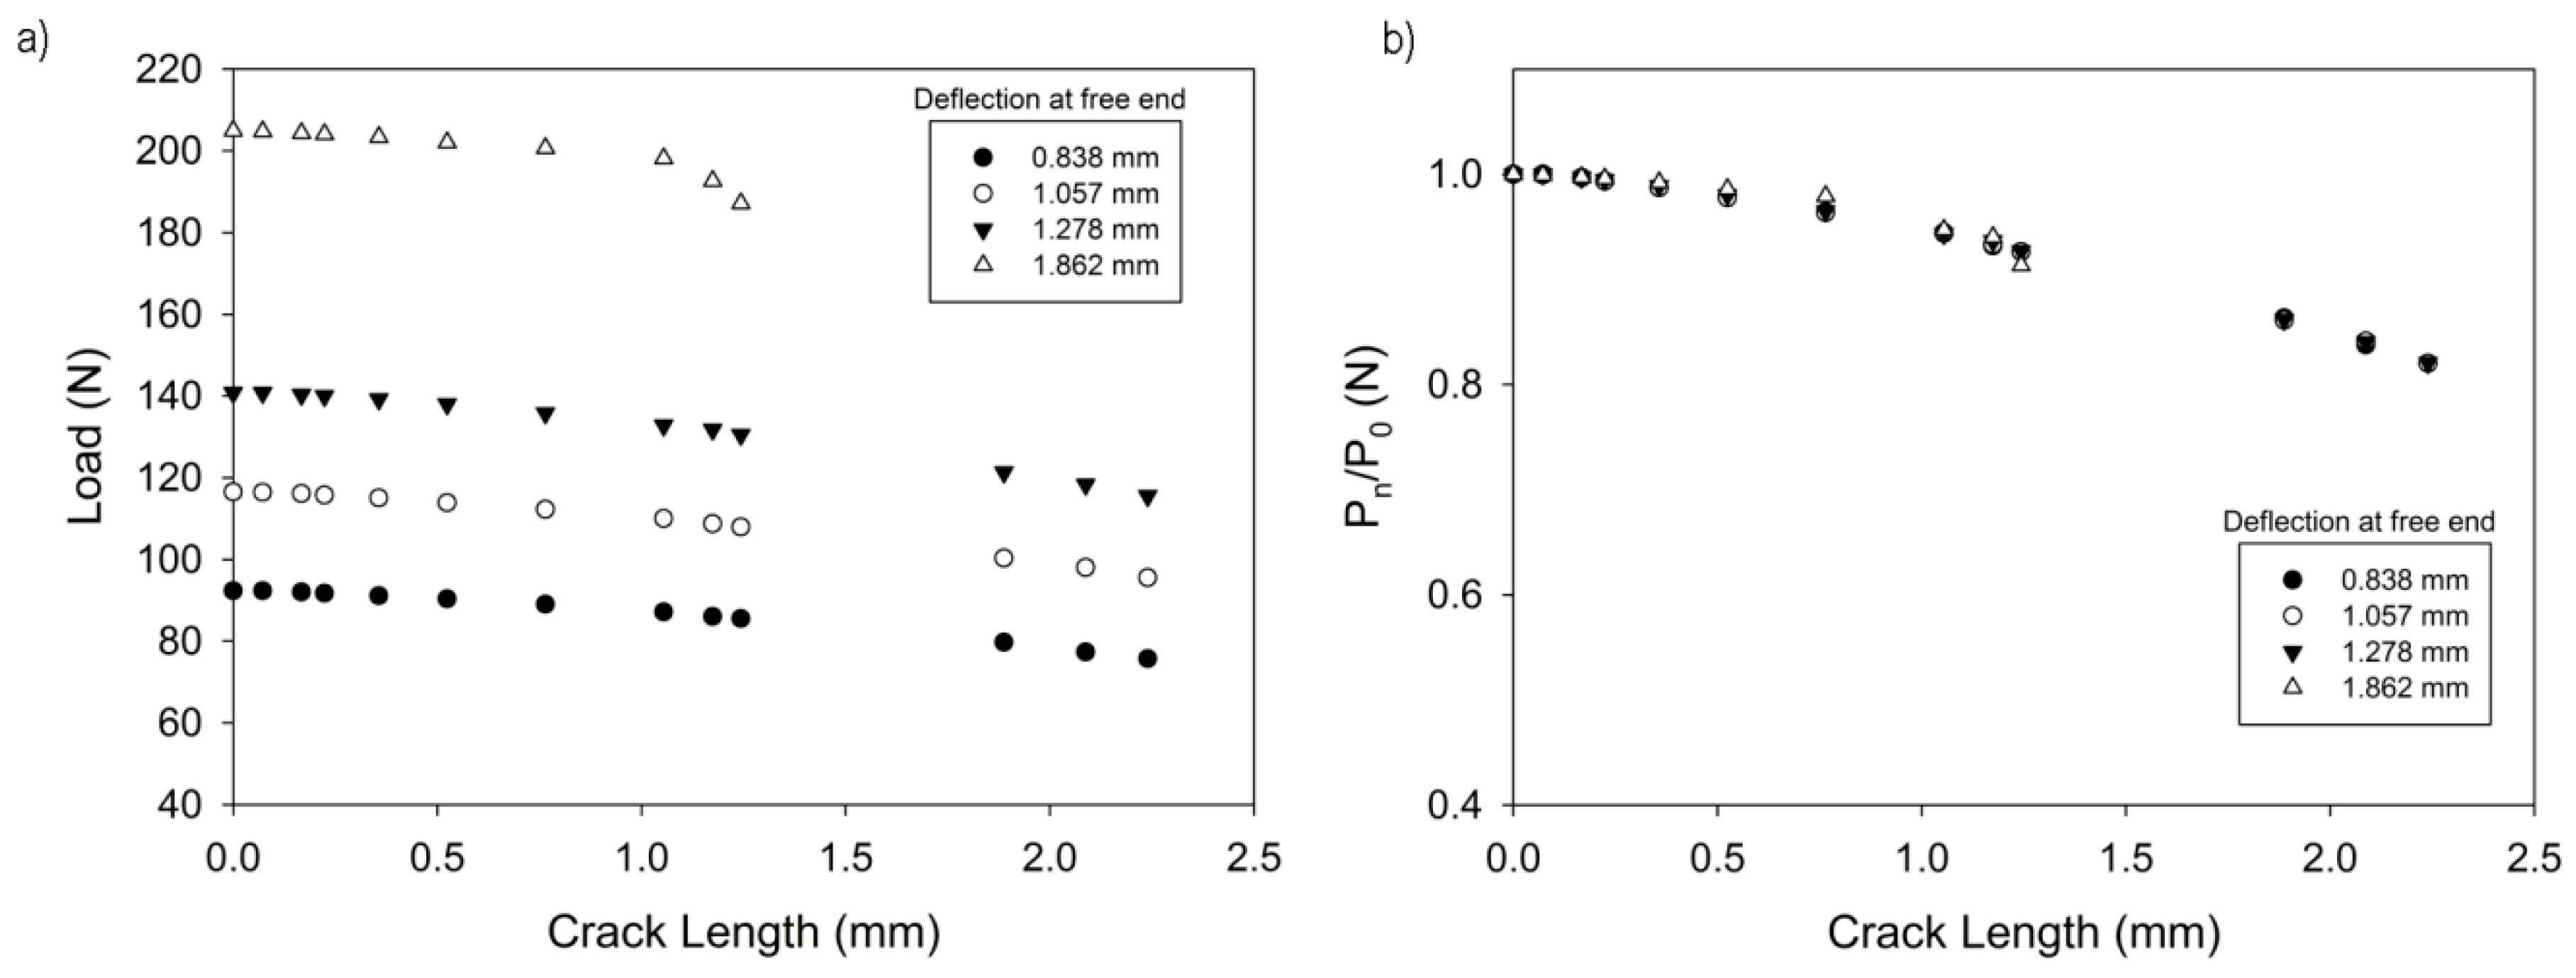
3. Results and Discussion

A typical example of the raw data for the force versus the number of cycles during constant-displacement RBF testing is presented in Figure 5a. The load signal was smoothed using a cubic spline algorithm to reduce the noise produced by the variations in the crack length depending on the angular position, in order to obtain an average load. The applied load at the beginning of each test remained constant then decreased and continued to decrease until the specimen failed at a certain load.
The load is a direct indicator of the crack nucleation and growth. The load change, which is expressed as a percent ([1 − Pn/P0] × 100), is plotted as a function of the cycles to identify the different stages of fatigue. In this example, the initial load remained almost constant until the nucleation of the first microscopic fatigue cracks around the notch-root surface of the specimen (stage I), as indicated by a slight decrease in the percent load change after about 18,000 cycles. After this point, the cracks grew at a relatively slow rate towards the specimen core (stage II); this reduces the net cross section of the specimen, thus reducing the amount of force required to sustain the same deflection. Between cycles 25,000 and 32,000 (approximately), the force reduction was more significant. During this stage, the net cross section of the specimen was reduced so much that significant force relaxation occurred and the overloaded material could no longer withstand the applied stress; this promotes a faster (unstable) cracking (stage III) than in the previous stage. Finally, as the fatigue cracks reached a critical size, after about 35,000 fatigue cycles, the specimen fractured completely.
In both the experimental tests and the simulation, the Pn/P0 ratio was equal to 1 at the beginning of the test; at this time, no cracks were present, so Dn/D0 = 1. Figure 5b shows a third-degree correlation fit between the load ratio and diameter ratio, as measured experimentally and predicted by FEM.
The obtained correlation was then applied to the measured load data to estimate the crack growth during each test. In Figure 6a, the average crack length (m) and the value of da/dn (m/cycle) are shown as functions of the cycle number. It can be seen in Figure 5a that the load ratio is an indicator of the crack growth. In addition, the range of the stress intensity factor was calculated as Δ K = Δ S π a Y using only the Smax value as described in [15,29], where Y is a configuration factor used for a circumferential crack in opening mode I for a long rod, which is calculated as follows:
Y = 1.12 + α ( 1.3 α 0.88 ) 1 0.92 α ,
where α is the normalized crack size, defined as the length of a single crack length over the radius.
The material constants C and the exponent m in the expression da/dn = CK)m, can be obtained from the log‒log plot of ΔK versus da/dn, see Figure 6b.

4. Conclusions

In this paper, a methodology for continuous crack growth estimation based on the rotating bending in a constant deflection system was presented. The measurements were based on the characteristic circle fractures observed in sharp-notched specimens. The fractures were correlated with the fracture load to obtain a relationship between the instantaneous load that must be applied to maintain a constant displacement and the average crack size. A third-degree model was obtained for this testing configuration for steel samples tempered to different strength levels. This correlation is dependent on a material’s elastic modulus rather than its yield strength. By this methodology, the stages of fatigue could be clearly distinguished and analyzed and it is possible to obtain the stress intensity factor and the material constants under these conditions.

Author Contributions

Research design, G.M.-C. and R.M.-S.; testing, G.M.-C.; data analysis, G.M.-C. and D.L.; literature research, R.M.-S. and Y.B.-G.; manuscript writing, D.L. and Y.B.-G.

Funding

Grants UIN18513 & UIN18529 from Universidad de Monterrey.

Acknowledgments

The authors would like to thank Consejo Nacional de Ciencia y Tecnología (CONACYT), Universidad de Monterrey, and Universidad Autónoma de Nuevo León for supporting this research.

Conflicts of Interest

The authors declare no conflict of interest.

List of Symbols

α = Normalized crack size
a = Average crack length
C = Material constant
D = Diameter of the gripped or loaded end of the specimen
D0 = Nominal diameter of the specimen at which the stress is the greatest
Dff = Diameter of the final fracture
Dn = Diameter of the remaining cross section after n cycles
ΔK = Stress intensity factor range
ΔS = Stress range
d = Diameter of the shaft
da/dn = Average crack growth rate
δ = Deflection
E = Elastic modulus
FEM = Finite element modeling
I = Moment of inertia
K = Stress intensity factor
Kt = Stress concentrator
L = Distance between the load and the pivot point
M = Moment
M(y) = Bending moment at the surface of the specimen
m = Material Constant
n = Number of cycles
nf = Number of cycles to failure
P = Load (Force)
P0 = Initial load
Pn = Load at n cycles
POL = Load prior to overloading
Pf = Fracture load
r = Radius at the end of the test section
R = Ratio for cyclic loading (min/max)
RBF = Rotating bending fatigue
S = Stress
Sa = Stress amplitude
SEM = Scanning electron microscope
σnom = Nominal stress
Y = Configuration factor

References

  1. Stephens, R.I.; Fatemi, A.; Stephens, R.R.; Fuchs, H.O. Metal Fatigue in Engineering, 2nd ed.; John Wiley & Sons, Inc.: Hoboken, NJ, USA, 2001; ISBN 978-0-471-51059-8. [Google Scholar]
  2. Manson, S.S.; Halford, G.R. Fatigue and Durability of Structural Materials; ASM International: Materials Park, OH, USA, 2006; ISBN 0871708256. [Google Scholar]
  3. ASM Handbook Vol.19-Fatigue and Fracture; ASM International: Materials Park, OH, USA, 1998; ISBN 0871703858.
  4. ISO 1143:2010 Metallic Materials—Fatigue Testing—Rotating Bar Bending Fatigue Testing; International Organization for Standardization: Geneva, Switzerland, 2010.
  5. JIS Z 2274:1978 Method of Rotating Bending Fatigue Testing of Metals; Japanese Industrial Standards: Tokyo, Japan, 1978.
  6. Eleiche, A.; Megahed, M.; Abd-Allah, N. Low-cycle fatigue in rotating cantilever under bending II: Experimental investigations on smooth specimens. Int. J. Fatigue 1996, 18, 577–592. [Google Scholar] [CrossRef]
  7. Megahed, M.M.; Eleiche, A.M.; Abd-Allah, N.M. Low-cycle fatigue in rotating cantilever under bending I: Theoretical analysis. Int. J. Fatigue 1996, 18, 401–412. [Google Scholar] [CrossRef]
  8. Eleiche, A.M.; Megahed, M.M.; Abd-Allah, N.M. Low-cycle fatigue in rotating cantilever under bending. III: Experimental investigations on notched specimens. Int. J. Fatigue 2006, 28, 271–280. [Google Scholar] [CrossRef]
  9. Pawliczek, R.; Prażmowski, M. Study on material property changes of mild steel S355 caused by block loads with varying mean stress. Int. J. Fatigue 2015, 80, 171–177. [Google Scholar] [CrossRef]
  10. ASTM E647-15e1 Standard Test Method for Measurement of Fatigue Crack Growth Rates; ASTM International: West Conshohocken, PA, USA, 2016.
  11. da Fonte, M.; Reis, L.; de Freitas, M. Fatigue crack growth under rotating bending loading on aluminium alloy 7075-T6 and the effect of a steady torsion. Theor. Appl. Fract. Mech. 2015, 80, 57–64. [Google Scholar] [CrossRef]
  12. De Freitas, M.; Reis, L.; Da Fonte, M.; Li, B. Effect of steady torsion on fatigue crack initiation and propagation under rotating bending: Multiaxial fatigue and mixed-mode cracking. Eng. Fract. Mech. 2011, 78, 826–835. [Google Scholar] [CrossRef]
  13. Jordon, J.B.; Bernard, J.D.; Newman, J.C. Quantifying microstructurally small fatigue crack growth in an aluminum alloy using a silicon-rubber replica method. Int. J. Fatigue 2012, 36, 206–210. [Google Scholar] [CrossRef]
  14. Shin, C.S.; Chen, P. Fatigue crack propagation testing using subsized rotating bending specimens. Nucl. Eng. Des. 2004, 231, 13–26. [Google Scholar] [CrossRef]
  15. Hannemann, R.; Köster, P.; Sander, M. Investigations on crack propagation in wheelset axles under rotating bending and mixed mode loading. Procedia Struct. Integr. 2017, 5, 861–868. [Google Scholar] [CrossRef]
  16. Gandossi, L.; Summers, S.; Taylor, N.; Hurst, R.; Hulm, B.; Parker, J. The potential drop method for monitoring crack growth in real components subjected to combined fatigue and creep conditions: Application of FE techniques for deriving calibration curves. Int. J. Press. Vessels Pip. 2001, 78, 881–891. [Google Scholar] [CrossRef]
  17. Hicks, M.A.; Pickard, A.C. A comparison of theoretical and experimental methods of calibrating the electrical potential drop technique for crack length determination. Int. J. Fract. 1982, 20, 91–101. [Google Scholar] [CrossRef]
  18. Stanzl-Tschegg, S. Very high cycle fatigue measuring techniques. Int. J. Fatigue 2014, 60, 2–17. [Google Scholar] [CrossRef]
  19. Bian, L.-C.; Lim, J.-K. Fatigue life prediction of the plates with an inclined surface crack. Int. J. Fatigue 2003, 25, 521–531. [Google Scholar] [CrossRef]
  20. McFadyen, N.B.; Bell, R.; Vosikovsky, O. Fatigue crack growth of semi-elliptical surface cracks. Int. J. Fatigue 1990, 12, 43–50. [Google Scholar] [CrossRef]
  21. Cai, C.Q.; Shin, C.S. A normalized area-compliance method for monitoring surface crack development in a cylindrical rod. Int. J. Fatigue 2005, 27, 801–809. [Google Scholar] [CrossRef]
  22. Mathieu, F.; Hild, F.; Roux, S. Identification of a crack propagation law by digital image correlation. Int. J. Fatigue 2012, 36, 146–154. [Google Scholar] [CrossRef] [Green Version]
  23. Miscow, G.F.; de Miranda, P.E.V.; Netto, T.A.; Plácido, J.C.R. Techniques to characterize fatigue behaviour of full size drill pipes and small scale samples. Int. J. Fatigue 2004, 26, 575–584. [Google Scholar] [CrossRef]
  24. Hosdez, J.; Witz, J.-F.; Martel, C.; Limodin, N.; Najjar, D.; Charkaluk, E.; Osmond, P.; Szmytka, F. Fatigue crack growth law identification by Digital Image Correlation and electrical potential method for ductile cast iron. Eng. Fract. Mech. 2017, 182, 577–594. [Google Scholar] [CrossRef] [Green Version]
  25. Szata, M.; Lesiuk, G. Algorithms for the estimation of fatigue crack growth using energy method. Arch. Civ. Mech. Eng. 2009, 9, 119–134. [Google Scholar] [CrossRef]
  26. Lesiuk, G.; Szata, M.; Correia, J.A.F.O.; De Jesus, A.M.P.; Berto, F. Kinetics of fatigue crack growth and crack closure effect in long term operating steel manufactured at the turn of the 19th and 20th centuries. Eng. Fract. Mech. 2017, 185, 160–174. [Google Scholar] [CrossRef]
  27. Timoshenko, S. Strength of Materials; CBS Publishers & Distributors: Lancaster, PA, USA, 2004. [Google Scholar]
  28. Pilkey, W.; Pilkey, D. Peterson’s Stress Concentration Factors; Wiley: Hoboken, NJ, USA, 2008. [Google Scholar]
  29. ASTM E647-08: Standard Test Method for Measurement of Fatigue Crack Growth Rates; ASTM International: West Conshohocken, PA, USA, 2008.
Figure 1. Schematic view of the cantilever rotating‒bending fatigue (RBF) testing machine and specimen with a sharp notch.
Metals 09 00275 g001
Figure 2. SEM micrographs of fractures depicting the final overloaded fracture area (circle) and the paths of two ideal cracks (lines). (a) High nominal stress; (b) low nominal stress.
Metals 09 00275 g002
Figure 3. (a) Geometry used in FEM, showing the location of applied load; (b) small crack at notch root; (c) larger crack at the notch root.
Metals 09 00275 g003
Figure 4. (a) Required load to produce certain deflection for different crack lengths determined by FEM; (b) load ratio Pn/P0 at certain deflection.
Metals 09 00275 g004
Figure 5. Load and percentage of load change during testing for a deflection of 1.057 mm (a) and the correlation between the load ratio and diameter ratio (cracking) (b).
Metals 09 00275 g005
Figure 6. Average crack length and crack growth rate behavior as a function of the cycle number (a) and the stress intensity factor range against da/dn (b).
Metals 09 00275 g006
Table 1. Chemical composition of AISI 5160 steel.
Elementwt %
C0.580
Si0.260
Mn0.885
P0.017
S0.016
Cr0.780
Ni0.010
Sr0.013
Ti0.003
FeBalance
Table 2. Fatigue life measured at various stress levels with different tempering temperatures.
Stress Amplitude (MPa)Load (N)Deflection (mm)Cycles to Failure at Different Tempering Temperatures
250 °C350 °C450 °C550 °C
9002051.8623.04 × 1042.21 × 1043.10 × 1042.75 × 104
7501711.546---1.30 × 10⁵
6001411.2781.12 × 1052.16 × 1052.41 × 1054.19 × 105
5801331.202---runout
5001161.057-5.13 × 1051.16 × 106-
4901121.012--runout-
4751090.985-runout--
400920.8384.69 × 105runout--
325750.6788.75 × 105---
290670.606runout---

