Abstract
This contribution presents three-dimensional turning operation simulations exploiting the capabilities of finite element (FE) based software Abaqus/Explicit. Coupled temperature-displacement simulations for orthogonal cutting on an aerospace grade aluminum alloy AA2024-T351 with the conceived numerical model have been performed. Numerically computed results of cutting forces have been substantiated with the experimental data. Research work aims to contribute in comprehension of the end-burr formation process in orthogonal cutting. Multi-physical phenomena like crack propagation, evolution of shear zones (positive and negative), pivot-point appearance, thermal softening, etc., effecting burr formation for varying cutting parameters have been highlighted. Additionally, quantitative predictions of end burr lengths with foot type chip formation on the exit edge of the machined workpiece for various cutting parameters including cutting speed, feed rate, and tool rake angles have been made. Onwards, to investigate the influence of each cutting parameter on burr lengths and to find optimum values of cutting parameters statistical analyses using Taguchi’s design of experiment (DOE) technique and response surface methodology (RSM) have been performed. Investigations show that feed has a major impact, while cutting speed has the least impact in burr formation. Furthermore, it has been found that the early appearance of the pivot-point on the exit edge of the workpiece surface results in larger end-burr lengths. Results of statistical analyses have been successfully correlated with experimental findings in published literature.
1. Introduction
Machining is one of the oldest and most commonly employed manufacturing processes to shape the materials with a high dimensional accuracy and surface finish. However, burr, the undesired sharp material on the finished machined product edges needs to be removed prior to the product’s use for direct function or for further processing. Posts machining deburring processes like mechanical, thermal, electrical, and chemical are generally employed to remove the burrs from various materials and workpiece geometries [1]. Deburring processes increase the product cost and overall production time. Invaluable experimental and numerical efforts have been made in this context to comprehend burr formation mechanisms [2,3], model and predict burr sizes [4,5,6], control burr formation by tool geometry selection and tool path planning [7,8,9,10], and workpiece geometry design [11], etc. Researchers have also used heuristic optimization techniques to optimize various machining parameters like cutting speed, feed rate, depth of cut, tool angles, tool nose radius, etc., to minimize burr formation. Saleem et al. [12] have used artificial neural network (ANN) and Dong et al. [13] have used Taguchi’s design of experiment (DOE) techniques to minimize burr size. Response surface methodology (RSM) and analysis of variance (ANOVA) have been employed by Niknam and Songmene [14] to perform statistical investigation on burrs thickness during milling of aluminum alloys. Sokolowski et al. [4] have used neural networks and fuzzy logic to predict and optimize burr sizes.
Present work aims to provide further comprehension of the end-burr formation process in turning aluminum alloy AA2024-T351, employing the FE-based numerical model. Due to the importance and complex multi-physical nature of metal cutting phenomena the topic has been widely addressed in the literature. Numerous studies to establish numerical and analytical models on various features of the metal cutting models have been made. For example, mechanisms of chip formation have been detailed by Barry and Byrne [15] and Movahhedy et al. [16]. Childs [17] has provided a fundamental knowledge on friction modelling in metal cutting. Molinari et al. have [18,19] presented comprehensive analyses of the contact problems in orthogonal cutting. Comprehensive details on various chip separation criterion including geometry-based approach, fracture-based approach, etc., have been detailed by Guo et al. [20] and Belhadi et al. [21]. Ultimate objective of all studies is to establish machining models, which can efficiently calculate most of the experimental features of interest. In the current work a FE-based numerical cutting model with a simplified orthogonal cutting approach has been established. Though, orthogonal cutting is a study case involving strong simplification when compared to industrial oblique cutting. However, modelling of oblique cutting with complex insert geometries and various chip breakage designs is quite challenging. Often complete edge configurations are not provided in the manufacturer’s catalogue and subsequently precise tactile and optical measurement methods are required to measure accurate tool geometry. Additionally, small variation in edge angles strongly effects chip formation, cutting forces, and process variables like temperature, stress, and strain [22,23]. In this situation, it is somehow difficult to identify significant cutting parameters (cutting speed, cutting feed, etc.,) and their respective contribution in generating results of interest, like cutting force evolution, chip morphology, surface finish, burr formation, residual stresses, etc. On the other hand, orthogonal approach helps to provide a general and fundamental understanding of the process mechanics and may assist in the optimization of tool edge design and optimum cutting parameters selection. Nevertheless, in some unique cutting operations like drilling or for specific measurements like wear measurement on tool nose, etc., orthogonal simplification cannot be made.
Current work aims to contribute in comprehension of the end-burr formation process in turning aluminum alloy AA2024-T351. Multi-physical phenomena concerning material damage, crack propagation, evolution of shear zones (positive and negative), pivot-point appearance, thermal softening, etc., influencing the burr formation have been discussed in length. Statistical investigations, to evaluate the influence of cutting parameters (input factors or controllable factors) including cutting speed (VC), feed rate (f), and tool rake angle (γ) on the computed results of burr lengths (response) have also been performed. In this perspective, initially, a finite element based orthogonal cutting model for turning process has been developed in the Abaqus/Explicit software. In order to validate the computational results (Cutting forces, FC) with the ones obtained by earlier performed straight turning experimentation, similar cutting conditions were adopted in the FE-model. For example, the cutting tool insert profile (Sandvik uncoated carbide insert: CCGX 12 04 08-AL H10), which was originally used in experimentation, was obtained using a scanning electron microscope (SEM). Onwards, this cutting tool profile was incorporated in the conceived geometrical model to perform coupled temperature-displacement cutting simulations. Comprehensive details on orthogonal experimentation including force measuring equipment (Standard dynamometer-Kistler 9257B), data acquisition device (National Instrument NI-4472), and data treatment are detailed in the former work [24].
After acquiring the satisfactory validation of the numerical model, further FE-analyses considering various combination of cutting parameters have been performed and end-burr lengths are computed. Finally, well-established Taguchi’s DOE statistical optimization technique is employed to investigate the optimum cutting parameters in minimizing burr. Analysis of variance (ANOVA) have been performed to identify the most significant cutting parameters and their respective contribution in producing burr. Response surface methodology (RSM) is used to develop a functional relationship model between response (end-burr length) and significant parameters. FEA and statistical investigations were performed by varying cutting speed (VC) from 800 to 1000 m/min, feed rate (f) from 0.3 to 0.4 mm/rev and rake angle (γ) from 5° to 17.5°. It is pertinent to mention that instead of 2D-simulations 3D-orthogonal cutting simulations have been performed. 3D-cutting simulations have helped to quantify the end-burr lengths at various sections of the workpiece along depth of cut (aP) i.e., “middle section of workpiece (Z = 0, Figure 1)”, where only the end burr forms and the “edges of workpiece (Z = ±2, Figure 1)”, where combination of end-burr and poisson-burr forms.
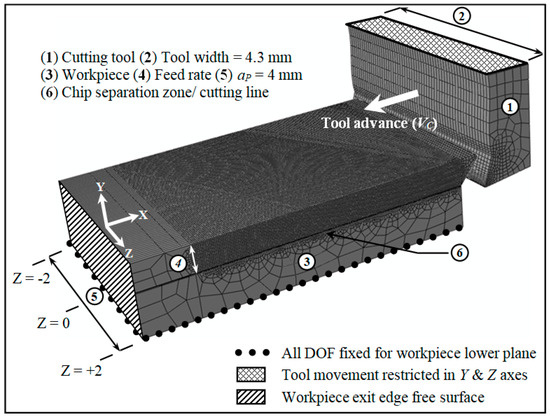
Figure 1.
3D geometrical model and boundary conditions for orthogonal machining.
2. Finite Element Model for Cutting Simulation
2.1. Geometrical Model and Boundary Conditions
Geometrical model for orthogonal cutting operation (insert cutting edge is orthogonal with the feed and cutting speed) realized in Abaqus/Explicit software is shown in Figure 1. During machining, material plasticizes, fractures occur, and chips separates from the workpiece and eventually a new surface (machined workpiece surface) is generated. During the progression of this cutting process, stresses, strains, temperatures, damage and other associated multi-physical phenomena occurs at the tool-workpiece interaction regions. This promotes severe mesh distortions (based on Lagrangian formulation) in the latter regions. To reduce the dynamic contact complexities, mesh distortions at the tool workpiece interaction level and to smooth the chip formation the workpiece is geometrically modeled in three parts. Namely, predefined chip (with specific feed rate, f and depth of cut, aP values), machined part and “chip separation zone”. These parts are assembled through the tie constraint algorithm (Abaqus inbuilt algorithm), thus that they behave like a single identity “workpiece”. The size of the separation zone (30 µm) is of the order of the cutting-edge radius [25]. Thermally coupled continuum brick elements C3D8RT with an average size of 30 µm have been used to mesh the various parts of model. Tool and workpiece kinematic boundary conditions are shown in Figure 1. While conduction is taken as the mode of heat transfer at the tool-workpiece interface.
2.2. Constitutive Model and Chip Separation
To model the material’s behavior, Johnson-cook thermo-elasto-visco-plastic model, Equation (1), is used [26]. Promising results [7,12] show the effectiveness of the chosen stress model.
For Lagrangian based formulations, a chip separation criterion needs to be specified. Various approaches are reported in the literature. Díaz-Álvarez et al. [22] have used the continuous remeshing technique. Guo et al. [20] have used the geometry-based node separation approach. Geometry-based element deletion approach has been adopted by Ramesh [27]. While, the mechanical fracture criterion is employed by Mabrouki et al. [28]. In the present work, chip formation and separation are based on the evolution of ductile fracture. The Johnson-cook shear damage model, Equation (2), has been employed to simulate ductile damage. The damage initiates in finite element when scalar damage parameter (ω), Equation (3), approaches a value of 1. In addition, modelling of the damage evolution and ultimately the fracture, Equation (4), is conceived according to Hillerborg et al. fracture energy proposal [29]. Hillerborg et al. [29] proposed that the fracture energy Gf, required to open a unit area of crack as material property. The approach was proposed for concrete materials, but also provides promising results for ductile materials [28,30] because according to Hillerborg et al. [29], the proposal crack is assumed to propagate when the stress at the crack tip reaches the tensile strength of the material. The equivalent plastic displacement at failure is calculated by Equation (5). Provided material fracture toughness (KC), Equation (6) is used to calculate the fracture energy (Gf). Equations (7) and (8) represent linear and exponential evolution of scalar damage evolution parameter (D) used in chip separation and chip regions, respectively.
Once the damage evolution parameter (D) approaches to a value of one, it is assumed that the element’s stiffness is fully degraded and it can be removed from the mesh. Hence, a coupling between material damage evolution and its fracture energy is used to conceive chip separation from the workpiece body. Further details on the numerical model are elaborated in the recent work of Mabrouki et al. [28]. Material properties and Johnson-cook equations parameters are shown in Table 1 and Table 2, respectively.

Table 1.
Physical properties of tool and workpiece materials [24].
Table 2.
Johnson Cook model parameters for AA2024-T351 (data from [24]).
2.3. Finite Element Formulation
Constitutive equations are solved using the finite element package Abaqus for the given boundary conditions. The displacement FE method takes following form of virtual work statement to meet equilibrium requirements [31].
From Equation (9) non-equilibrium equations can be derived [32].
This represents basic finite element stiffness model and can be written as:
Newton’s method is used to solve nonlinear equations. If is taken as solution after the ith iteration and represents difference between exact and calculated solution, equation will take the following form:
Now using the Taylor series to expand the results about and eliminating the higher order terms, the following form of equation can be written.
where represents the Jacobian matrix. The difference is taken from Equation (13) and the next solution is then calculated by the following relation.
The process continues till convergence of the solution. Values of and are taken sufficiently small to ensure the convergence.
2.4. Thermal Aspects
In machining, a substantial amount of heat is generated due to plastic deformation and frictional contact at the tool-chip interface. Due to variable combinations of materials, speed and feed, the temperatures at tool-chip interface are quite higher and can considerably influence in changing the flow stress conditions at tool-chip interaction level and sticking-slipping contact [18,19]. Additionally, mechanical and physical properties of materials change substantially at higher cutting temperatures. Coupled temperature-displacement calculations are exploited, therefore, as thermal and mechanical solutions greatly affect each other. The heat generation due to plastic deformation and friction is modelled as a volume heat flux. Heat conduction is taken as a mode of heat transfer, which occurs within the workpiece material and at the tool-chip interface. For a local temperature rise of ΔTP (due to inelastic work) in the workpiece during a period of time Δt, the heat generation rate due to inelastic work, is as below.
where is the heat generation rate due to plastic deformation and is the inelastic heat fraction, also called the Taylor–Quinney empirical constant, is usually taken equal to 0.9 [18,19,21]. The heat generated by friction forces induces a rise in temperature ΔTf during a period of time of Δt. The fraction of dissipated energy caused by friction is assumed to be equal to 1. From the fraction , an amount of heat J remains in chip and (1 − J) is conducted to the tool. For the present model a default value of J = 0.5 is used [18,19,21]. The volumetric heat flux corresponding to friction is as below.
The shear stress is given by the friction law and is the slip strain rate. The steady state, three-dimensional form of energy equation is given by Equation (17).
Backward difference scheme is used to integrate temperatures and Newton’s method is used to solve the coupled system.
2.5. Friction Law
Friction characteristics at the tool-chip interface are difficult to determine since it is influenced by many factors such as local cutting speed, local contact pressure, temperature, tool and workpiece material, and geometry [17,18]. Various friction models have been proposed in the literature [17,18,33]. The models are mainly based on the classic Coulomb’s fiction law or the extended Coulomb’s law, commonly known as Zorev’s friction model. To model the friction between the tool and workpiece most commonly employed, Coulomb’s fiction law has been adopted in the current study.
3. FEA Results and Discussion
Three dimensional orthogonal cutting simulations for eight different parametric combinations of cutting speed (VC = 800 m/min and 1000 m/min), feed rate (f = 0.3 mm/rev and 0.4 mm/rev) and tool rake angle (γ = 5° and 17.5°) have been performed to predict the end-burr lengths. Depth of cut (aP), was kept constant to 4 mm. Numerical results of cutting forces (FC) are compared with the experimental ones (Table 3). A good corroboration of experimental and numerical results has been found. As shown in Table 4, the computed results of the end-burr length measured along x-axis at Z = 0 (middle section of workpiece) for all parametric combinations of feed, speed, and rake angles (total 8 tests).
Table 3.
Cutting forces for VC = 800 m/min, γ = 17.5°, aP = 4 mm.
Table 4.
Numerically computed end-burr lengths (mm) for various cutting parameters.
Figure 2 presents the plots of numerically computed values of cutting forces FC (a), nodal temperatures NT (b), and some other important measures including the distance of the pivot-point (measured along negative y-axis) from the workpiece exit edge (c), tool distance from workpiece exit edge at pivot-point appearance time (d), and the tool distance from the workpiece exit edge at full development of fracture in the “chip separation zone” far ahead of the tool tip (e). The forthcoming discussion on burr formation will highlight the importance of these measures in burr initiation and eventually end-burr growth phenomena.
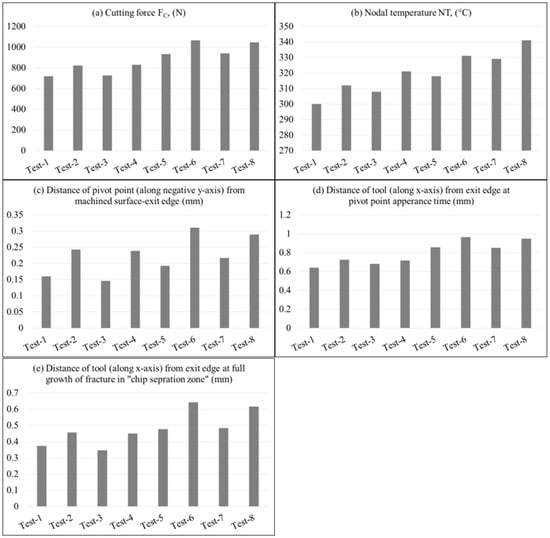
Figure 2.
Computed results of various parameters for multiple combinations of cutting speed, feed rate, and rake angle (a) cutting force (b) nodal temperature (c) distance of pivot point (along negative y-axis) from machined surface exit edge (d) distance of tool (along x-axis) from exit edge at pivot point appearance time (e) distance of tool (along x-axis) from exit edge at full growth of fracture in “chip separation zone”.
In the normal course of cutting, the tool advances in the cutting direction, workpiece material deforms plastically (formation of primary and secondary shear zones), fracture initiates around the tool tip and propagates along cutting line, chip separates from workpiece, and a new machined surface is generated. However, as the tool approaches near the exit end of the workpiece, material also starts deforming plastically in the vicinity of the exit end of workpiece material. Later, it is caused by the bending load produced at the exit end of the workpiece due to the free-surface (see free-surface in Figure 1) material flow (initiation of end-burr) in the direction of cutting due to the tool’s continuous advancement in the cutting direction. Location of this new plastic zone below the machined surface depends on various cutting parameters and cutting tool’s geometry. A “pivot-point” is usually described on workpiece exit end to locate large deformation point in this plastic zone below the machined surface 2. This plastic zone developed around the pivot-point (called the negative shear zone) grows towards the cutting line and meets the primary shear zone. This facilitates the flow of material in the direction of cutting towards the exit end (end-burr development) and on also promotes the early formation and development of the fracture along the cutting line ahead of the tool tip in the “chip separation zone”. Eventually, material escapes cutting and boot type chip along with end-burr being formed.
3.1. Effect of Feed on End-Burr Formation (at Section Z = 0)
Figure 3 shows the plots of the end-burr lengths measured along the x-axis for different parametric combinations of feed, speed, and rake angles. Increase in the feed has resulted in augmentation of burr. Maximum and minimum burr lengths have been generated in test-6 and test-3 (Table 4), respectively. As the feed is increased from 0.3 to 0.4 (≈ 33% increase), burr increased in a range of 52% (minimum) to 66% (maximum) with various combinations of cutting speeds and rake angles. All plots in Figure 3 shows a linear relationship, which could be misrepresentative with limited data points. More data points (more combinations of feed, speed and rake angles) need to be tested. However, as limited experimental data (for comparison) are available, therefore, few combinations (in total 8) of feed, speed, and rake angles have been tested. Nevertheless, an approximately linear trend of increase in burr length as function of cutting-edge radius has also been reported by Wu et al. [34]. The experimental work by Niknam and Songmene [14] on measurements of exit-burr lengths for milling of aluminum alloys also shows linear trends in burr formation as a function of speed, feed, and depth of cut.

Figure 3.
Effect of the cutting feed on end burr lengths measured along the x-axis at Z = 0 (middle section along depth of cut) (a) VC = 800 m/min, γ = 17.5° (b) VC = 1000 m/min, γ = 17.5° (c) VC = 800 m/min, γ = 5° (d) VC = 1000 m/min, γ = 5°.
Figure 4 shows the Von-mises stresses in plastic zone only for test-3 (which resulted in minimum burr formation) and test-6 (which resulted in maximum burr formation) of cutting parameters at the cutting time when the “pivot-point” appears at the exit edge of workpiece. It can be figured out that the plastic zone (as result of primary and negative shear zones) is more expanded and widened (test-6, Figure 4b) at a higher feed of 0.4 mm/rev. More expanded and widened plastic zone on one hand requires a higher energy dissipation leading to higher cutting forces, and on the other hand, causes early and further away (from machined surface) appearance of pivot-points along the negative y-axis at the exit edge of the workpiece. More expanded and widened plastic zone also promotes the early formation and development of fracture along the cutting line far ahead of the tool tip [25] in the “chip separation zone” as shown in Figure 5b, and results in higher cutting temperatures (Figure 6). This facilitates the flow of the material towards the workpiece exit (end burr) and causes the material to escape from the cutting process and formation of the boot type chip (Figure 5).

Figure 4.
Von-mises stresses at Z = 0 (a) VC = 1000 m/min, f = 0.3 mm/rev, γ = 17.5° (b) VC = 800 m/min, f = 0.4 mm/rev, γ = 5°.
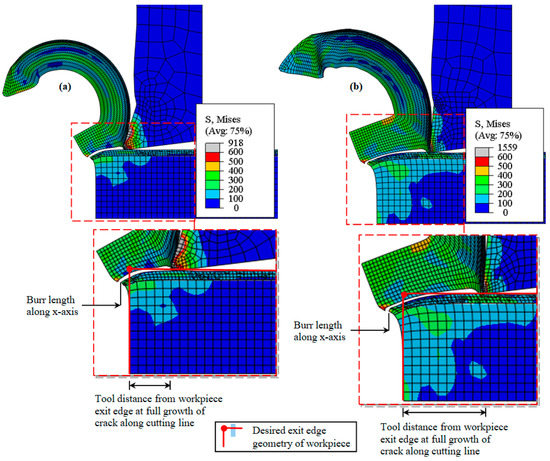
Figure 5.
Boot type chip and end burr formation at Z = 0 (a) VC = 1000 m/min, f = 0.3 mm/rev, γ = 17.5° (b) VC = 800 m/min, f = 0.4 mm/rev, γ = 5°.
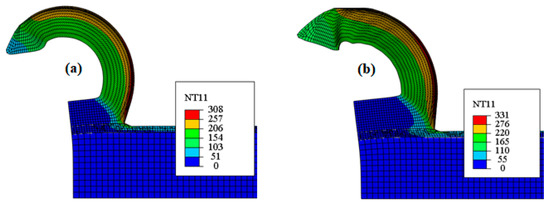
Figure 6.
Nodal temperature (°C) distribution at Z = 0 (a) VC = 1000 m/min, f = 0.3 mm/rev, γ = 17.5° (b) VC = 800 m/min, f = 0.4 mm/rev, γ = 5°.
It is worth mentioning that an increase in feed has resulted in a more expanded and widened plastic zone (as depicted by a minimum increase of 25% in cutting forces, Figure 2). Whereas, a maximum of 6% increases in nodal temperatures was figured out (Figure 2). This shows that the expanded and widened plastic zone is the leading phenomena in enhancing the end burr formation rather than thermal softening.
3.2. Effect of Rake Angle on End-Burr (at Section Z = 0)
Figure 7 shows the plots of burr lengths for various parametric combinations of feed, speed, and rake angles. Decrease in rake angle has promoted an increase in burr lengths. As the rake angle, γ, was decreased from 17.5° to 5° (≈70% decrease), the end burr has been increased in a range of 15% (minimum) to 24% (maximum) with various combinations of cutting speed and feed. Furthermore, a minimum increase of 11% in cutting forces (Figure 2) and a maximum of 4% increases in nodal temperatures was figured out (Figure 2). This shows that a decrease in rake angle also promotes the expansion and widening of the plastic zone leading to enhancement of the burr formation, as previously noticed for the feed case.
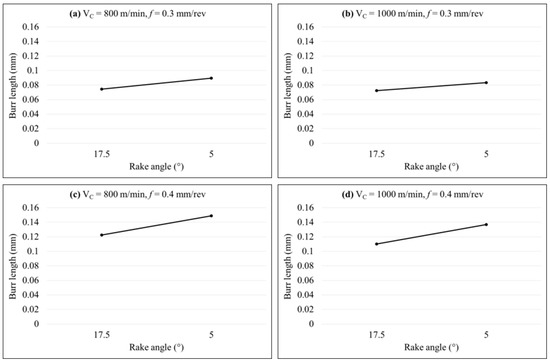
Figure 7.
Effect of rake angle on end burr lengths along x-axis at Z = 0 (mid-section along depth of cut) (a) VC = 800 m/min, f = 0.3 mm/rev (b) VC = 1000 m/min, f = 0.3 mm/rev (c) VC = 800 m/min, f = 0.4 mm/rev (d) VC = 1000 m/min, f = 0.4 mm/rev.
3.3. Effect of Speed on End-Burr (at Section Z = 0)
Figure 8 shows the computed results of end burr lengths measured along the x-axis for various parametric combinations of feed, speed, and rake angles. Decrease in the cutting speed has promoted the formation of end burr. As cutting speed decreases from 1000 to 800 m/min (≈20% decrease), burr increases in a range of 2.7% to 11% with various combinations of feed rate and rake angles. This shows that the variation of cutting speed has the least effect on burr formation in comparison to feed and rake angle. Niknam and Songmene [14] has also reported similar results during milling of aluminum alloys.
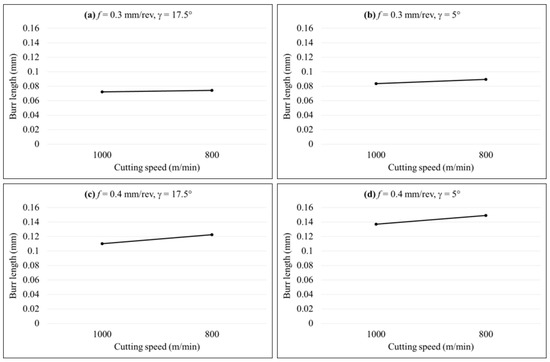
Figure 8.
Effect of cutting speed on end burr lengths along the x-axis at Z = 0 (a) f = 0.3 mm/rev, γ = 17.5° (b) f = 0.3 mm/rev, γ = 5° (c) f = 0.4 mm/rev, γ = 17.5° (d) f = 0.4 mm/rev, γ = 5°.
3.4. Burr Formation on Workpiece Edges (at Section Z = ±2)
As tool advances in the cutting direction (along x-axis) material deforms and flows in the similar direction (along x & y axes). However, some material also flows towards the workpiece edges along the z-axis (out of plane deformation) leading to side burr or poisson burr formation [7,8]. Therefore, around the central section of the workpiece (at Z = 0) purely end burr is formed, while near the edges (at Z = ±2), some material flows out of the plane along the z-axis, thus, a combination of end and poisson burr is formed. Consequently, a decrease in end burr near edges (at Z = ±2) can be figured out in Figure 9. However, the trends of increase or decrease in burr with different combinations of cutting speed, feed rate, and rake angle are similar to that found at the middle section (at Z = 0 in Table 4).
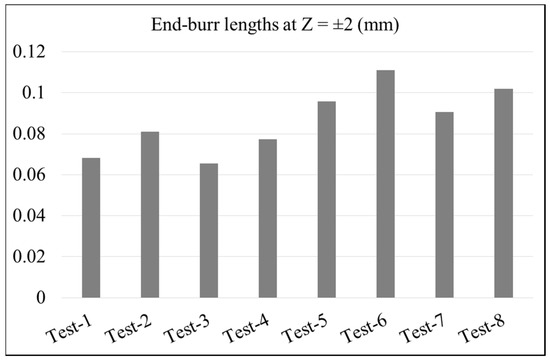
Figure 9.
End burr quantification at workpiece edge (at Z = ±2) for different parametric combinations of cutting speed, feed rate and rake angle.
4. Statistical Analysis and Optimization
The previous section provides comprehensive details on end-burr initiation and growth process considering the FEM approach. Plausible roles of various cutting parameters (VC, f and γ) and associated multi-physical phenomena, like temperature, shear zones, pivot-point location, and development of fracture along the cutting line far ahead of the tool tip, etc., on burr formation are discussed. However, the following points of interest, especially from a production engineer point of view, are still either unclear and need more explanation, or altogether un-answered:
- Which process parameters (VC, f and γ) have a major/minor effect in producing pronounced end-burr.
- What is the optimum combination of process parameters to minimize the burr lengths?
- Which of the previously discussed phenomena including temperature, cutting force evolution, pivot-point appearance time, pivot-point location, etc., have direct or more conspicuous relation with the burr formation process?
- Can a functional relationship between response (burr length) and process parameters be established?
In order to address the above mentioned quality characteristics of burr formation processes, well known and powerful statistical techniques of design of experiment (DOE) applying Taguchi’s methodology and response surface methodology (RSM) are employed.
4.1. Burr Optimization Using Taguchi’s Methodology
In order to investigate the influence of process control factors (VC, f and γ) on output response (end burr length), the “smaller-the-better” quality criterion has been employed for each of the data mean (actual burr lengths computed in 8 tests as per Table 4) and signal-to-noise ratio (S/N) responses in Taguchi’s DOE. Equation (18) is used as a governing equation to calculate signal-to-noise ratio (S/N) as per the quality criterion.
where yi represents the response or performance value of the ith test and n is the number of repetition of tests. Each process control factor has two levels of variations (VC = 800 and 1000 m/min, f = 0.3 and 0.4 mm/rev and γ = 5° and 17.5°). Plots of main effects of S/N ratio (Figure 10a) and data mean (Figure 10b) presents the optimum values of process control factors to minimize the burr. The optimum parameters are: VC = 1000 m/min, f = 0.3 mm/rev, γ = 17.5°.
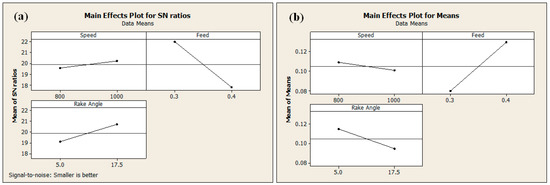
Figure 10.
Variation of signal to noise (S/N) ratios (a) and data means (b) as a function of cutting parameters (VC, f and γ).
Results of Table 5 show that feed is the most, and speed is the least influential factor in burr formation. This finding is in good corroboration with the experimental measurements of Niknam and Songmene [14] of exit-burr lengths for milling of aluminum alloys.
Table 5.
Response table for S/N ratios.
Taguchi’s method of DOE emphasis on performing a confirmation test to check the validity of the predicted burr (at optimum values of process control factors) and actually produced burr. For this purpose the following expression was employed.
where (S/N)m is the mean of all the S/N ratios and (S/N)i is S/N ratio at the optimum level of ith parameter. Now, by employing the above expression, (S/N) predicted = 23.105 for optimal combination of parameters. While Equation (18) was used to calculate the predicted value of burr length (0.0699 mm). Actual burr produced with optimal values of process parameters (VC = 1000, f = 0.3, γ = 17.5°: Test-3) is 0.0723 mm. The calculated error of 3.3% shows a good agreement between the predicted burr (0.0699 mm) and actual burr (0.0723 mm).
4.2. RSM Based Statistical Analysis
To approximate the functional relationship between burr and control factors, a first order multiple regression model (Equation (20)) was used. The developed model is given by Equation (21).
where β0 is constant, βi is coefficient of linear term, xi is explicative variable (control factor) and ε is random error.
To check the properness of the above proposed model and to determine the contribution of each control factor in burr formation, analysis of variance (ANOVA) have been performed. Following terms are summarized in ANOVA Table 6.
where N: Is total number of tests, nf: Is level of each factor, : Is the mean of response and : Is the mean of response at each level of respective factor.
where DFi is degree of freedom of respective factor.
where SST is total sum of squares.
Table 6.
ANOVA results for end-burr.
Minitab software was used to perform ANOVA. Analysis for 95% confidence level (i.e., significance level: 5%) has been performed. Based on the Fisher coefficient value (F-value), remarks (significant or insignificant) for each of the factors are made. Probability value (P-value) of all factors except speed are <0.05. This shows the significance of the regression model (Equation (21)) and contributing factors terms. Multiple correlation factor, R2 and adjusted R2 values for the proposed model (Equation (21)) are 97.8% and 96.2%, respectively. This confirms a good correlation between the model’s predicted burr length values and actual values of end-burr lengths. Table 6 also shows that feed has the highest contribution (82.4%) in producing burr and the angle has a 13.2% contribution. Whereas speed has the least effect at 2.2% in generating end-burr in aluminum alloy machining. Similar experimental findings have been reported by Niknam and Songmene [14].
Finally, to find any possible correlation of the control factors with other computed parameters (listed in Figure 2, like temperature, force, pivot-point location, etc.,), which could possibly match with the proposed model (Equation (21) and Table 6), an ANOVA for each of these parameters (considering them as response or target function) has been made. Results are shown in Table 7, Table 8, Table 9, Table 10 and Table 11.
Table 7.
ANOVA results for the nodal temperature.
Table 8.
ANOVA results for cutting force.
Table 9.
ANOVA results for the pivot-point distance from machined surface.
Table 10.
ANOVA results for the tool distance from exit edge at pivot-point appearance time.
Table 11.
ANOVA results for the tool distance from exit edge at full growth of fracture in separation zone.
It can be deduced by the results of Table 10 (ANOVA for “tool distance from exit edge at pivot-point appearance time”) that the % contribution of the control variables of speed (0.02%), feed (85.7%), and rake angle (12.48 %) on this parameter are quite similar to their contribution in producing burr (Table 6). This helps to conclude that the early formation of pivot-point (at higher feed values) is a strong indication that end-burr lengths will be higher. Hashimura and Dornfeld [2] have also pointed in their experimental investigation in aluminum alloy orthogonal cutting that as feed increases, the pivot-point appears earlier in the tool motion and leads to lager burr lengths.
5. Conclusions
Experimental investigations-based research findings are always acknowledged and welcomed in the machining industry. However, experimental techniques and measurements methods are costly and time consuming. Alternate research methodologies including molecular dynamics (MD), FEM, etc., are now well-established and provide reliable research results. The present work is based on an FEM approach to investigate the influence of cutting parameters on end-burr formation in machining aeronautic aluminum alloy AA2024. The Burr formation mechanism and associated multi-physical phenomena including shear zones development, fracture evolution, and cutting temperatures, etc., are discussed in length, which otherwise are difficult to record experimentally. In addition, advanced statistical analyses methods of DOE, ANOVA, and RSM are employed to identify the optimum cutting parameters (from multiple combinations of cutting speed, feed, and tool rake angle) in minimizing end-burr and most influential cutting parameter in generating burr. The RSM-based mathematical model to predict burr is also presented. Research findings are concluded as below:
- End-burr is the only type of burr produced on the exit edge in the middle sections of the workpiece. While additionally, poisson-burr is generated on the corner sections of the workpiece.
- As tool advances and approaches near workpiece end, negative shear zone appears at the workpiece exit edge and continuously propagates to meet the primary shear zone. The shear zone widened and material continuously flows towards the workpiece edges (due to tool advancement) to eventually produce end-burr.
- Numerical simulations and statistical analyses for various combinations of cutting speed, feed, and tool-rake angle are made. Optimum cutting parameters (within the tested range of parameters) to minimize burr are identified. It has been figured out that the lower feed, larger rake angle (more positive rake angle), and higher cutting speeds helps to decrease burr. Feed is found to be the most influential factor (contribution: 82%), while speed has the least effect (contribution: 2%) in producing burr. Whereas, rake angle has a 13% contribution in generating burr.
- As feed increases, the pivot-point (large deformation point in negative shear zone) appears earlier in the cutting process and far below the workpiece surface and longer burr lengths are produced.
- To predict burr lengths in machining of AA2024, a multiple regression model with acceptable accuracy (multiple correlation factor, R2 = 97.8%) has been proposed.
Author Contributions
Conceptualization, M.A.; formal analysis, H.I. and W.S.; methodology, A.M. and Z.A.; validation, T.M.; writing—original draft, M.A.; writing—review and editing, H.I.
Funding
This research received no external funding.
Conflicts of Interest
The authors declare no conflict of interest.
Notations
| A | Initial yield stress (MPa) |
| aP | Cutting depth or axial depth of cut (mm) |
| B | Hardening modulus (MPa) |
| C | Strain rate dependency coefficient |
| Cp | Specific heat (J·kg−1·°C−1) |
| Difference between current and the exact solution | |
| D | damage evolution parameter |
| D1…D5 | Coefficients of Johnson-Cook material shear failure initiation criterion |
| E | Young’s modulus (MPa) |
| f | Feed rate (mm/rev) |
| FN | Force component conjugate to the Nth variable, N |
| FN after ith iteration | |
| F | Body force per unit volume N/m3 |
| fT | Transpose of f |
| Gf | Fracture energy (N/m) |
| KC I, II | Fracture toughness () for failure mode I and mode II |
| Jacobian matrix | |
| m | Thermal softening coefficient |
| n | Work-hardening exponent |
| NN | Interpolation functions |
| Transpose of NN | |
| P | Hydrostatic pressure (MPa) |
| Heat generation rate due to plastic deformation W/m3 | |
| Heat generation rate due to friction W/m3 | |
| S | Surface bounding volume V, m2 |
| Г | Surface traction per unit area, N/m2 |
| ГT | Transpose of Г |
| T | Temperature at a given calculation instant (°C) |
| Tm | Melting temperature (°C) |
| Tr | Room temperature (°C) |
| Equivalent plastic displacement (mm) | |
| Equivalent plastic displacement at failure (mm) | |
| uM | Value of the Mth variable |
| VC | Cutting speed (m/min) |
| V | Volume occupied by body m3 |
| V0 | Reference Volume m3 |
| Stress, MPa | |
| Johnson-Cook equivalent stress (MPa) | |
| Yield stress (MPa) | |
| τc | Material stress, MPa |
| Stress triaxiality | |
| Equivalent plastic strain | |
| Plastic strain rate (s−1) | |
| Reference strain rate (10−3 s−1) | |
| Equivalent plastic strain at failure | |
| Equivalent plastic strain increment | |
| Plastic strain at damage initiation | |
| δD | Virtual strain rate (s−1) |
| δu | Virtual velocity field (m/sec) |
| βN | Strain variation |
| Inelastic heat fraction | |
| Frictional work conversion factor | |
| ω | Damage initiation criterion |
| ν | Poisson’s ratio |
| α | Expansion coefficient (µm·m−1°C−1) |
| λ | Thermal conductivity (W·m−1°C−1) |
| ρ | Density (kg/m3) |
| γ | Rake angle (degrees) |
| ANOVA | Analysis of variance |
| DOE | Design of experiment |
| RSM | Response surface methodology |
| DF | Degrees of freedom |
| MS | Mean squares (variance) |
| SS | Sum of squares |
| PP | Percent contribution |
| P-value | Probability of significance |
| F-value | Fisher coefficient (variance ratio) |
References
- Aurich, J.C.; Dornfeld, D.A.; Arrazola, P.J.; Frankea, V.; Leitza, L.; Min, S. Burrs—Analysis, control and removal. CIRP Ann Manuf Tech. 2009, 58, 519–542. [Google Scholar] [CrossRef]
- Hashimura, M.; Dornfeld, D.A. Analysis of burr formation mechanism in machining process. Soc. Manuf. Eng. 1995, MR98-178, 1–14. [Google Scholar]
- Leopold, J.; Neugebauer, R.; Löffler, R.M.; M Schwenck, M.; Hänle, P. Influence of coating substrate systems on chip and burr formation in precision manufacturing. Proc. Imechepart B J. Eng. Manuf. 2006, 220, 499–506. [Google Scholar] [CrossRef]
- Sokolowski, A.; Narayanaswami, R.; Dornfeld, D.A. Prediction of burr size using neural networks and fuzzy logic. In Proceedings of the Japan-USA Symposium on Flexible Automation, ISCIE, Kobe, Japan, 11–18 July 1994; pp. 889–896. [Google Scholar]
- Kizhakken, V.; Mathew, J. Modeling of burr thickness in micro-end milling of Ti6Al4V. Proc. IMechE Part B J. Eng. Manuf. 2018. [Google Scholar] [CrossRef]
- Dong, D.; Song, J.; Yu, D.; Chen, M. Finite element analysis of burr formation and an automatic online micro-deburring method in precise end-face grinding process. Proc. Imechepart B J. Eng. Manuf. 2017, 231, 2495–2503. [Google Scholar] [CrossRef]
- Asad, M.; Ijaz, H.; Khan, M.A.; Mabrouki, T.; Saleem, W. Turning modeling and simulation of an aerospace grade aluminum alloy using two-dimensional and three-dimensional finite element method. Proc. Imeche Part B J. Eng. Manuf. 2014, 228, 367–375. [Google Scholar] [CrossRef]
- Asad, M.; Naeem, A.A.; Ashraf, S.R.; Rabbani, T. A numerical approach on the design of a sustainable turning insert. Proc. Pak. Acad. Sci. 2017, 54, 339–345. [Google Scholar]
- Chu, C.H.; Dornfeld, D.A. Tool path planning for avoiding exit burrs. J. Manuf. Process 2000, 2, 116–123. [Google Scholar] [CrossRef]
- Koklu, U.; Basmaci, G. Evaluation of Tool Path Strategy and Cooling Condition Effects on the Cutting Force and Surface Quality in Micromilling Operations. Metals 2017, 7, 426. [Google Scholar] [CrossRef]
- Min, S.; Dornfeld, D.A.; Nakao, Y. Influence of exit surface angle on drilling burr formation. J. Manuf. Sci. Eng. 2003, 125, 637–644. [Google Scholar] [CrossRef]
- Saleem, W.; Zain-ul-abdein, M.; Ijaz, H.; Mahfouz, A.S.B.; Ahmed, A.; Asad, M.; Mabrouki, T. Computational Analysis and Artificial Neural Network Optimization of Dry Turning Parameters—AA2024-T351. Appl. Sci. 2017, 7, 642. [Google Scholar] [CrossRef]
- Karnik, S.R.; Gaitonde, V.; Davim, J.P. Integrating Taguchi principle with genetic algorithm to minimize burr size in drilling of AISI 316L stainless steel using an artificial neural network model. Proc. Imechepart B J. Eng. Manuf. 2007, 221, 1695–1704. [Google Scholar] [CrossRef]
- Niknam, S.A.; Songmene, V. Statistical investigation on burrs thickness during milling of 6061-T6 aluminium alloy. In Proceedings of the CIRP, 1st International Conference on Virtual Machining Process Technology, Montreal, QC, Canada, 28 May–1 June 2012. [Google Scholar]
- Barry, J.; Byrne, G. The mechanisms of chip formation in machining hardened steels. J. Manuf. Sci. Eng. 2002, 124, 528–535. [Google Scholar] [CrossRef]
- Movahhedy, M.R.; Gadala, M.S.; Altintas, Y. FE modeling of chip formation in orthogonal metal cutting process: An ALE approach. Mach. Sci. Technol. 2000, 4, 15–47. [Google Scholar] [CrossRef]
- Childs, T.H.C. Friction modelling in metal cutting. Wear 2006, 260, 310–318. [Google Scholar] [CrossRef]
- Molinari, A.; Cheriguene, R.; Miguelez, H. Contact variables and thermal effects at the tool–chip interface in orthogonal cutting. Int. J. Solids Struct. 2012, 49, 3774–3796. [Google Scholar] [CrossRef]
- Molinari, A.; Cheriguene, R.; Miguelez, H. Numerical and analytical modelling of orthogonal cutting: The link between local variables and global contact characteristics. Int. J. Mech. Sci. 2011, 53, 183–206. [Google Scholar] [CrossRef]
- Guo, Y.B.; Dornfeld, D.A. Finite element modeling of burr formation process in drilling 304 Stainless Steel. J. Mfg Sci. Eng. 2000, 122, 612–619. [Google Scholar] [CrossRef]
- Belhadi, S.; Mabrouki, T.; Rigal, J.F.; Boulanouar, L. Experimental and numerical study of chip formation during a straight turning of hardened AISI 4340 steel. Proc. Imechepart B J. Eng. Manuf. 2005, 219, 515–524. [Google Scholar] [CrossRef]
- Díaz-Álvarez, J.; Cantero, J.L.; Miguélez, H.; Soldani, X. Numerical analysis of thermo mechanical phenomena influencing tool wear in finishing turning of Inconel 718. Int. J. Mech. Sci. 2014, 82, 161–169. [Google Scholar] [CrossRef]
- Yen, Y.C.; Jain, A.; Altan, T. A finite element analysis of orthogonal machining using different tool edge geometries. J. Mater. Process. Technol. 2004, 146, 72–81. [Google Scholar] [CrossRef]
- Asad, M. Elaboration of Concepts and Methodologies to Study Peripheral Down-Cut Milling Process from Macro-to-Micro Scales. Ph.D. Thesis, INSA de Lyon, Villeurbanne, France, 2010. [Google Scholar]
- Subbiah, S.; Melkote, S.N. Effect of finite edge radius on ductile fracture ahead of the cutting tool edge in micro-cutting of Al2024-T3. Mater. Sci. Eng. A 2008, 474, 283–300. [Google Scholar] [CrossRef]
- Johnson, G.R.; Cook, W.H. Fracture characteristics of three metals subjected to various strains, strain rates, temperatures and pressures. Eng. Fract. Mech. 1985, 21, 31–48. [Google Scholar] [CrossRef]
- Ramesh, A. Prediction of Process-Induced Microstructural Changes and Residual Stresses in Orthogonal Hard Machining. Ph.D. Dissertation, Georgia Institute of Technology, Atlanta, GA, USA, 2002. [Google Scholar]
- Mabrouki, T.; Courbon, C.; Zhang, Y.; Rech, J.D.; Asad, M.; Hamdi, H.; Belhadi, S.; Salvatore, F. Some insights on the modelling of chip formation and its morphology during metal cutting operations. Compt Rendu Mec. 2016, 344, 335–354. [Google Scholar] [CrossRef]
- Hillerborg, A.; Modéer, M.; Petersson, P.E. Analysis of crack formation and crack growth in concrete by means of fracture mechanics and finite elements. Cem. Concr. Res. 1976, 6, 773–782. [Google Scholar] [CrossRef]
- Ijaz, H.; Zain-ul-abdein, M.; Saleem, W.; Asad, M.; Mabrouki, T. Numerical simulation of the effects of elastic anisotropy and grain size upon the machining of AA2024. Mach. Sci. Technol. 2018, 22, 522–542. [Google Scholar] [CrossRef]
- Figiel, L.; Kaminski, M. Numerical probabilistic approach to sensitivity analysis in a fatigue delamination problem of a two layer composite. Appl. Math. Comput. 2009, 209, 75–90. [Google Scholar] [CrossRef]
- Lei, S.; Shin, Y.C.; Incropera, F.P. Thermo-mechanical modeling of orthogonal machining process by finite element analysis. Int. J. Mach. Tools Manuf. 1999, 39, 731–750. [Google Scholar] [CrossRef]
- Filice, L.; Micari, F.; Rizzuti, S.; Umbrello, D. A critical analysis on the friction modelling in orthogonal machining. Int. J. Mach. Tools Manuf. 2007, 47, 709–714. [Google Scholar] [CrossRef]
- Wu, X.; Li, L.; He, N. Investigation on the burr formation mechanism in micro cutting. Precis. Eng. 2017, 47, 191–196. [Google Scholar] [CrossRef]


© 2019 by the authors. Licensee MDPI, Basel, Switzerland. This article is an open access article distributed under the terms and conditions of the Creative Commons Attribution (CC BY) license (http://creativecommons.org/licenses/by/4.0/).