Leaching Chalcopyrite Concentrate with Oxygen and Sulfuric Acid Using a Low-Pressure Reactor

Abstract
:1. Introduction
2. Materials and Methods
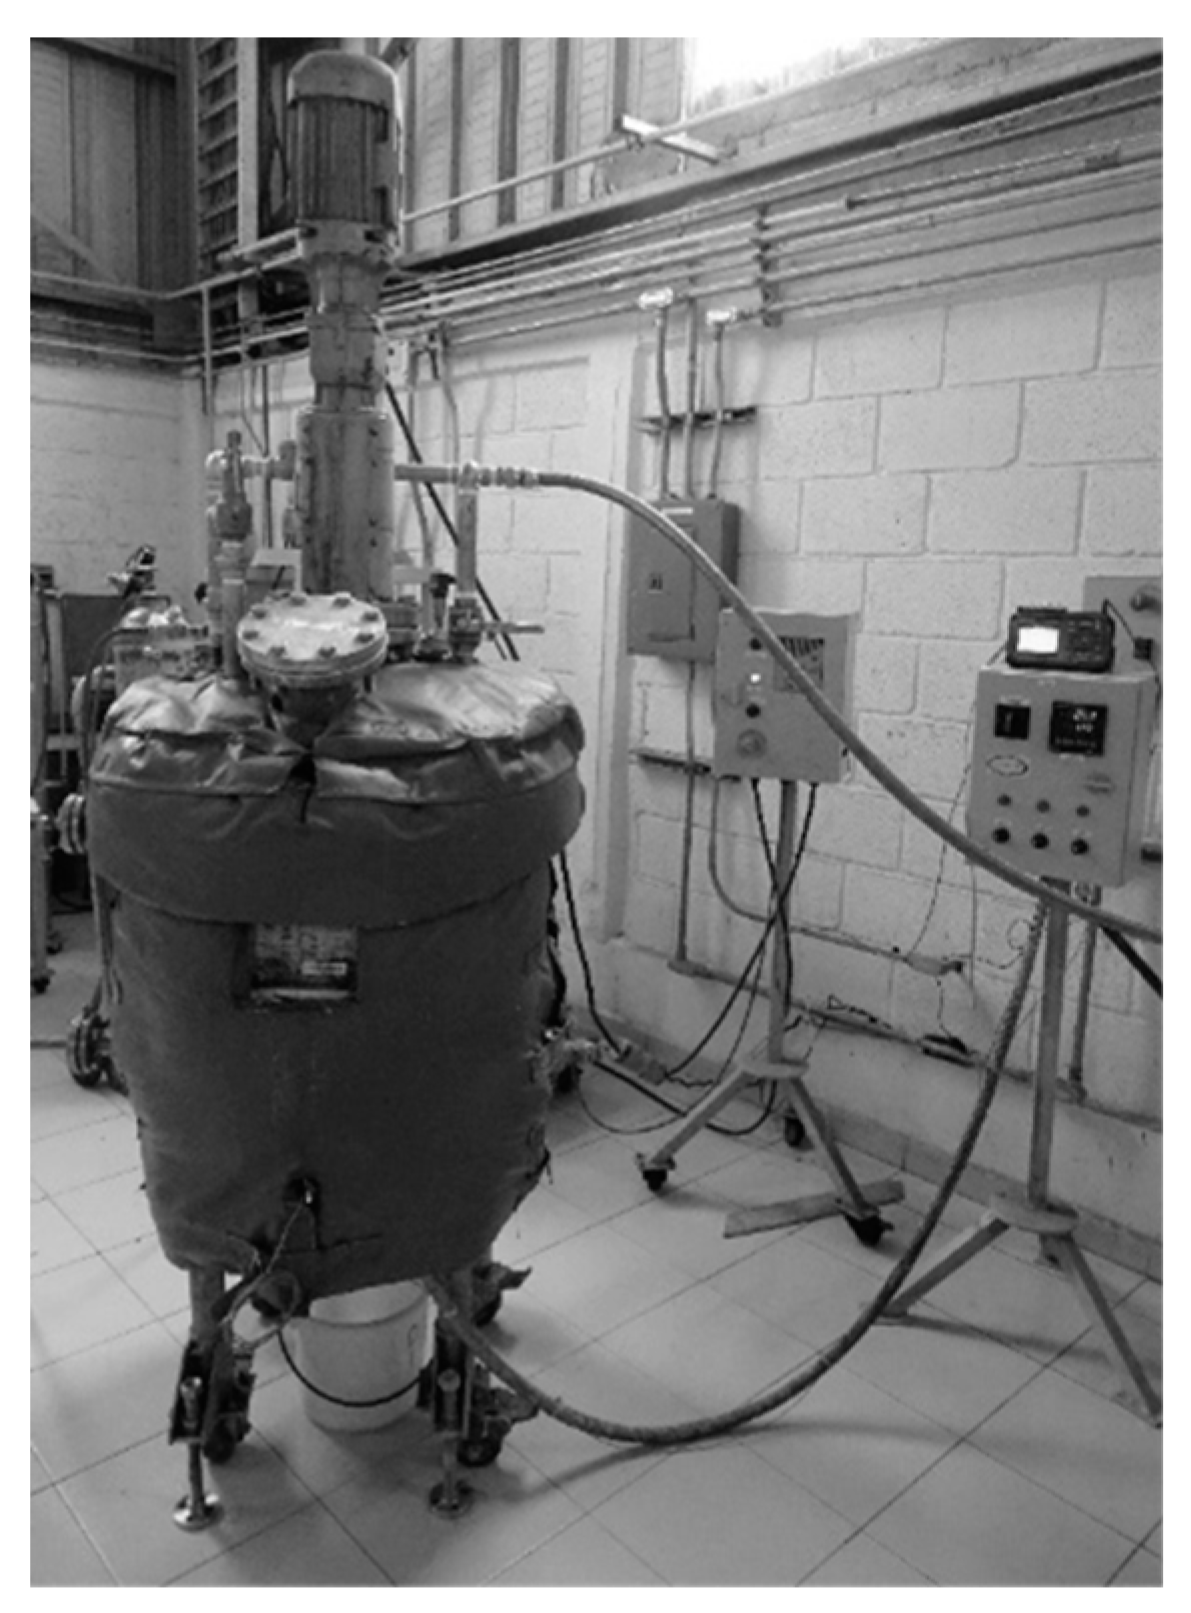
2.1. Material and Equipment
2.2. Experimental Method
3. Results
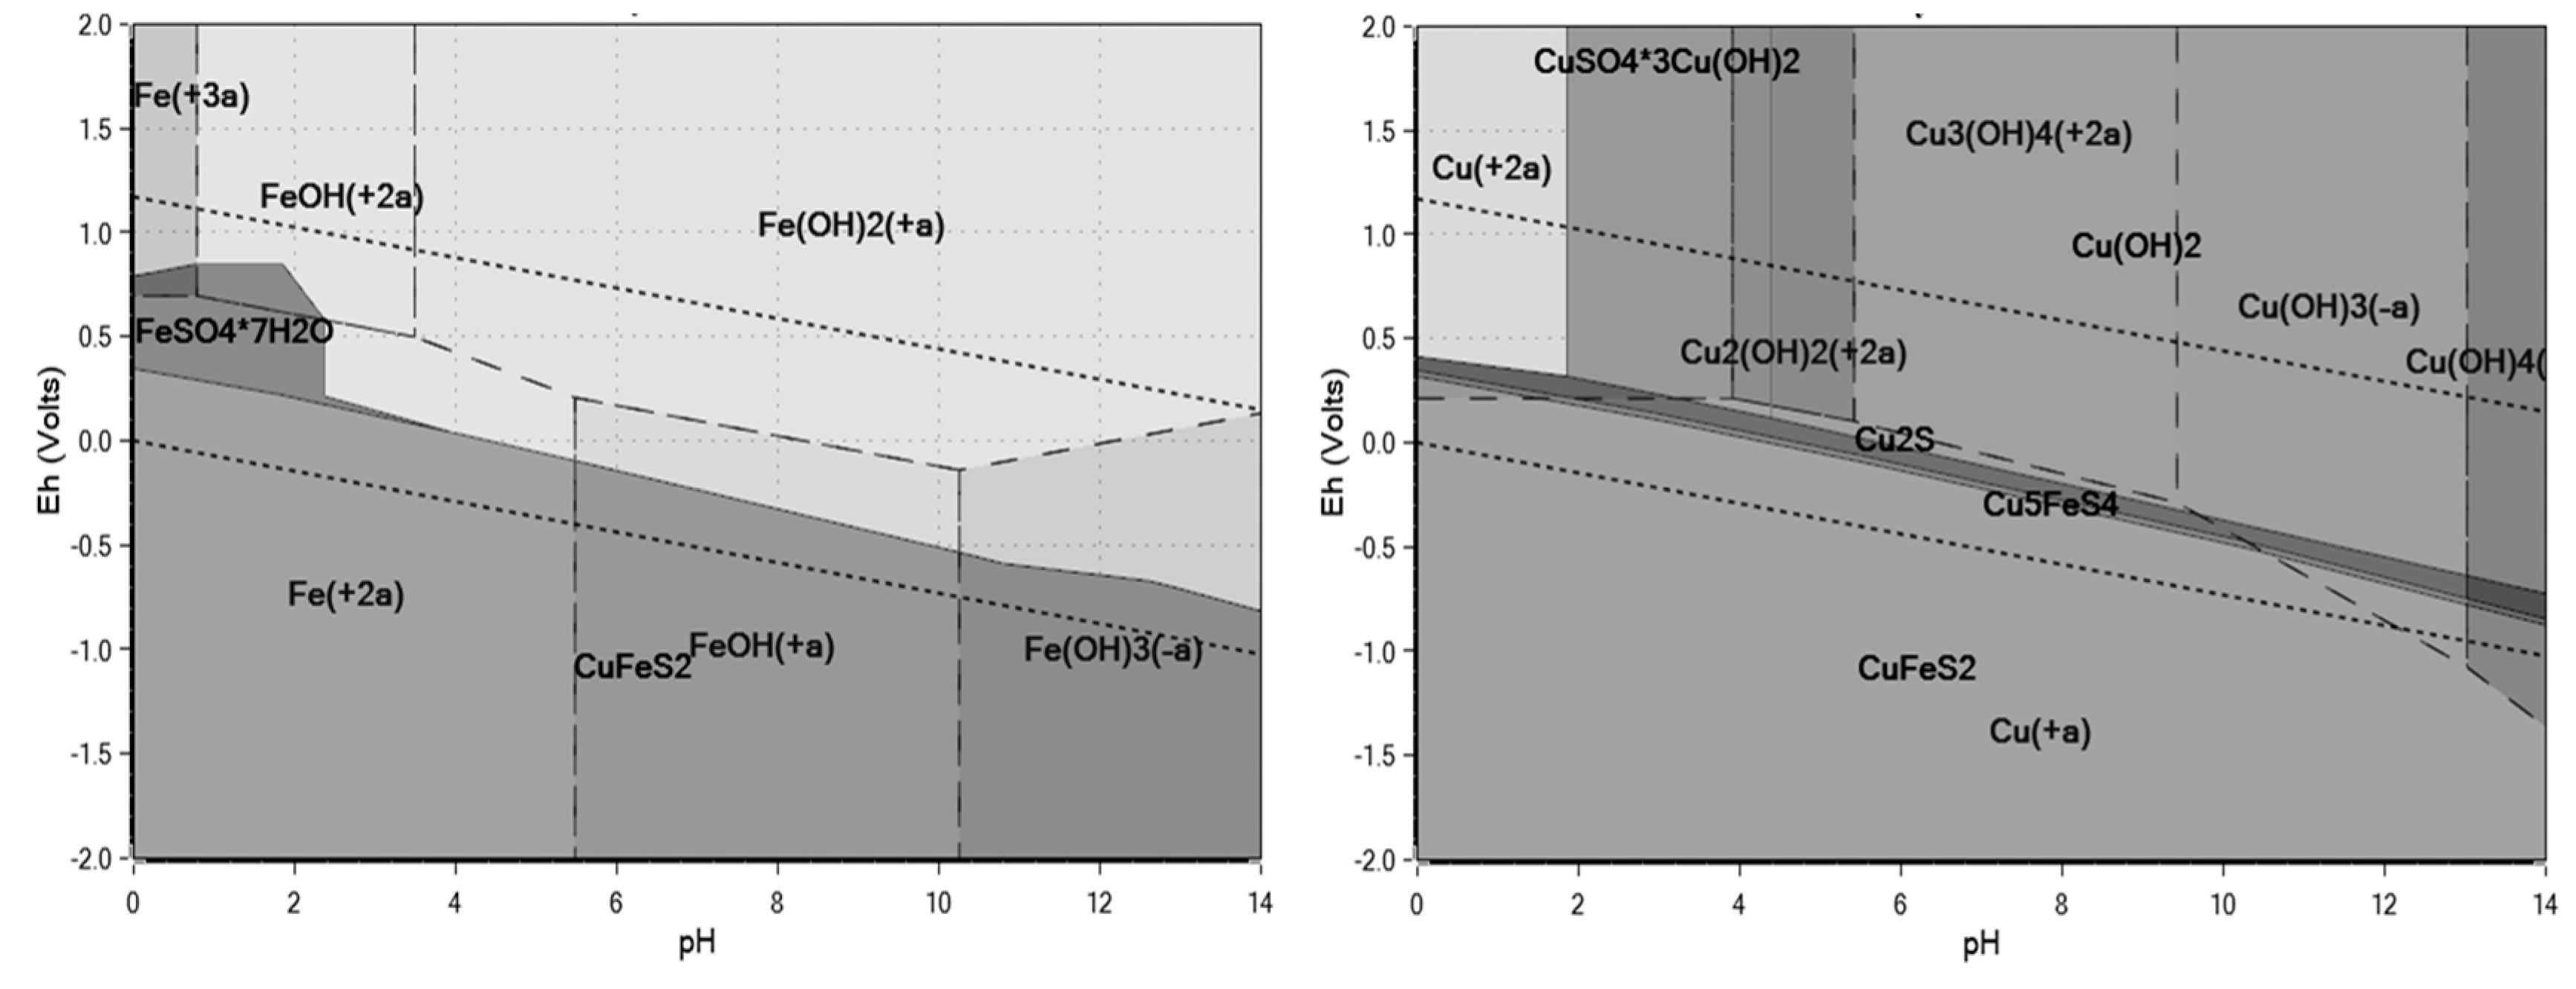
3.1. Thermodynamics
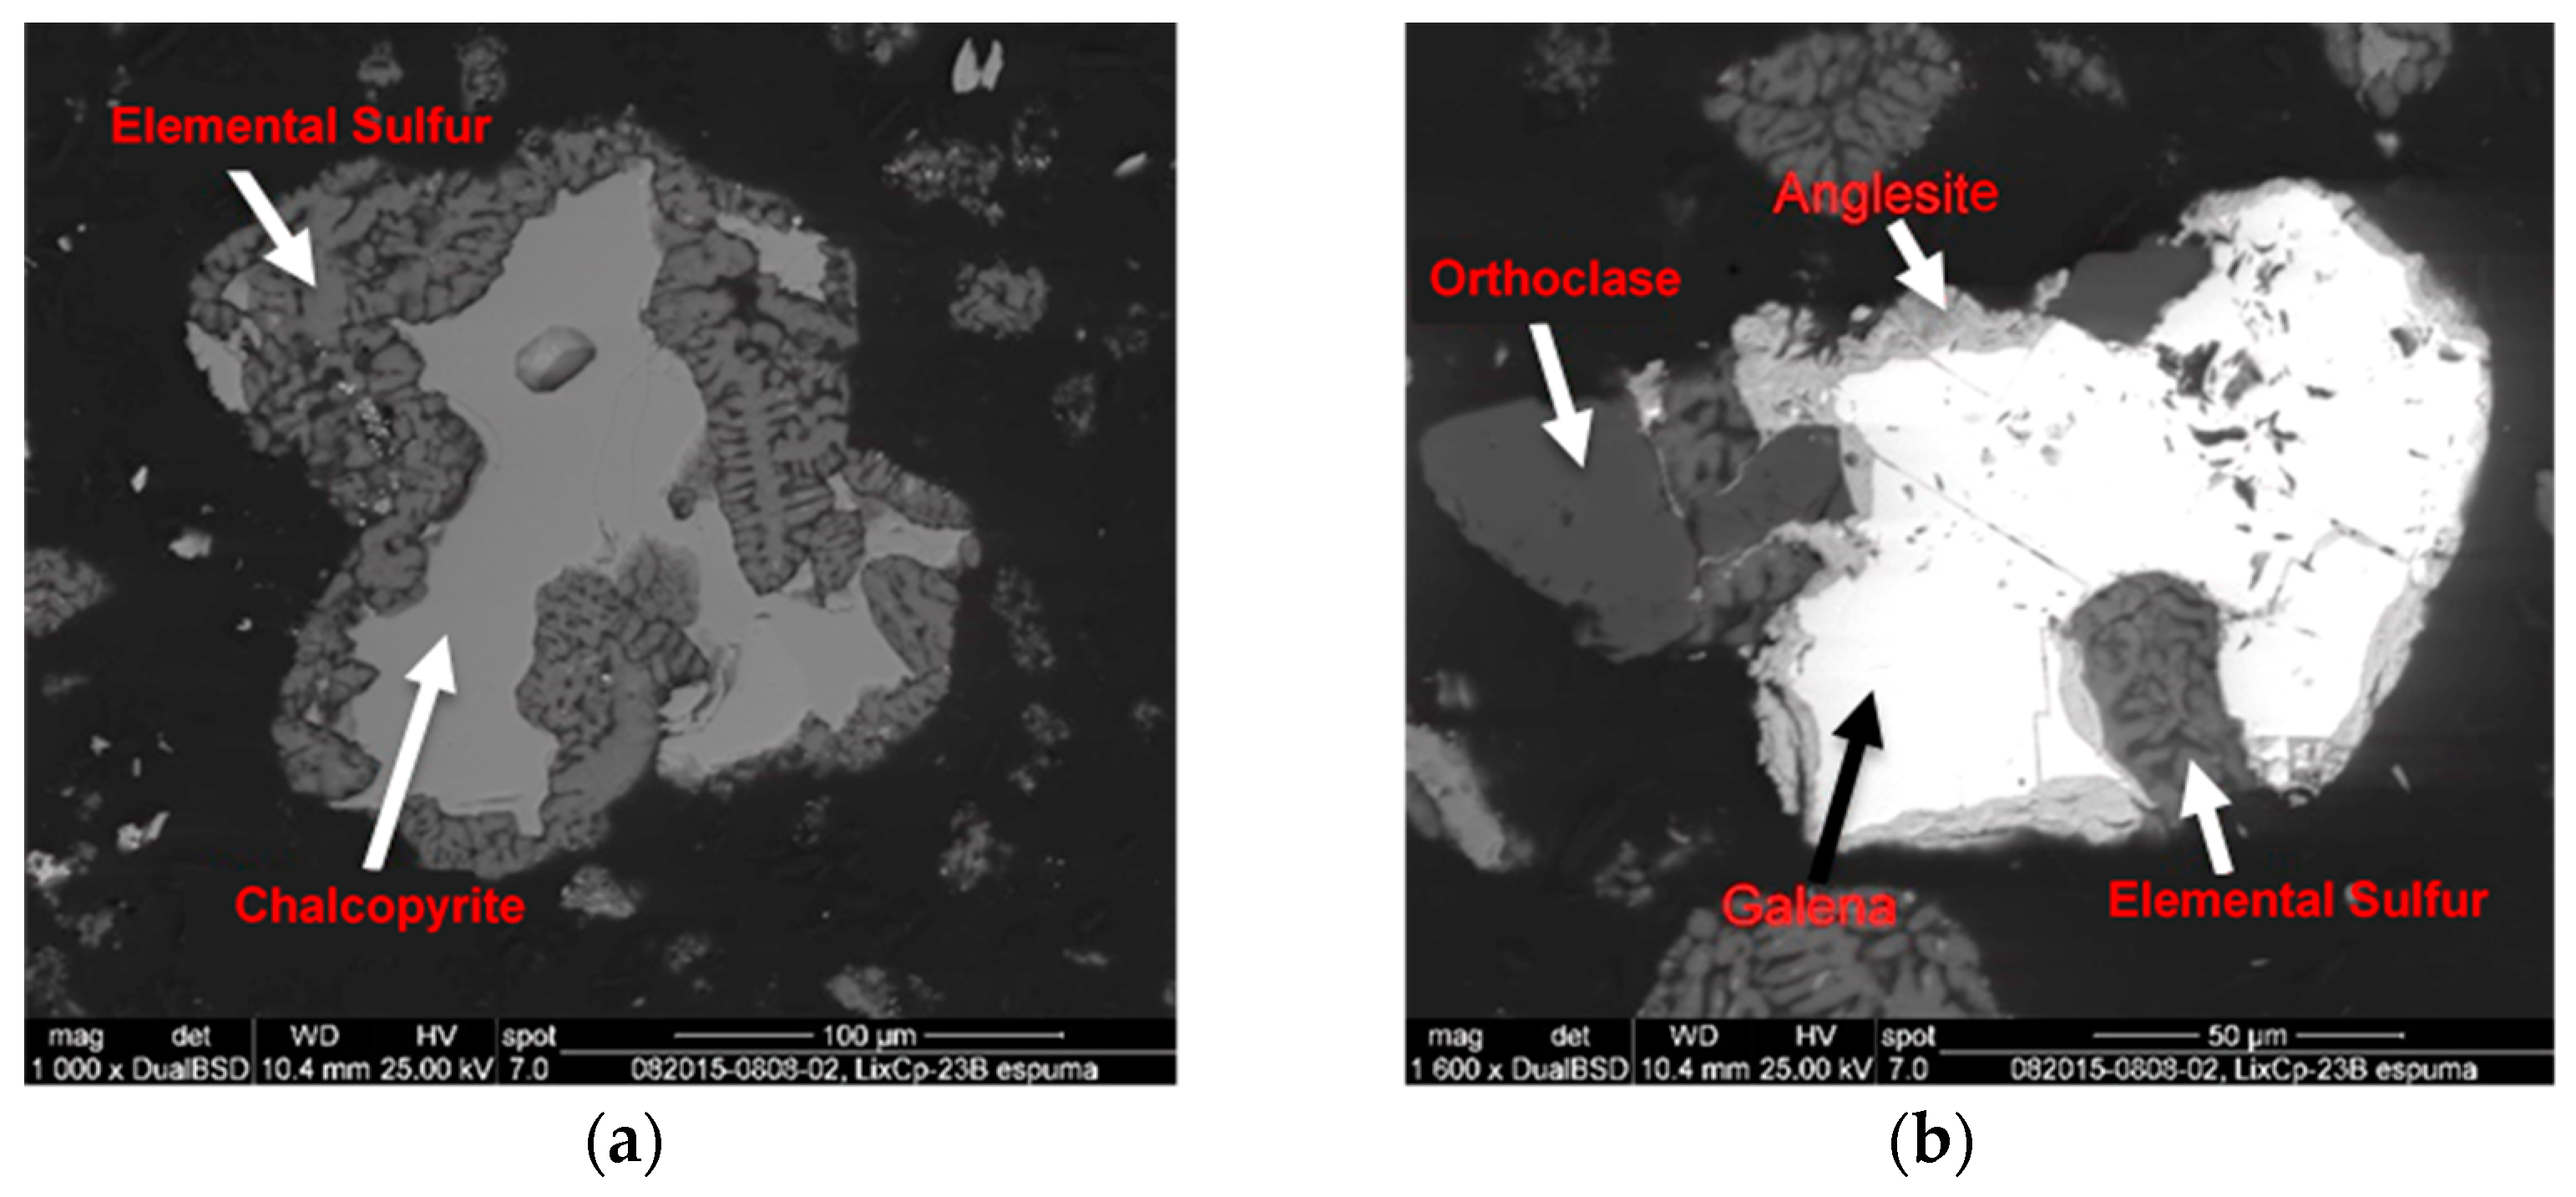
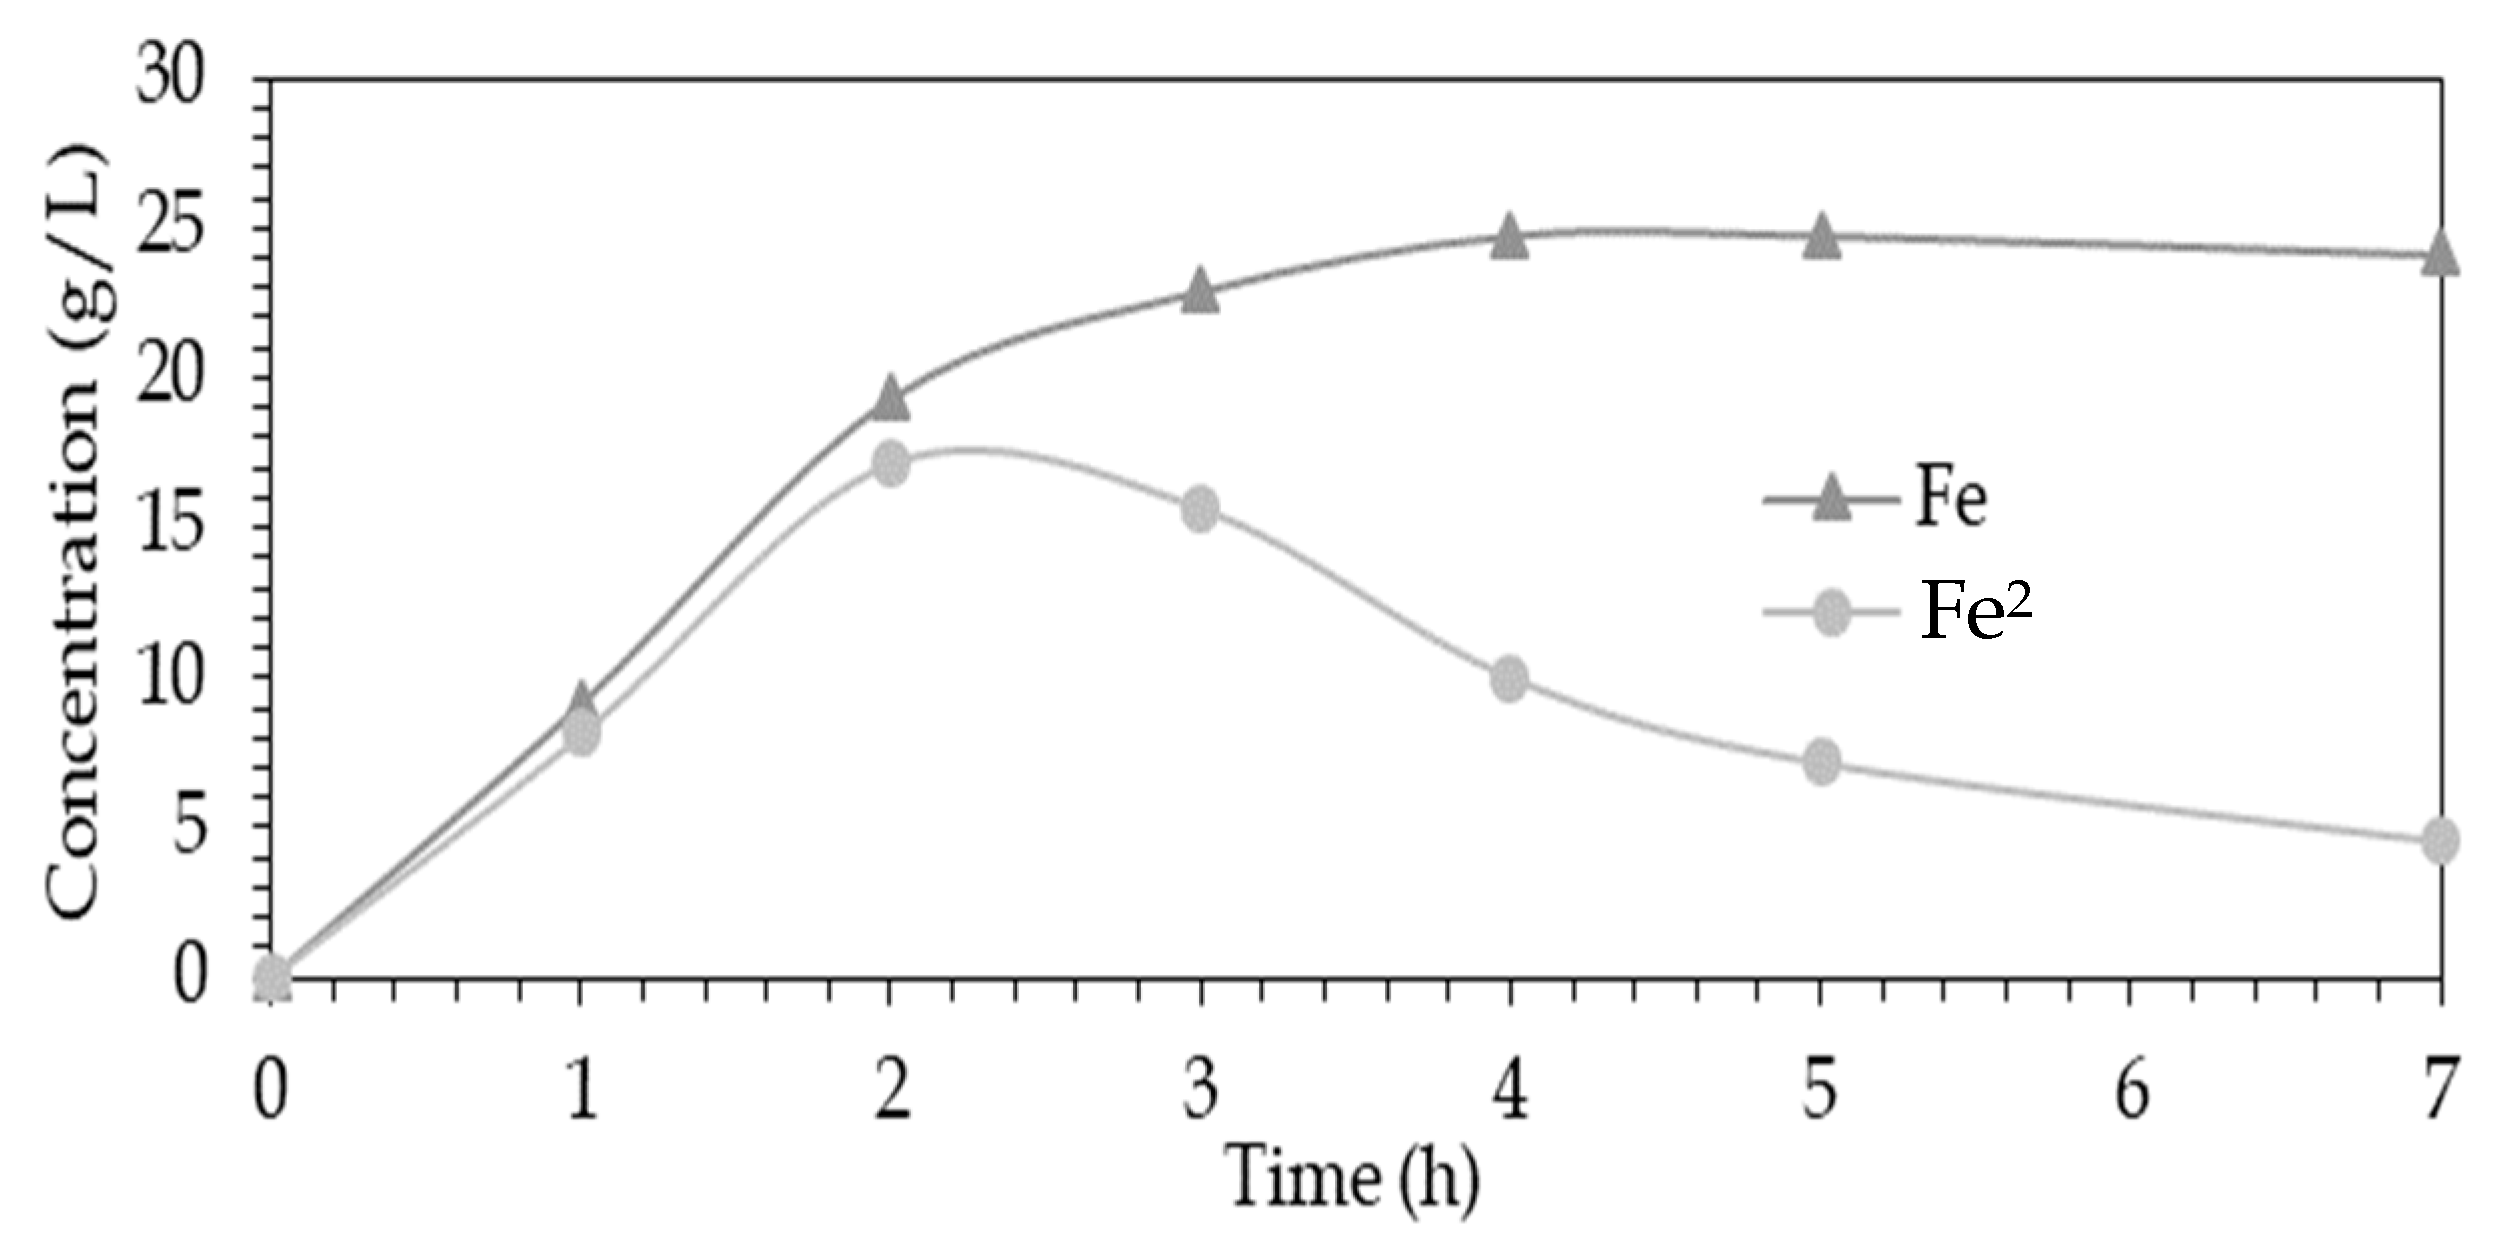
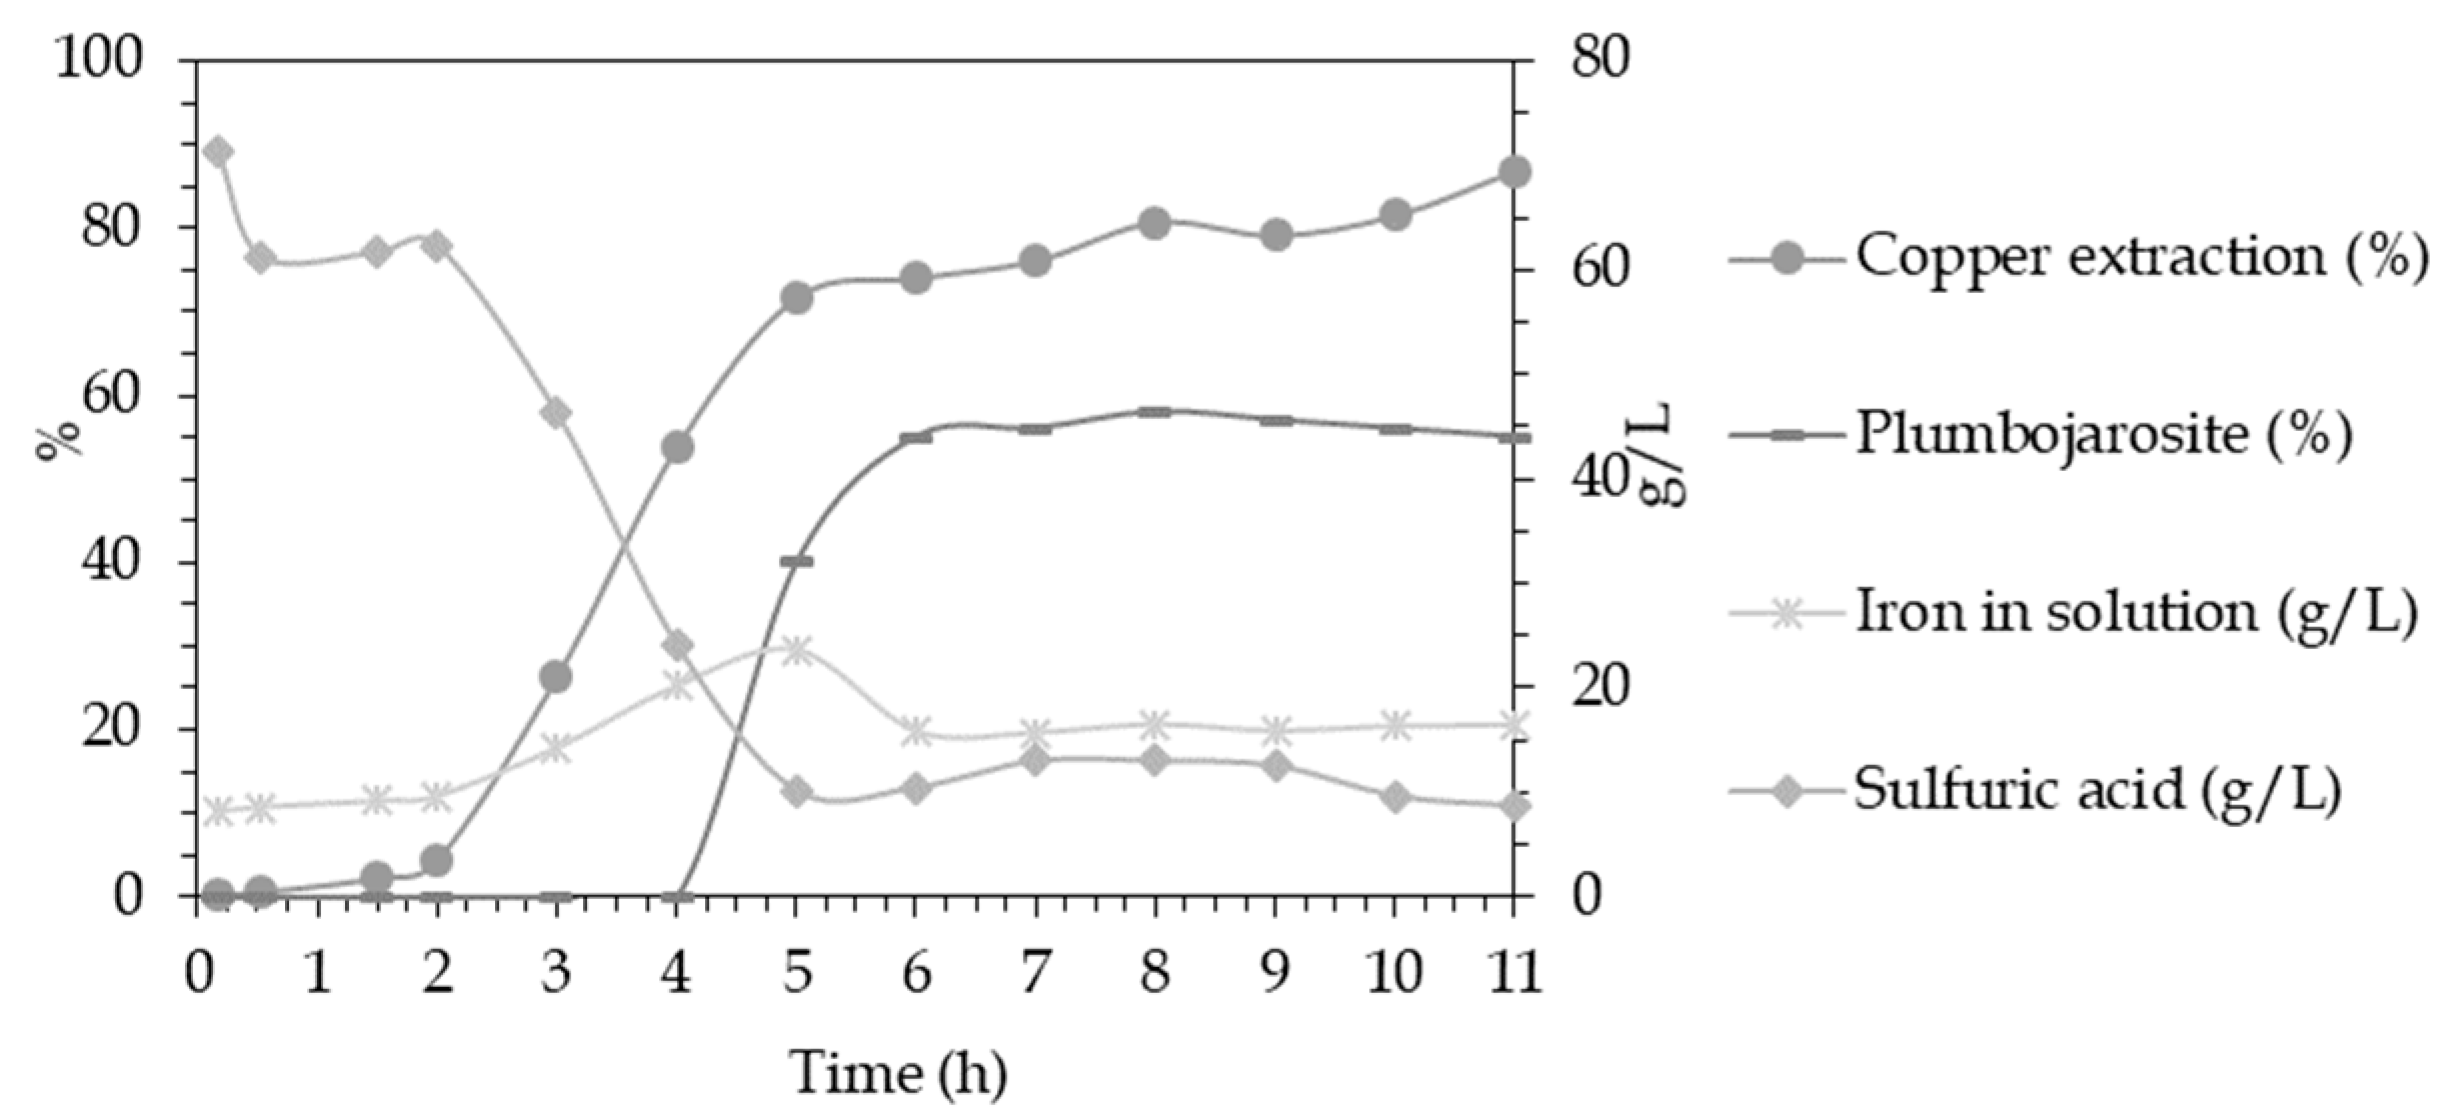
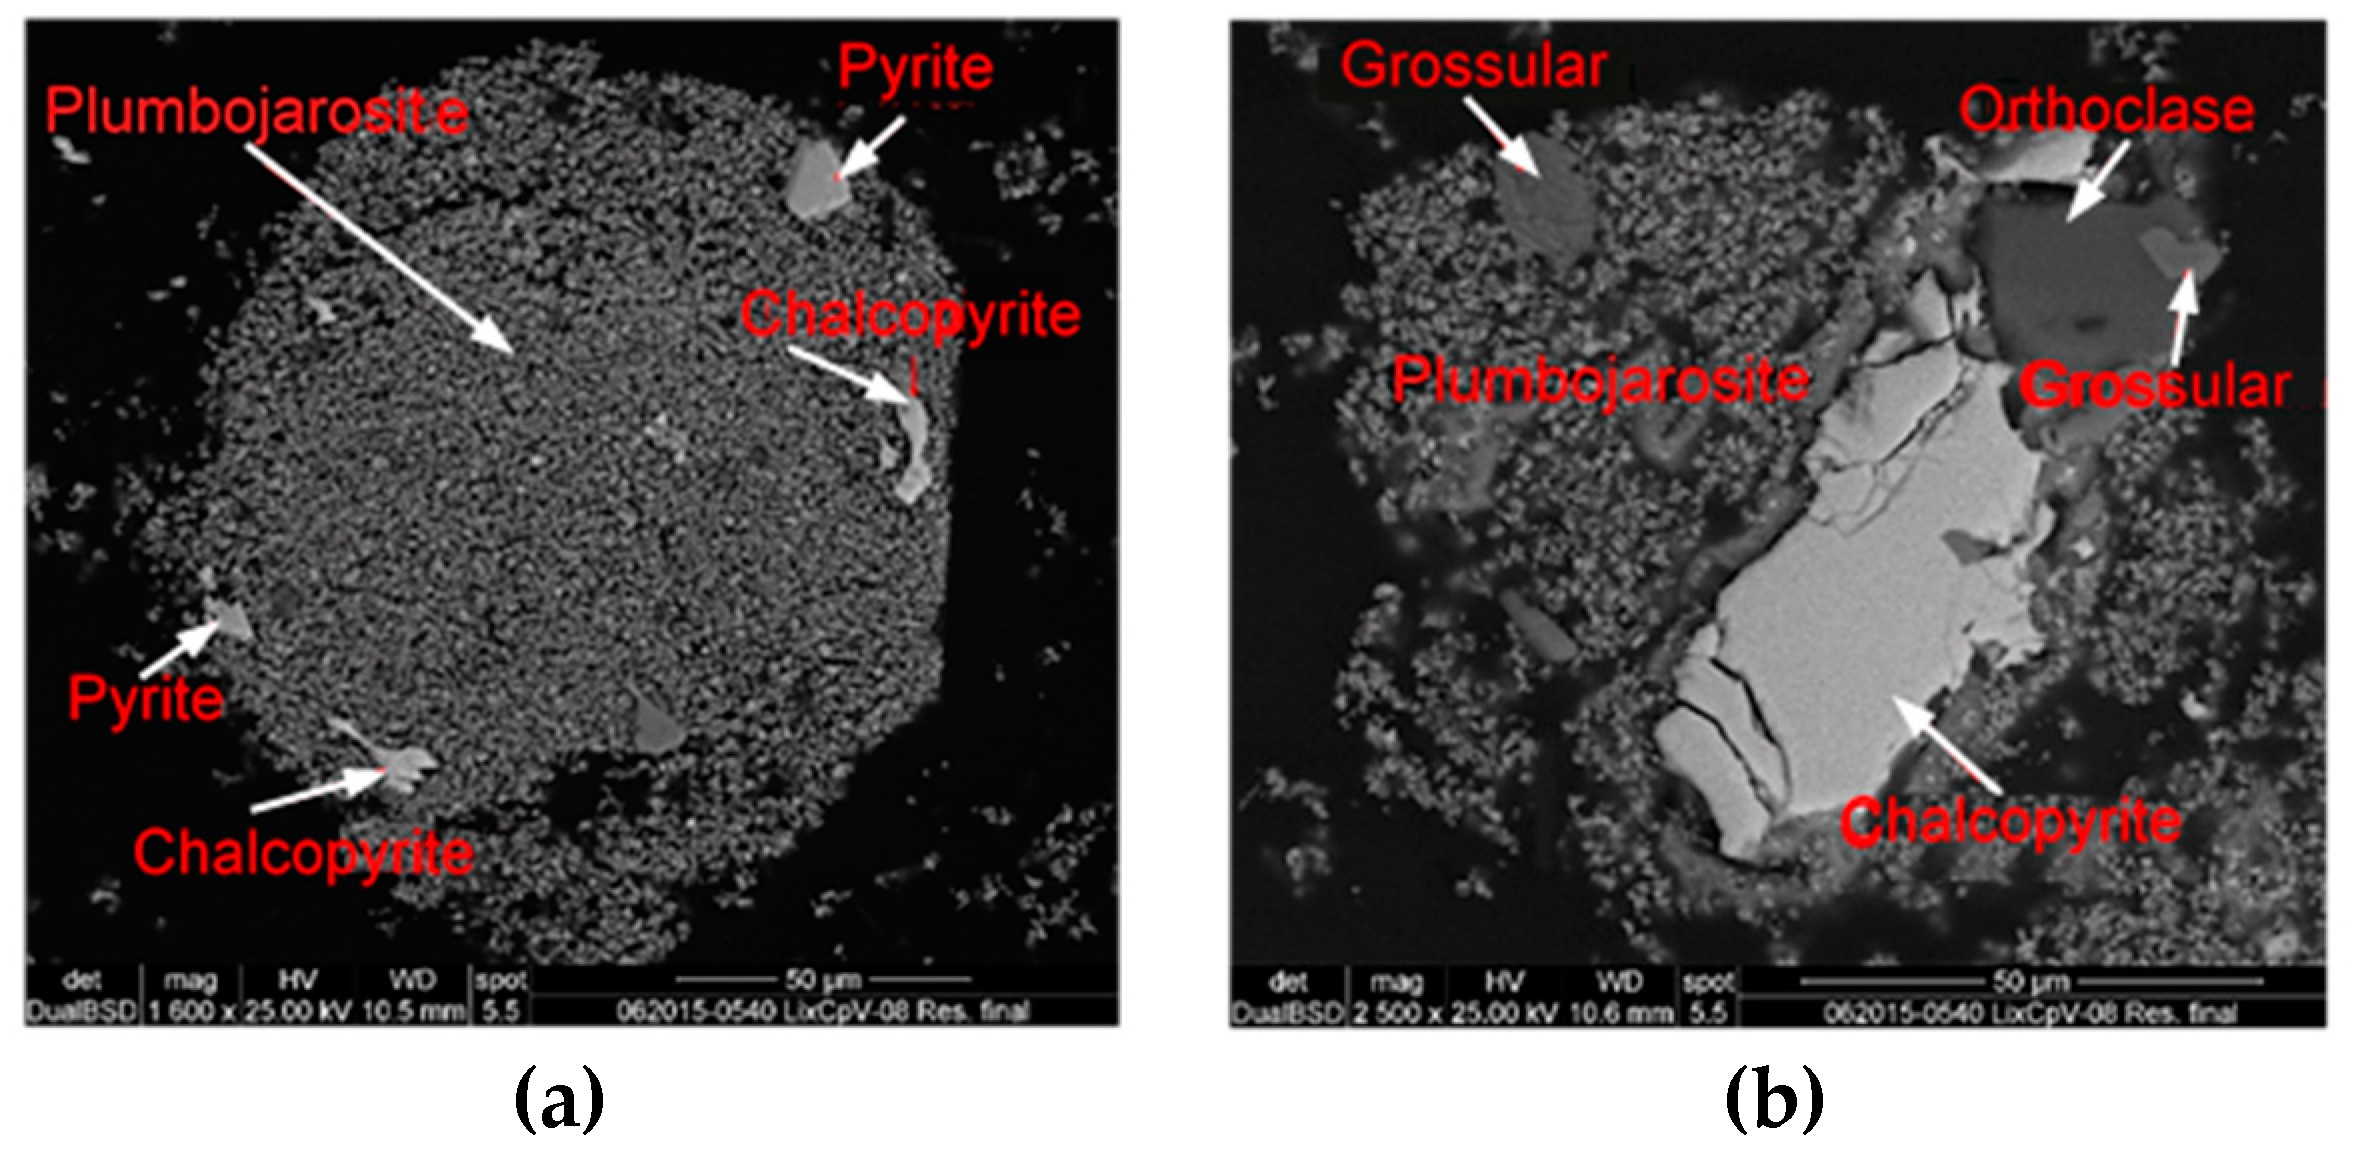
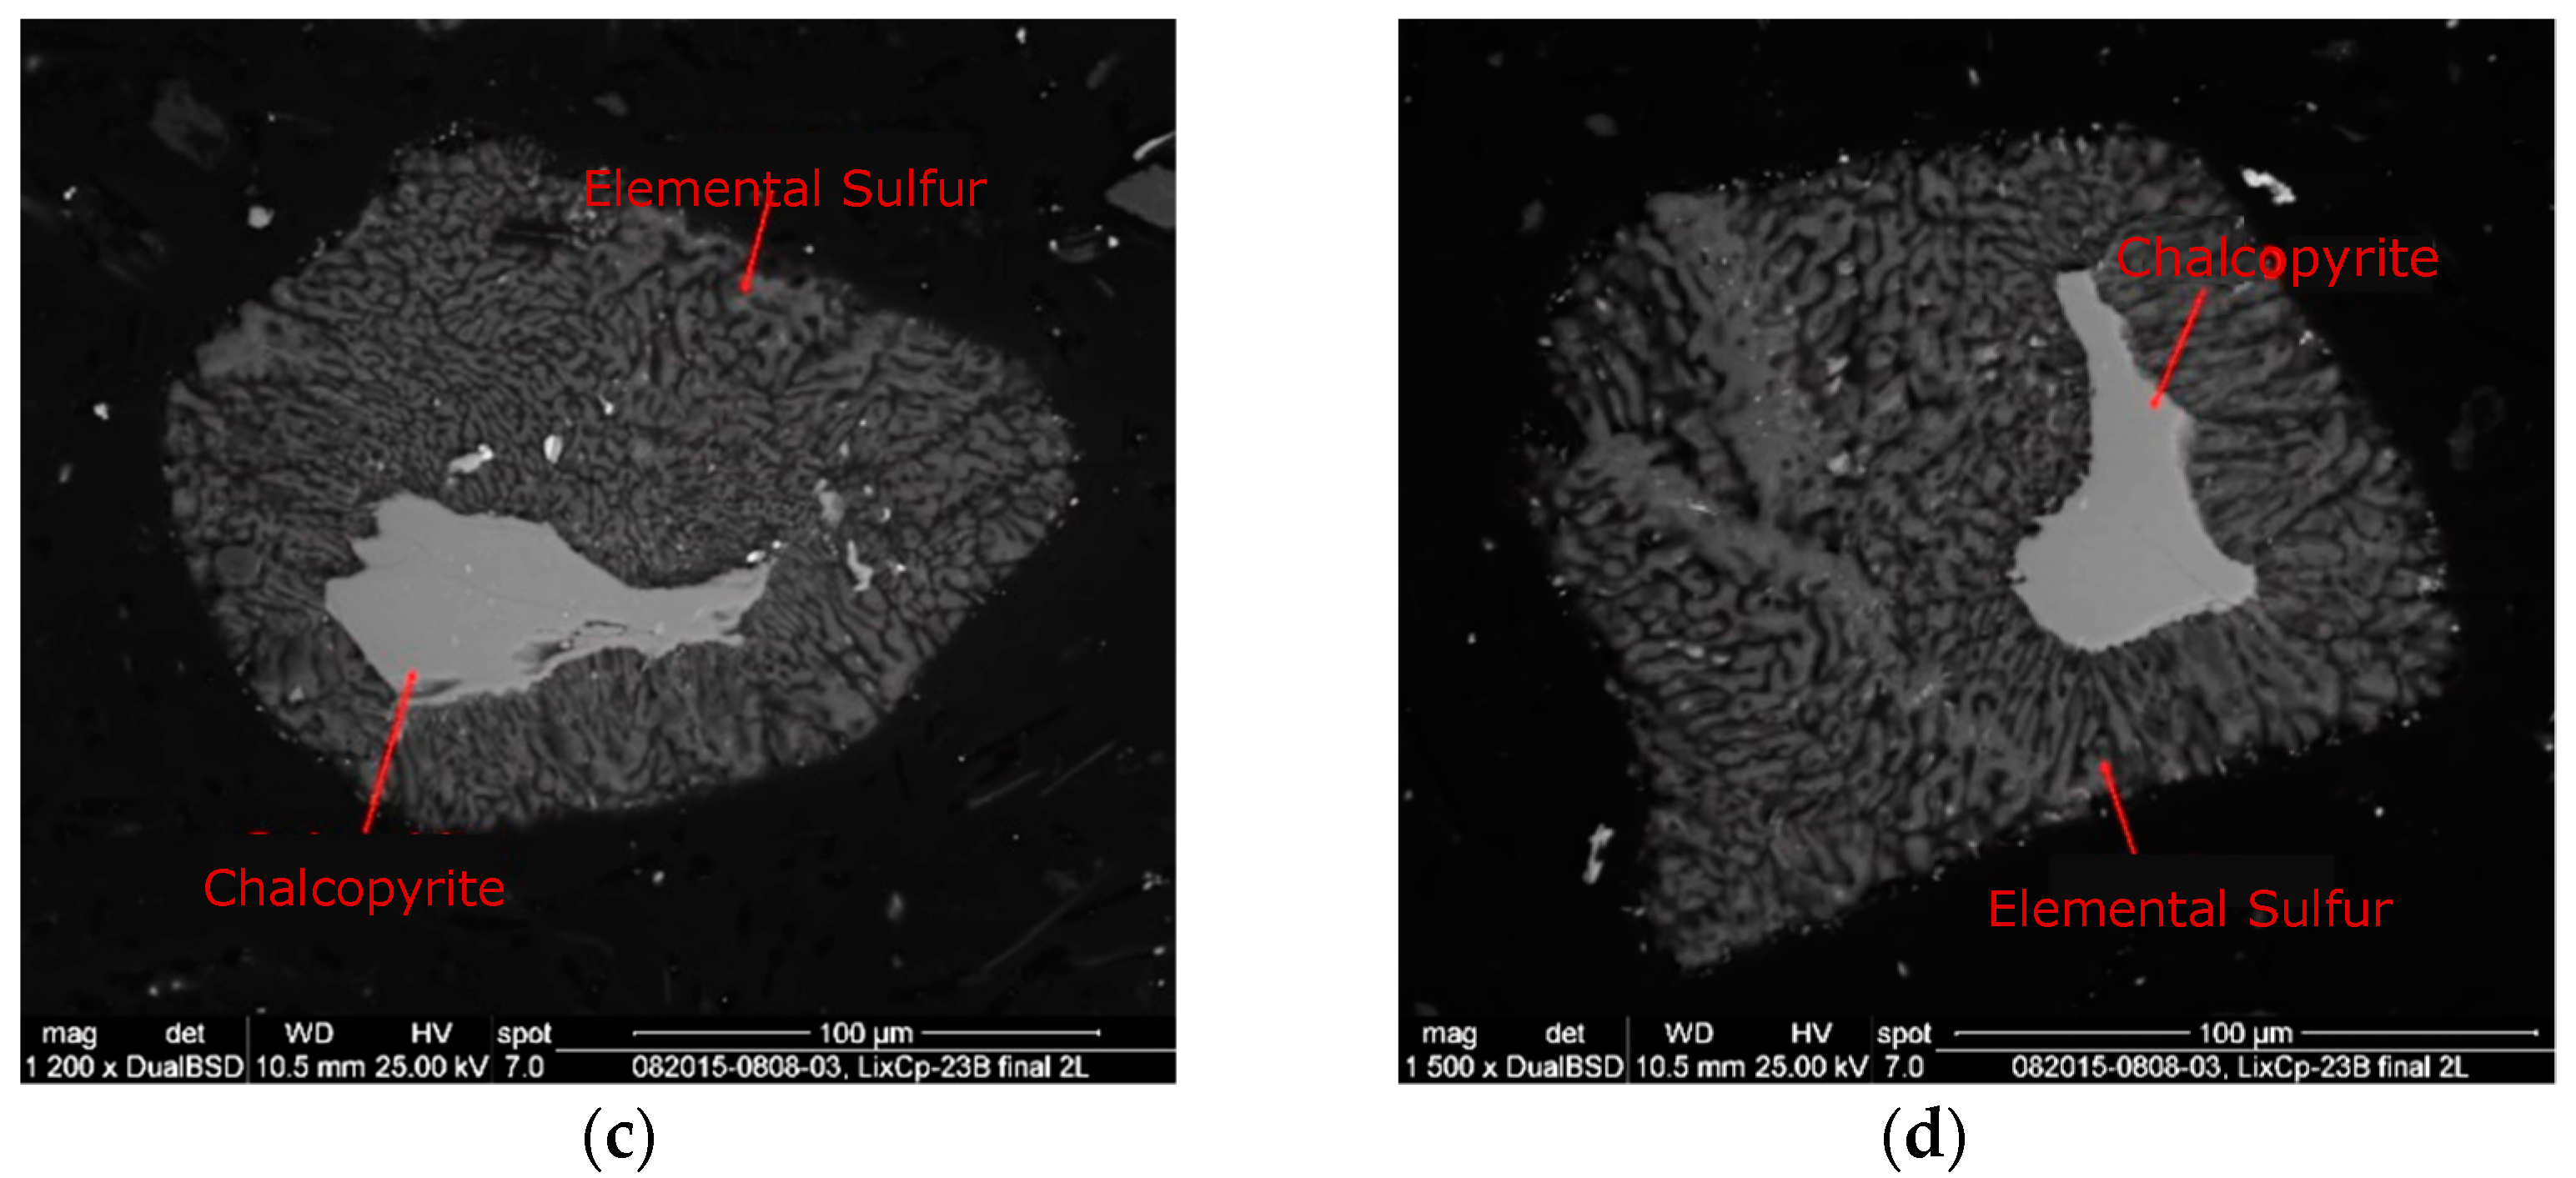
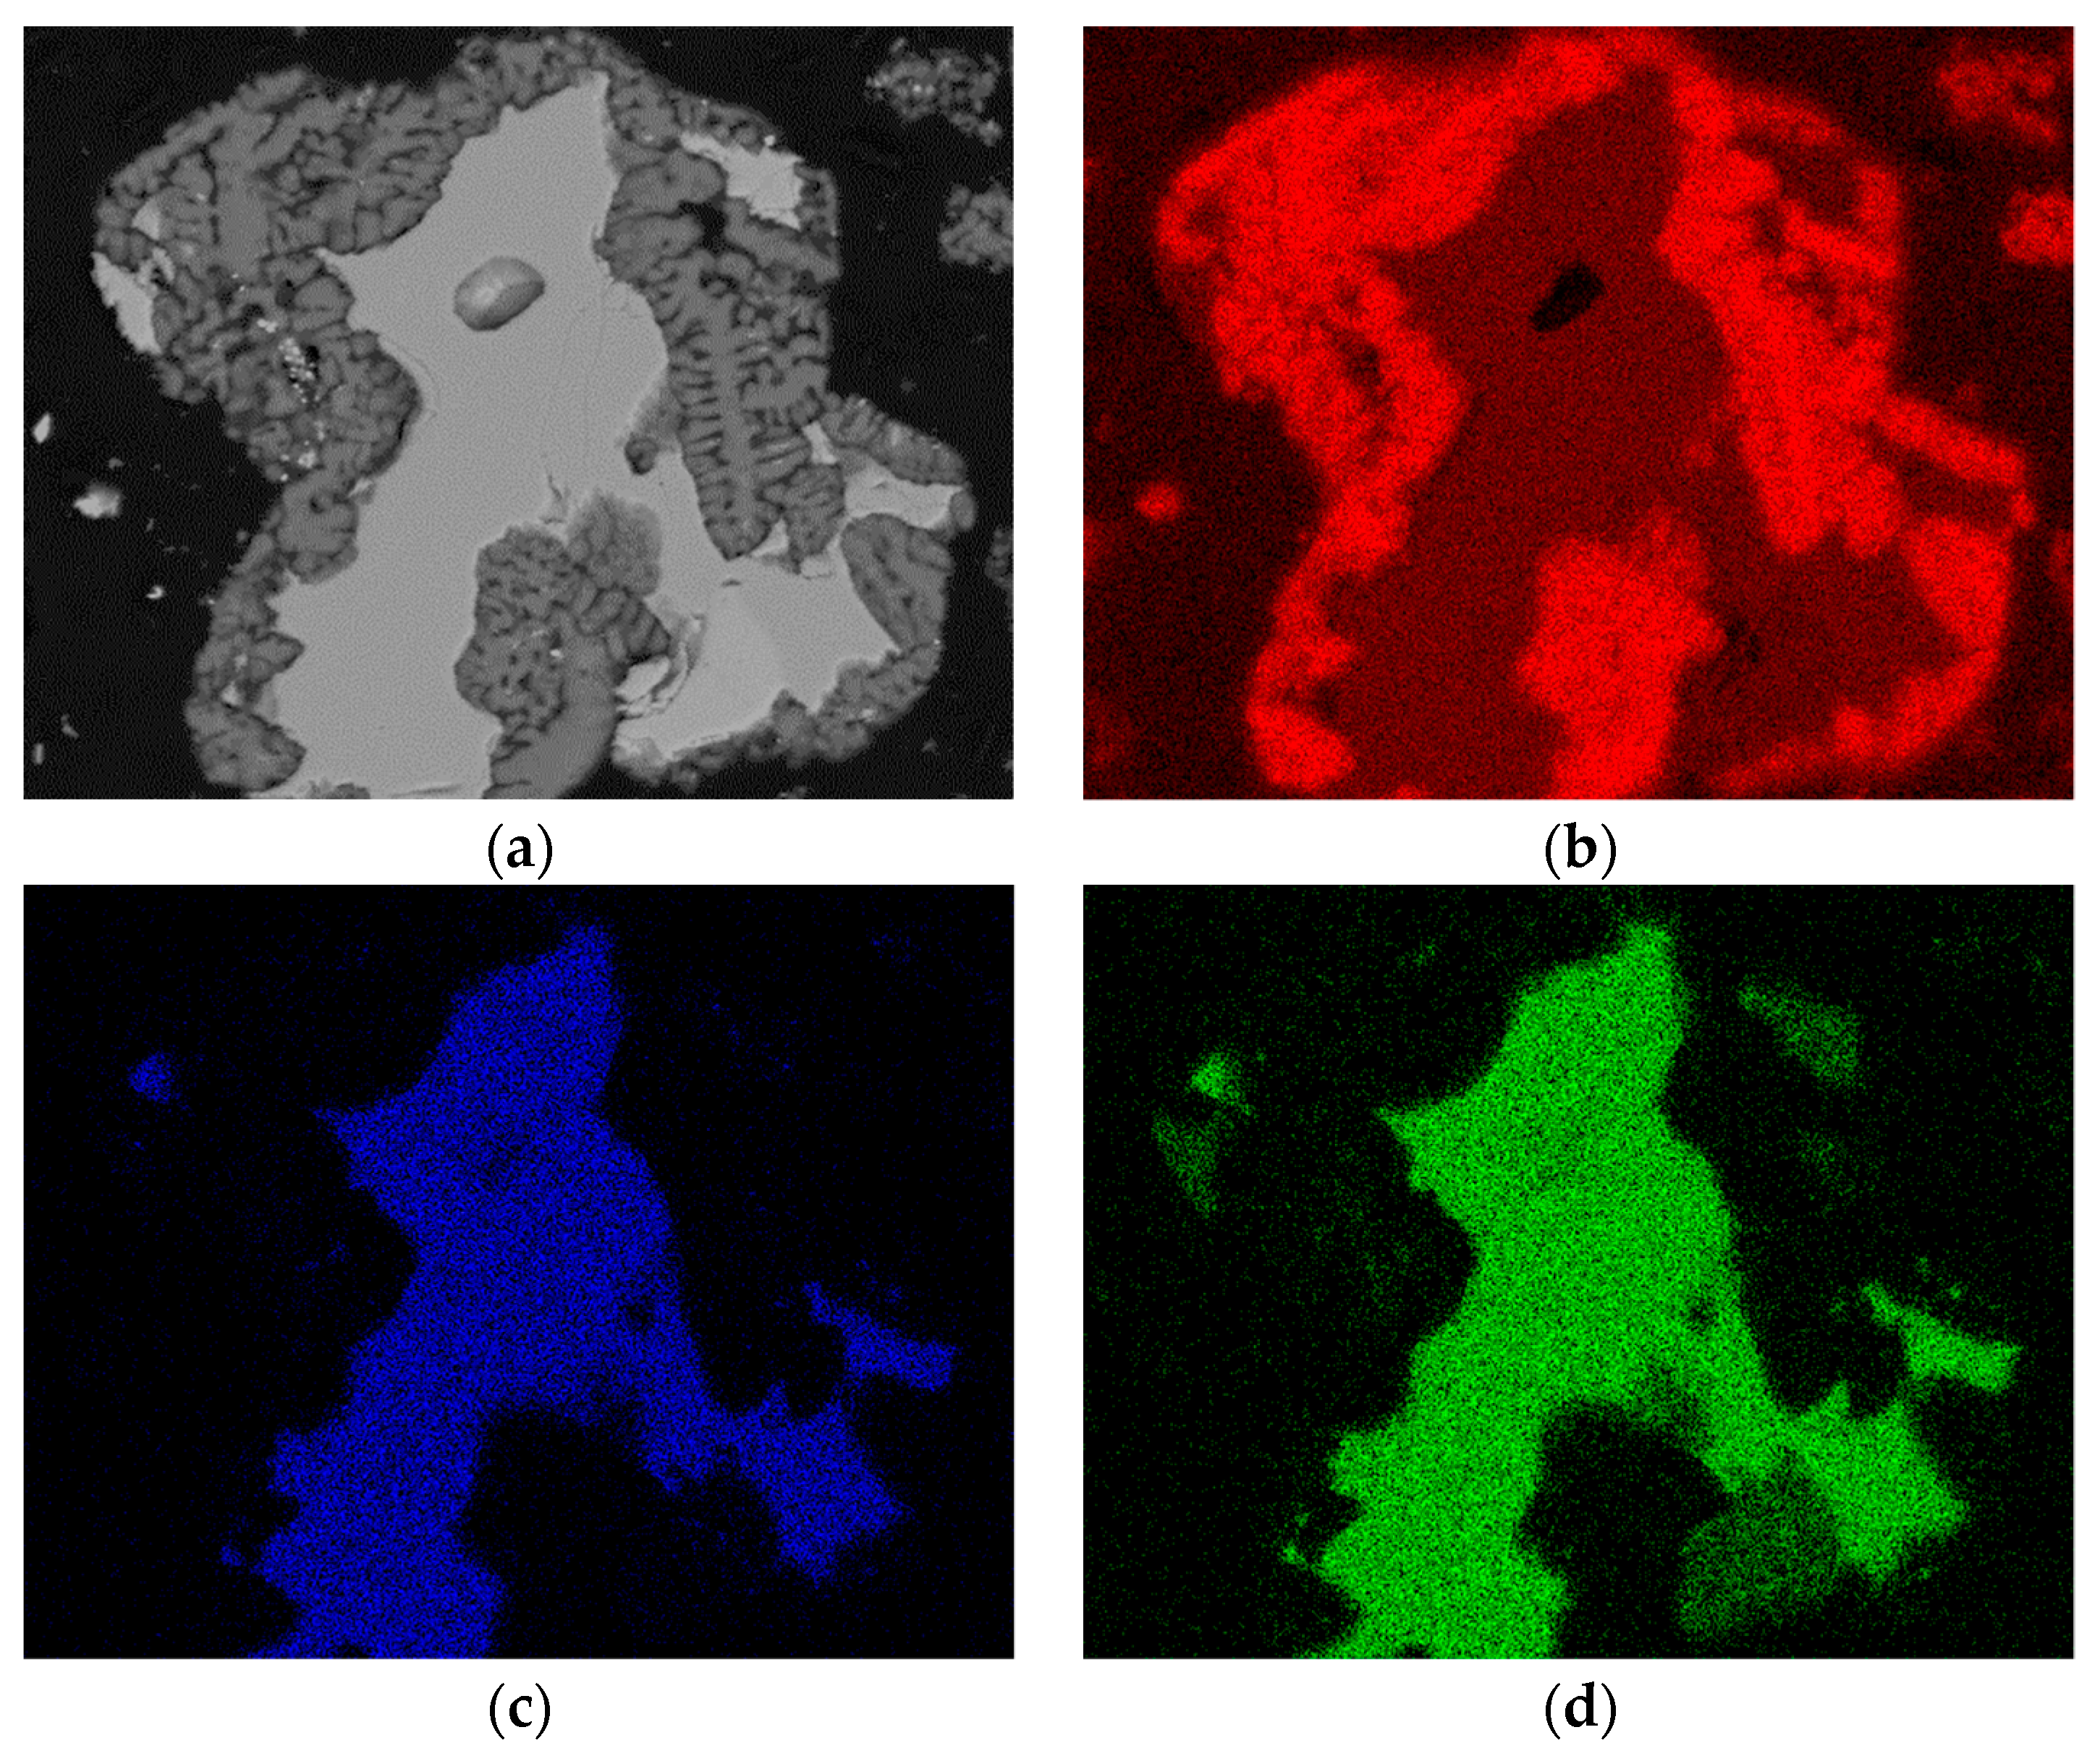
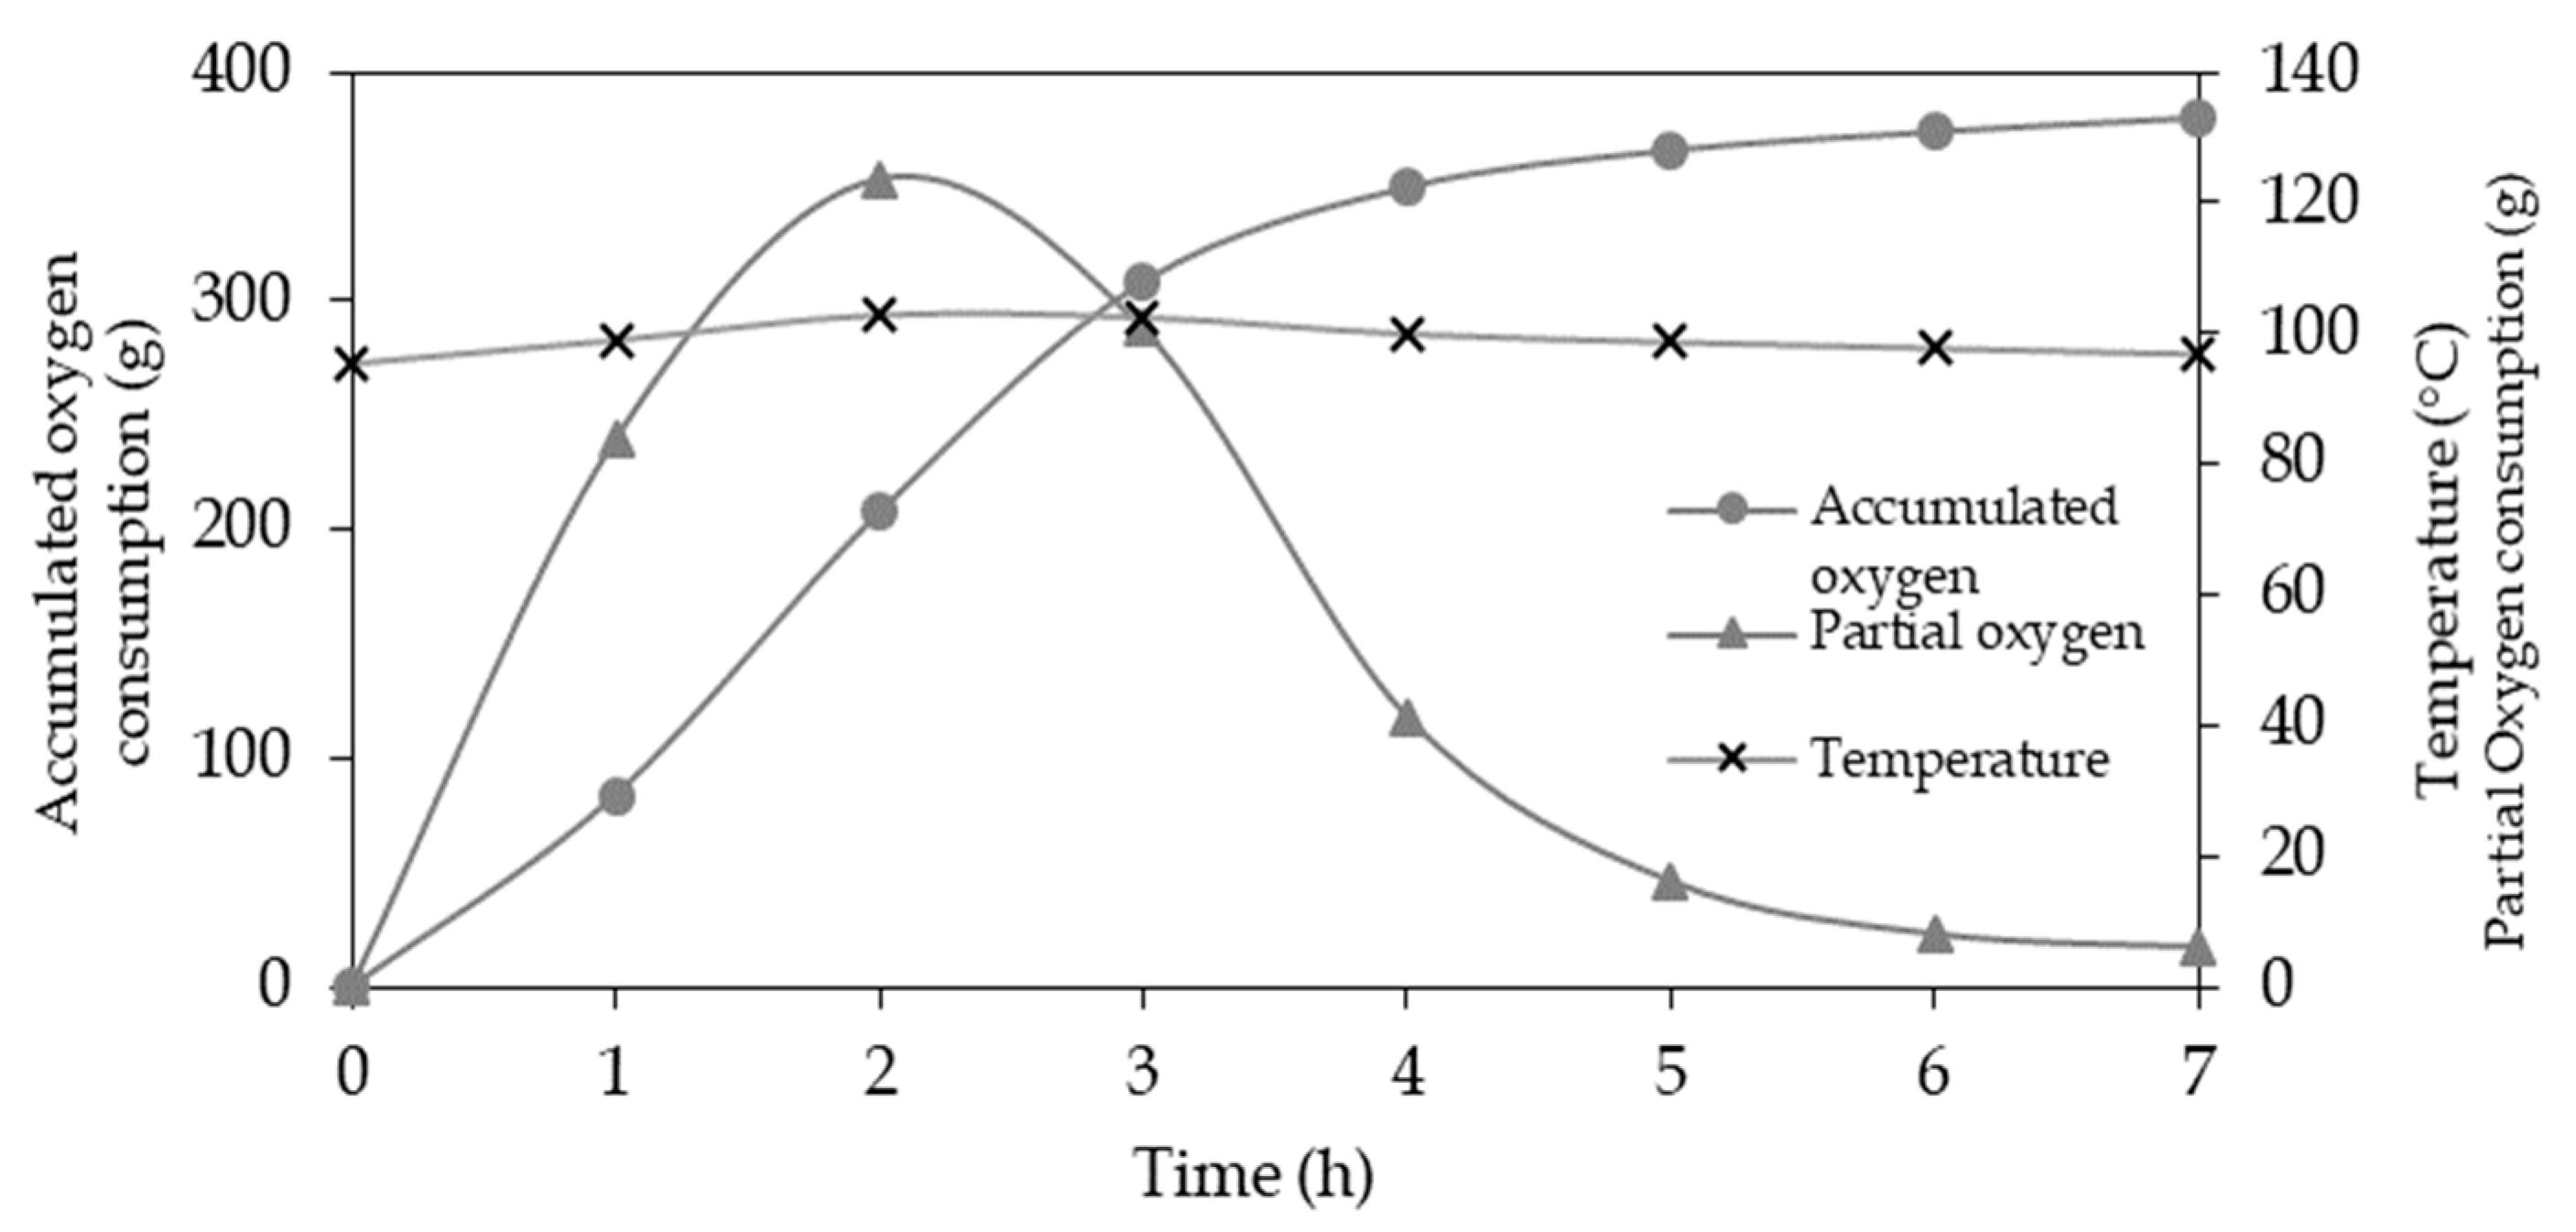
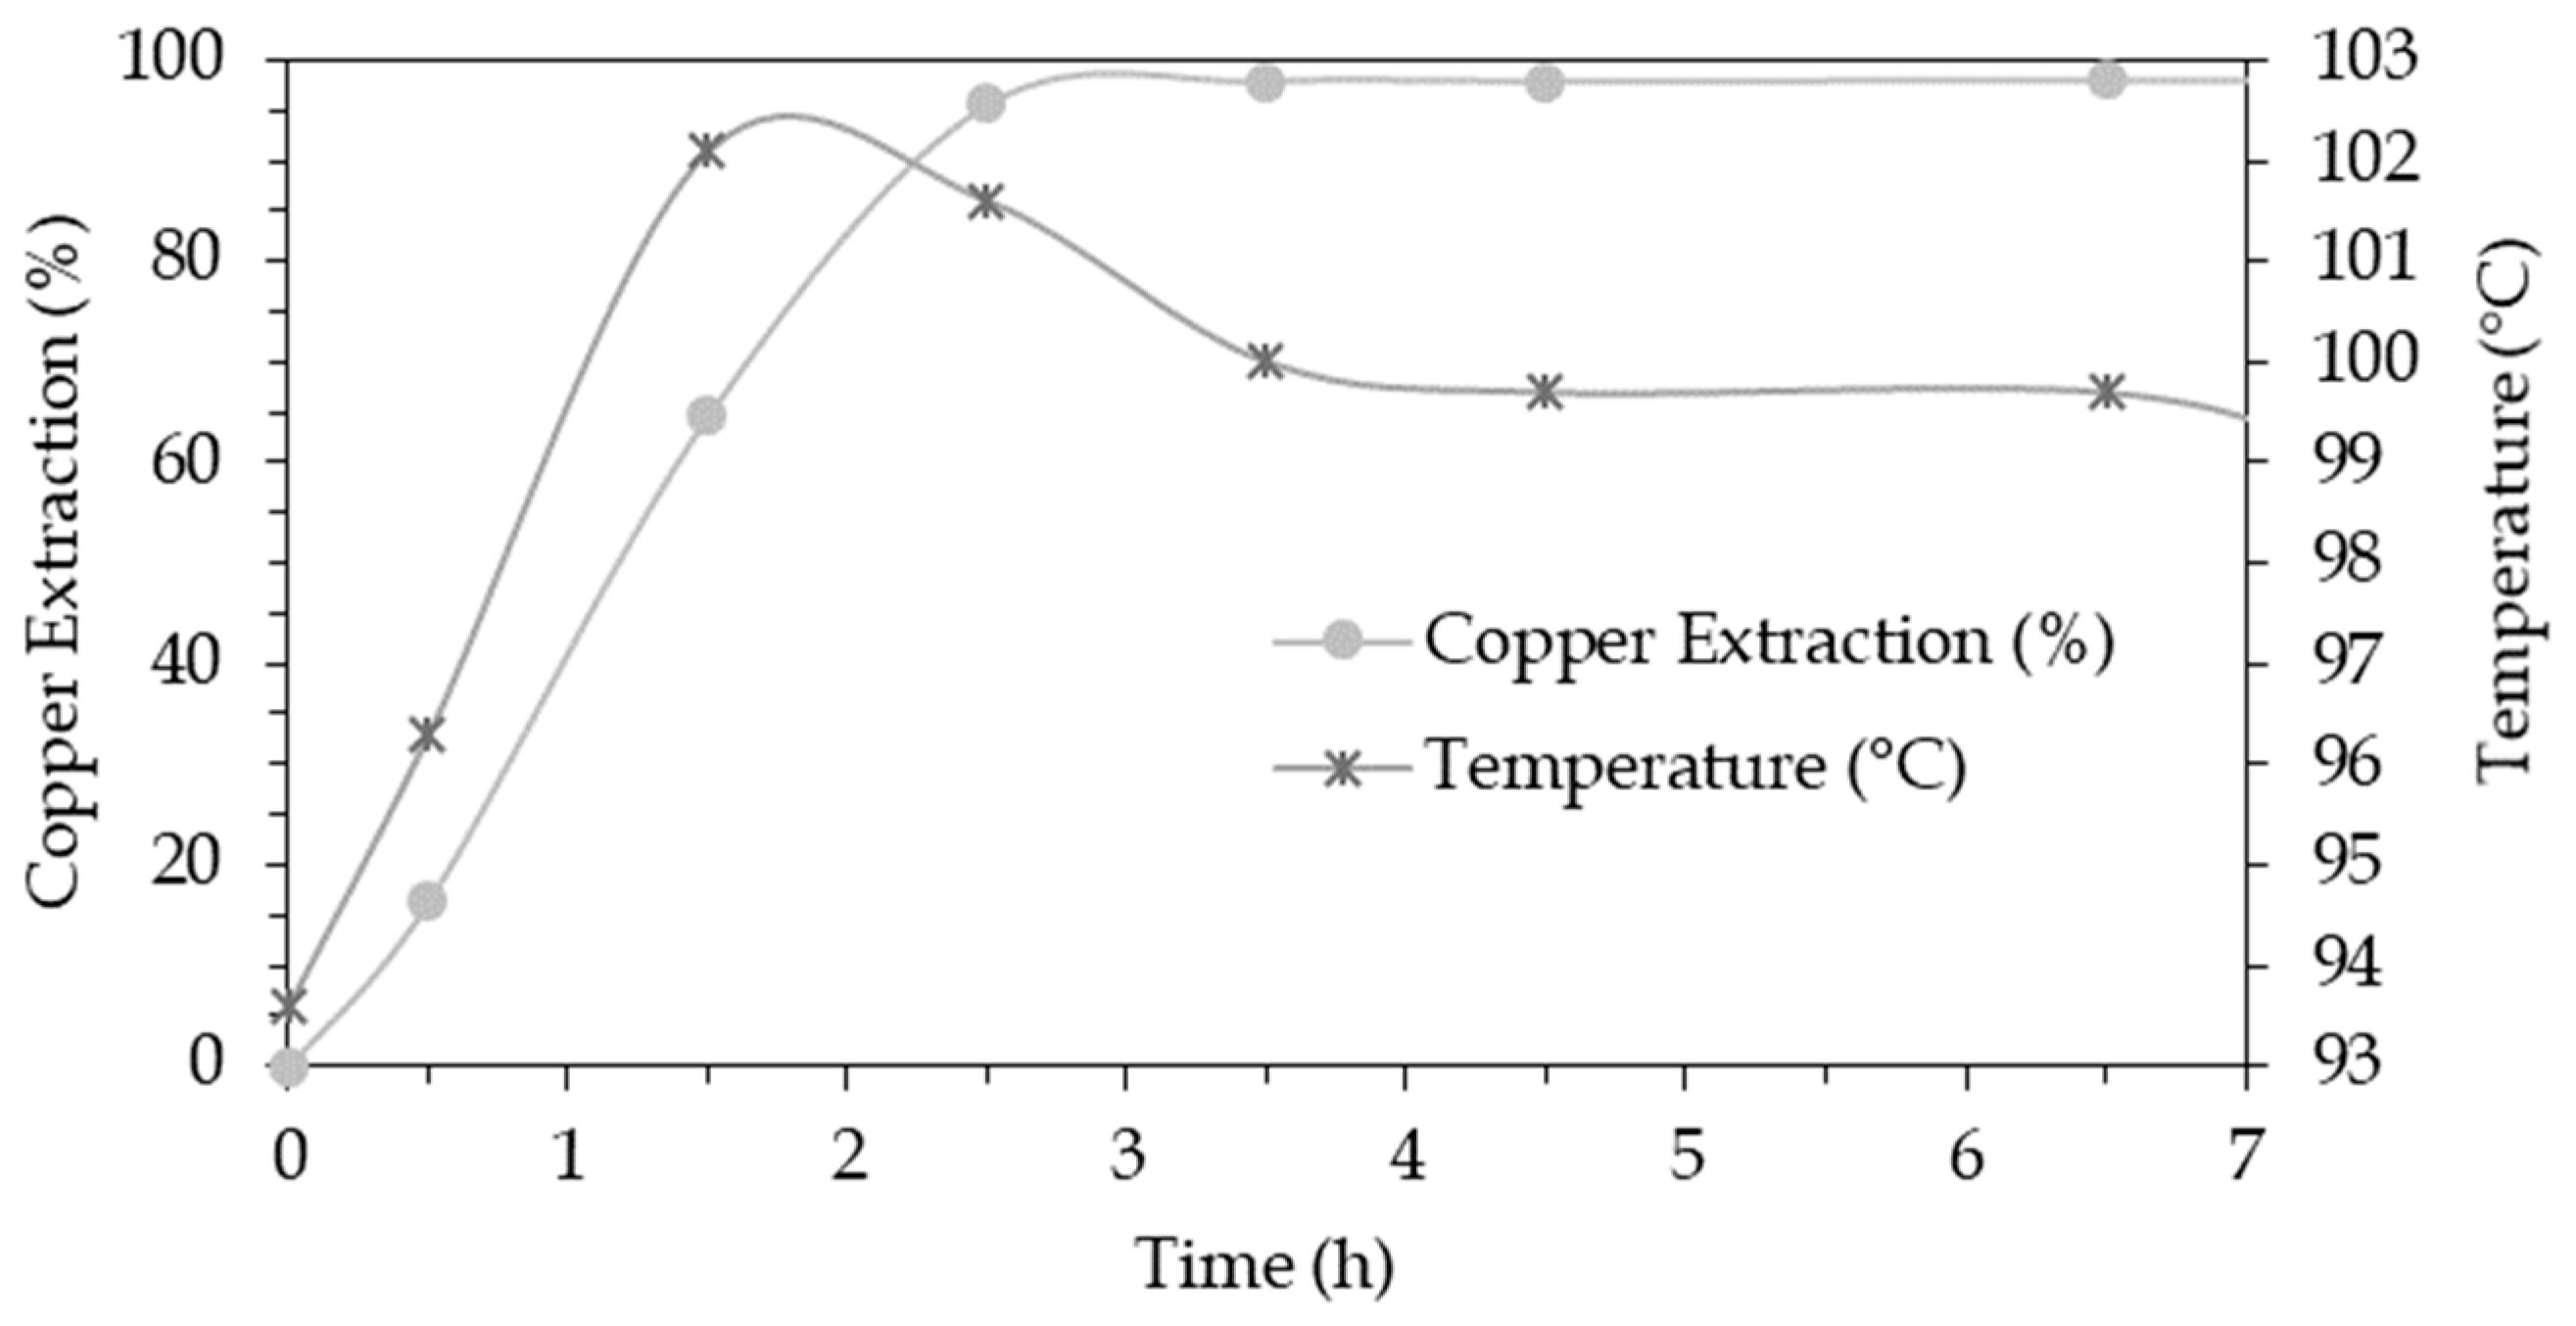
3.2. Extraction and Chemical Analysis
3.3. Statistical Analysis
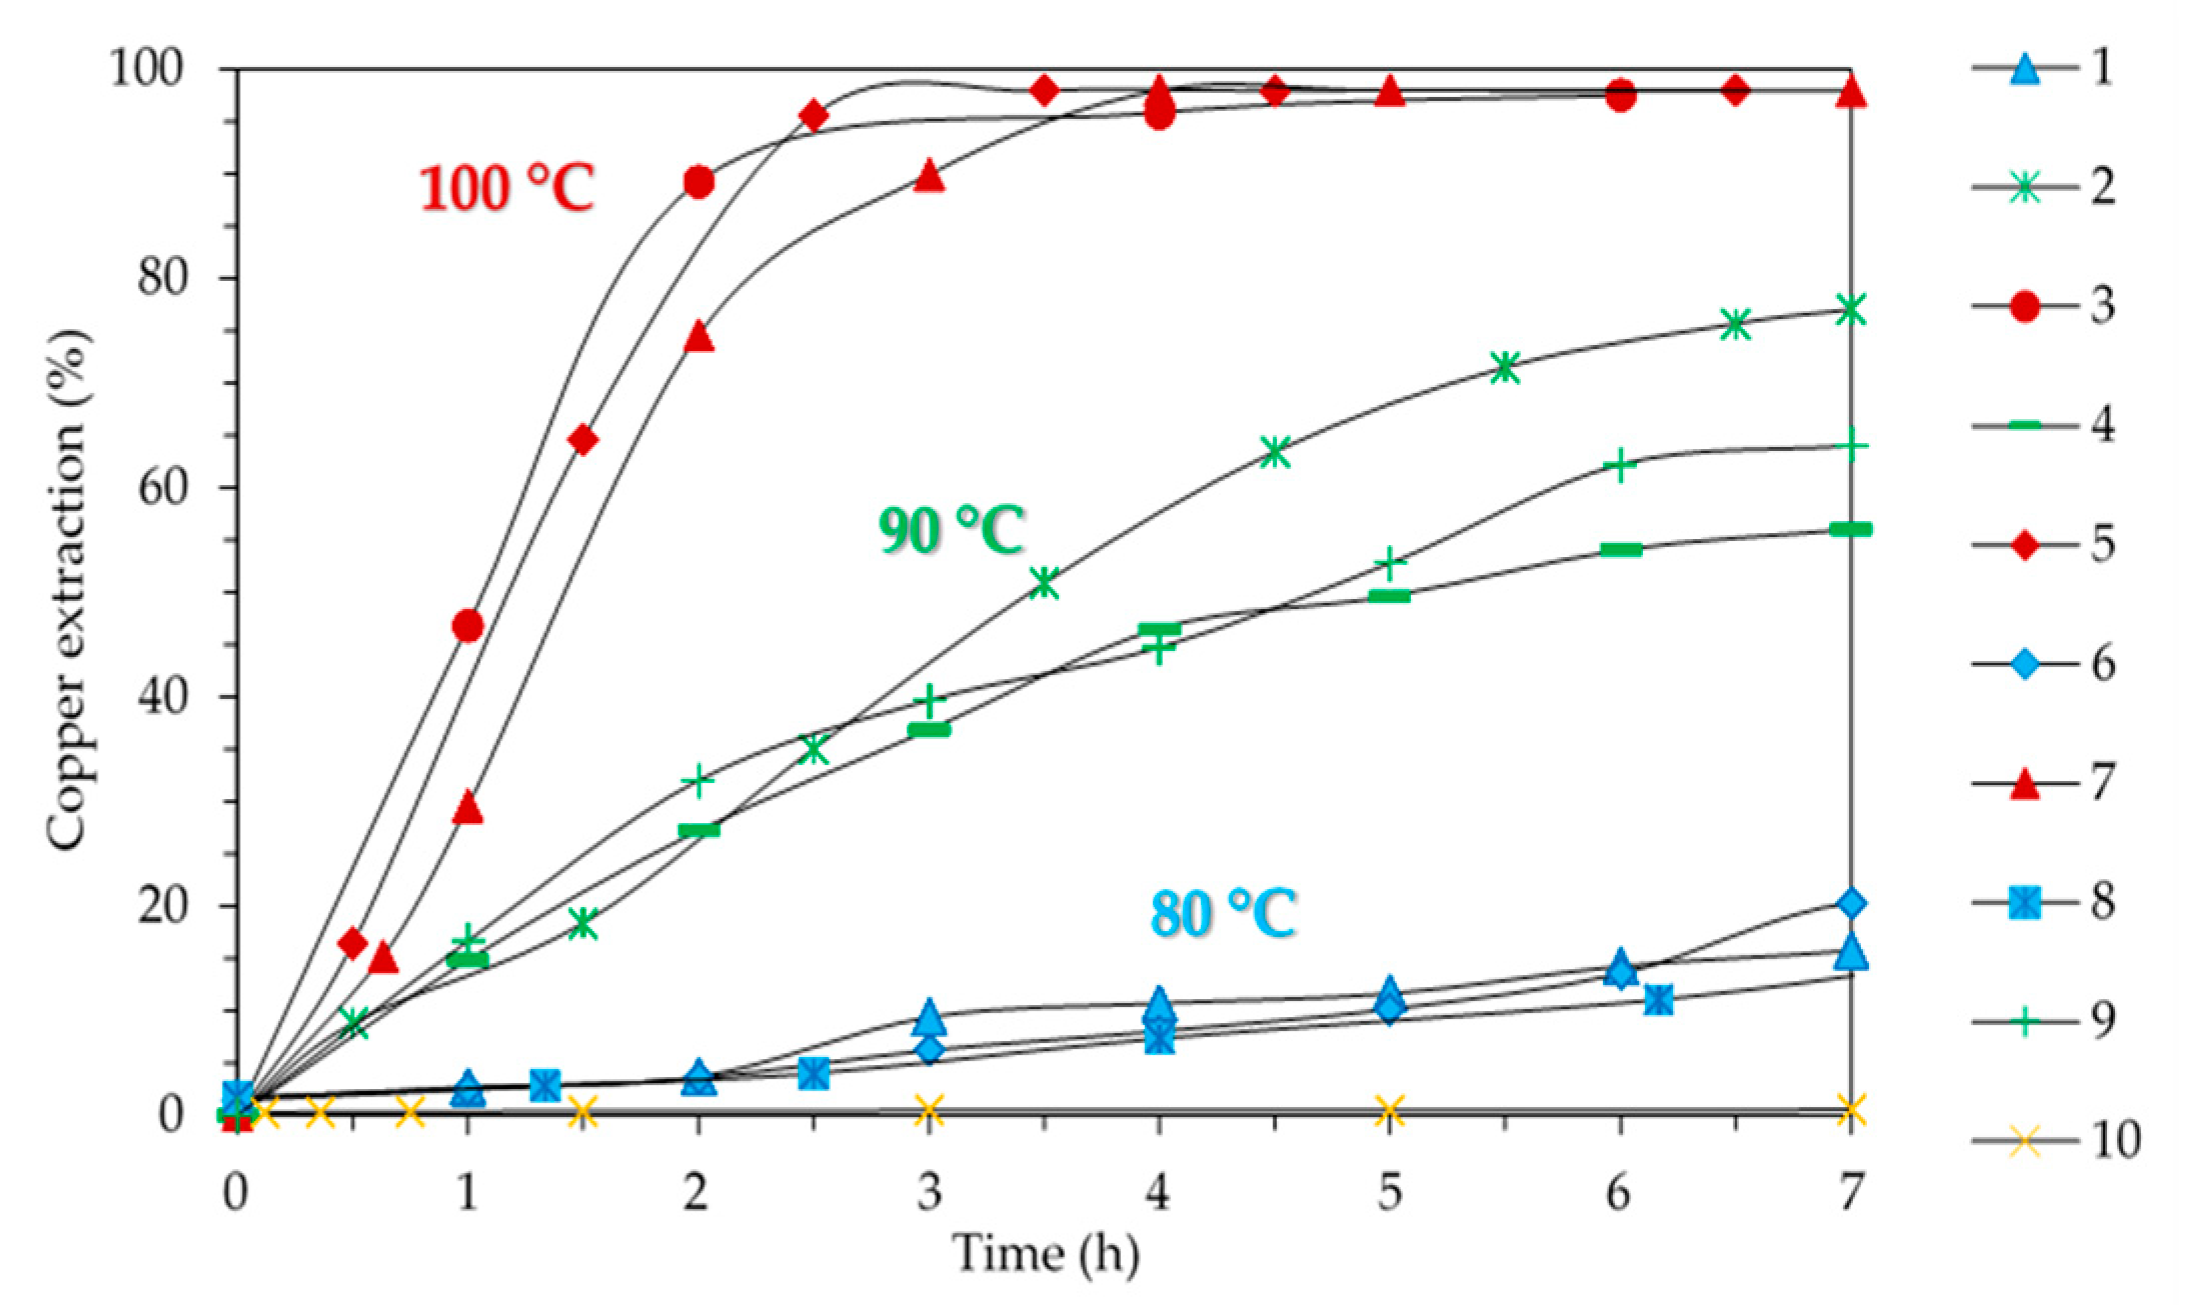
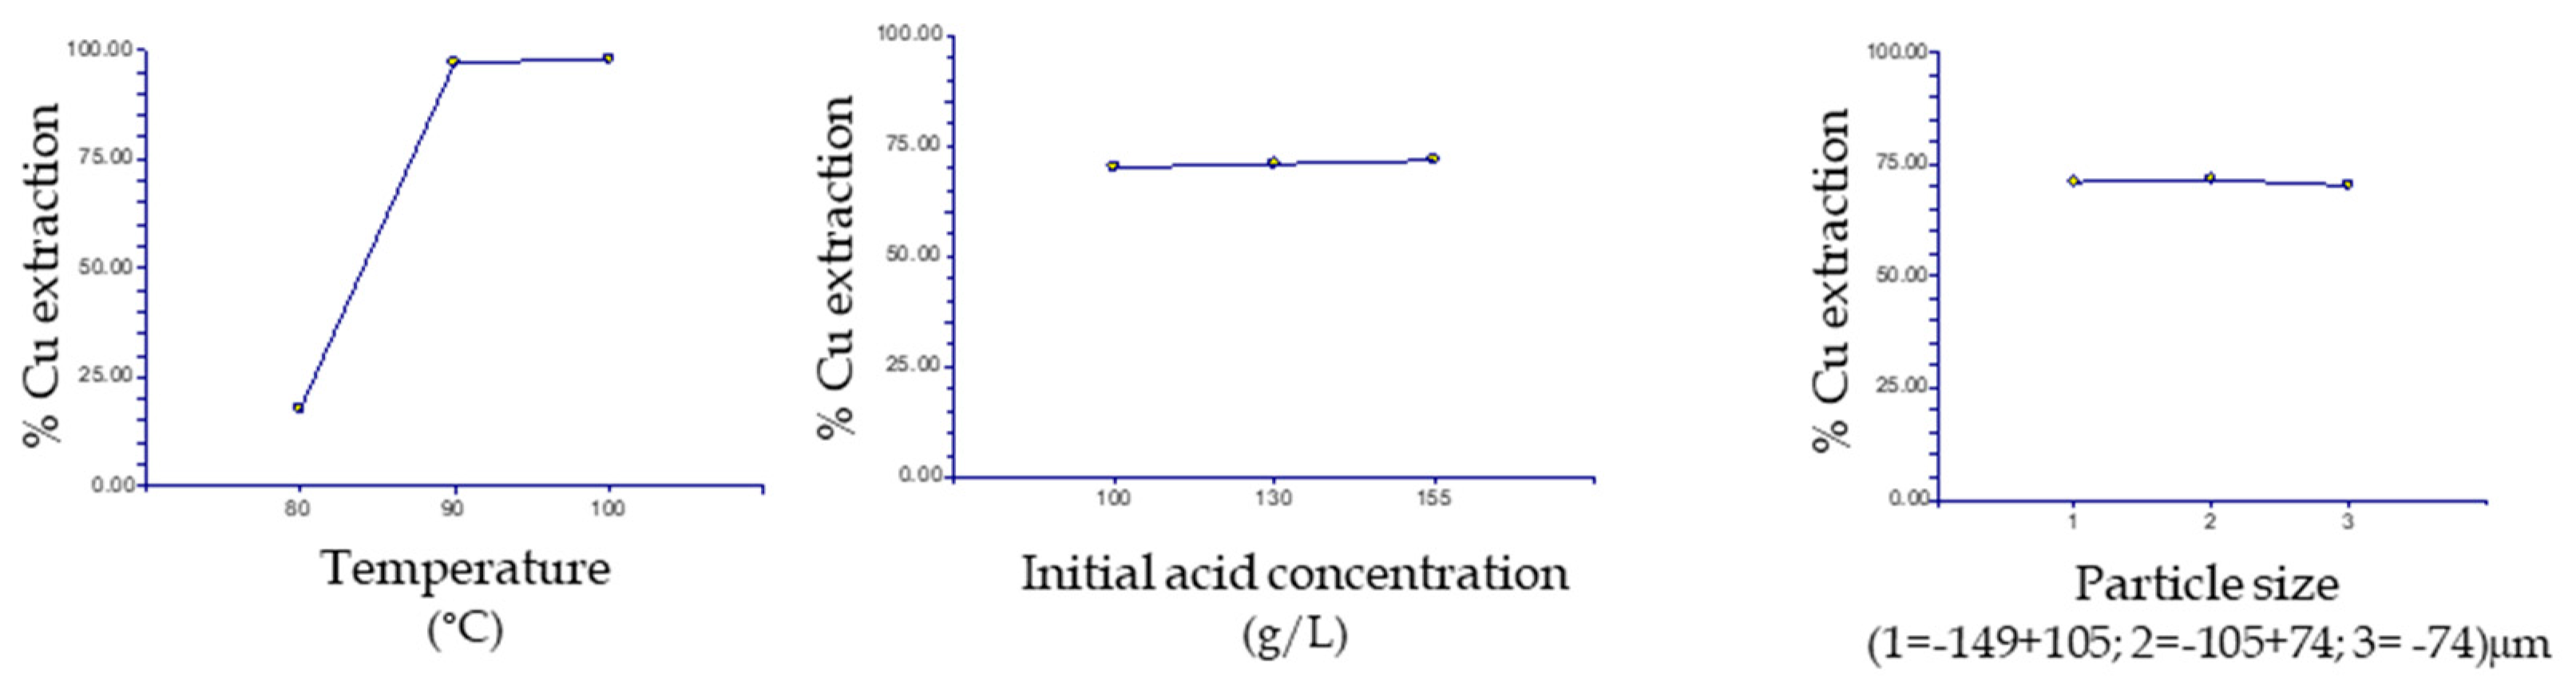
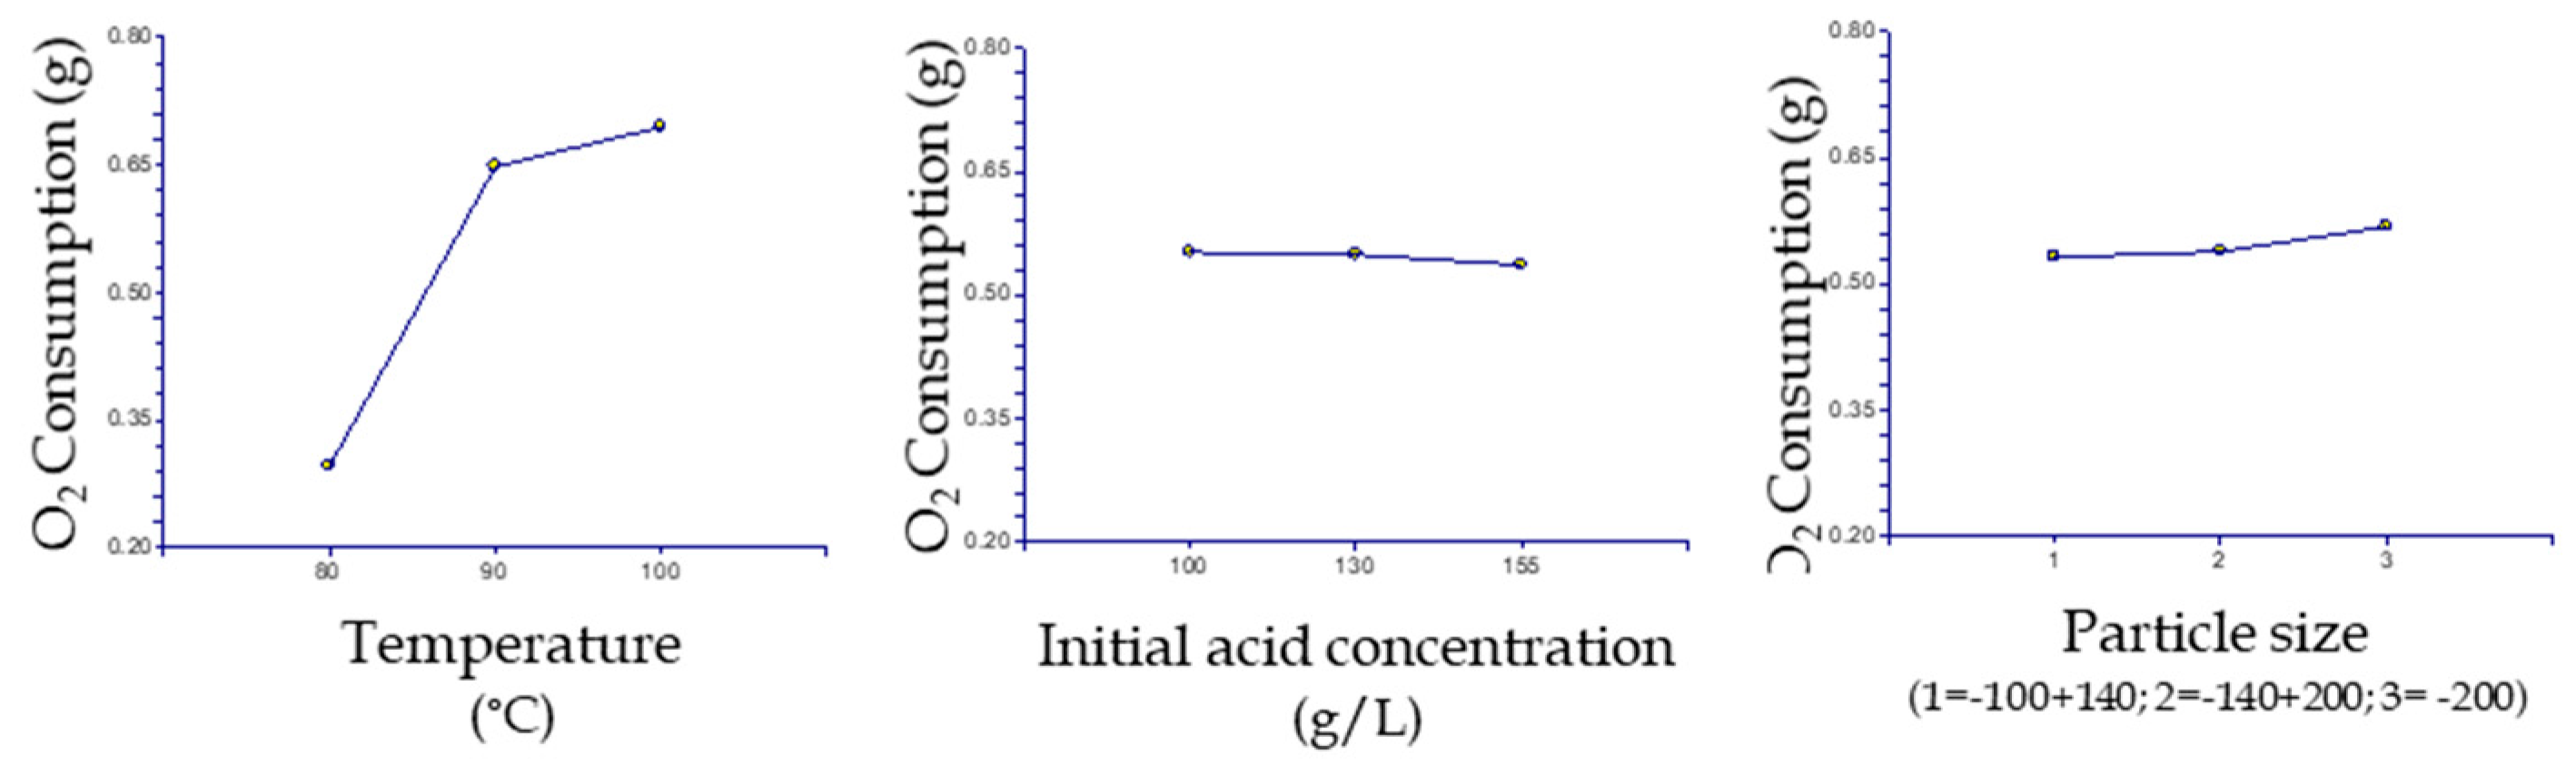
3.4. Effect of Temperature
3.5. Effect of Particle Size
3.6. Effect of Acidity
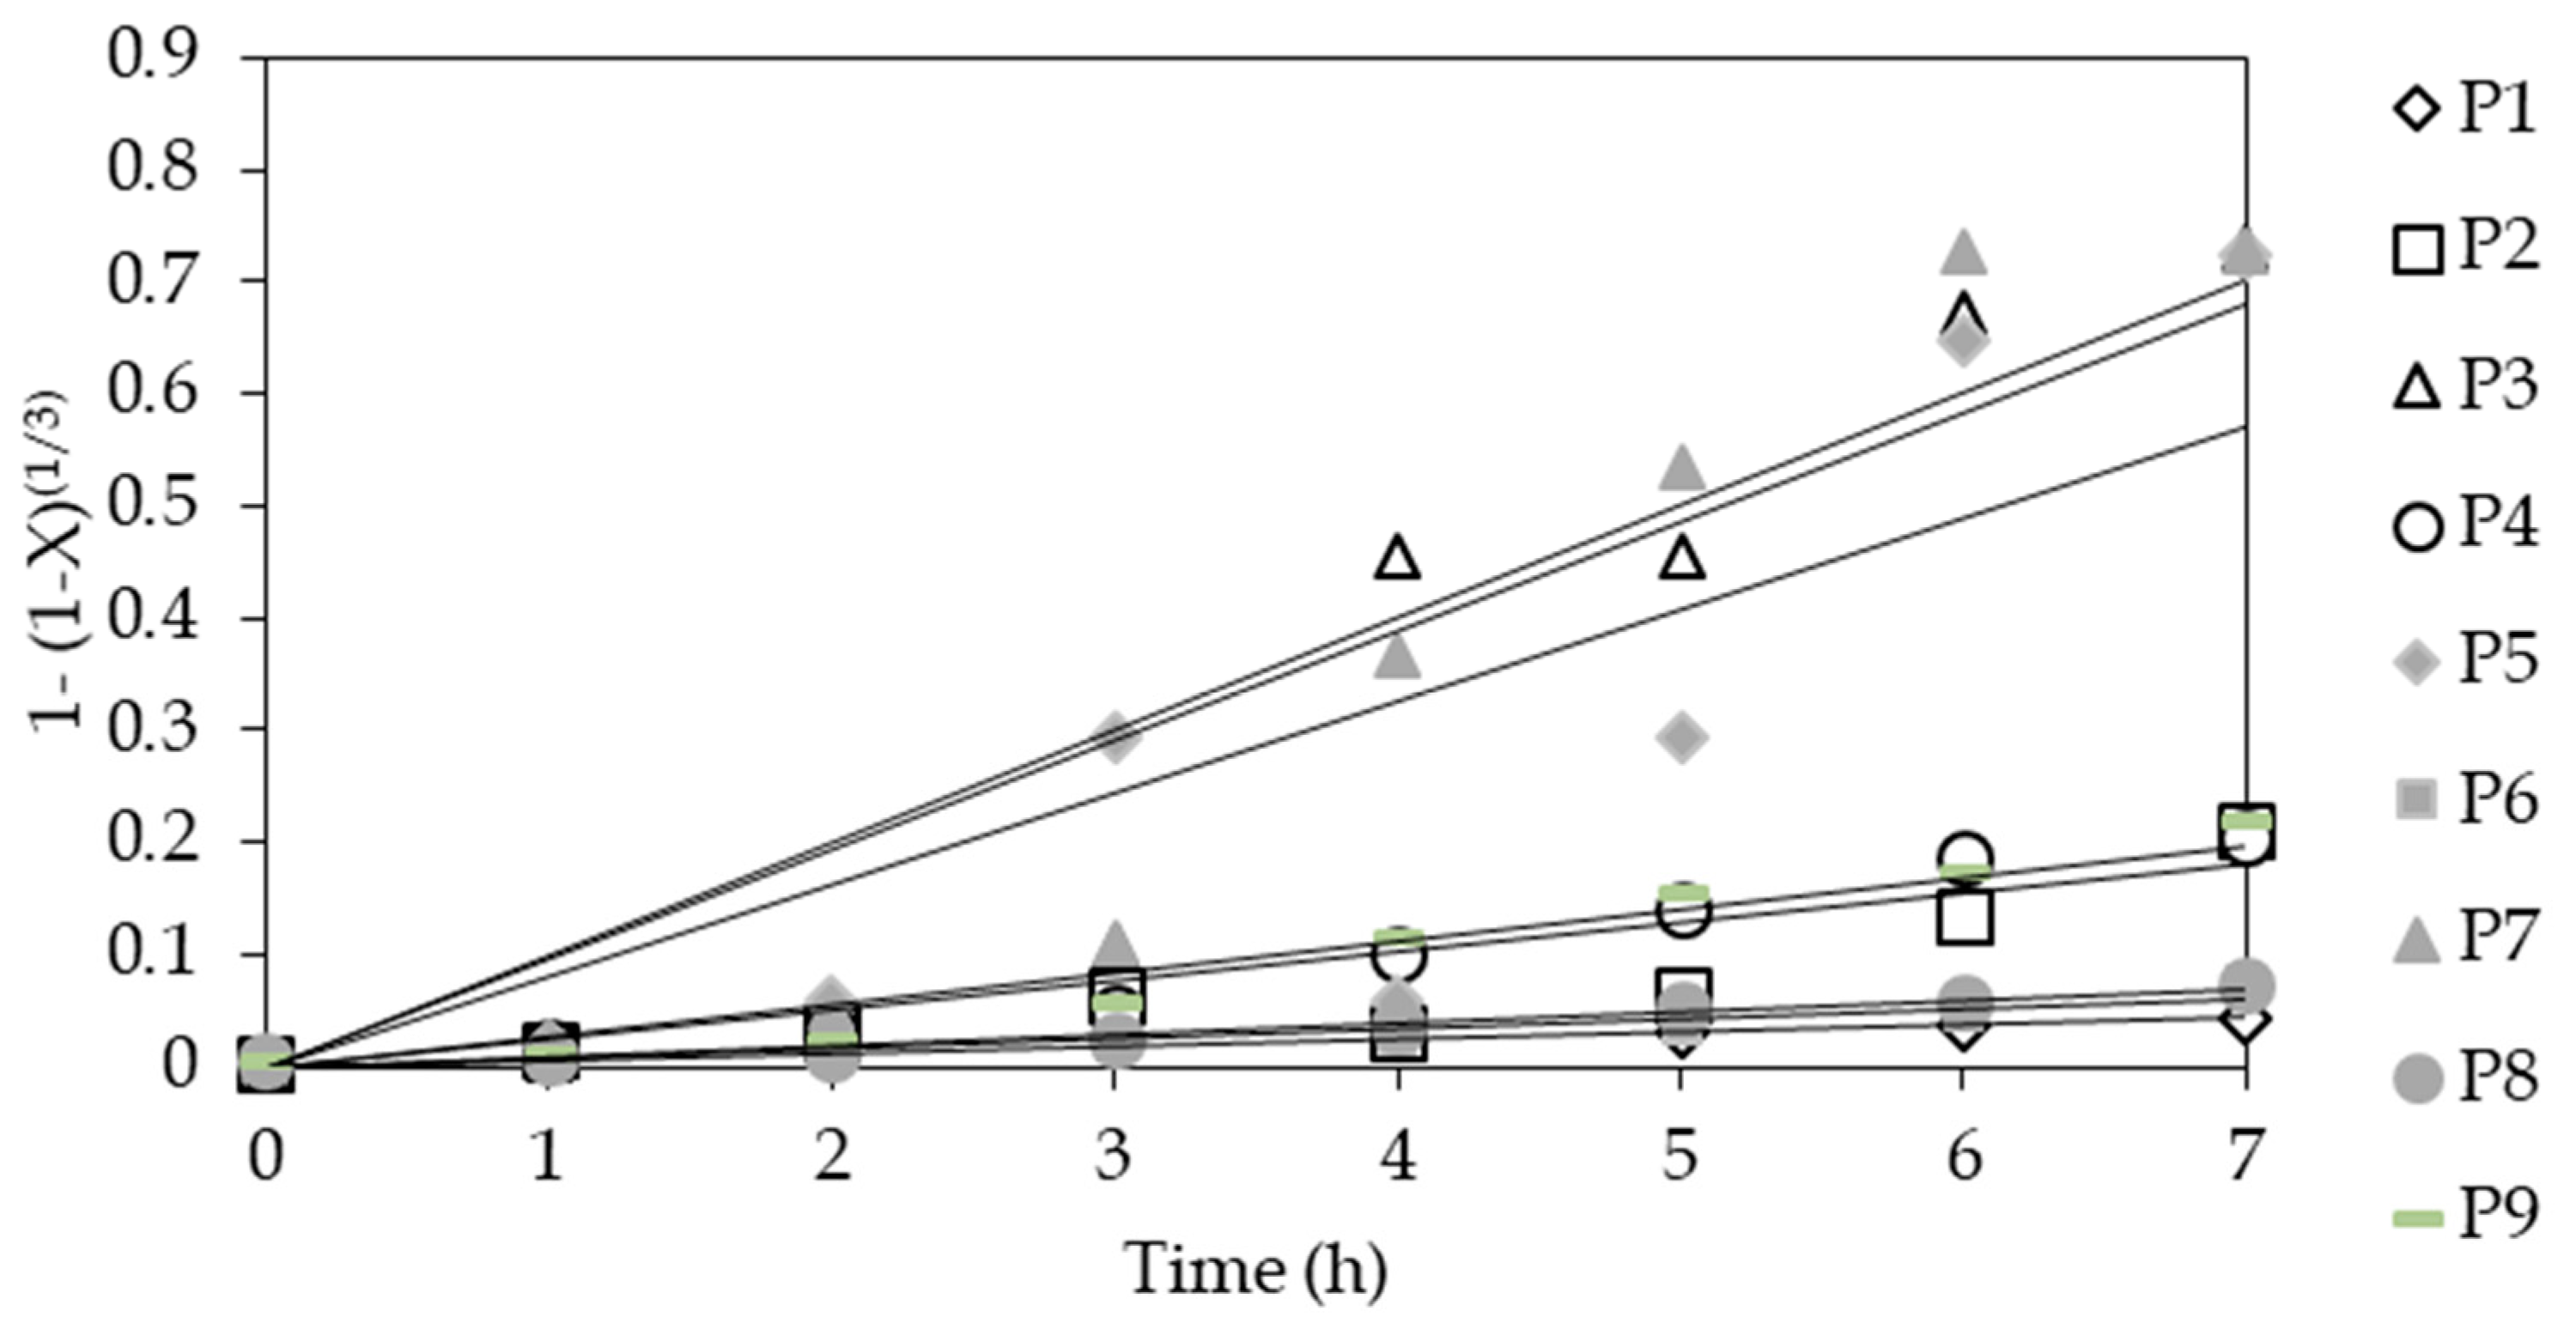
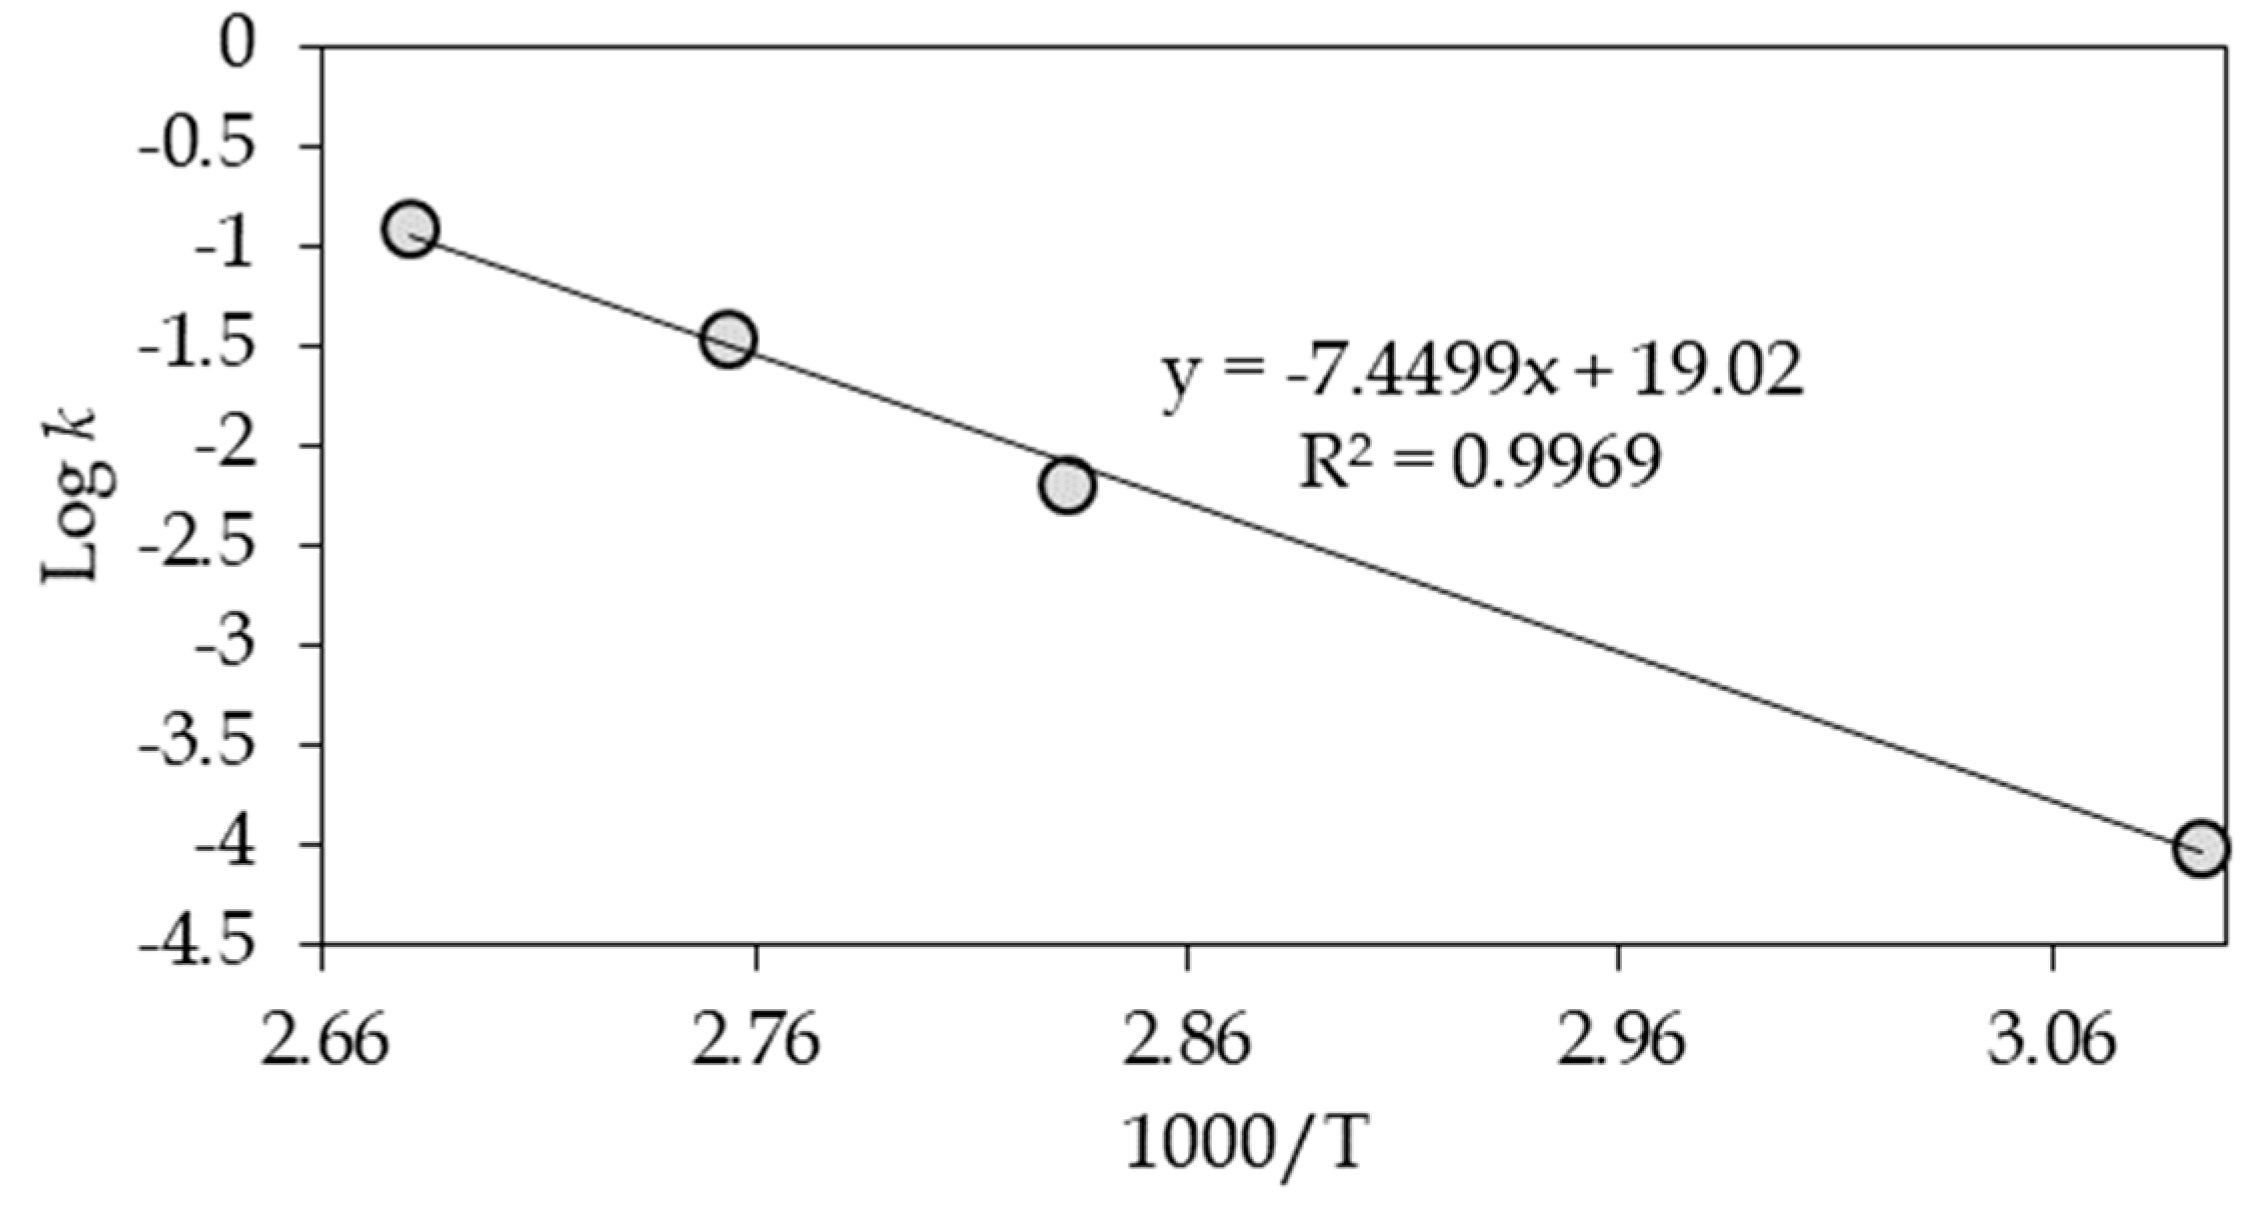
3.7. Kinetics
4. Conclusions
Author Contributions
Acknowledgments
Conflicts of Interest
References
- Taylor, A. A-Z of Copper Ore Leaching Short Course Manual; ALTA Metallurgical Services: Perth, Australia, 2014. [Google Scholar]
- Eksteen, J.; Oraby, E.; Tanda, B. An alkaline glycine-based process for copper recovery and iron rejection from chalcopyrite. In Proceedings of the IMPC 2016—28th International Mineral Processing Congress, Québec City, QC, Canada, 11–15 September 2016; ISBN 9781926872292. [Google Scholar]
- Hernández, P.; Taboada, M.; Herreros, O.; Graber, T.; Ghorbani, Y. Leaching of Chalcopyrite in Acidified Nitrate Using Seawater-Based Media. Minerals 2018, 8, 238. [Google Scholar] [CrossRef]
- Watling, H. Chalcopyrite hydrometallurgy at atmospheric pressure: 2. Review of acidic chloride process options. Hydrometallurgy 2014, 146, 96–110. [Google Scholar] [CrossRef]
- Turan, M.; Arslanoglu, H.; Altundogan, H. Optimization of the leaching conditions of chalcopyrite concentrate using ammonium persulfate in an autoclave system. J. Taiwan Inst. Chem. Eng. 2015, 50, 49–55. [Google Scholar] [CrossRef]
- Frias, C.; Vera, E.; Romero, A.; Blanco, J. Flotation and hydroprocessing of bulk concentrate from Las Cruces Mine. In Proceedings of the Pb-Zn Conference, Düsseldorf, Germany, 14–17 June 2015. [Google Scholar]
- Chen, S.; Berg, C.; Mansikkaviita, H.; Dezi, W.; Rong, Z. Drying Blended Concentrates by Kumera Steam Dryer for Kivcet Lead Flash Smelting. In Proceedings of the Pb-Zn Conference, Düsseldorf, Germany, 14–17 June 2015; pp. 257–265. [Google Scholar]
- Burrows, A.; Azekenov, T.; Zatayev, R. Lead ISASMELTTM Operation at Ust-Kamenogorsk. In Proceedings of the Pb-Zn Conference, Düsseldorf, Germany, 14–17 June 2015; pp. 245–256. [Google Scholar]
- Wang, C.; Yin, F.; Gao, W.; Ma, B. The research and Engineering Practice of the Lead Oxygen-Enrichment Flash Smelting. In Proceedings of the Pb-Zn Conference, Düsseldorf, Germany, 14–17 June 2015; pp. 273–284. [Google Scholar]
- Outotec. Software HSC Chemestry 8; Continuous Research and Development: Pori, Finland, 2014. [Google Scholar]
- Aydogan, S.; Ucar, G.; Canbazoglu, M. Dissolution kinetics of chalcopyrite in acidic potassium dichromate solution. Hydrometallurgy 2006, 81, 45–51. [Google Scholar] [CrossRef]
- Xian, Y.; Wen, S.; Deng, J.; Liu, J.; Nie, Q. Leaching chalcopyrite with sodium chlorate in hydrochloric acid solution. Can. Metall. Q. 2012, 51, 133–140. [Google Scholar] [CrossRef]
- Adebayo, A.; Ipinmoroti, K.; Ajayi, O. Dissolution kinetics of chalcopyrite with hydrogen peroxide in sulphuric acid medium. Chem. Biochem. Eng. Q. 2003, 17, 213–218. [Google Scholar]
- Aleksei, K.; Kirill, K.; Stanislav, N. Pressure Leaching of Chalcopyrite Concentrate. AIP Conf. Proc. 2018. [Google Scholar] [CrossRef]
- O’brien, R.; Macdonald, C.; Meadows, N. Chloride–Sulphate Leaching from Chalcopyrite Ores from Sabah. ALTA Copper Sulphides Symposium and Copper Hydrometallurgy Forum (GoldCoast, QLD); ALTA Metallurgical Services: Melbourne, Australia, 1999. [Google Scholar]
- Levenspiel, O. Chemical Reaction Engineering, 3rd ed.; Wiley: New York, NY, USA, 1999; ISBN 9780471254249. [Google Scholar]
- Grénman, H.; Salmi, T.; Murzin, D.Y. Solid-liquid reaction kinetics—Experimental aspects and model development. Rev. Chem. Eng. 2011, 27, 53–77. [Google Scholar] [CrossRef]
- Habashi, F. Kinetics of Metallurgical Process; Métallurgie Extractive: Québec City, QC, Canada, 1999; ISBN 978-2-922686-60-9. [Google Scholar]
- Padilla, R.; Pavez, P.; Ruiz, M. Kinetics of copper dissolution from sulfidized chalcopyrite at high pressures in H2SO4–O2. Hydrometallurgy 2008, 91, 113–120. [Google Scholar] [CrossRef]
- Baisui, H.; Batnasan, A.; Kazutoshi, H.; Yasushi, T.; Atsushi, S. Leaching and Kinetic Study on Pressure Oxidation of Chalcopyrite in H2SO4 Solution and the Effect of Pyrite on Chalcopyrite Leaching. J. Sustain. Metall. 2017, 3, 528–542. [Google Scholar] [CrossRef]
- Antonijevic, M.; Jankovic, Z.; Dimitrijevic, M. Investigation of the kinetics of chalcopyrite oxidation by potassium dichromate. Hydrometallurgy 1994, 35, 187–201. [Google Scholar] [CrossRef]
- Al-Harahsheh, M.; Kingman, S.; Hankins, N.; Somerfield, C.; Bradshaw, S.; Louw, W. The influence of microwaves on the leaching kinetics of chalcopyrite. Miner. Eng. 2005, 18, 1259–1268. [Google Scholar] [CrossRef]
- Mahajan, V.; Misra, M.; Zhong, K.; Fuerstenau, M. Enhanced leaching of copper from chalcopyrite in hydrogen peroxide-glycol system. Miner. Eng. 2007, 20, 670–674. [Google Scholar] [CrossRef]
- Kaplun, K.; Li, J.; Kawashima, N.; Gerson, A. Cu and Fe chalcopyrite leach activation energies and the effect of added Fe3+. Geochim. Cosmochim. Acta 2011, 75, 5865–5878. [Google Scholar] [CrossRef]
- Sokic, M.; Markovic, B.; Zivkovic, D. Kinetics of chalcopyrite leaching by sodium nitrate in sulphuric acid. Hydrometallurgy 2009, 95, 273–279. [Google Scholar] [CrossRef]
- Veloso, T.; Peixoto, J.; Pereira, M.; Leao, V. Kinetics of chalcopyrite leaching in either ferric sulphate or cupric sulphate media in presence of NaCl. Int. J. Miner. Process. 2016, 148, 147–154. [Google Scholar] [CrossRef]
- Gok, O.; Anderson, C.; Cicekli, G.; Cocen, E. Leaching kinetics of copper from chalcopyrite concentrate in nitrous-sulfuric acid. Physicochem. Probl. Miner. Process. 2013, 50, 339–413. [Google Scholar] [CrossRef]


| Leaching Processes | Name of the Processes | Country/Company | Status | Copper Mineral | Temperature (°C) | Pressure (atm) | Grinding | Acid | Oxidant Catalizer | Production (t/year) |
|---|---|---|---|---|---|---|---|---|---|---|
| Sulfate Medium Low temperature and low-medium pressure | Mount Gordon | Australia/Aditya Birla | Commercial plant | Chalcocite with pyrites | 80–90 | 8 | 80%, 100 µm | Diluted H2SO4 | O2, ions Fe3+ | 50,000 |
| Activox | Botswana (Tati)/Norilsk Process Technology | Pilot plant | Nickel-copper concentrates | 90–110 | 10–12 | Ultrafine (5–10 µm) | Diluted H2SO4 | O2, ions Fe3+ | 12,000–16,000 | |
| Las Cruces | Spain/First Quantum Minerals | Commercial plant | Chalcopyrite | 90 | Atmospheric | 10–15 µm | Diluted H2SO4 | H+, O2 and Fe3+ | 72,000 | |
| Galvanox | Canada (Vancouver)/UBC | Pilot plant | Chalcopyrite or enargite with pyrite | 80 | Atmospheric | 75 µm | Diluted H2SO4 | O2 or air, pyrite or silver | -- | |
| Sulfate Medium Medium temperature and low-medium pressure | Anglo American Corporation/University of British Columbia (AAC/UBC) | South Africa (Johannesburg)/AAC-UBC | Pilot plant | Chalcopyrite | 150 | 10–12 | 80%, 10 µm | Diluted H2SO4 | O2, surfactants (grinding required) | -- |
| Freeport McMoRan | USA (Arizona)/ Freeport McMoRan | Commercial plant | Copper sulphides concentrates | 160 | 13.6 | 98%, 15 µm | Diluted H2SO4 | Surfactants and O2 | 65,200 | |
| Sulfate Medium High temperature and high Pressure | Freeport McMoRan | USA (Arizona)/Freeport McMoRan | Semi-commercial plant (now closed) | Chalcopyrite and molybdenite | 225 | 32.5 | Fine grinding | Diluted H2SO4 | O2 | 16,000 |
| Sepon Copper | Sepon/MMG | Commercial plant | Chalcocite and clays | 80 | 1 | 100 µm | Diluted H2SO4 | Sulfuric acid, Fe3+ ions | 90,000 | |
| Pyrite | 230 | 30–32 | 80%, 50 µm | Diluted H2SO4 | O2 | |||||
| Bioleaching | BioCop | Chile (Chuquicamata)/Alliance copper (BHP Billiton y CODELCO) | Commercial plant | Chalcopyrite and enargite | 70–80 | Atmospheric | 37 µm | Diluted H2SO4 | O2, thermophile extreme bacteria, Fe3+ ions | 20,000 |
| BacTech-Mintek | México/Peñoles | Demo plant | Chalcopyrite and copper sulphides | 35–50 | Atmospheric | 10–20 µm | Diluted H2SO4 | Air, moderate thermophile bacteria ions Fe3+ | 160 |
| Element | Cu | Fe | As | Pb | Ca | Zn | Al | S | Si | CO3 |
|---|---|---|---|---|---|---|---|---|---|---|
| Wt.% | 24.7 | 26 | 0.81 | 6.56 | 1.25 | 6.36 | 0.27 | 29.9 | 1.12 | 1.13 |
| Compounds | Weight% | |
|---|---|---|
| Chalcopyrite | CuFeS2 | 70.7 |
| Galena | PbS | 7.8 |
| Sphalerite | ZnS | 9.3 |
| Gypsum | CaSO4 | 4.1 |
| Pyrite | FeS2 | 7.8 |
| Group | Mineral | Formula | Weight% |
|---|---|---|---|
| Sulfides | Galena | PbS | 9.31 |
| Sphalerite | ZnS | 11.09 | |
| Chalcopyrite | CuFeS2 | 68.65 | |
| Tetrahedrite | (Cu0.8Fe0.1Zn0.1)12(Sb0.8As0.2)4S13 | 0.08 | |
| Pyrite | FeS2 | 2.26 | |
| Pyrrhotite | FeS | 2.00 | |
| Arsenopyrite | FeAsS | 1.27 | |
| Silver species | Native Ag | Ag | 0.16 |
| Freibergite | (Ag0.3Cu0.6Fe0.1)12Sb4S13 | 0.002 | |
| Enargite | Cu3AsS4 | 0.01 | |
| Gangues and other oxides species | Andradite | Ca3Fe2Al(SiO4)3 | 0.41 |
| Apatite | Ca5(PO4)3(F, Cl, OH) | 0.004 | |
| Augite | (Ca,Mg,Fe)2(Si,Al)2O6 | 0.27 | |
| Biotite | K(Mg, Fe)3AlSi3O10(OH, F)2 | 0.09 | |
| Calcite | CaCO3 | 1.35 | |
| Chlorite | (Mg,Fe)3(Si,Al)4O10(OH)2·(Mg,Fe)3(OH)6 | 0.10 | |
| Quartz | SiO2 | 0.48 | |
| Diopside | CaMgSi2O6 | 0.23 | |
| Grossularite | Ca3Al2Si3O12 | 0.36 | |
| Moonstone | (Ca0.6Na0.4)Si2AlO8 | 0.18 | |
| Orthoclase | K(AlSi3O8) | 0.48 | |
| Ox_Fe | FexOy | 0.14 | |
| Titanite | CaTiSiO5 | 0.02 | |
| Others | - | 1.06 |
| No. Test | Particle Size (μm) | Initial Acidity (g/L) | Temperature (°C) |
|---|---|---|---|
| 1 | −74 | 100 | 80 |
| 2 | −74 | 130 | 90 |
| 3 | −74 | 155 | 100 |
| 4 | −105 + 74 | 100 | 90 |
| 5 | −105 + 74 | 130 | 100 |
| 6 | −105 + 74 | 155 | 80 |
| 7 | −149 + 105 | 100 | 100 |
| 8 | −149 + 105 | 130 | 80 |
| 9 | −149 + 105 | 155 | 90 |
| 10 | −149 + 105 | 130 | 50 |
| Element | Residue | Solution | Distribution in Liquid Phase |
|---|---|---|---|
| (Wt.%) | (g/L) | (%) | |
| Cu | 1.12 | 22.83 | 97.99 |
| Fe | 3.65 | 27.26 | 94.69 |
| As | 0.08 | 0.8 | 95.9 |
| Pb | 13.2 | 0.055 | 1.0 |
| Zn | 0.25 | 5.96 | 98.24 |
| S° | 56.2 | 0.0 | 0.0 |
| Fe2+ | - | 3.89 | - |
| H2SO4 | - | 45.45 | - |
| Compounds | Wt.% | |
|---|---|---|
| Chalcopyrite | CuFeS2 | 3.23 |
| Anglesite | PbSO4 | 19.3 |
| Gypsum | CaSO4 | 2.3 |
| Silica | SiO2 | 5.0 |
| Pyrite | FeS2 | 5.7 |
| Elemental sulfur | S8 | 64.1 |
| Particle Size Distribution | ||
|---|---|---|
| D90% | D50% | D10% |
| 16.92 | 11.00 | 6.99 |
| Parameter | DF | SS | MS | F | Prob Level | Power |
|---|---|---|---|---|---|---|
| Cu Extraction | ||||||
| Temperature | 2 | 10160.97 | 5080.487 | 98.26 | 0.010075 * | 0.993017 |
| Initial acid | 2 | 114.2358 | 57.11791 | 1.1 | 0.47513 | 0.10105 |
| Particle size | 2 | 36.89769 | 18.44884 | 0.36 | 0.737023 | 0.066798 |
| S | 2 | 103.4102 | 51.70508 | |||
| Total (Adjusted) | 8 | 10415.52 | ||||
| Total | 9 | |||||
| Oxygen Consumption | ||||||
| Temperature | 2 | 0.2263376 | 0.1131688 | 46.99 | 0.020836 * | 0.909376 |
| Initial acid | 2 | 4.52 × 10⁴ | 2.26 × 10⁴ | 0.09 | 0.91428 | 0.054443 |
| Particle size | 2 | 1.85 × 10³ | 9.25 × 10⁴ | 0.38 | 0.722385 | 0.06808 |
| S | 2 | 4.82 × 10³ | 2.41 × 10³ | |||
| Total (Adjusted) | 8 | 0.2334562 | ||||
| Total | 9 | |||||
| Test | P1 | P2 | P3 | P4 | P5 | P6 | P7 | P8 | P9 | P10 |
|---|---|---|---|---|---|---|---|---|---|---|
| Slope (k) | 0.006 | 0.032 | 0.12 | 0.031 | 0.096 | 0.009 | 0.112 | 0.01 | 0.035 | 0.0001 |
| R2 | 0.973 | 0.81 | 0.938 | 0.97 | 0.806 | 0.929 | 0.919 | 0.973 | 0.968 | 0.835 |
| Leach Media | Activation Energy (kJ/mol) | Reference | Temperature Range (°C) |
|---|---|---|---|
| K2Cr2O7 + H2SO4 | 24 | [11] | 50–97 |
| H2O2 + H2SO4 | 39 | [13] | 30–80 |
| O2 + H2SO4 | 93.5 | [19] | 125–140 |
| H2SO4 | 42.4 | [20] | 160–180 |
| K2Cr2O7 + H2SO4 | 48–54 | [21] | - |
| Fe2(SO4)3 + H2SO4 | 79.5 | [22] | 50–90 |
| H2O2 + H2SO4 | 30 | [23] | - |
| Fe2(SO4)3 + H2SO4 | 21 ± 5 | [24] | 55–85 |
| NaNO3 + H2SO4 | 83 | [25] | 70–90 |
| Fe2(SO4)3 + Cu2+ + NaCl + H2SO4 | 66.6 | [26] | 70–90 |
| NaNO2 + H2SO4 | 34.0 | [27] | 80–120 |
| H2SO4 + O2 | 61.93 | Present work | 80–100 |
© 2019 by the authors. Licensee MDPI, Basel, Switzerland. This article is an open access article distributed under the terms and conditions of the Creative Commons Attribution (CC BY) license (http://creativecommons.org/licenses/by/4.0/).
Share and Cite
Cháidez, J.; Parga, J.; Valenzuela, J.; Carrillo, R.; Almaguer, I. Leaching Chalcopyrite Concentrate with Oxygen and Sulfuric Acid Using a Low-Pressure Reactor. Metals 2019, 9, 189. https://doi.org/10.3390/met9020189
Cháidez J, Parga J, Valenzuela J, Carrillo R, Almaguer I. Leaching Chalcopyrite Concentrate with Oxygen and Sulfuric Acid Using a Low-Pressure Reactor. Metals. 2019; 9(2):189. https://doi.org/10.3390/met9020189
Chicago/Turabian StyleCháidez, Josué, José Parga, Jesús Valenzuela, Raúl Carrillo, and Isaías Almaguer. 2019. "Leaching Chalcopyrite Concentrate with Oxygen and Sulfuric Acid Using a Low-Pressure Reactor" Metals 9, no. 2: 189. https://doi.org/10.3390/met9020189
APA StyleCháidez, J., Parga, J., Valenzuela, J., Carrillo, R., & Almaguer, I. (2019). Leaching Chalcopyrite Concentrate with Oxygen and Sulfuric Acid Using a Low-Pressure Reactor. Metals, 9(2), 189. https://doi.org/10.3390/met9020189