Article

Corrosion and Tensile Behaviors of Ti-4Al-2V-1Mo-1Fe and Ti-6Al-4V Titanium Alloys

1
School of Materials Science and Engineering, Jiangsu University of Science and Technology, Zhenjiang 212003, China
2
Institute of Metal Research, Chinese Academy of Sciences, Shenyang 110016, China
3
School of Materials Science and Engineering, Northeastern University, Shenyang 110004, China
*
Authors to whom correspondence should be addressed.
Metals 2019, 9(11), 1213; https://doi.org/10.3390/met9111213
Submission received: 12 October 2019 / Revised: 5 November 2019 / Accepted: 6 November 2019 / Published: 11 November 2019
(This article belongs to the Special Issue Titanium Alloys and Titanium-Based Matrix Composites)

Abstract

:
X-ray diffraction (XRD), scanning electron microscope (SEM), immersion, electrochemical, and tensile tests were employed to analyze the phase constitution, microstructure, corrosion behaviors, and tensile properties of a Ti-6Al-4V alloy and a newly-developed low cost titanium alloy Ti-4Al-2V-1Mo-1Fe. The results showed that both the Ti-6Al-4V and Ti-4Al-2V-1Mo-1Fe alloys were composed of α and β phases. The volume fractions of β phase for these two alloys were 7.4% and 47.3%, respectively. The mass losses after 180-day immersion tests in 3.5 wt.% NaCl solution of these alloys were negligible. The corrosion resistance of the Ti-4Al-2V-1Mo-1Fe alloy was higher than that of the Ti-6Al-4V alloy. The tensile tests showed that the Ti-4Al-2V-1Mo-1Fe alloy presented a slightly higher strength but a lower ductility compared to the Ti-6Al-4V alloy.

1. Introduction

Titanium and its alloys are widely used in aerospace [1,2], marine [3], chemical [4,5], and biomedical [6,7,8] fields due to their excellent mechanical properties, high corrosion resistance, and good biocompatibility. Their high corrosion resistance in aggressive environments is ensured by the formation of a compact and chemically-stable oxide film, mainly composed of titanium oxide, TiO2, which spontaneously covers the metal surface to protect the metal substrate [9,10,11]. The corrosion behaviors of the commercial Ti-6Al-4V alloy vary with corrosive environments. Yue et al. [12] found that the Ti-6Al-4V alloy exhibited a poor corrosion behavior in a solution with a high Cl concentration or in acid environments with a local accumulation of Cl ions. Blanco-Pinzon et al. [13] reported that the Ti-6Al-4V alloy was susceptible to corrosion in H2SO4 solution but its corrosion resistance could be significantly improved by alloying Pd and Ni. Wang et al. [5] investigated the effects of alloying elements Pd, Mo, and Ni on the corrosion behavior of titanium alloy in H2SO4 solution containing fluoride ions, and found that these alloying elements had no influence on the interaction of the F ions with titanium matrix, and on the film composition. The addition of Ni accelerated the cathodic reactions while the addition of Mo retarded the anodic process [5]. Newman et al. [14,15] found that Mo located at defect sites preferentially dissolved, leading to the formation of stable Mo oxides to decrease the anodic dissolution rate [16].
Generally, element alloying is an effective method to improve the mechanical properties of titanium and its alloys [17,18]. Since Fe and Al elements are characteristic of low toxicity and cost [19,20,21], they are added into the titanium and titanium alloys, and the effect of Fe or Al alloying on the mechanical and corrosion properties of titanium alloys has been studied. It is reported that the Ti-4.5Al-3V-2Mo-2Fe alloy has superior mechanical properties to the Ti-6Al-4V alloy [17] due to its microstructural characteristics and element alloying (i.e., Mo and Fe). Lu et al. [22] investigated the mechanical properties and electrochemical corrosion behaviors of Ti-6Al, Ti-6Al-4V, and Ti-6Al-xFe alloys, and found that the Ti-6Al-4Fe alloy possessed the lowest Young’s modulus and exhibits the highest strength:modulus ratios, and the Ti-6Al-xFe alloys exhibited a higher corrosion resistance in simulated human body fluid (SBF) than both the Ti-6Al and Ti-6Al-4V alloys. However, the corrosion resistance of the Ti-6Al-xFe alloys decreased with the increasing Fe content, suggesting that the content of Fe added into the titanium alloys needed to be controlled at a lower level to achieve a better corrosion performance. It is consistent with the results conducted by Pimenova et al. [21] and Hsu et al. [23,24]. When the concentration of Al was higher than 15 wt.%, Ti-xAl-yFe alloys underwent severe pitting corrosion due to the precipitates of β phase and uneven distribution of the alloying elements [21]. Thus, more work has to be performed to clarify the effect of Al and Fe alloying on the corrosion and mechanical performances of titanium alloys, especially when Mo is added to improve the resistance of localized corrosion.
In this research, the Ti-4Al-2V-1Mo-1Fe alloy developed by the Institute of Metal Research, Chinese Academy of Sciences (IMR), was investigated. This type of alloy has lower contents of Al and V but higher contents of Mn and Fe. The cost of this alloy is relatively low, providing a potential alternative to the Ti-6Al-4V alloy. The aim of this work is to investigate the corrosion behavior of this newly-developed alloy in a simulated marine environment (3.5 wt.% NaCl solution), and its tensile property. The difference of alloy property between Ti-6Al-4V and Ti-4Al-2V-1Mo-1Fe alloys was systematically studied.

2. Experimental Details

The materials used in the present study were the commercial Ti-6Al-4V alloy, and the Ti-4Al-2V-1Mo-1Fe alloy fabricated in the IMR, Shenyang, China. The chemical compositions (wt.%) of these two alloys are listed in Table 1. Prior to the study, the Ti-6Al-4V and Ti-4Al-2V-1Mo-1Fe alloys were heated to 750 °C for 3 h and then cooled to room temperature in air. Samples for the immersion test were cut into sheets with dimensions of 40 mm × 20 mm × 4 mm. Samples for the electrochemical test and microstructure observation were cut into square sheets (10 mm × 10 mm × 2 mm) and sealed in a mixture of epoxy and polyamide resins with an exposed surface of 1 cm2. Then each specimen was gradually ground with SiC papers up to 1000 grit, polished with a diamond paste of 0.5 μm, then cleaned in ethanol, and finally dried with hot air.
The immersion and electrochemical tests were performed in a 3.5 wt.% NaCl solution at 25 ± 1 °C (controlled by a thermostat water bath). The 3.5 wt.% NaCl solution was prepared using analytical-grade sodium chloride and distilled water. Immersion tests were carried out to investigate the long-term corrosion behaviors of the Ti-6Al-4V and Ti-4Al-2V-1Mo-1Fe alloys. Five samples were prepared for each test solution, with an immersion period of 180 days to ensure the reproducibility. Samples with dimensions of 10 mm × 10 mm × 2 mm were successively ground with abrasive papers to 1000 grit and then were immersed in aerated 3.5% NaCl solution (volume: 1.5 L) without stirring. The solutions were replaced every 10 days. The electrochemical behaviors of the tested alloys were measured using a CS350 (Wuhan Corrtest Instruments Corp., Ltd. Wuhan, China) electrochemical workstation and a three-electrode electrochemical cell, and the method was described in the literature [25]. Potentiodynamic polarization was performed at a scan rate of 0.1667 mV/s from −500 mVSCE below the open circuit potential (OCP) and terminated at 2500 mVSCE. After immersing in 3.5 wt.% NaCl solution at the OCP for 1 h, electrochemical impedance spectroscopy (EIS) was conducted with a sinusoidal potential perturbation of 10 mV and a frequency range from 105 to 10−2 Hz. All measurements were repeated at least three times in naturally-aerated 3.5 wt.% NaCl solution without stirring to ensure the reproducibility. Cview and Zview software were used to fit the electrochemical data. Tensile tests of these two alloys were carried out on an Instron-type testing machine with a stain rate of 3 mm·s−1 at 25 ± 1 °C [26]. To ensure the reliability of the measured data, at least three repeated measurements were carried out for each time. The standard deviation method was used to analyze the data and obtain the mechanical property parameters.
The crystal structures of the tested alloys were determined using a D/Max 2400 X-ray diffractometer (Rigaku Corporation, Tokyo, Japan) with Cu Kα radiation at 10 kV and 35 mA at a step size of 0.02° and a scan rate of 4°/min. The specimens used for the microstructure observation were etched in Kroll reagent (3 mL HF, 9 mL HNO3 and 88 mL H2O) for 10 s. The microstructure was observed by a Keyence VHX-700 (Keyence Co. Ltd., Osaka, Japan) (LM) and a scanning electron microscope (XL30-FEG ESEM, FEI, Hillsboro, OR., USA) equipped with EDS. Image-Pro Plus software was used to calculate the phase volume fraction of the tested alloys.

3. Results and Discussion

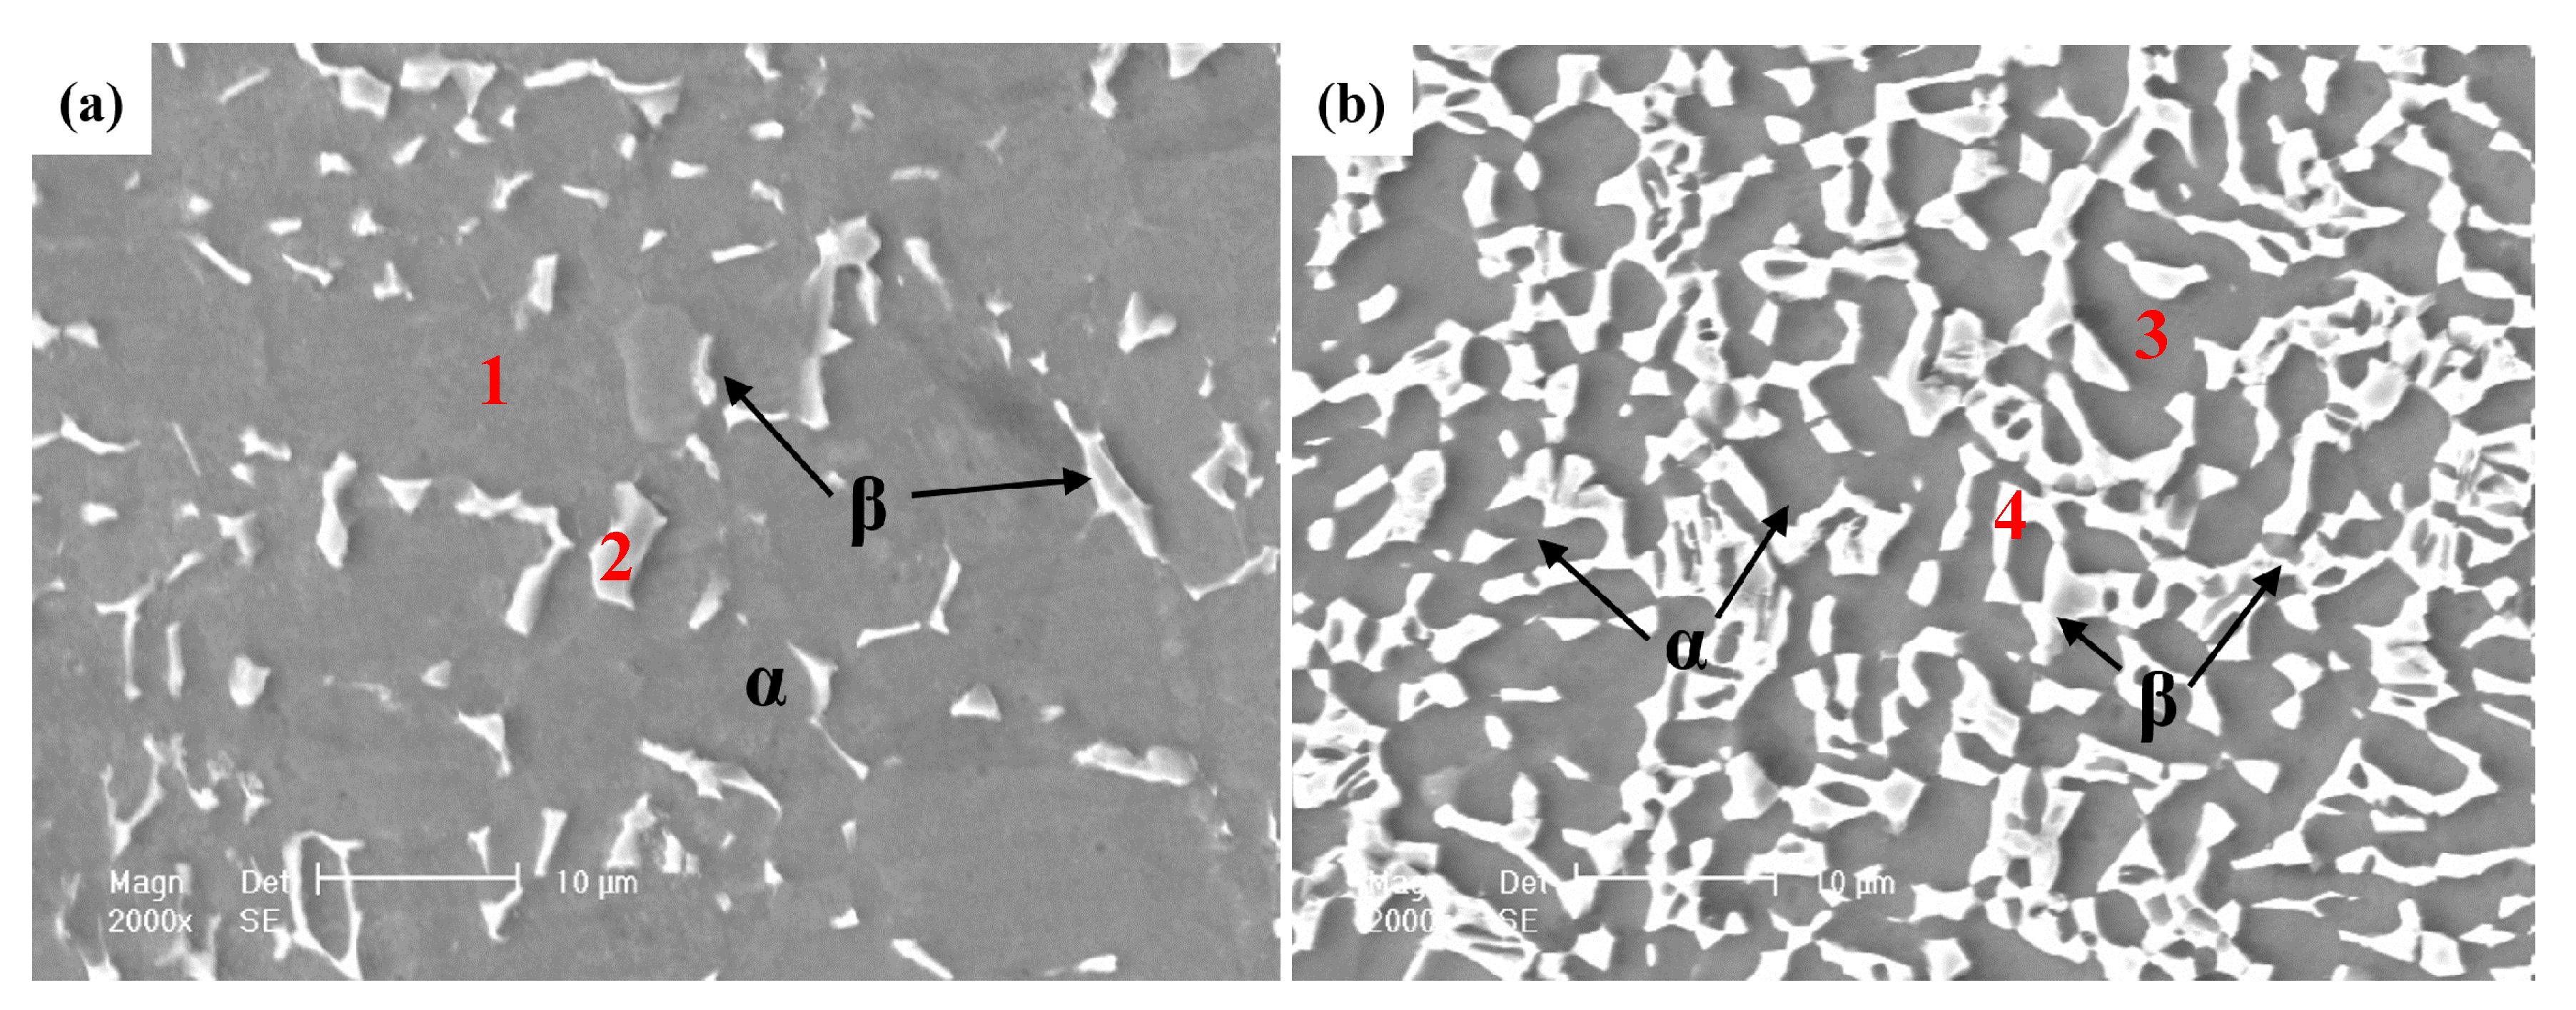
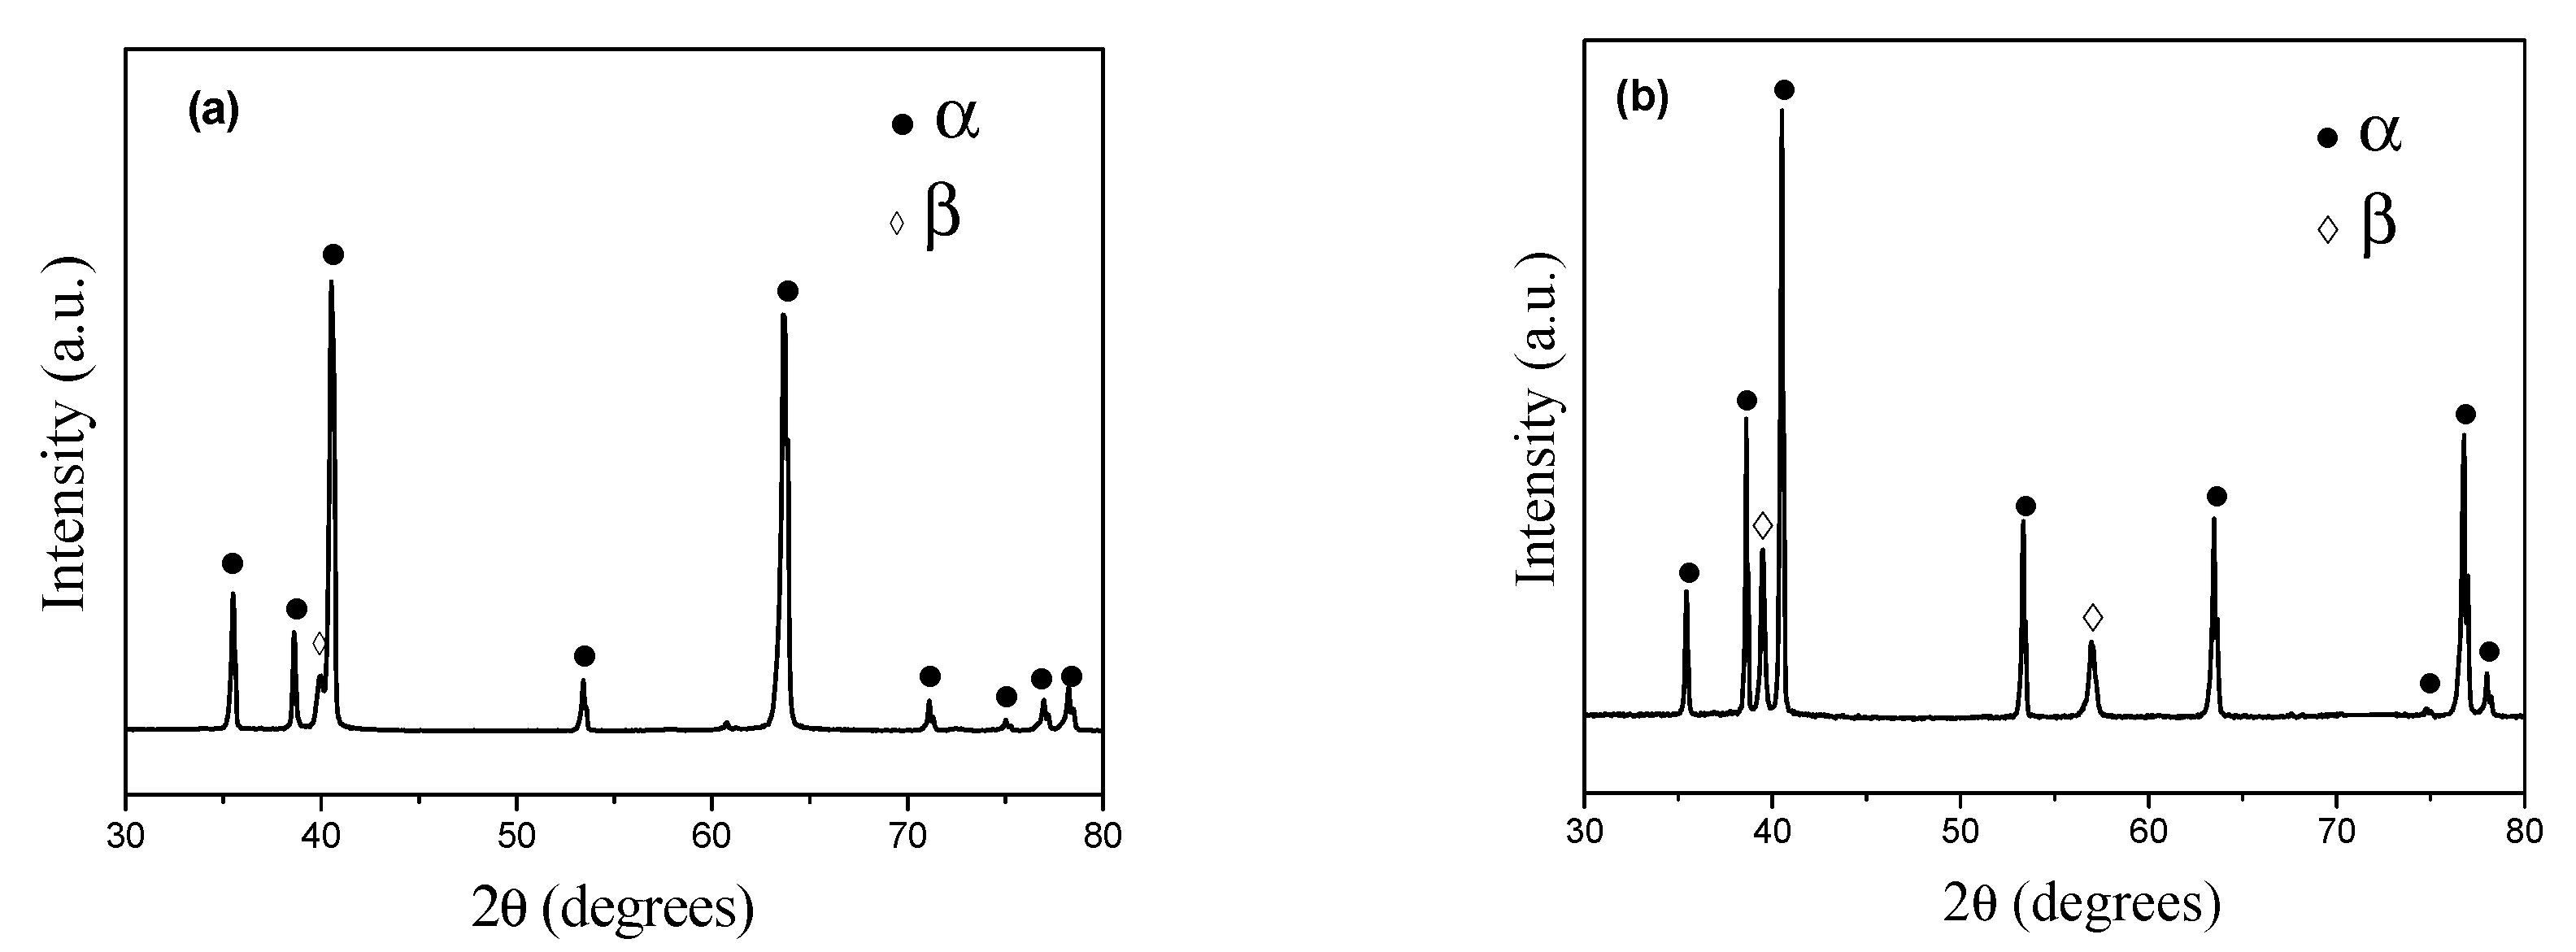
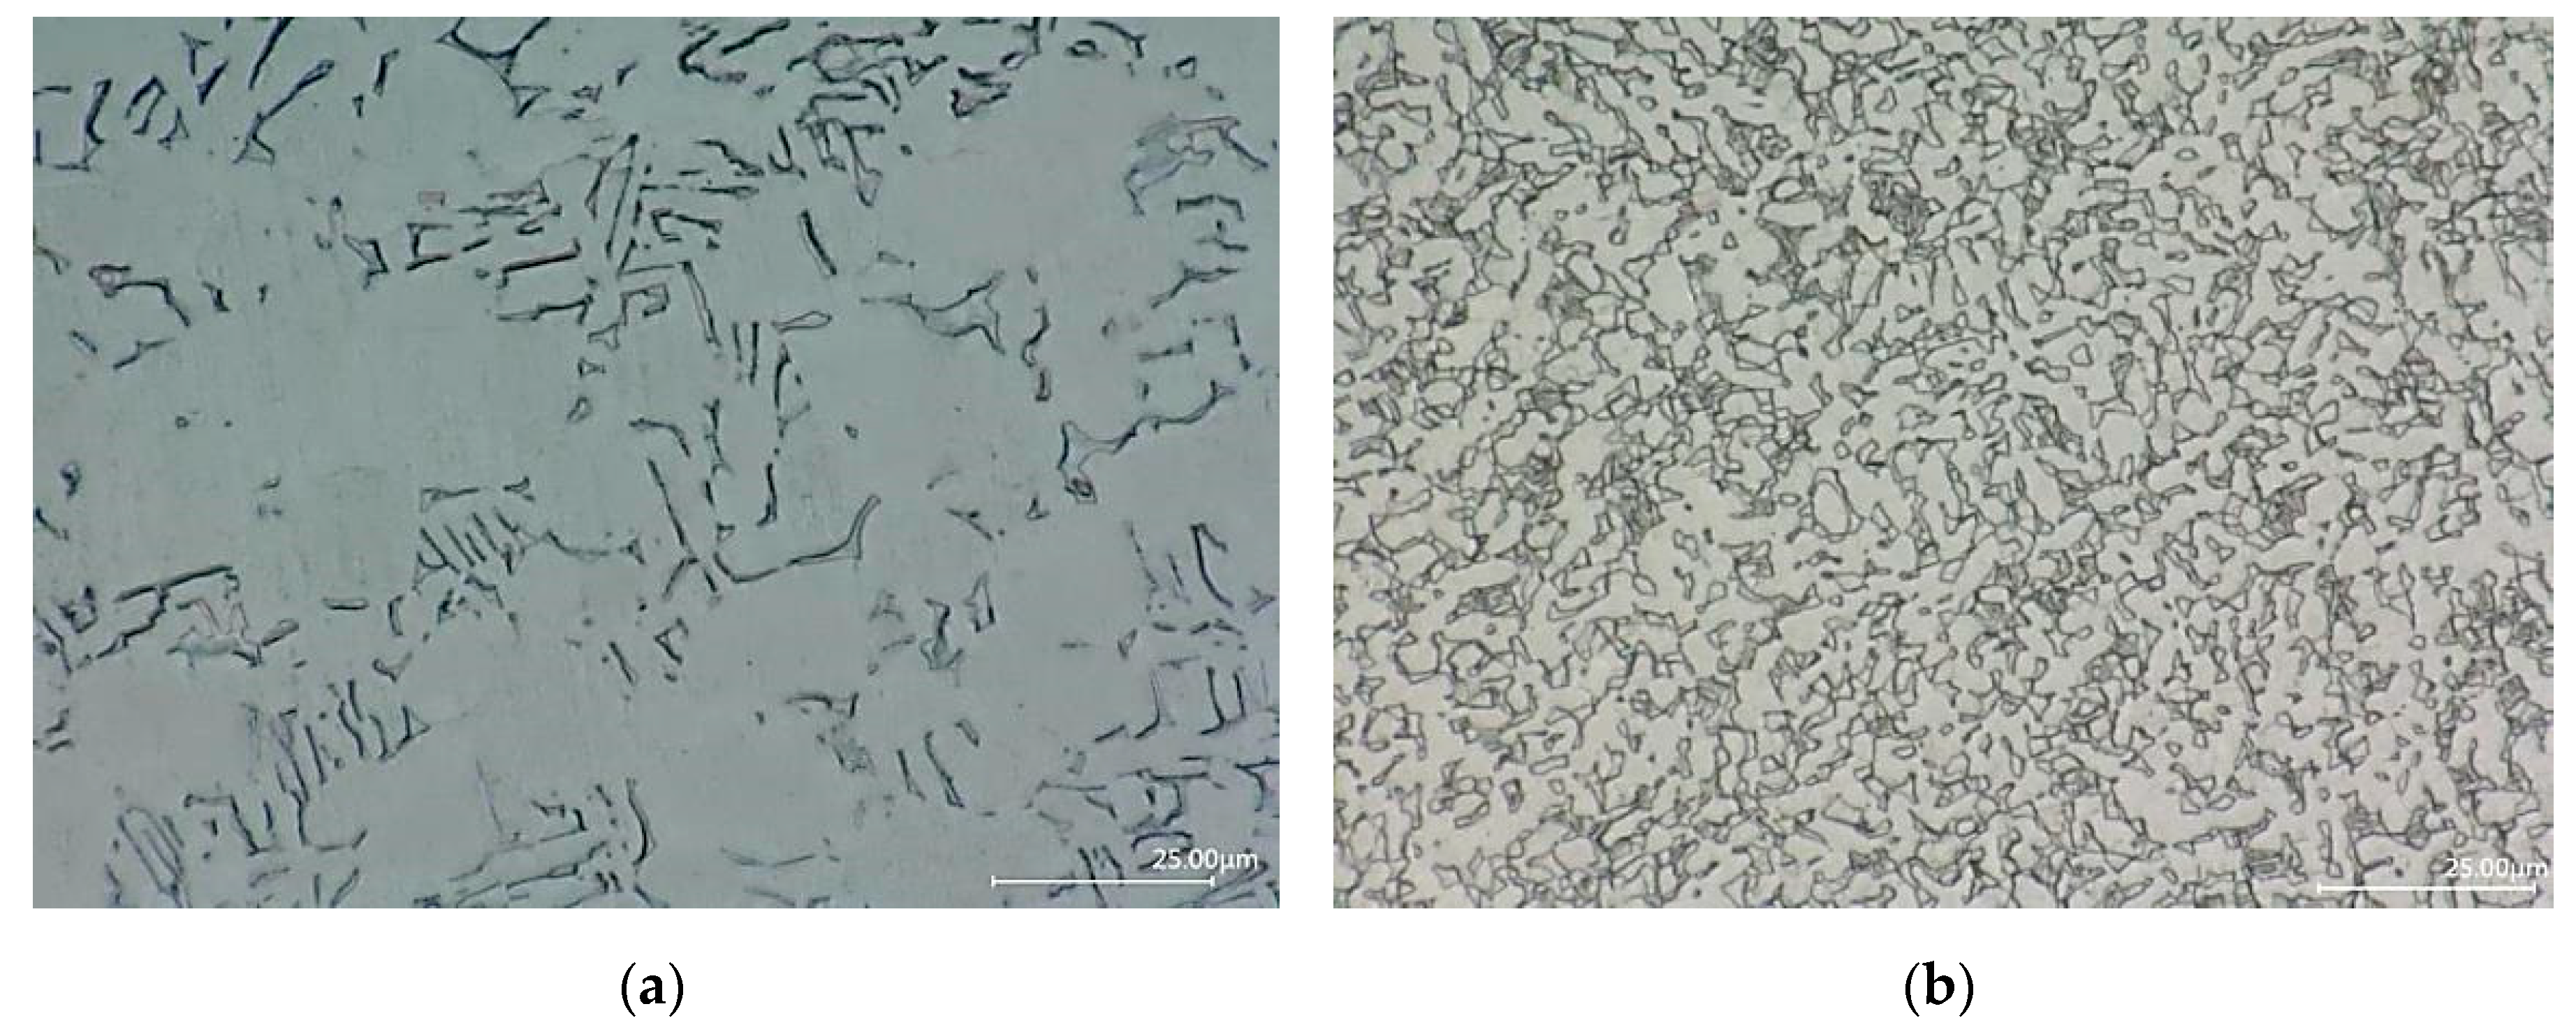
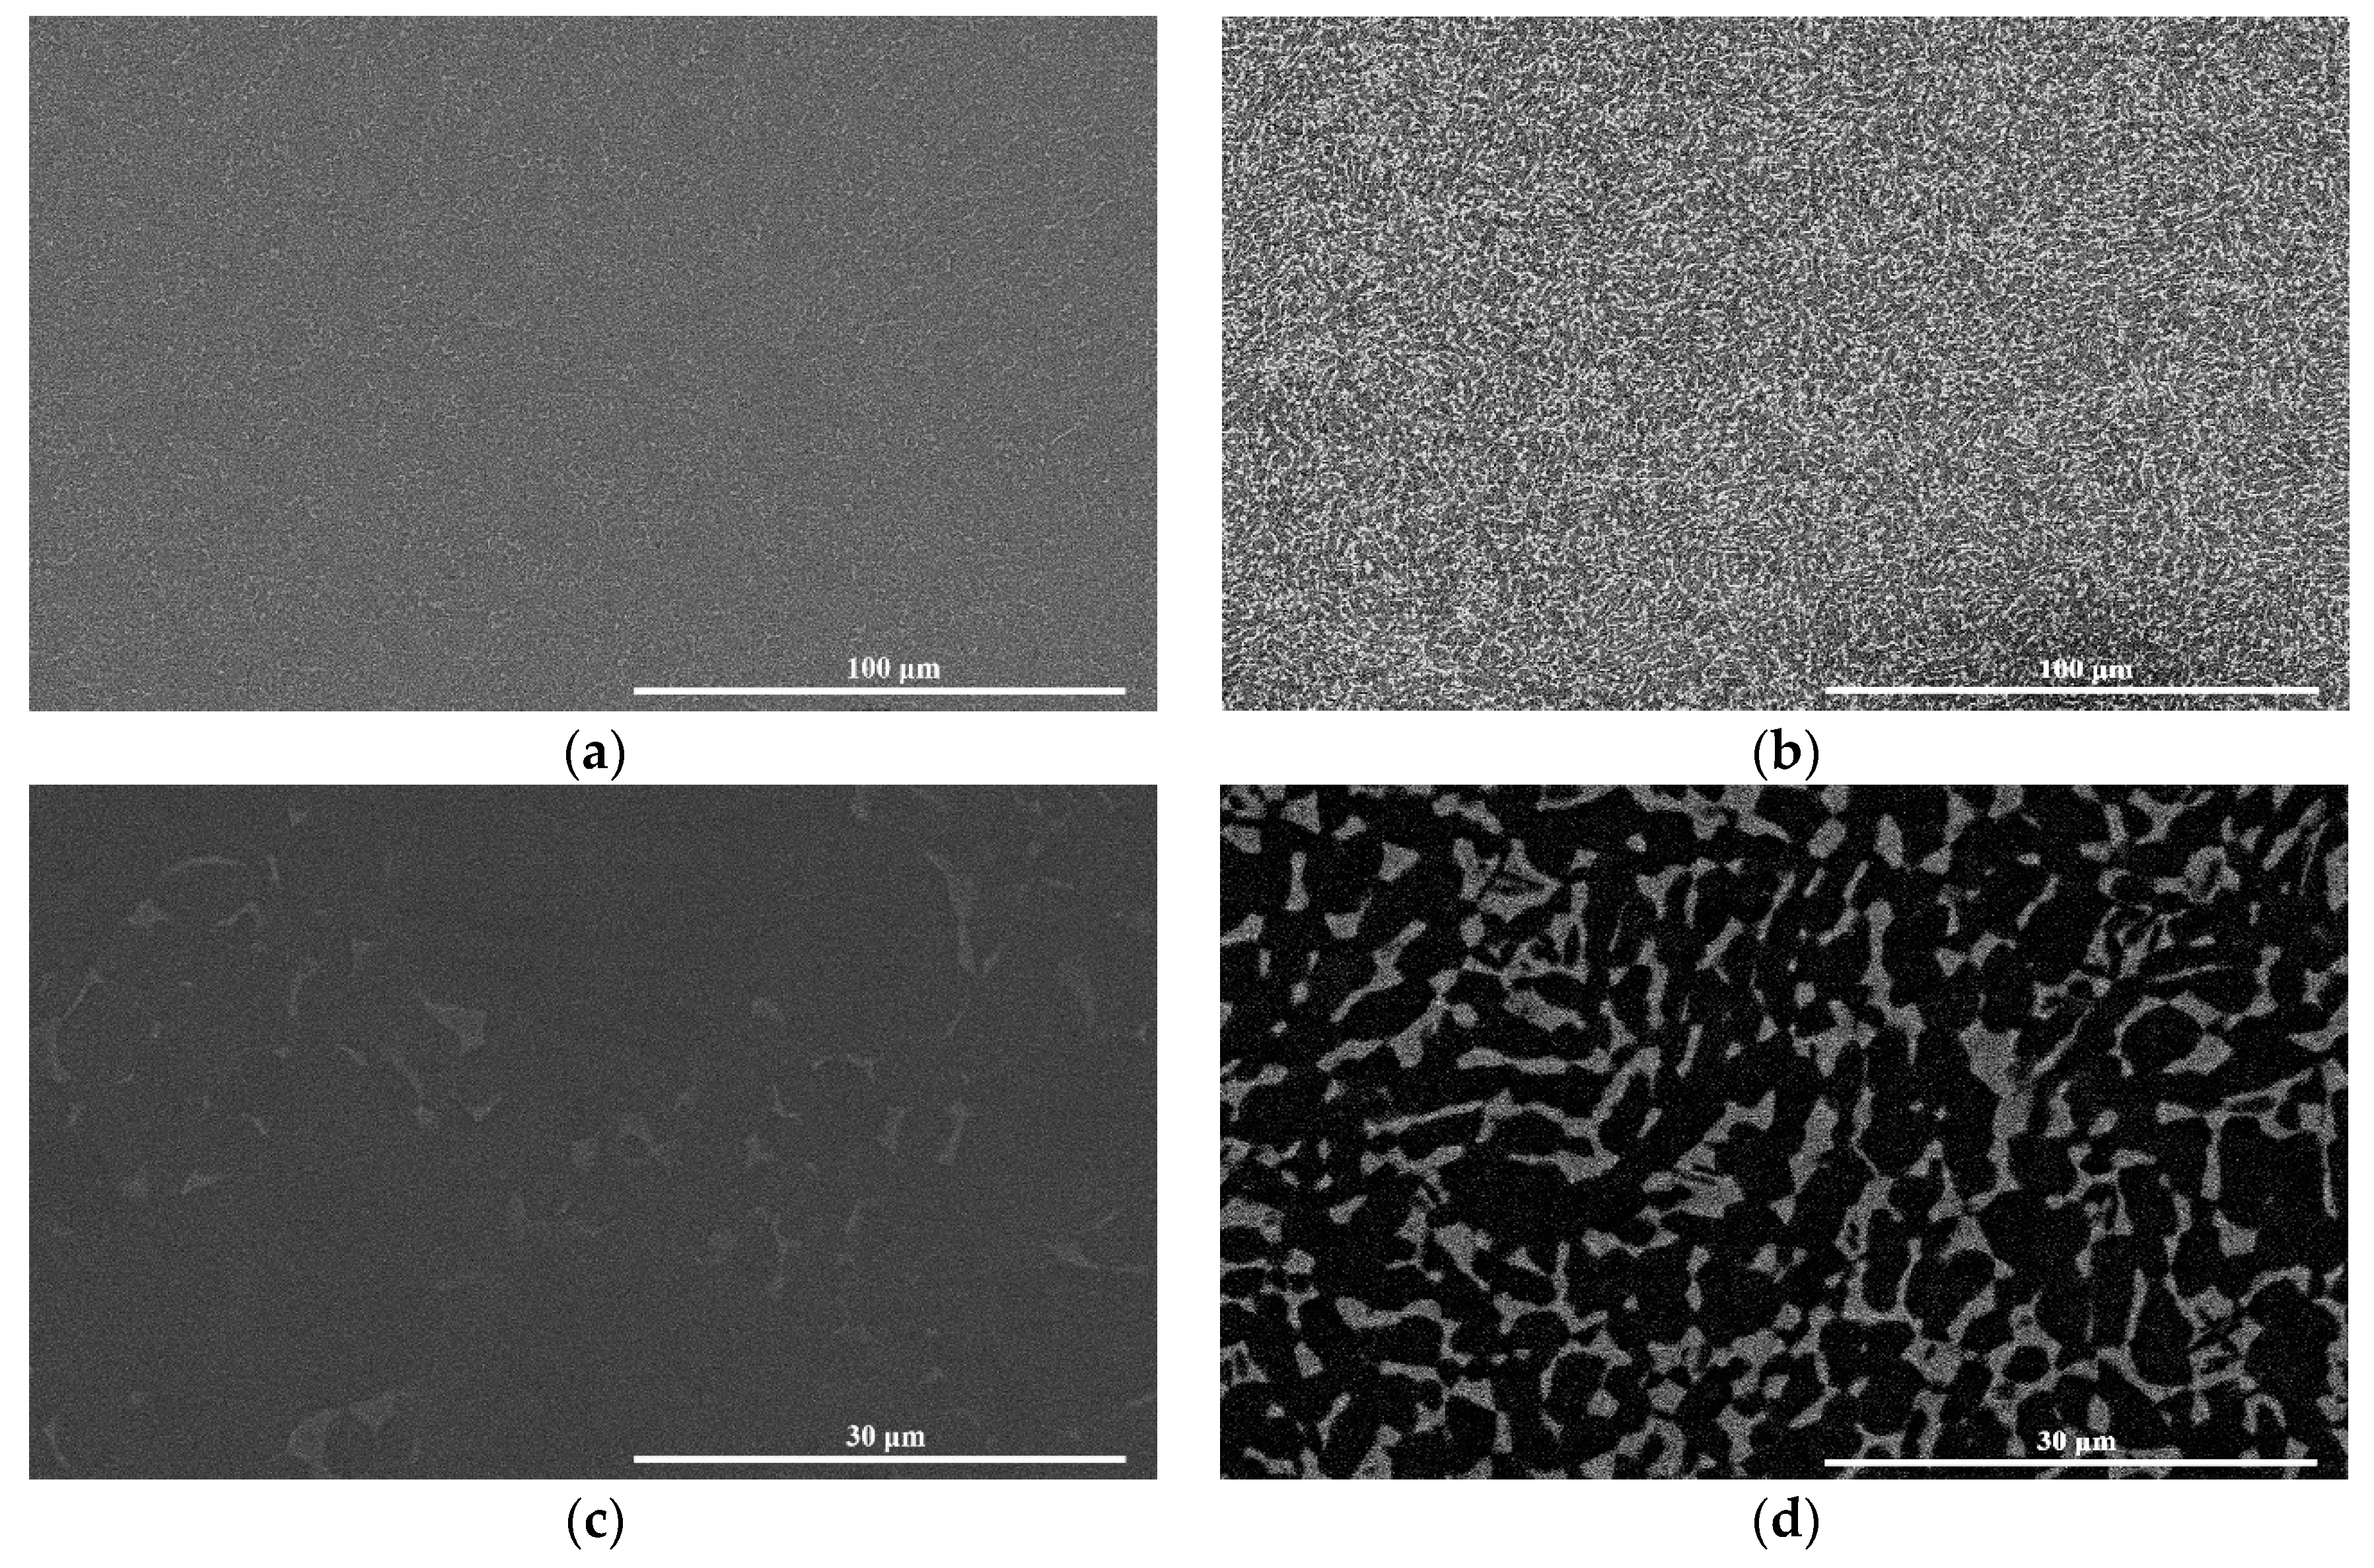
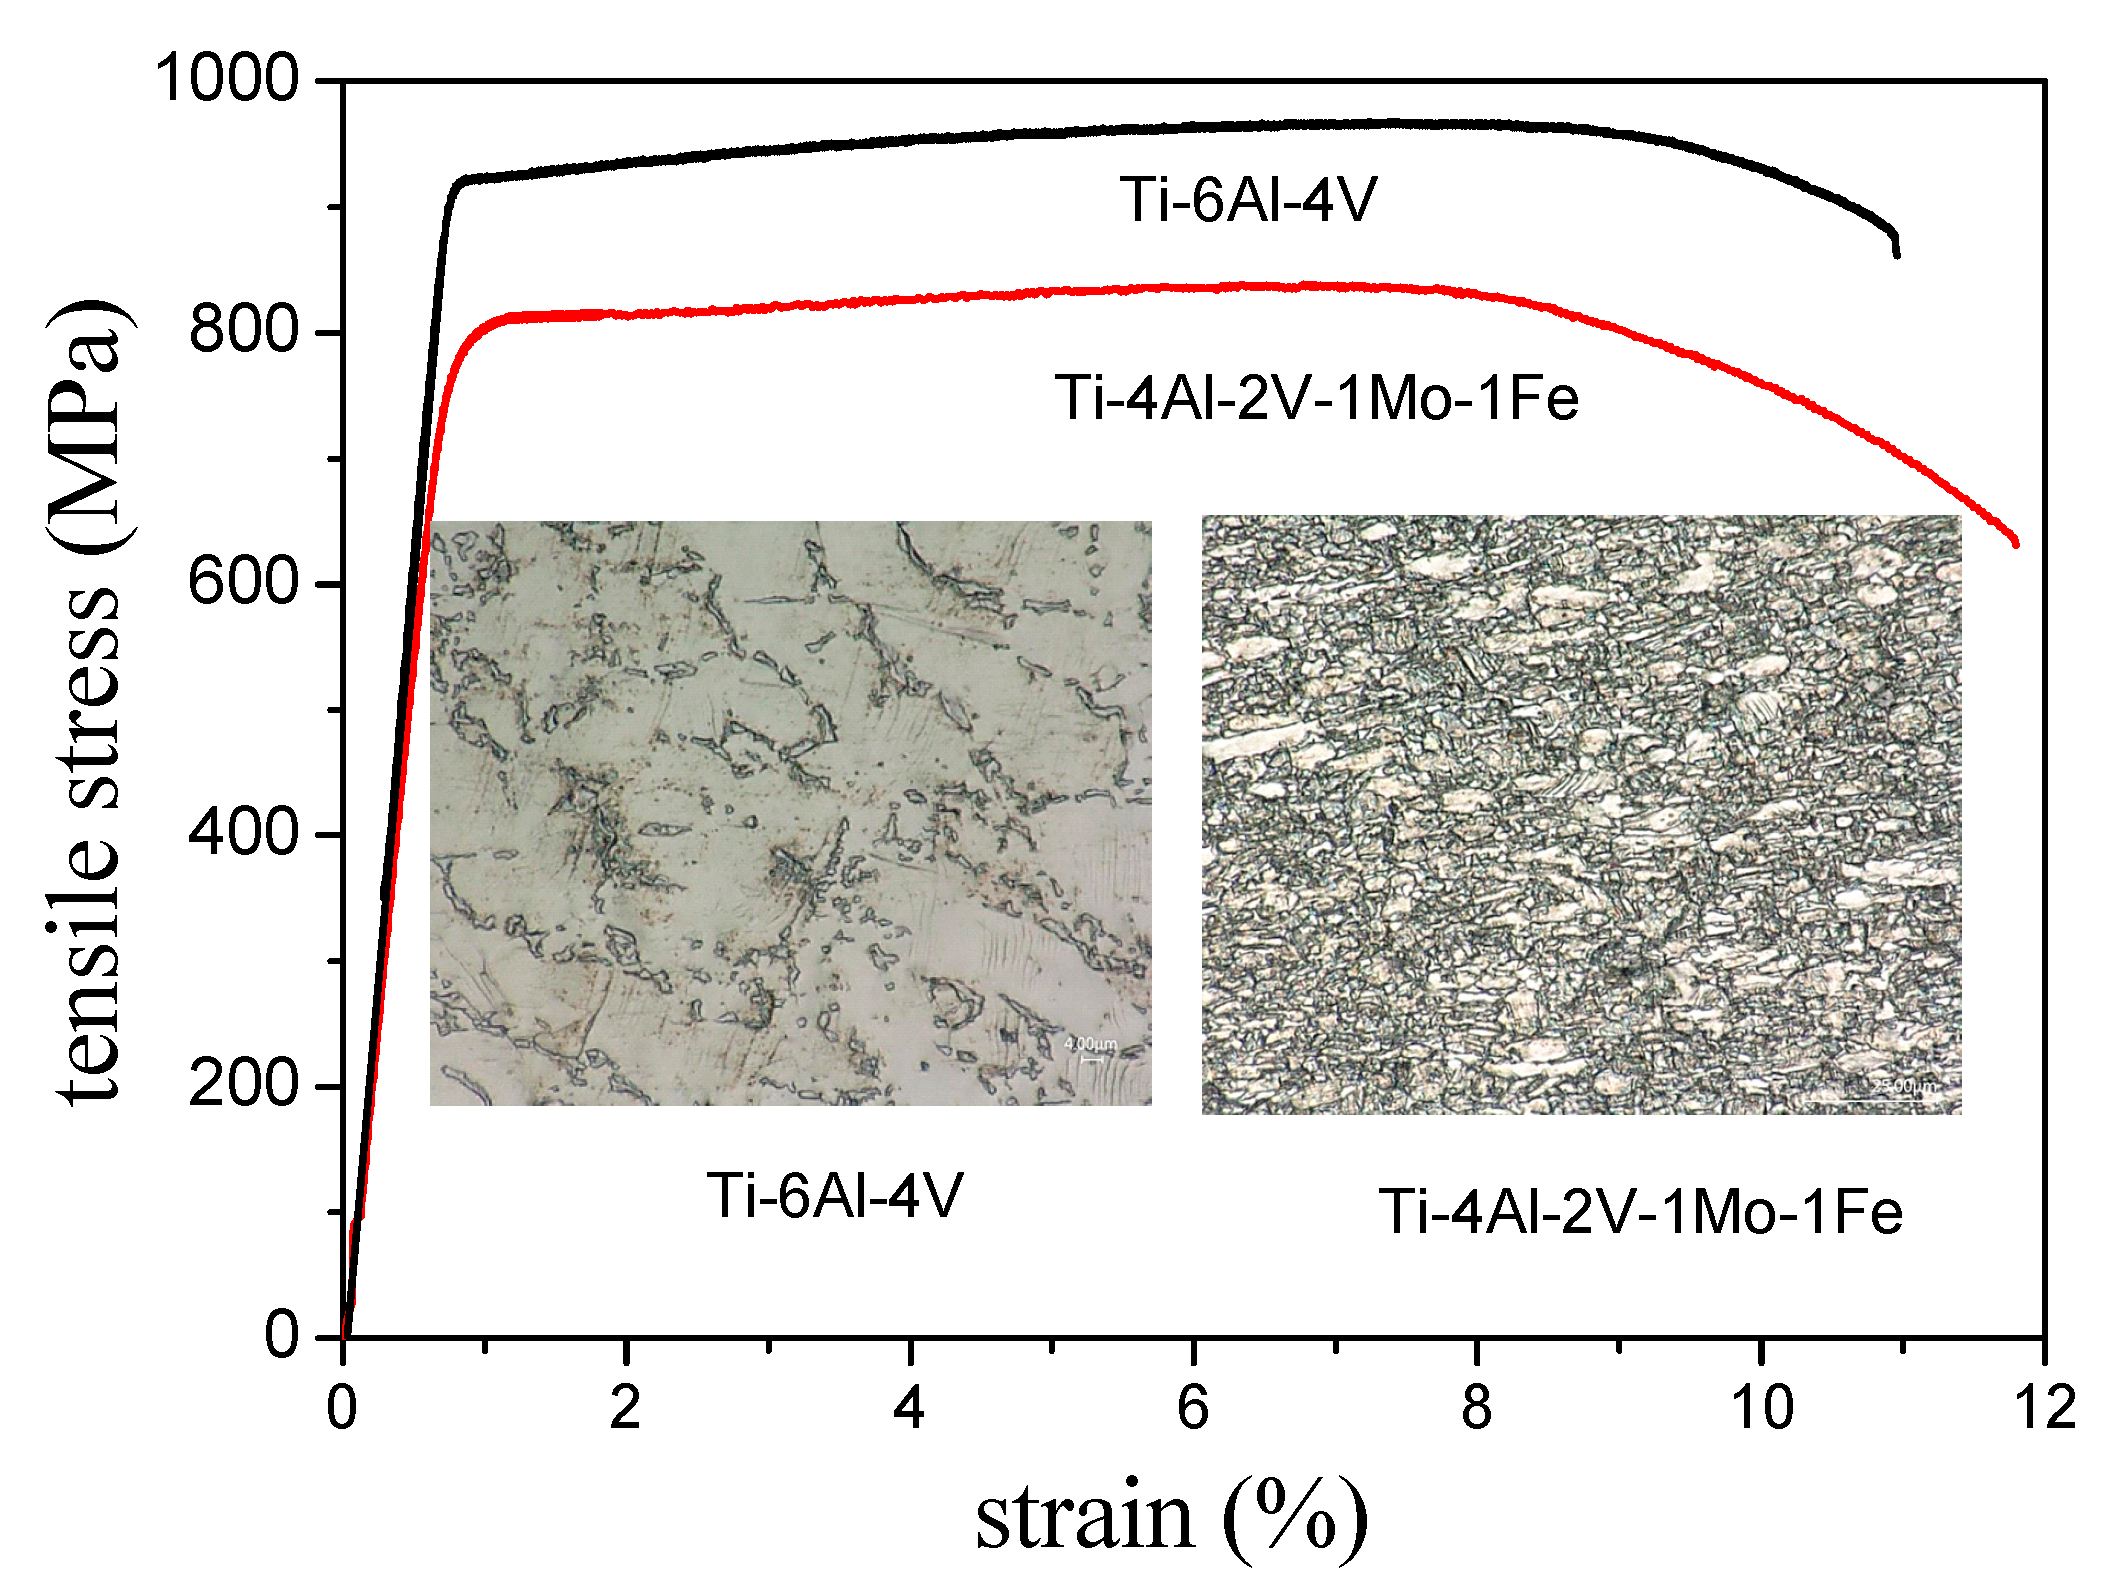
3.1. Microstructure Characterization

The XRD patterns of the Ti-6Al-4V and Ti-4Al-2V-1Mo-1Fe alloys are shown in Figure 1. The diffraction peaks in Figure 1 corresponded to the peaks of α and β phases, suggesting that both alloys have duplex structure. However, the proportions of these two phases in the Ti-6Al-4V and Ti-4Al-2V-1Mo-1Fe alloys were different. As seen in Figure 1, the peak intensity of α phase was higher, indicating a higher content of α phase in both alloys.
The LM images of the Ti-6Al-4V and Ti-4Al-2V-1Mo-1Fe alloys are shown in Figure 2. It was found that the two tested alloys had a bi-phase structure, consistent with the XRD results in Figure 1. The average grain size of the α phase in the Ti-6Al-4V alloy was ~25 μm, and some grains were larger than 50 μm, as shown in Figure 2a. In comparison, the grain size of the α phase in the Ti-4Al-2V-1Mo-1Fe alloy was smaller, with an average grain size of about ~8 μm, as shown in Figure 2b.
The SEM observations of the Ti-6Al-4V and Ti-4Al-2V-1Mo-1Fe alloys are shown in Figure 3. As seen in Figure 3, both alloys were composed of the dark α phase and the bright β phase. No other precipitates were observed either inside grains or at grain boundaries. As shown in Figure 3a, the β phase dispersed and scattered inside the equiaxed α phase. However, the distribution of the β phase in the Ti-4Al-2V-1Mo-1Fe alloy was more continuous. As shown in Figure 3b, clustered β phase distributed evenly inside the α phase in the Ti-4Al-2V-1Mo-1Fe alloy. The volume fraction of the β phase in the Ti-6Al-4V and Ti-4Al-2V-1Mo-1Fe alloys was about 7.4% and 47.3%, respectively. EDS analysis was conducted to investigate the composition of α and β phases of the tested alloys, and the results are shown in Table 2. It is reported that Fe, Mo, and V atoms have long been recognized as strong β-stabilizing elements [19,22,27], thus the atomic ratio of these elements in β phase is higher than that in α phase. This is mainly due to the higher element solid solubility and elemental diffusion rate in the β phase [27,28]. Based on the research [28], the volume fraction of the β phase in Ti-4Al-2V-1Mo-1Fe alloy may be higher than that of the Ti-6Al-4V alloy.

3.2. Immersion Test

The microstructures of the Ti-6Al-4V and Ti-4Al-2V-1Mo-1Fe alloys after immersion in 3.5 wt.% NaCl solution for 180 days are shown in Figure 4. It can be seen that no traces of corrosion were observed, indicating the Ti-6Al-4V and Ti-4Al-2V-1Mo-1Fe alloys had excellent corrosion resistance in 3.5 wt.% NaCl solution.
The mass loss rates of the Ti-6Al-4V and Ti-4Al-2V-1Mo-1Fe alloys after 180 days of immersion in 3.5% NaCl solution were calculated based on the mass loss, Δm, using Equation (1) shown as following:
Δ m = m 0 m 1 S × t
where m0 is the weight (mg) of the sample before the immersion test, m1 is the weight (mg) of the sample after the immersion test, S is the surface area of the sample (cm2), and t is the immersion time (180 days). The mass loss rate of the Ti-6Al-4V and Ti-4Al-2V-1Mo-1Fe alloys was 1.99 × 10⁻⁴ and 2.01 × 10⁻⁴ mg·cm−2·day−1, respectively. This indicates both behaved similarly, without any obvious occurrence of corrosion in the present tested solution.

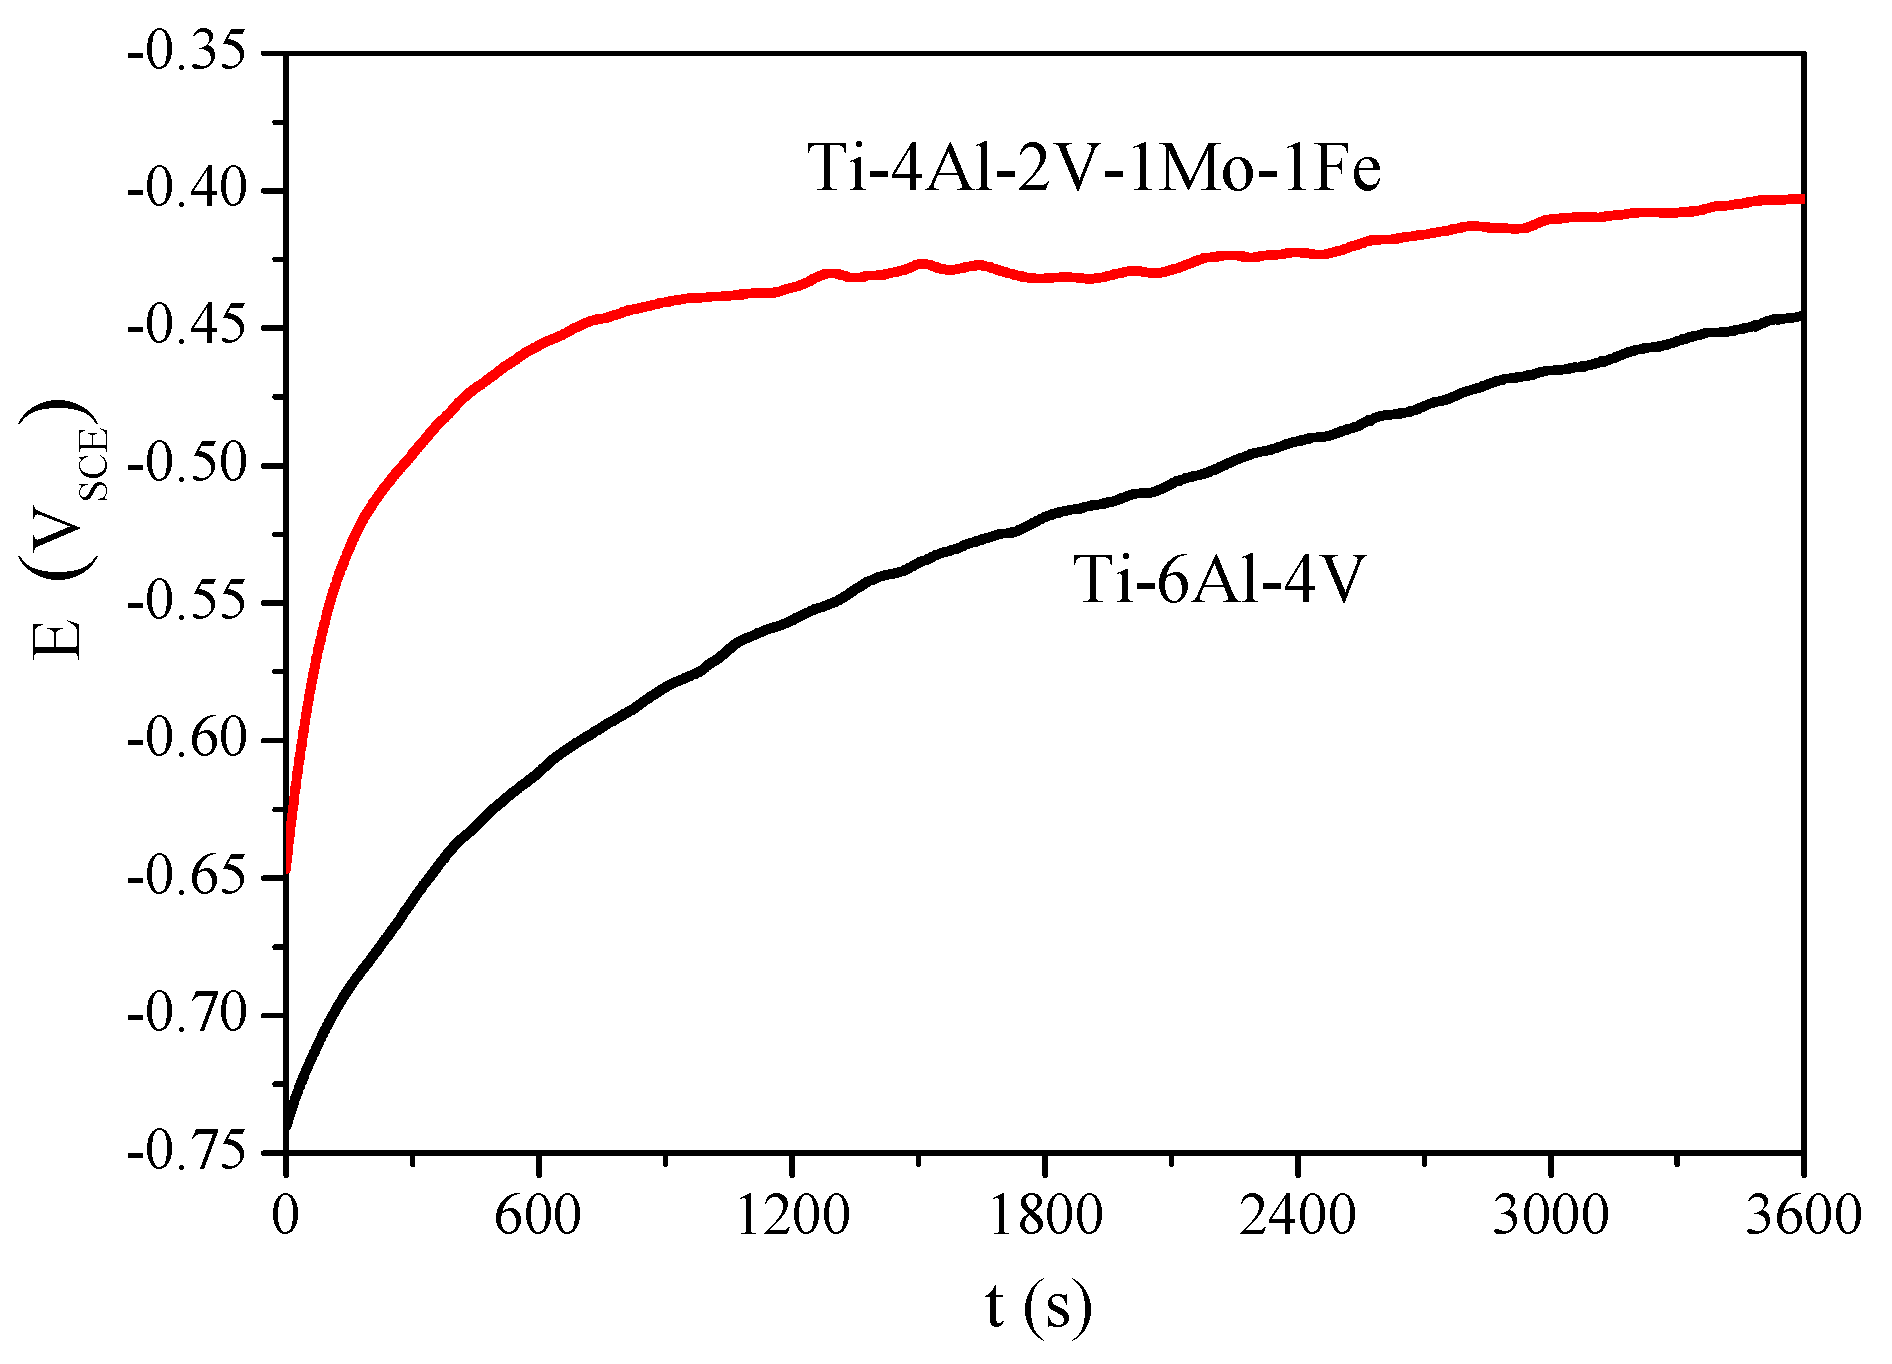
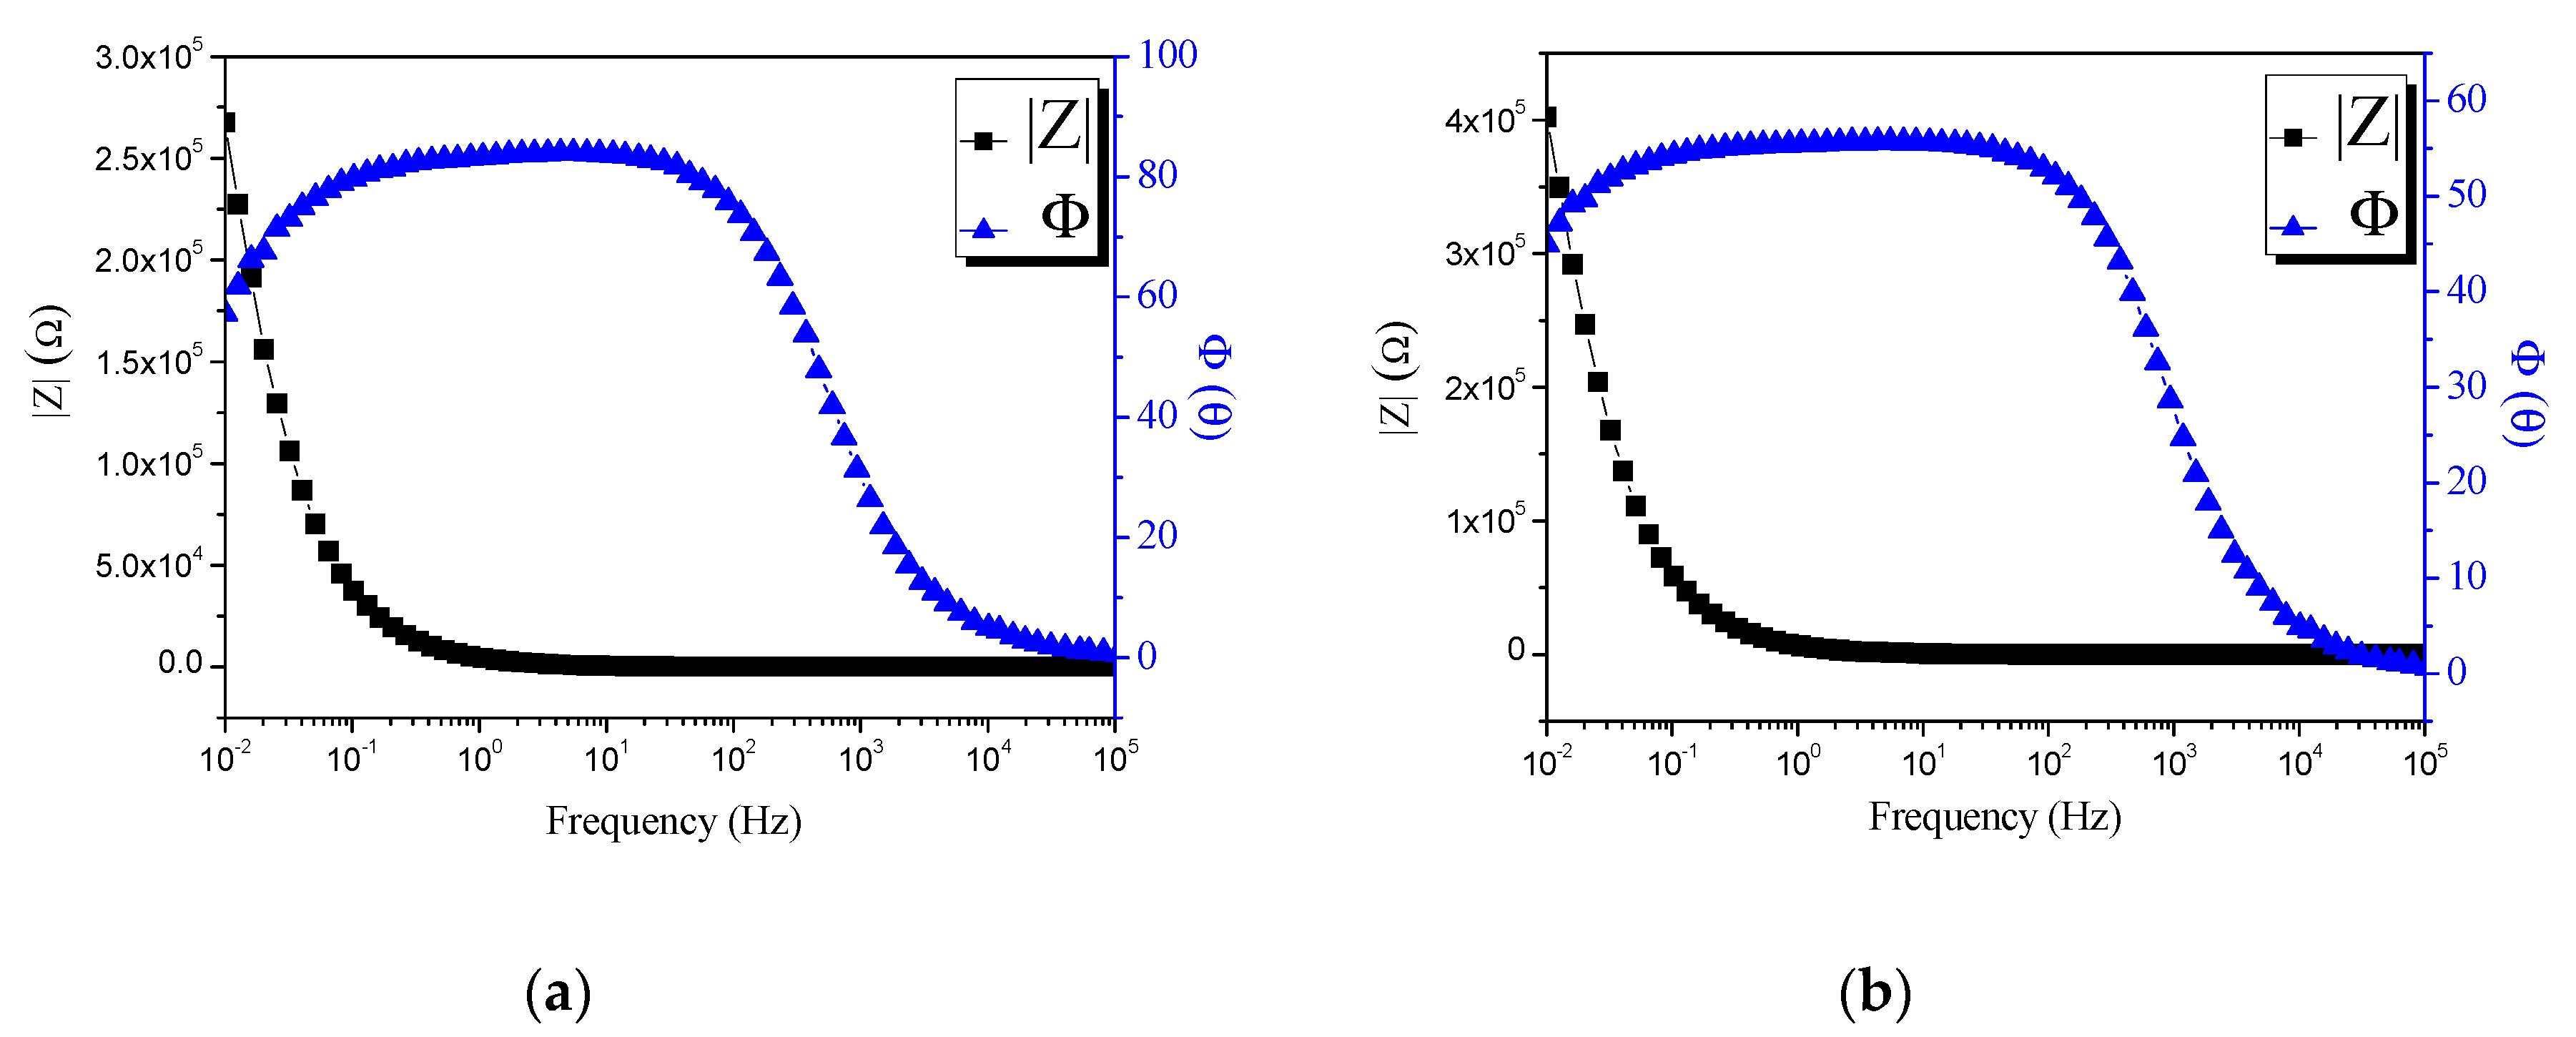
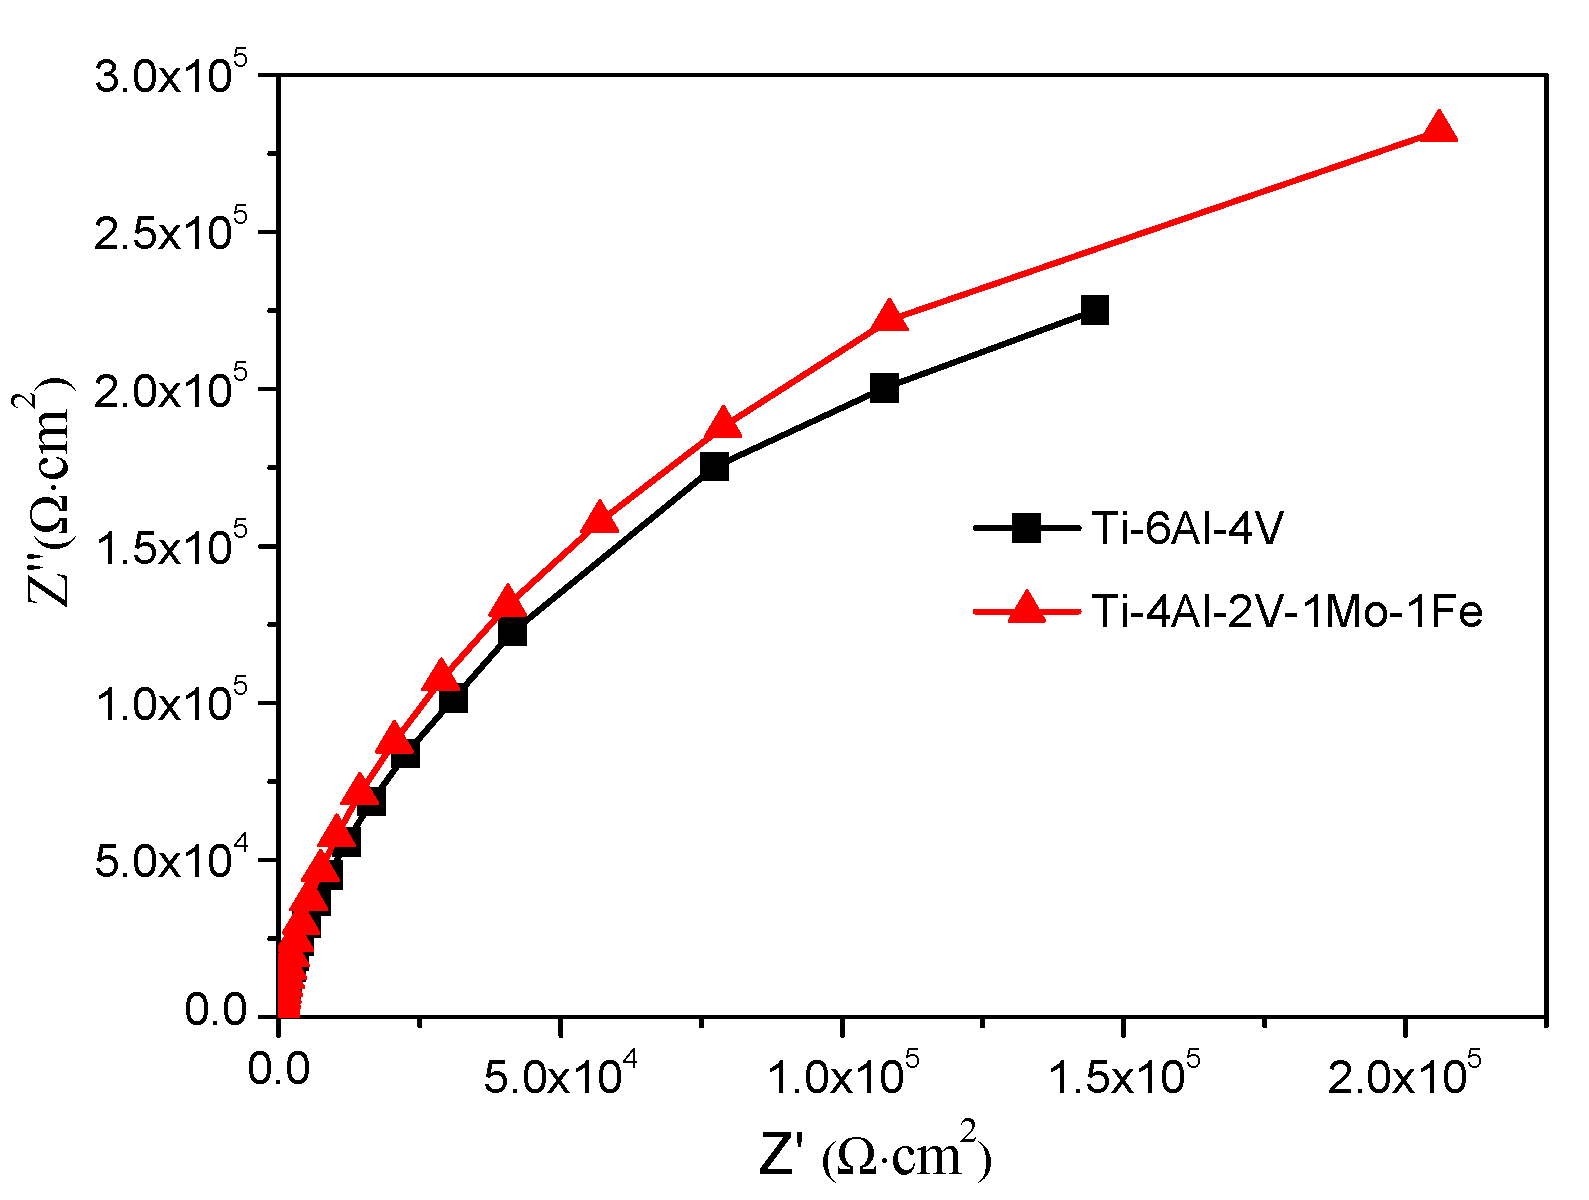
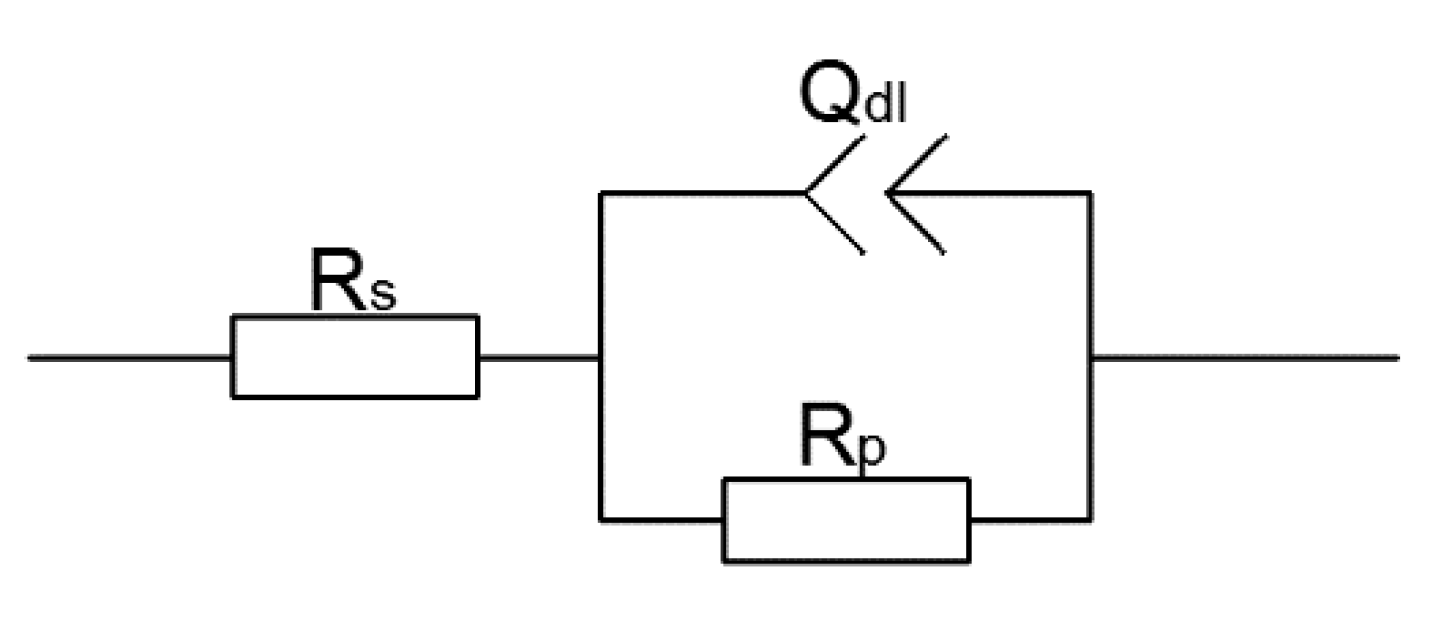
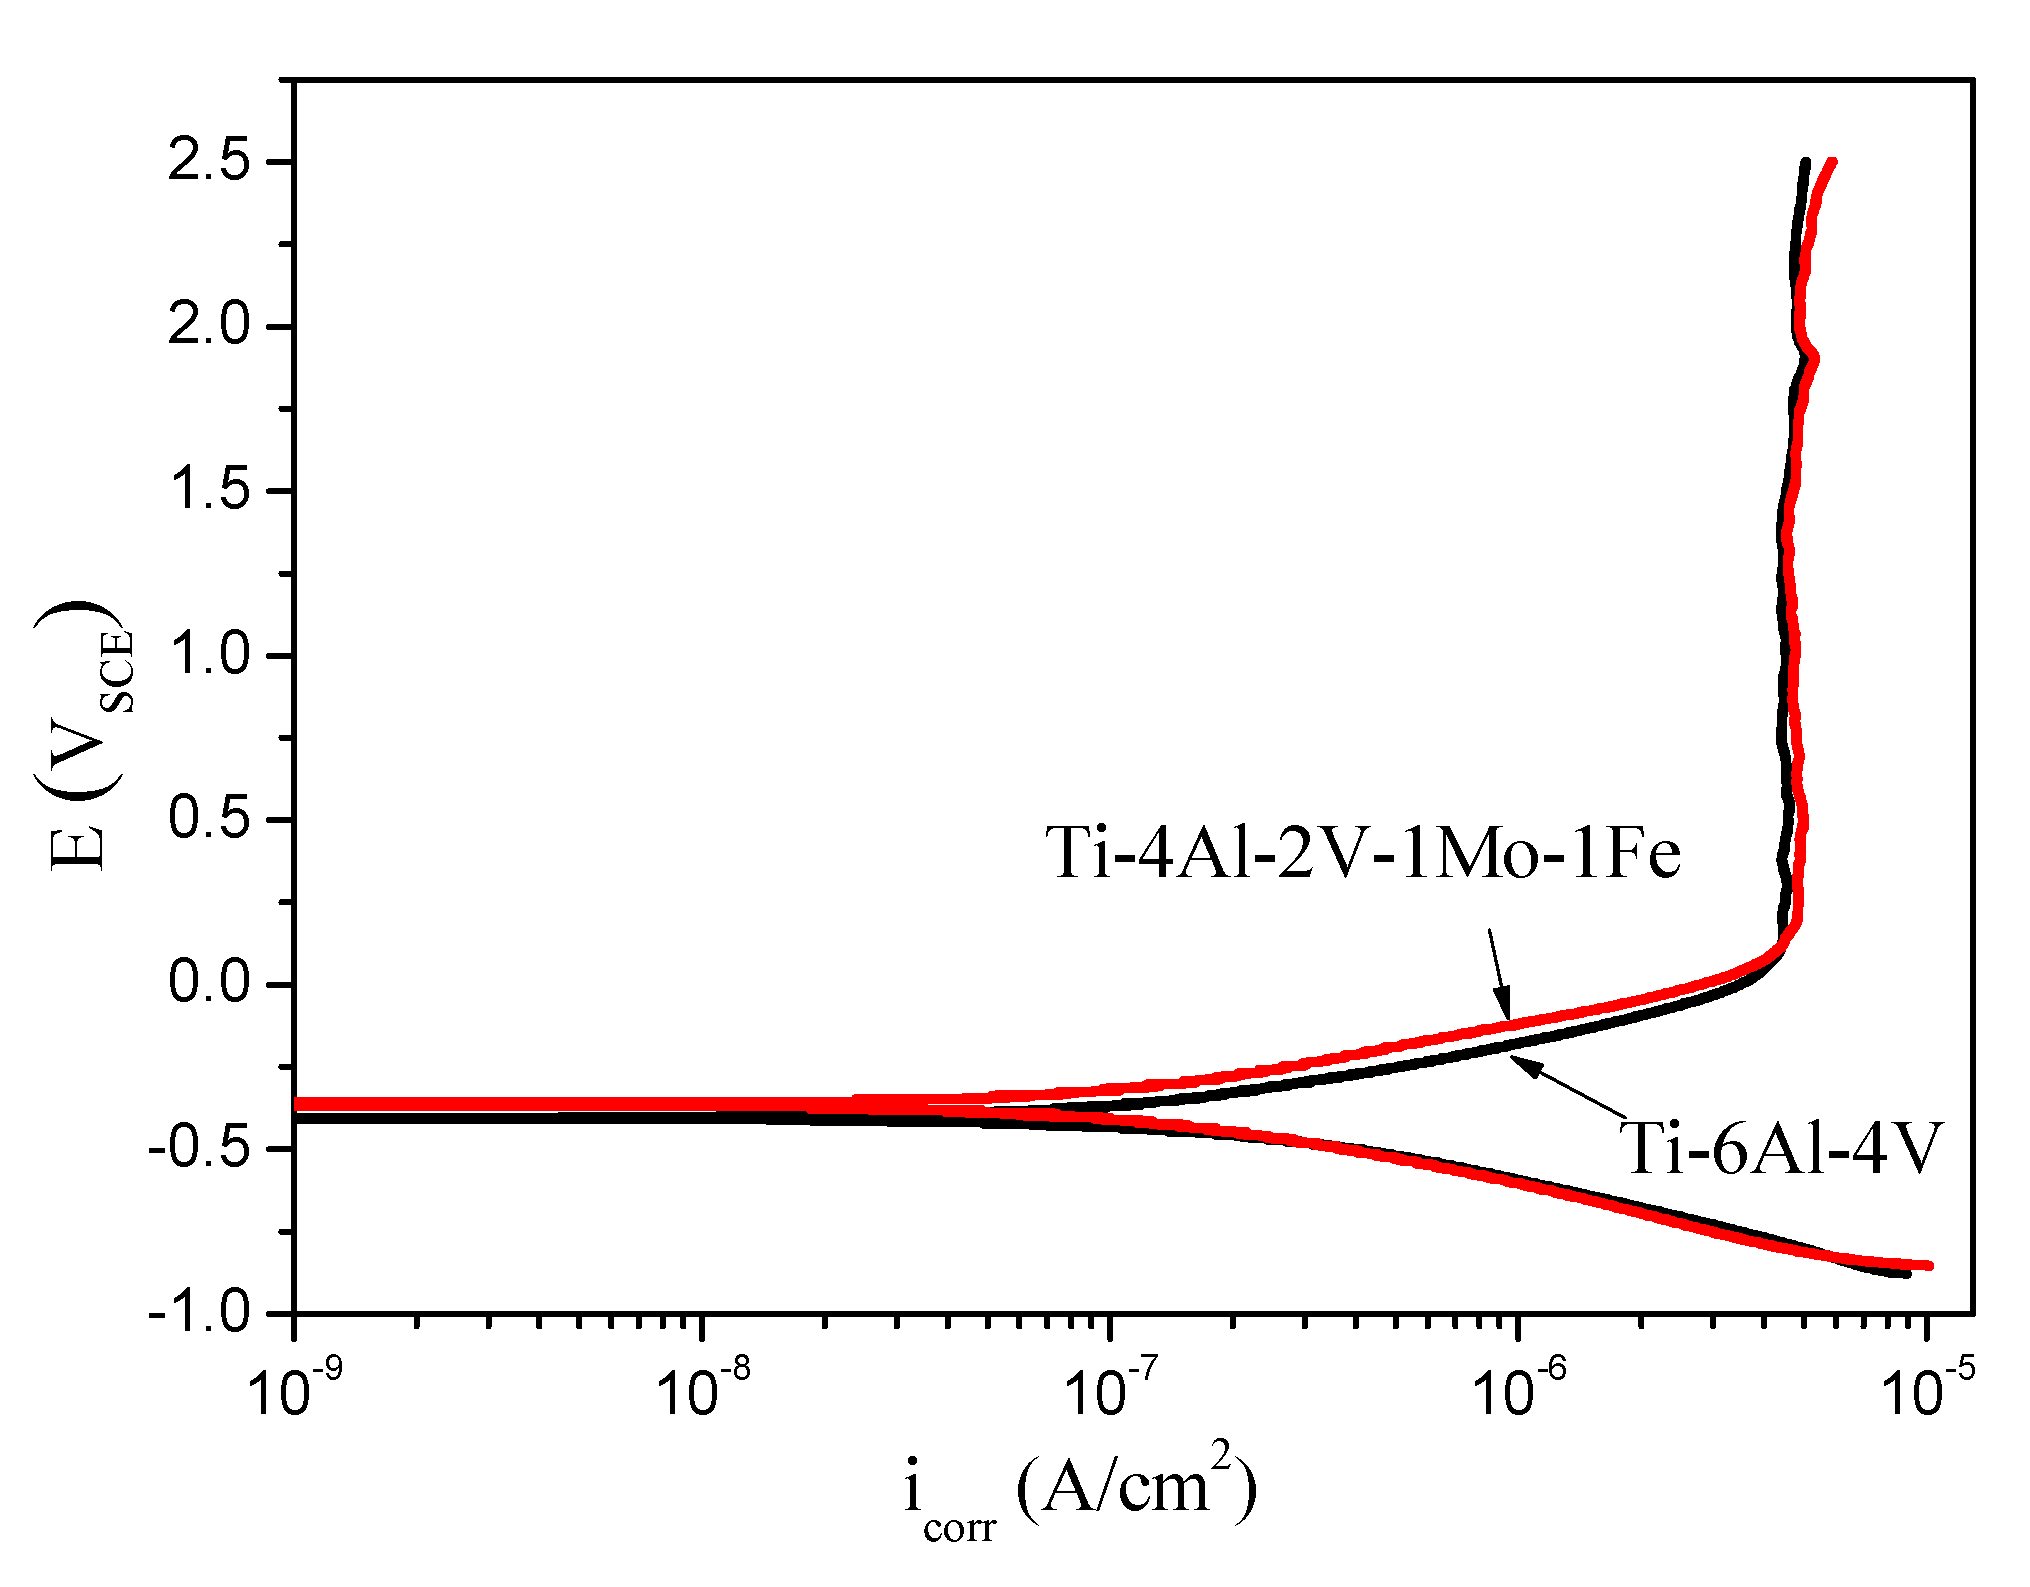
3.3. Electrochemical Response

Once the Ti-6Al-4V and Ti-4Al-2V-1Mo-1Fe alloys were immersed in NaCl solution at OCP, the dissolution process of the naturally-formed oxide film (rutile TiO2) in air began and the self-passivated film simultaneously formed [9]. The OCPs for the Ti-6Al-4V and Ti-4Al-2V-1Mo-1Fe alloys in 3.5 wt.% NaCl solution are shown in Figure 5. Since the specimens were exposed in ambient atmosphere for 1 h to allow the native growth of oxide film, the spontaneous OCP after the immersion indicated the stability of the naturally-formed oxide [5]. It is seen from Figure 5 that corrosion potential (Ecorr) of the Ti-6Al-4V alloy shifted continuously to positive potential with the immersion time. As for the Ti-4Al-2V-1Mo-1Fe alloy, the Ecorr gradually increased from −0.65 VSCE to more noble potential, and finally achieved steady-state potential of −0.40 VSCE when the immersion time was 1 h. The corrosion data in Figure 5 revealed that a shorter time was required for the steady-state potentials to be obtained in 3.5 wt.% NaCl solution for the Ti-4Al-2V-1Mo-1Fe alloy compared to the Ti-6Al-4V alloy.
To investigate the stability of the passive film formed on the Ti-6Al-4V and Ti-4Al-2V-1Mo-1Fe alloys, EIS measurements were carried out at OCP for both alloys in 3.5 wt.% NaCl solution. Figure 6 and Figure 7 show the Nyquist and Bode plots for the Ti-6Al-4V and Ti-4Al-2V-1Mo-1Fe alloys for 1 h immersion in 3.5 wt.% NaCl solution. As seen from Figure 6, both the Ti-6Al-4V and Ti-4Al-2V-1Mo-1Fe alloys exhibited an unfinished single capacitive arc. It can be seen in Figure 7 that only one time constant was observed. The initial impedance (Z) recorded for the Ti-4Al-2V-1Mo-1Fe alloy was higher than that of the Ti-6Al-4V alloy, indicating that the Ti-4Al-2V-1Mo-1Fe alloy had a superior corrosion resistance [3]. The impedance data were analyzed using the equivalent circuit shown in Figure 8. The use of a constant phase element (CPE) was necessary [29,30,31] due to the distribution of relaxation times resulting from heterogeneities at the electrode surface. The CPE was used for the description of a frequency-independent phase shift between an applied AC potential and its current response [32], and has been extensively investigated [29,33]. The impedance of the CPE was given by:
Z C P E = 1 Q ( j ω ) n
Therefore, the total impedance was [34]:
Z t o t a l = R s + ( Q ( j ω ) n + 1 R p ) 1
where n was the depression angle (in degrees) that evaluated the semicircle deformation, Rs was the electrolyte resistance, Rp represented the charge transfer resistance, and Q corresponded to the pseudo-capacitance of the film, expressed using the CPE. The reason may be as follows: the CPE accounted for two contributions, one arising from double-layer capacitance (CH) and one arising from semiconductor capacitance relating to the passive film (Csc). The capacitance of the double layer seems to be neglected according to the result reported by Hirschorn et al. [35], so the capacitance behavior of Ti-6Al-4V and Ti-4Al-2V-1Mo-1Fe alloys was dominated by the passive film [36]. Table 3 shows the values of the electric parameters obtained using the equivalent electric circuit to fit the EIS data. It is seen in Table 3 that the film resistance for the Ti-6Al-4V and Ti-4Al-2V-1Mo-1Fe alloys was 5.69 × 10⁵ Ω·cm−2 and 6.50 × 10⁵ Ω·cm−2, respectively. It is consistent with the generally accepted sense that a larger capacitive arc indicates higher corrosion resistance. It can be inferred that the stability of the passive film formed on the Ti-4Al-2V-1Mo-1Fe alloy in the present solution was slightly better than that of the Ti-6Al-4V alloy.
The potentiodynamic polarization curves for the Ti-6Al-4V and Ti-4Al-2V-1Mo-1Fe alloys in 3.5 wt.% NaCl solution are shown in Figure 9. It is seen from Figure 9 that the corrosion behaviors of the Ti-6Al-4V and Ti-4Al-2V-1Mo-1Fe alloys were similar. Both alloys were typically passive materials, displaying a wide passive region from 0.11 ± 0.03 VSCE to 2.5 ± 0.05 VSCE. After the potential was scanned to 2.5 VSCE in 3.5 wt.% NaCl solution, no film breakdown was observed. This clearly indicates the passive film forming spontaneously on the Ti-6Al-4V and Ti-4Al-2V-1Mo-1Fe alloys surfaces was thermodynamically stable [37]. It is reported that Al or Fe could be oxidized and form a compact Al and Fe oxide layer on the top of passive film, inhibiting the dissolution of the oxide film [22]. The corrosion current density (icorr) for the Ti-6Al-4V and Ti-4Al-2V-1Mo-1Fe alloys was 2.23 ± 0.41 × 10⁻⁷ A·cm−2 and 1.51 ± 0.22 × 10⁻⁷ A·cm−2, respectively. Compared to the Ti-4Al-2V-1Mo-1Fe alloy, the lower Ecorr and higher icorr of the Ti-6Al-4V alloy suggested that the Ti-4Al-2V-1Mo-1Fe alloy had a higher corrosion resistance, consistent with the results of EIS test.
The corrosion resistance of titanium alloy relies on the stability of its passive film. The formation of passive layer requires the transfer of titanium and hydroxyl ions as follows [38]:
Ti Ti 2 + + 2 e
Since Ti2+ is unstable, it will react with H2O and produce Ti3+ once it is formed;
2 Ti 2 + + 2 H 2 O 2 Ti 3 + + 2 OH + H 2
Ti 2 + + 3 OH Ti ( OH ) 3
Transformation of Ti(OH)3 might take place to hydrated TiO2 layer in a dynamic equilibrium reaction as follows:
2 Ti ( OH ) 3 TiO 2 H 2 O + H 2
In addition, the corrosion resistance of the Ti-4Al-2V-1Mo-1Fe alloy was slightly higher than the Ti-6Al-4V alloy, which was mainly due to the fact that the Ti-4Al-2V-1Mo-1Fe alloy contained Mo elements, making the passive film more stable [39].

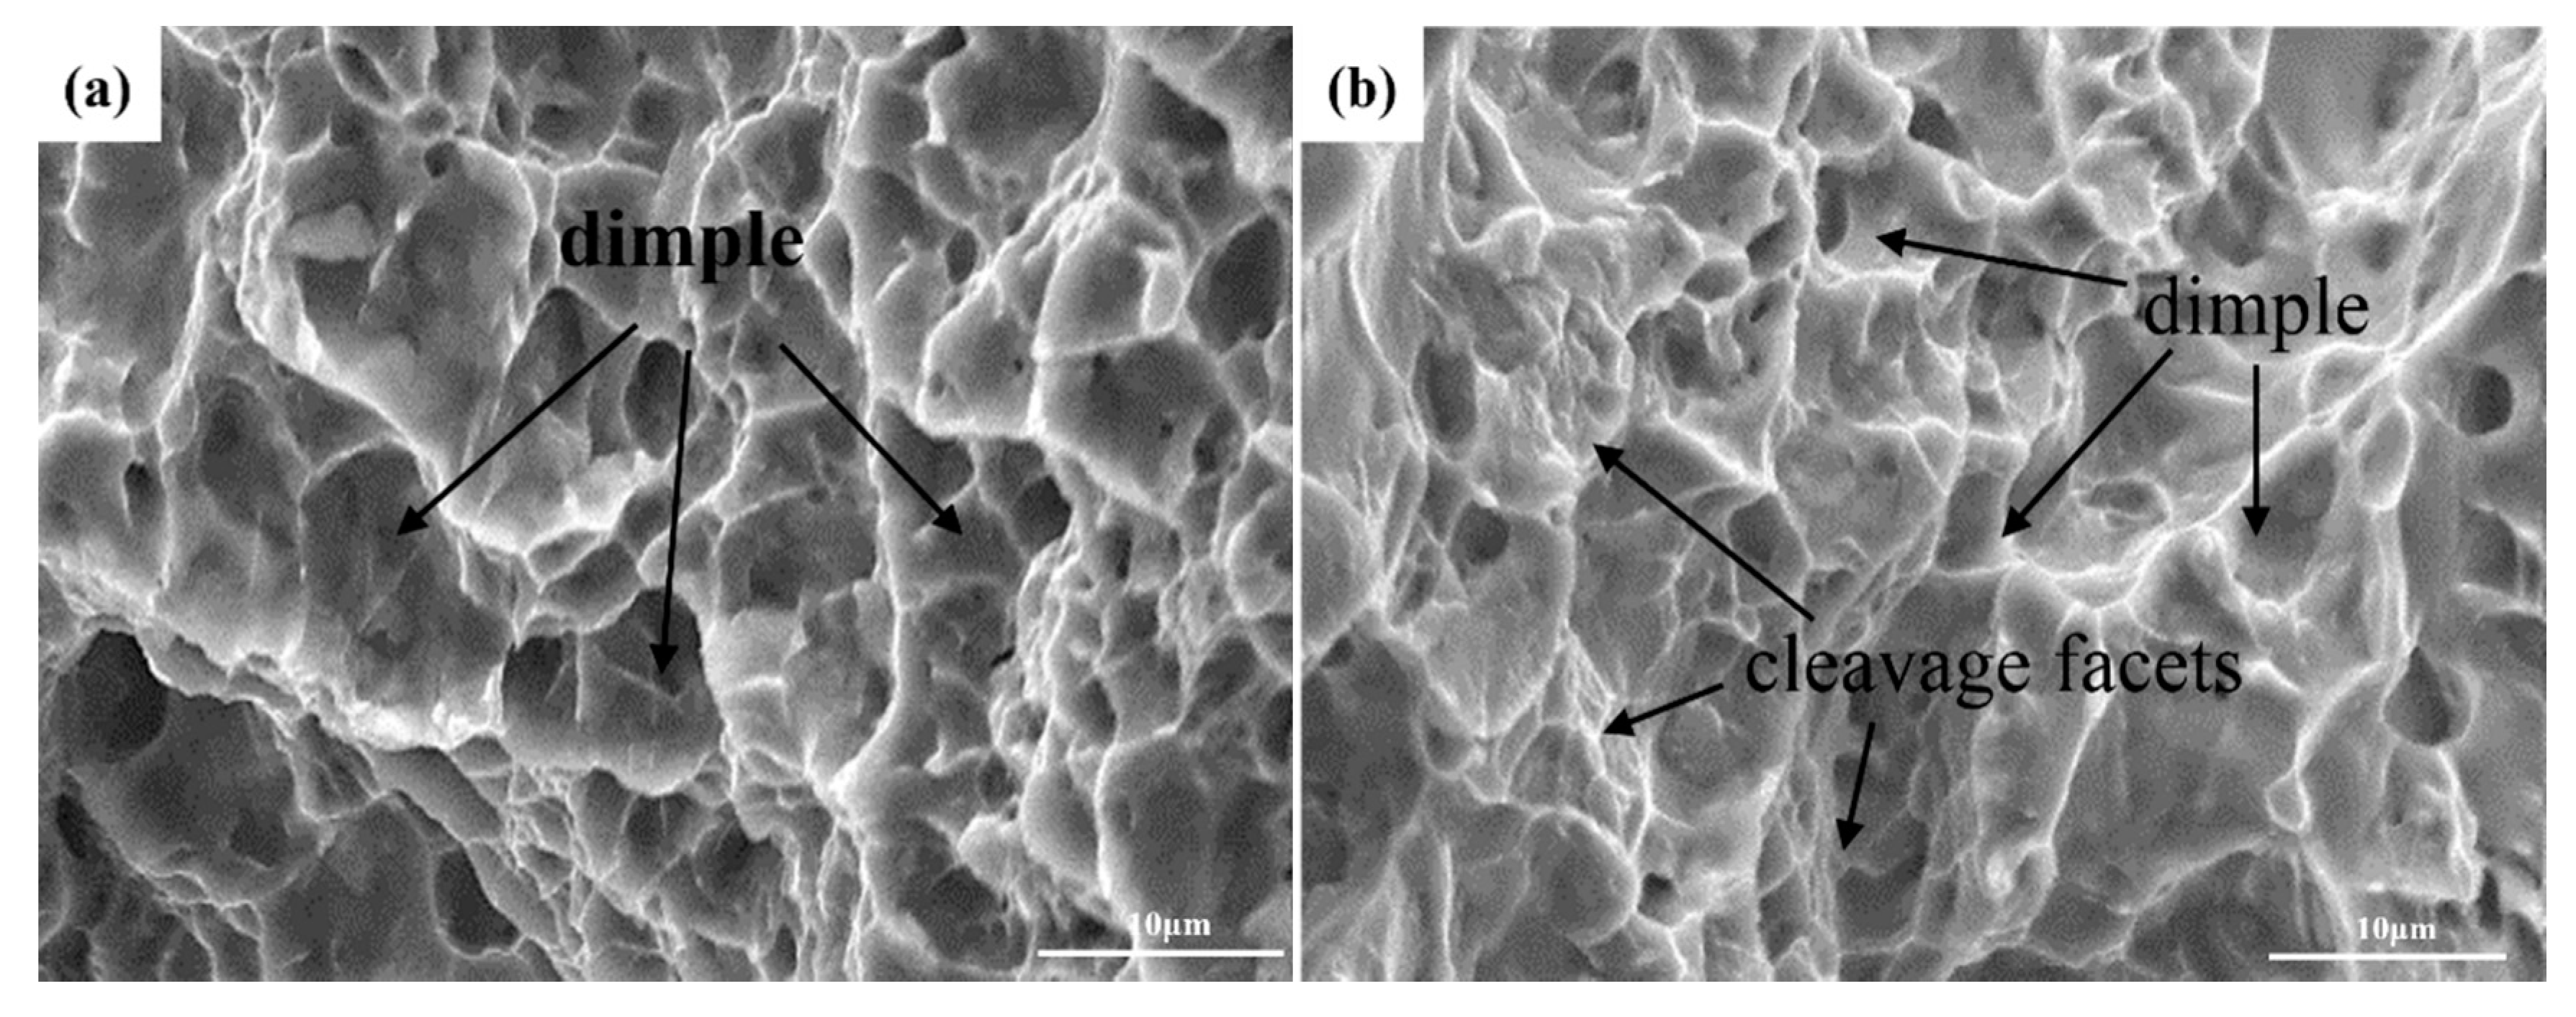
3.4. Mechanical Properties

Figure 10 shows typical tensile curves of the Ti-6Al-4V and Ti-4Al-2V-1Mo-1Fe alloys. The specific mechanical property values including the tensile Rm, yield stress Rp0.2 strength, and elongation ε from the tensile curves, are summarized in Table 4. It shows that strength of the Ti-4Al-2V-1Mo-1Fe alloy was slightly lower but its elongation was higher compared to the Ti-6Al-4V alloy (yield strength of 838 MPa vs. 968 MPa, and the elongation of 15.8% vs. 13.8%). Since the volume fractions of the α and β phases were different in Ti-6Al-4V and Ti-4Al-2V-1Mo-1Fe alloys, these will have influences on their tensile properties. Moreover, the α phase had more slip systems and the β phases had limited slip systems according to their structure identified by XRD in Figure 1. Therefore, the stress concentration at α/β phase interfaces could be easily induced in the tensile tests due to the incompatible plastic deformation between two phases. Then, micro-cracks would preferentially initiate at the α/β phase interfaces. The fracture morphologies of the tensile test for the Ti-6Al-4V and Ti-4Al-2V-1Mo-1Fe alloys are displayed in Figure 11. Many dimples were observed in Figure 11, and the Ti-6Al-4V and Ti-4Al-2V-1Mo-1Fe alloys were typically transgranular with a dimple fracture [40].

4. Conclusions

In this paper, the corrosion and tensile behaviors of the Ti-6Al-4V and Ti-4Al-2V-1Mo-1Fe alloys were investigated. The results were summarized as follows.
(1) Both Ti-6Al-4V and Ti-4Al-2V-1Mo-1Fe alloys were composed of the α and β phases. The volume fractions of the β phase in these two alloys were 7.4% and 47.3%.
(2) Both Ti-6Al-4V and Ti-4Al-2V-1Mo-1Fe alloys presented excellent corrosion resistance in 3.5 wt.% NaCl solution. No obvious corrosion was observed on the surface of the two alloys after immersion in 3.5 wt.% NaCl for 180 days. Compared to the Ti-6Al-4V alloy, the higher Mo content in the Ti-4Al-2V-1Mo-1Fe alloy increased the stability of passivation film, and showed an increased corrosion resistance.
(3) Compared to the Ti-6Al-4V alloy, the Ti-4Al-2V-1Mo-1Fe alloy presented a slightly lower strength and higher ductility.

Author Contributions

Data curation, Y.W. and H.Z.; funding acquisition, Y.M.; methodology, D.X. and Y.M.; writing—original draft, Y.Q. and S.W.; writing—review and editing, J.C.

Funding

This research received no external funding.

Acknowledgments

The authors acknowledge the financial support of the National Natural Science Foundation of China (No. 51871225), National Key Research and Development Program of China [2018YFC0310400], and Natural Science Foundation of the Higher Education Institutions of Jiangsu Province, China [18KJB460007].

Conflicts of Interest

The authors declare no conflict of interest.

References

  1. Boyer, R.R. An overview on the use of titanium in the aerospace industry. Mater. Sci. Eng. A 1996, 213, 103–144. [Google Scholar] [CrossRef]
  2. Zhang, H.; Li, J.L.; Ma, P.Y.; Xiong, J.T.; Zhang, F.S. Study on microstructure and impact toughness of TC4 titanium alloy diffusion bonding joint. Vacuum 2018, 152, 272–277. [Google Scholar] [CrossRef]
  3. Nady, H.; El-Rabiei, M.M.; Samy, M. Corrosion behavior and electrochemical properties of carbon steel, commercial pure titanium, copper and copper–aluminum–nickel alloy in 3.5% sodium chloride containing sulfide ions. Egypt. J. Pet. 2017, 26, 79–94. [Google Scholar] [CrossRef]
  4. Cui, Z.Y.; Wang, L.W.; Zhong, M.Y.; Ge, F.; Gao, H.; Man, C.; Liu, C.; Wang, X. Electrochemical behavior and surface characteristics of pure titanium during corrosion in simulated desulfurized flue gas Condensates. J. Electrochem. Soc. 2018, 165, C542. [Google Scholar] [CrossRef]
  5. Wang, Z.B.; Hu, H.X.; Zheng, Y.G.; Ke, W.; Qiao, Y.X. Comparison of the corrosion behavior of pure titanium and its alloys in fluoride-containing sulfuric acid. Corros. Sci. 2016, 103, 50–65. [Google Scholar] [CrossRef]
  6. Contu, F.; Elsener, B.; Böhni, H. Serum effect on the electrochemical behaviour of titanium, Ti6Al4V and Ti6Al7Nb alloys in sulphuric acid and sodium hydroxide. Corros. Sci. 2004, 46, 2241–2254. [Google Scholar] [CrossRef]
  7. Narayanan, R.; Seshadri, S.K. Point defect model and corrosion of anodic oxide coatings on Ti-6Al-4V. Corros. Sci. 2008, 50, 1521–1529. [Google Scholar] [CrossRef]
  8. Tamilselvi, S.; Raman, V.; Rajendran, N. Evaluation of corrosion behavior of surface modified Ti-6Al-4V ELI alloy in hanks solution. J. Appl. Electrochem. 2010, 40, 285–293. [Google Scholar] [CrossRef]
  9. Rai, S.; Dihingia, P.J. Optoelectronics of Cu2+-Doped TiO2 Films Prepared by Sol.–Gel Method; Springer India: New Delhi, India, 2015; pp. 581–589. [Google Scholar]
  10. Hugot-Le Goff, A. Structure of very thin TiO2 films studied by Raman spectroscopy with interference enhancement. Thin Solid Films 1986, 142, 193–197. [Google Scholar] [CrossRef]
  11. Diamanti, M.V.; Souier, T.; Stefancich, M.; Chiesa, M.; Pedeferri, M.P. Probing anodic oxidation kinetics and nanoscale heterogeneity within TiO2 films by conductive Atomic Force Microscopy and combined techniques. Electrochim. Acta 2014, 129, 203–210. [Google Scholar] [CrossRef]
  12. Yue, T.M.; Yu, J.K.; Mei, Z.; Man, H.C. Excimer laser surface treatment of Ti–6Al–4V alloy for corrosion resistance enhancement. Mater. Lett. 2002, 52, 206–212. [Google Scholar] [CrossRef]
  13. Blanco-Pinzon, C.; Liu, Z.; Voisey, K.; Bonilla, F.A.; Skeldon, P.; Thompson, G.E.; Piekoszewski, J.; Chmielewski, A.G. Excimer laser surface alloying of titanium with nickel and palladium for increased corrosion resistance. Corros. Sci. 2005, 47, 1251–1269. [Google Scholar] [CrossRef]
  14. Newman, R.C. The dissolution and passivation kinetics of stainless alloys containing molybdenum- I. Coulometric studies of Fe-Cr and Fe-Cr-Mo alloys. Corros. Sci. 1985, 25, 331–339. [Google Scholar] [CrossRef]
  15. Newman, R.C. The dissolution and passivation kinetics of stainless alloys containing molybdenum-II. Dissolution kinetics in artificial pits. Corros. Sci. 1985, 25, 341–350. [Google Scholar] [CrossRef]
  16. Marcus, P. On some fundamental factors in the effect of alloying elements on passivation of alloys. Corros. Sci. 1994, 36, 2155–2458. [Google Scholar] [CrossRef]
  17. Ouchi, C.; Fukai, H.; Hasegawa, K. Microstructural characteristics and unique properties obtained by solution treating or aging in β-rich α+β titanium alloy. Mater. Sci. Eng. A 1999, 263, 132–136. [Google Scholar] [CrossRef]
  18. Erween Abd, R.; Safian, S. Investigation on tool life and surface integrity when drilling Ti-6Al-4V and Ti-5Al-4V-Mo/Fe. JSME Int. J. Ser. C 2006, 49, 340–345. [Google Scholar]
  19. Lin, D.J.; Lin, J.H.C.; Ju, C.P. Structure and properties of Ti-7.5Mo-xFe alloys. Biomaterials 2002, 23, 1723–1730. [Google Scholar] [CrossRef]
  20. Prodana, M.; Bojin, D.; Ioniţǎ, D. Effect of hydroxyapatite on interface properties for alloy/biofluid. UPB Sci. Bull. Ser. B Chem. Mater. Sci. 2009, 71, 89–98. [Google Scholar]
  21. Pimenova, N.V.; Starr, T.L. Electrochemical and corrosion behavior of Ti–xAl–yFe alloys prepared by direct metal deposition method. Electrochim. Acta 2006, 51, 2042–2049. [Google Scholar] [CrossRef]
  22. Lu, J.W.; Zhao, Y.Q.; Niu, H.Z.; Zhang, Y.S.; Du, Y.Z.; Zhang, W.; Huo, W.T. Electrochemical corrosion behavior and elasticity properties of Ti-6Al-xFe alloys for biomedical applications. Mater. Sci. Eng. C 2016, 62, 36–44. [Google Scholar] [CrossRef] [PubMed]
  23. Hsu, H.C.; Pan, C.H.; Wu, S.C.; Ho, W.F. Structure and grindability of cast Ti-5Cr-xFe alloys. J. Alloy. Compd. 2009, 474, 578–583. [Google Scholar] [CrossRef]
  24. Hsu, H.C.; Hsu, S.K.; Wu, S.C.; Lee, C.J.; Ho, W.F. Structure and mechanical properties of as-cast Ti-5Nb-xFe alloys. Mater. Charact. 2010, 61, 851–858. [Google Scholar] [CrossRef]
  25. Qiao, Y.X.; Cai, X.; Cui, J.; Li, H.B. Passivity and semiconducting behavior of a high nitrogen stainless steel in acidic NaCl solution. Adv. Mater. Sci. Eng. 2016, 6065481, 1–8. [Google Scholar] [CrossRef]
  26. Qiao, Y.X.; Chen, J.; Zhou, H.L.; Wang, Y.X.; Song, Q.N.; Li, H.B.; Zheng, Z.B. Effect of solution treatment on cavitation erosion behavior of high-nitrogen austenitic stainless steel. Wear 2019, 424–425, 70–77. [Google Scholar] [CrossRef]
  27. Huang, S.S.; Ma, Y.J.; Ping, Z.Y.; Zhang, S.L.; Yang, R. Influence of alloying elements partitioning behaviors on the microstructure and mechanical properties in α+β titanium alloy. Acta Metall. Sin. 2019, 55, 741–750. [Google Scholar]
  28. Huang, S.S.; Zhang, J.H.; Ma, Y.J.; Zhang, S.L.; Youssef, S.S.; Qi, M.; Wang, H.; Qiu, J.K.; Xu, D.S.; Lei, J.F.; et al. Influence of thermal treatment on element partitioning in α+β titanium alloy. J. Alloy. Compd. 2019, 791, 575–585. [Google Scholar] [CrossRef]
  29. Qiao, Y.X.; Tian, Z.H.; Cai, X.; Chen, J.; Wang, Y.X.; Song, Q.N.; Li, H.B. Cavitation erosion behaviors of a nickel-free high-nitrogen stainless steel. Tribol. Lett. 2019, 67, 1–9. [Google Scholar] [CrossRef]
  30. Carnot, A.; Frateur, I.; Zanna, S.; Tribollet, B.; Dubois-Brugger, I.; Marcus, P. Corrosion mechanisms of steel concrete moulds in contact with a demoulding agent studied by EIS and XPS. Corros. Sci. 2003, 45, 2513–2524. [Google Scholar] [CrossRef]
  31. Hitz, C.; Lasia, A. Experimental study and modeling of impedance of the her on porous Ni electrodes. J. Electroanal. Chem. 2001, 500, 213–222. [Google Scholar] [CrossRef]
  32. Jeyaprabha, C.; Sathiyanarayanan, S.; Venkatachari, G. Influence of halide ions on the adsorption of diphenylamine on iron in 0.5 M H2SO4 solutions. Electrochim. Acta 2006, 51, 4080–4088. [Google Scholar] [CrossRef]
  33. Qiao, Y.X.; Zheng, Y.G.; Ke, W.; Okafor, P.C. Electrochemical behaviour of high nitrogen stainless steel in acidic solutions. Corros. Sci. 2009, 51, 979–986. [Google Scholar] [CrossRef]
  34. Grubač, Z.; Metikoš-Huković, M. EIS study of solid-state transformations in the passivation process of bismuth in sulfide solution. J. Electroanal. Chem. 2004, 565, 85–94. [Google Scholar] [CrossRef]
  35. Hirschorn, B.; Orazem, M.E.; Tribollet, B.; Vivier, V.; Frateur, I.; Musiani, M. Determination of effective capacitance and film thickness from constant-phase-element parameters. Electrochim. Acta 2010, 55, 6218–6227. [Google Scholar] [CrossRef]
  36. Wang, Z.B.; Hu, H.X.; Liu, C.B.; Zheng, Y.G. The effect of fluoride ions on the corrosion behavior of pure titanium in 0.05M sulfuric acid. Electrochim. Acta 2014, 135, 526–535. [Google Scholar] [CrossRef]
  37. Cao, C.N. Theory of Electrochemical; Chemical Industry Press: Beijing, China, 2004; pp. 24–35. [Google Scholar]
  38. Ibrahim, M.A.; Pongkao, D.; Yoshimura, M. The electrochemical behavior and characterization of the anodic oxide film formed on titanium in NaOH solutions. J. Solid State Electrochem. 2002, 6, 341–350. [Google Scholar] [CrossRef]
  39. Wang, B.J.; Xu, D.K.; Wang, S.D.; Han, E.H. Recent progress in the research about fatigue crack initiation of Mg alloys under elastic stress amplitudes: A review. Front. Mech. Eng. 2019, 14, 113–127. [Google Scholar] [CrossRef]
  40. Wang, B.J.; Xu, D.K.; Wang, S.D.; Sheng, L.Y.; Zeng, R.C.; Han, E.H. Influence of solution treatment on the corrosion fatigue behavior of an as forged Mg-Zn-Y.-Zr alloy. Int. J. Fatigue 2019, 120, 46–55. [Google Scholar] [CrossRef]
Figure 1. XRD patterns of the (a) Ti-6Al-4V and (b) Ti-4Al-2V-1Mo-1Fe alloys.
Metals 09 01213 g001
Figure 2. LM of the (a) Ti-6Al-4V and (b) Ti-4Al-2V-1Mo-1Fe alloys.
Metals 09 01213 g002
Figure 3. SEM microstructures of the (a) Ti-6Al-4V and (b) Ti-4Al-2V-1Mo-1Fe alloys.
Metals 09 01213 g003
Figure 4. Microstructures of the (a,c) Ti-6Al-4V and (b,d) Ti-4Al-2V-1Mo-1Fe alloys after immersion in 3.5 wt.% NaCl solution for 180 days.
Metals 09 01213 g004
Figure 5. Evolution of open circuit potential (OCP) with immersion time for the Ti-6Al-4V and Ti-4Al-2V-1Mo-1Fe alloys in 3.5 wt.% NaCl solution.
Metals 09 01213 g005
Figure 6. Nyquist plots for the Ti-6Al-4V and Ti-4Al-2V-1Mo-1Fe alloys for 1 h of immersion in 3.5 wt.% NaCl solution.
Metals 09 01213 g006
Figure 7. Bode plots for the (a) Ti-6Al-4V and (b) Ti-4Al-2V-1Mo-1Fe alloys for 1 h of immersion in 3.5 wt.% NaCl solution.
Metals 09 01213 g007
Figure 8. The equivalent circuit used for quantitative evaluation of electrochemical impedance spectroscopy (EIS).
Metals 09 01213 g008
Figure 9. Potentiodynamic polarization curves of Ti-6Al-4V and Ti-4Al-2V-1Mo-1Fe alloys in 3.5 wt.% NaCl solution.
Metals 09 01213 g009
Figure 10. Tensile stress–strain curves of the Ti-6Al-4V and Ti-4Al-2V-1Mo-1Fe alloys.
Metals 09 01213 g010
Figure 11. Fractography of the (a) Ti-6Al-4V and (b) Ti-4Al-2V-1Mo-1Fe alloys.
Metals 09 01213 g011
Table 1. Chemical compositions of the tested alloys (wt.%).
AlloyAlVMoFeTi
Ti-6Al-4V5.954.03-0.33Bal.
Ti-4Al-2V-1Mo-1Fe3.962.031.050.92Bal
Table 2. Chemical compositions (EDS) of α and β phases of the Ti-6Al-4V and Ti-4Al-2V-1Mo-1Fe alloys (wt.%).
AlloyTiAlVMoFe
Ti-6Al-4Vα (area 1)88.66.94.5--
β (area 2)80.72.415.9-1.0
Ti-4Al-2V-1Mo-1Feα (area 3)93.55.31.2--
β (area 4)85.42.64.74.42.9
Table 3. The EIS fitted data of Ti-6Al-4V and Ti-4Al-2V-1Mo-1Fe alloys.
AlloyRs (Ω·cm−2)Rp (Ω·cm−2)Q−1·Sn·cm−2)n
Ti-6Al-4V10.89 ± 1.125.69 ± 0.13 × 1053.98 ± 0.32 × 10−50.93 ± 0.01
Ti-4Al-2V-1Mo-1Fe8.71 ± 0.876.50 ± 0.35 × 1052.56 ± 0.26 × 10−50.95 ± 0.01
Table 4. Mechanical parameters of the Ti-6Al-4V and Ti-4Al-2V-1Mo-1Fe alloys.
AlloyRm (MPa)Rp0.2 (MPa)ε (%)
Ti-6Al-4V968 ± 22.1921 ± 15.413.8 ± 1.1
Ti-4Al-2V-1Mo-1Fe838 ± 16.3796 ± 14.315.8 ± 1.3

