Article

Analysis of Ductile Fracture Obtained by Charpy Impact Test of a Steel Structure Created by Robot-Assisted GMAW-Based Additive Manufacturing

School of Mechanical Engineering, Northwestern Polytechnical University, Xi’an 710072, China
*
Author to whom correspondence should be addressed.
Metals 2019, 9(11), 1208; https://doi.org/10.3390/met9111208
Submission received: 23 October 2019 / Revised: 5 November 2019 / Accepted: 7 November 2019 / Published: 10 November 2019
(This article belongs to the Special Issue Dislocation Mechanics of Metal Plasticity and Fracturing)

Abstract

:
In this study, gas metal arc welding (GMAW) was used to construct a thin wall structure in a layer-by-layer fashion using an AWS ER70S-6 electrode wire with the help of a robot. The Charpy impact test was performed after extracting samples in directions both parallel and perpendicular to the deposition direction. In this study, multiple factors related to the resulting absorbed energy have been discussed. Despite being a layered structure, homogeneous behavior with acceptable deviation was observed in the microstructure, hardness, and fracture toughness of the structure in both directions. The fracture is extremely ductile with a dimpled fibrous surface and secondary cracks. An estimate for fracture toughness based on Charpy impact absorbed energy is also given.

1. Introduction

Additive manufacturing can be used to create a near-net shape for complex parts using the layer-by-layer deposition method. Powder or wire is melted using different energy sources, including electron beam, laser beam, or electric arc [1,2,3]. Integrated machinery, such as computer numerical control gantries or robots, can be used to create parts using wire and arc additive manufacturing. The mechanical properties of the manufactured materials generally depend on the welding parameters selected—they have been shown to have better properties than casted materials [4,5]. Researchers have studied different techniques for the process, including conventional gas tungsten arc welding (GTAW), gas metal arc welding (GMAW), and cold metal transfer (CMT) [6,7]. This includes studies on topology, build-up geometry, and material properties of structures made by these methods [8,9]. Comprehensive studies have been conducted on defects in microstructure and methods to improve them by controlling deposition strategies and incorporating ancillary processes for quality enhancement [10,11,12]. A lot of research is being carried out to control problems related to GMAW-based additive manufacturing, including dimension control at the start and end of the weld bead [13,14]. The height difference at the extreme ends is significant for multi-layer single-pass manufacturing, where the height difference is exaggerated with each layer being deposited, terminating the welding process [15]. Different techniques have been used to control the welding parameters and attain a maximum effective area in the resulting structure [13,16]. The resulting structure has different mechanical and material properties owing to the heat cycles of multiple layer depositions [17].
While studies have been conducted on mechanical properties, including tensile strength and hardness of materials created by additive manufacturing, little work can be found on the impact toughness of these materials. Toughness is an important characteristic that can help study the ability to absorb energy as well as the ductile or brittle behavior of the structure [18]. Toughness may or may not be anisotropic, based on the welding process, microstructure, and grain size [19,20]. Charpy impact testing is one of the most common methods to measure impact toughness. According to a study, the scatter might be lesser at room temperature, as compared to lower temperatures [21].
The results from the Charpy impact test should be studied in more depth, along with the microstructure and fracture analysis of the test specimens, to validate the absorbed impact energy [22]. As the fractography recognizes the mechanism of material failure, the behavior of crack propagation can identify the reasons for higher or lower energy absorbed by the ductile or brittle material. Ductile fractures have a dimpled surface due to tearing of the material and plastic deformation, while brittle fractures are evident from cleavage facets and almost no plastic deformation [23]. Moreover, in the case of ductile fracture, secondary cracks depict the indication of crack deflection with the absorption of more energy, resulting in better toughness [24].
This research focuses on the impact toughness of components made by GMAW and the possible factors responsible for the absorbed energy. The microstructure of the specimens is discussed, along with the fractography of the specimens, after impact testing. The deformation of the broken samples and intrinsic toughening mechanism are discussed in relation to the absorbed energy. An estimate of fracture toughness is also presented.

2. Method and Experiment

A thin wall was constructed by robot-assisted GMAW after controlling the welding parameters at the onset and end of the weld bead. The onset of the weld bead will be referred to as arc-striking, the end will be termed as arc-extinguishing, and the central part will be referred to as the steady stage; a schematic diagram is given in Figure 1. Low carbon steel electrode wire ER70S-6 with a diameter of 1.2 mm has been used to carry out the experiments with the following composition (Table 1).
The welding parameters have been controlled on the basis of welding energy profile optimization for uniform height throughout the weld bead. The travel speed is reduced as the weld bead approaches a steady stage to control the bulging shape at the arc-striking region. The decreasing slope at the arc-extinguishing area is controlled by reducing all of the parameters, including current, voltage, and travel speed. In the current study, the samples were extracted from the steady stage with constant welding energy of 660 J/mm and a two-minute delay before deposition of subsequent layers to prevent the process from terminating due to pool flow. This part of the deposition offers equilibrium in terms of height of the deposition and heat dissipation. The details of the same can be found in published literature mentioned in [16]. Deposition parameters for the steady stage part of the layer after equilibrium are provided in Table 2.
Absorbed energy was obtained at room temperature using an automatic impact testing machine JBS-300 (Jinan Kehui Testing Instrument Co., Ltd., Jinan, China) with a maximum capacity of 300 J, as shown in Figure 2. The pre-lift angle was 150°, while the impact velocity was 5.2 m/s. The Brinell hardness test was performed using Huayin 320HBS-3000 (Laizhou Huayin Testing Company Limited, Laizhou, China) to check the macro hardness of the specimens. Optical microscopy was carried out using OLYMPUS GX-71 (Olympus Corporation, Tokyo, Japan), while scanning electron microscopy and fractography was conducted using TESCAN VEGA (Oxford Instruments Technology, Beijing, China). X-ray diffraction (XRD) was performed using X’Pert PRO (PANalytical, Eindhoven, Netherlands) with a copper anode and generator settings of 40 mA and 40 KV.
The samples were obtained in directions both parallel to the deposition (hereafter referred to as horizontal) and perpendicular to the deposition (hereafter referred to as vertical). Due to the limitation of the available thickness of the thin wall structure, sub-size samples were extracted with dimensions of 55 × 10 × 5 mm3 in accordance with the specifications mentioned in standard test methods for notched bar impact testing of metallic materials [25]. Eight samples were extracted in both horizontal and vertical directions. The extracted sample, along with the impact direction used, is shown in Figure 3.

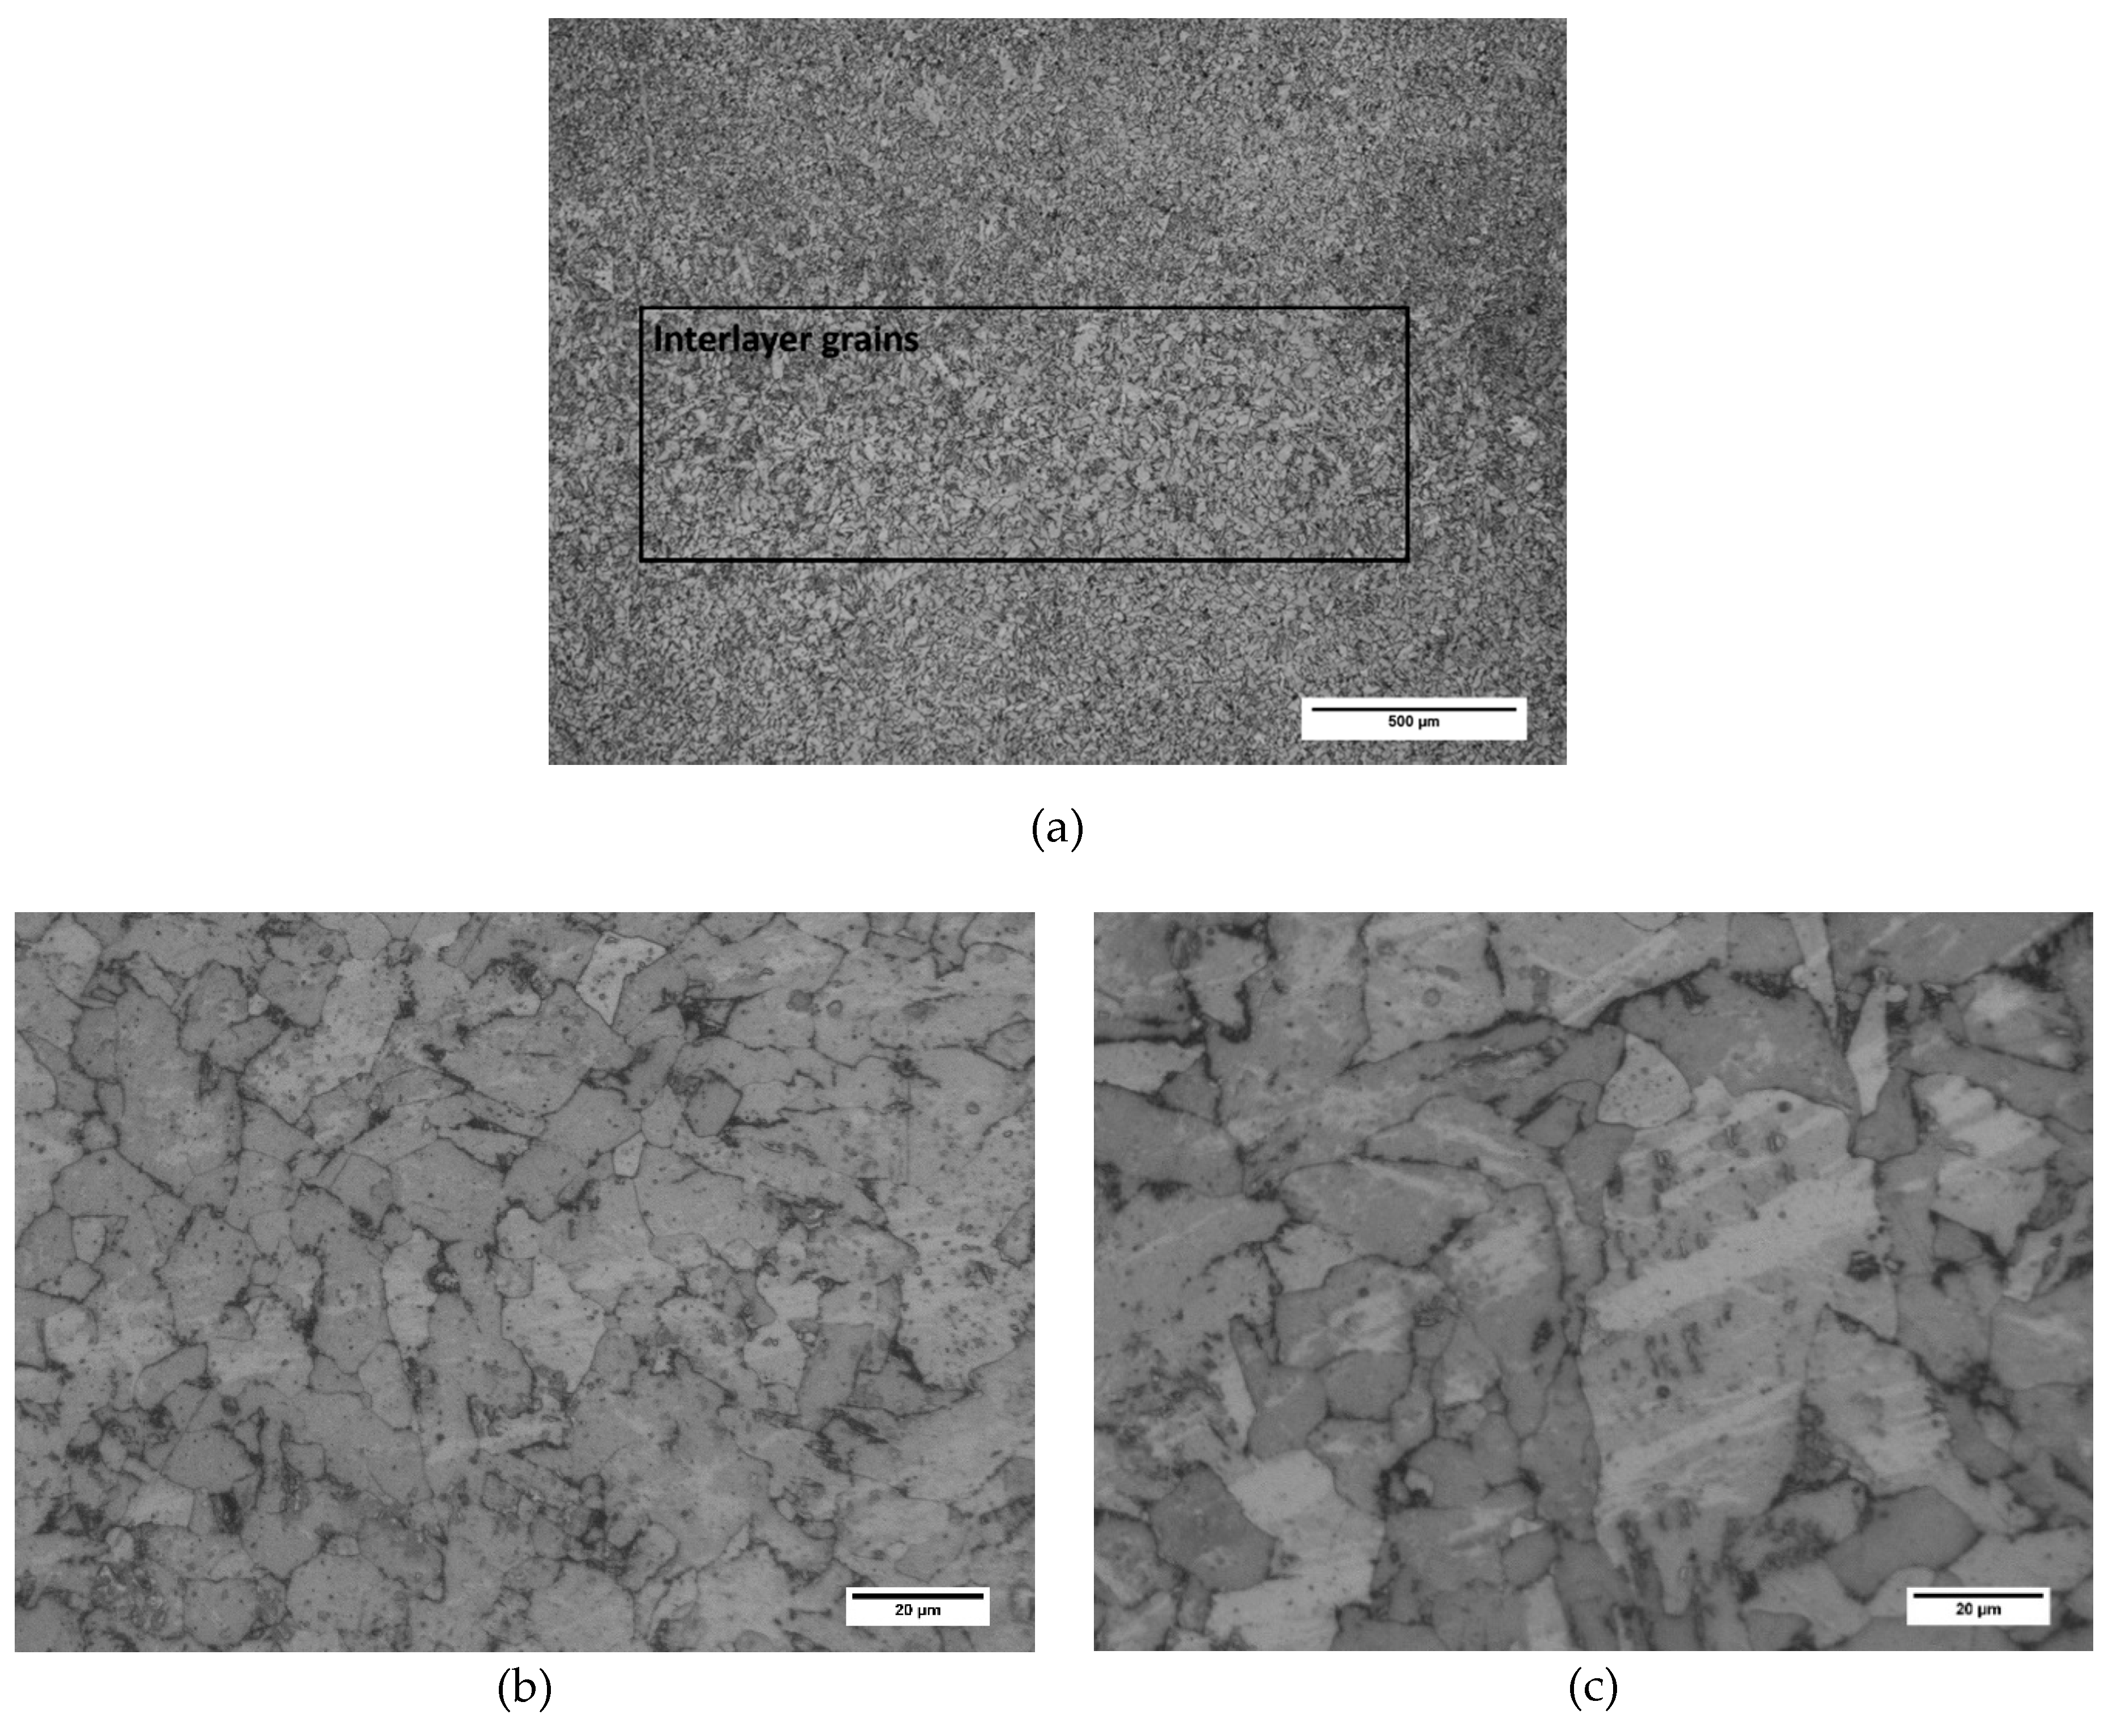
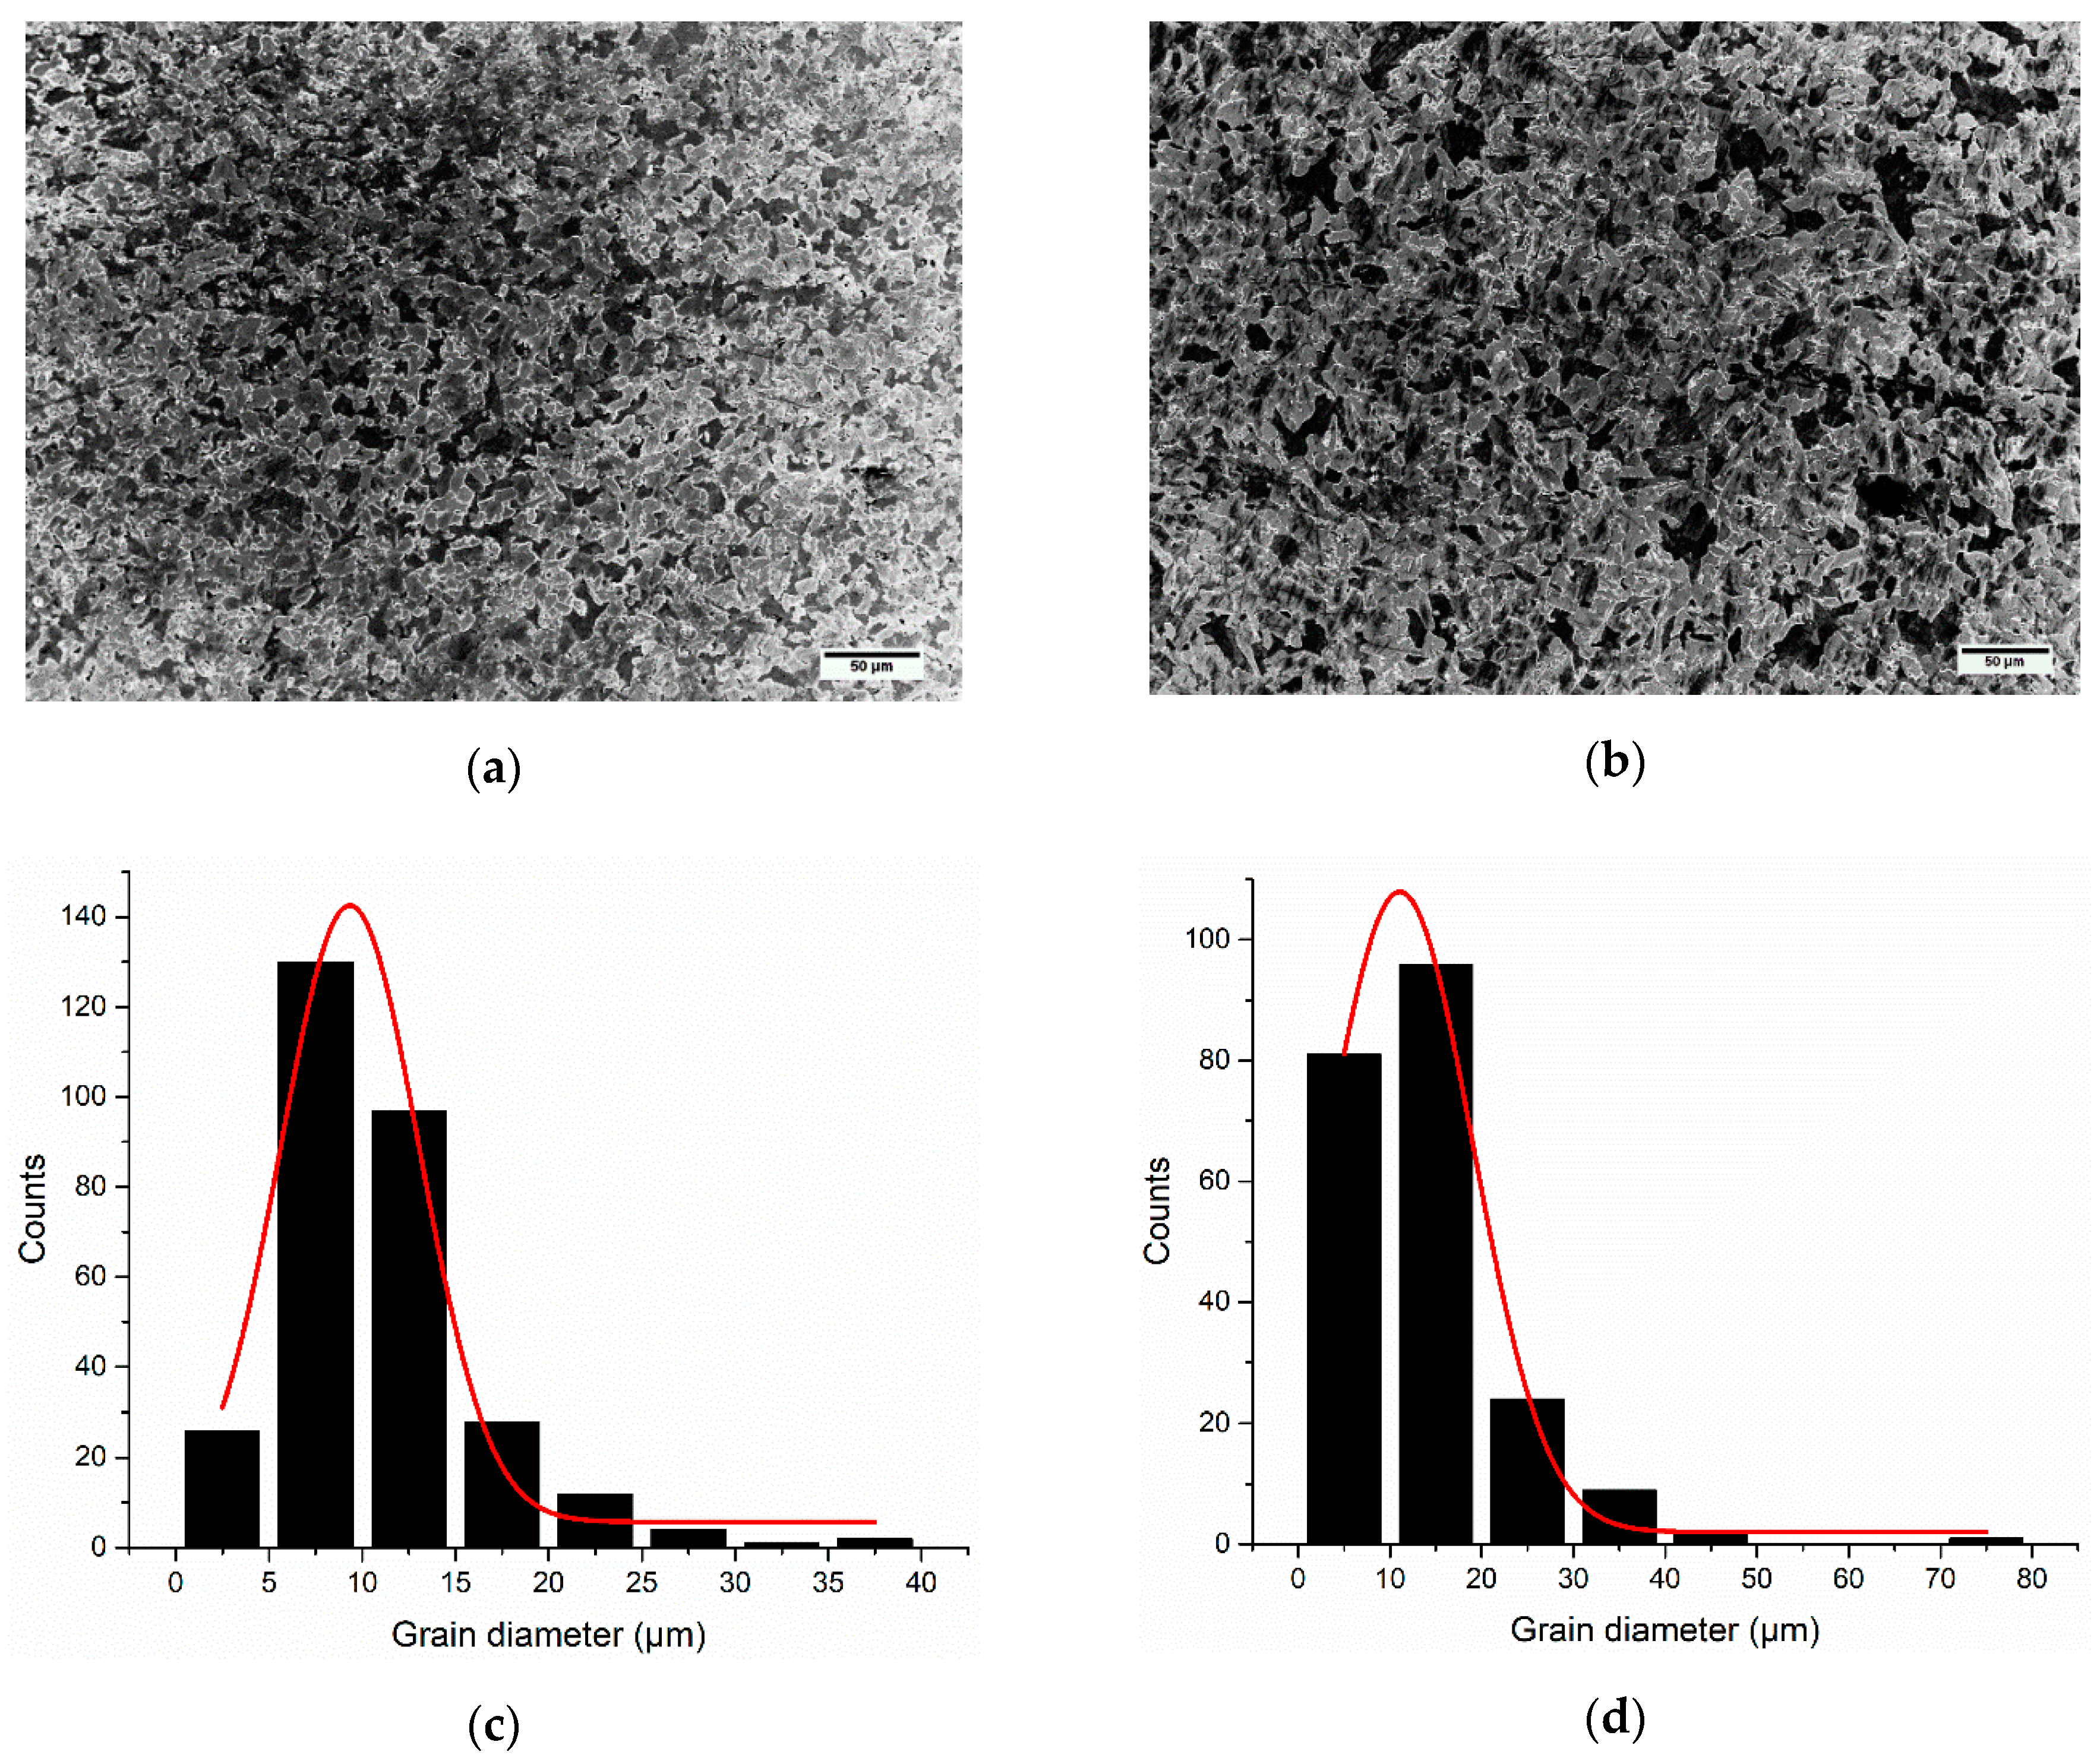
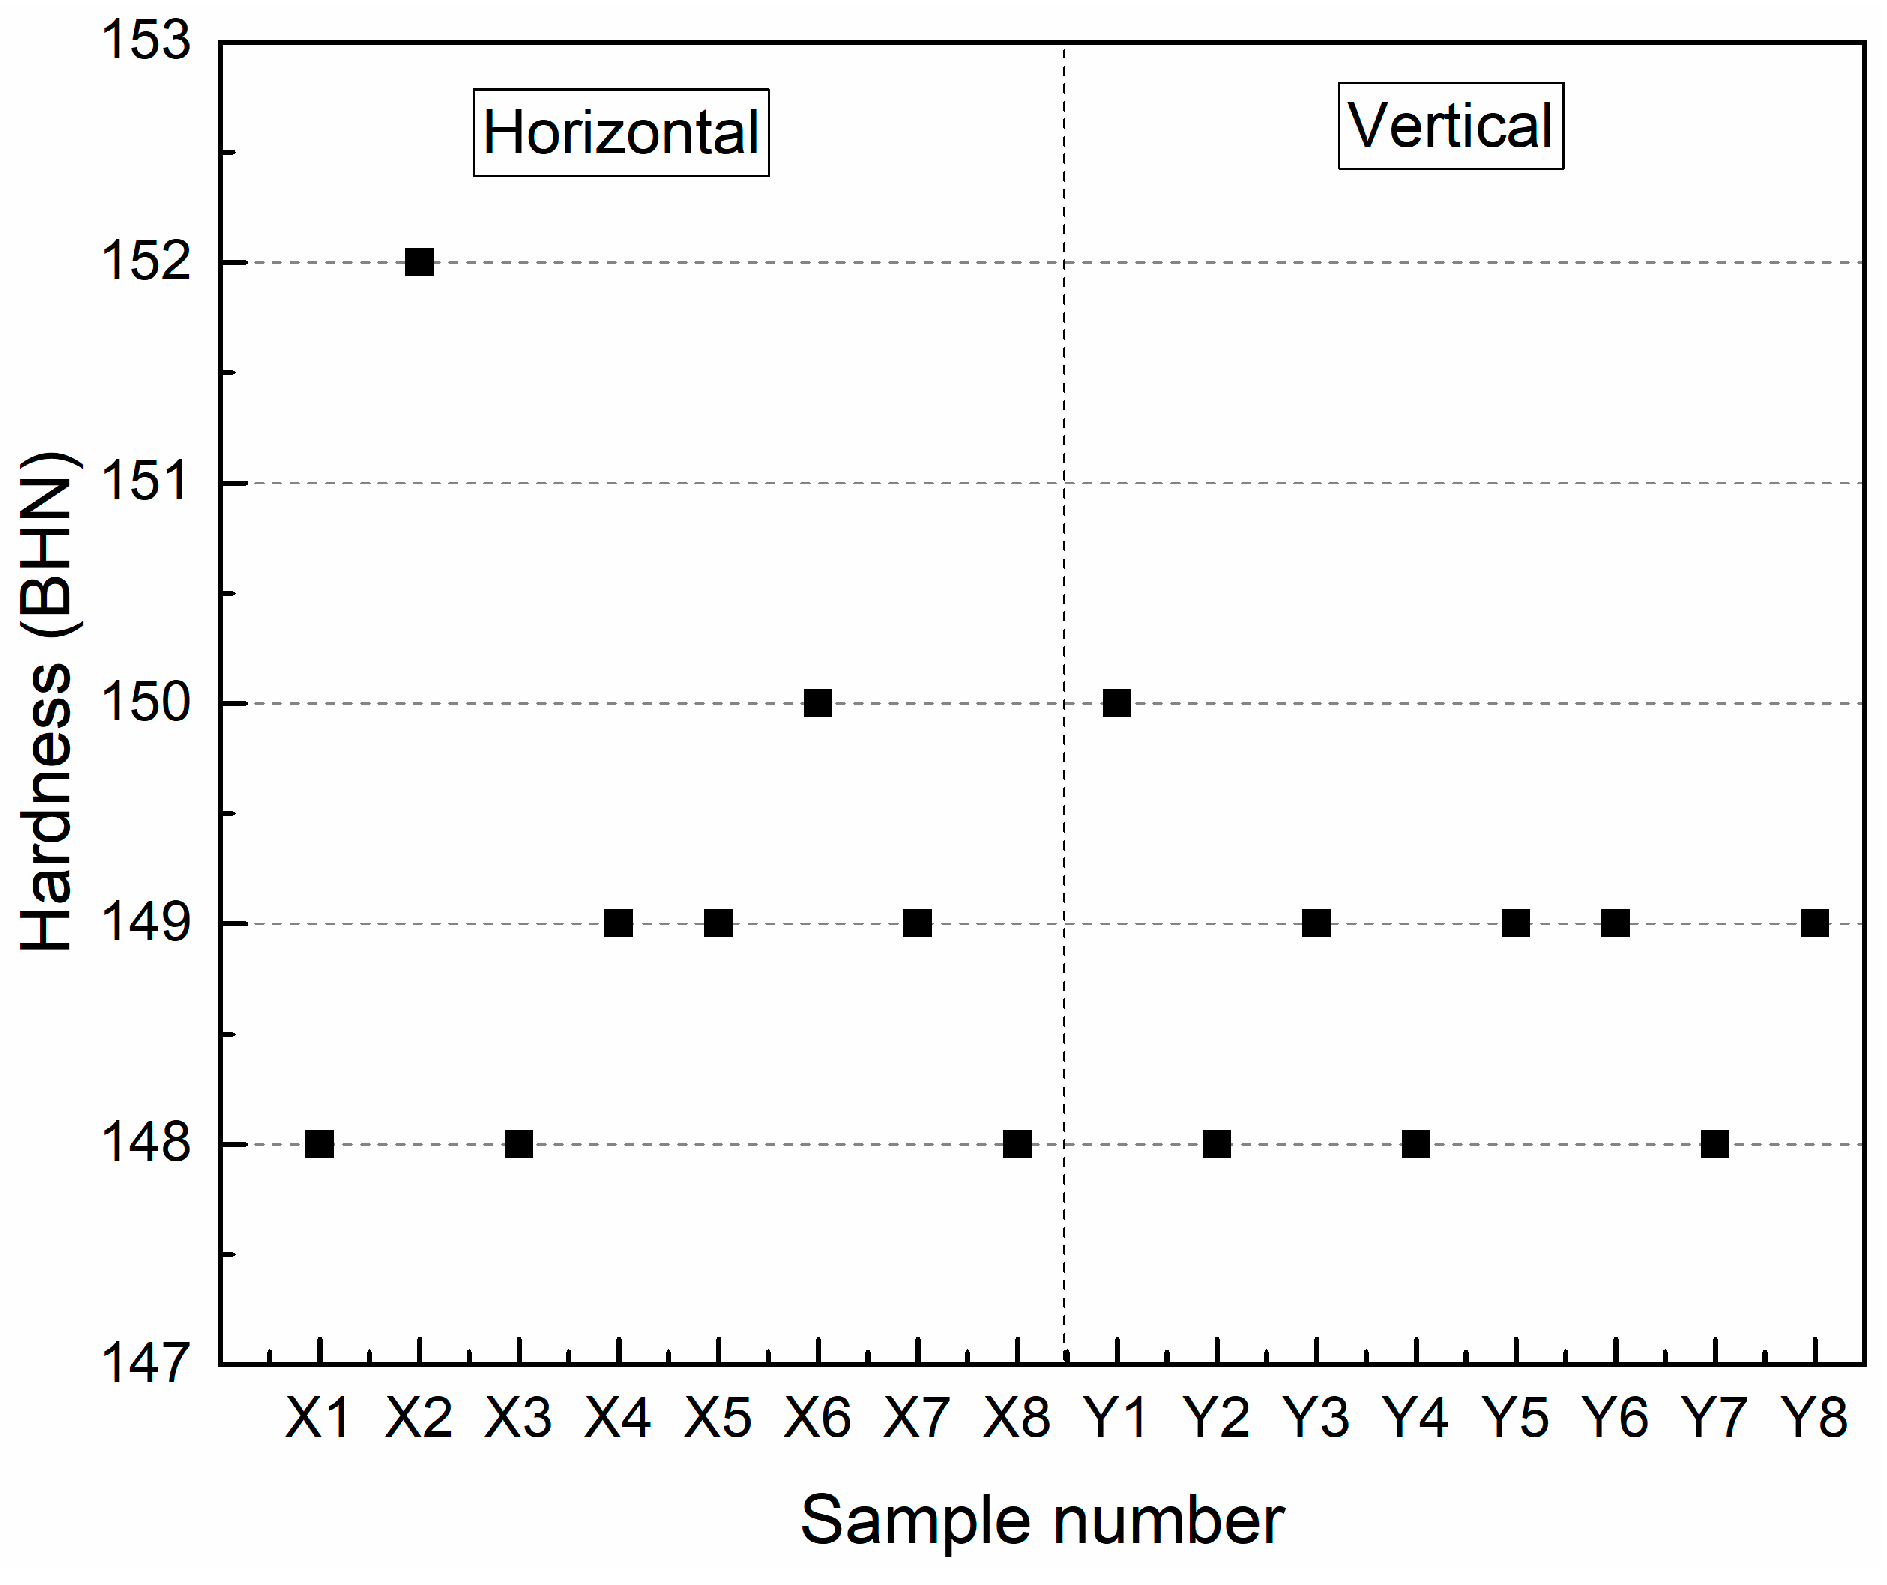
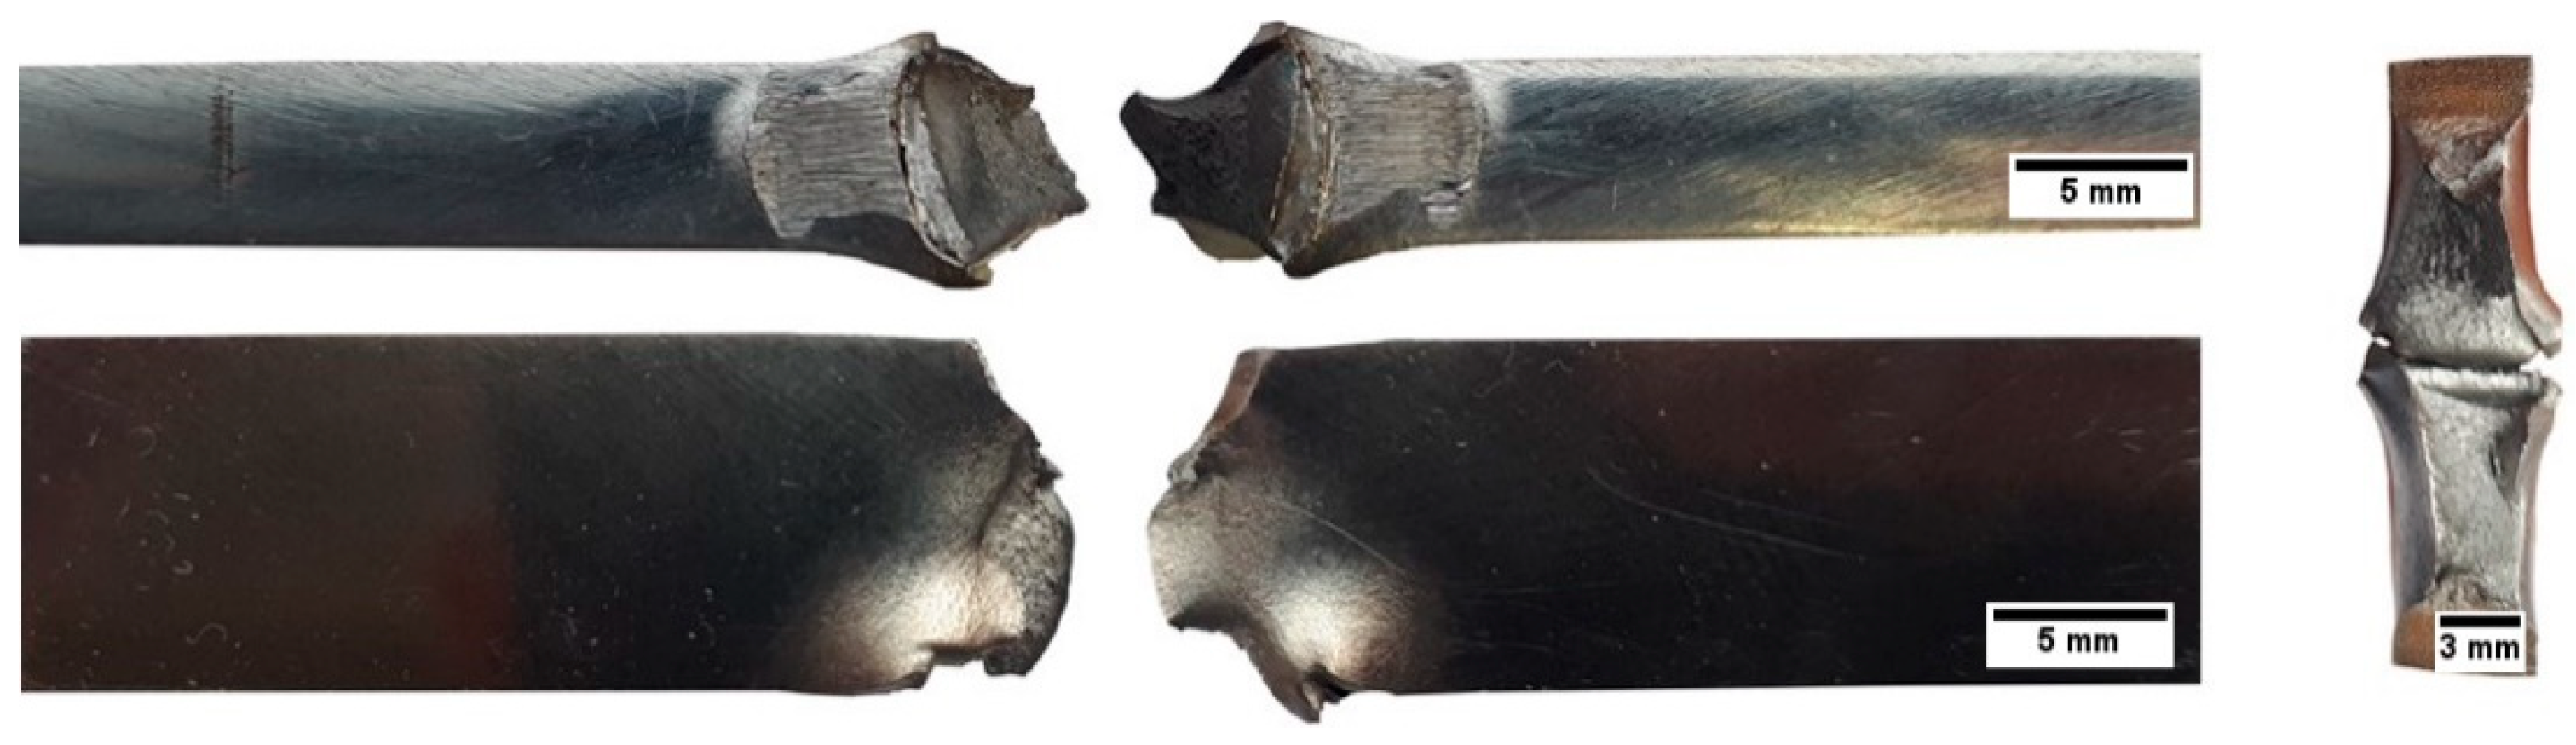
3. Results and Discussion

Absorbed energy results for both horizontal and vertical samples are given in Figure 4, along with a comparison of absorbed energy of steel with similar carbon content (i.e., 0.11% C) [26]. The values for the absorbed energy have been normalized for the full-size sample. The explanation for the normalizing is provided later in the article. The average value for horizontal specimens (X1 to X8) is approximately 189 J, while it is approximately 202 J for the vertical specimens (Y1 to Y8).
Various methods can be adopted to increase the strength of materials, including cold work hardening, precipitate or dispersion hardening, and grain refinement [27]. Strengthening is identified by obstruction in lattice dislocations in all the cases. However, cold working and precipitation hardening increase the brittleness of the material, while grain refinement has a different effect that enhances ductility in terms of percentage elongation [28]. The pre- and post-heat effect of each layer being welded results in the refinement of the grains, causing a higher percentage elongation. The amount of energy absorbed is comparable to the upper shelf absorbed energy of ferritic structure from the reference [26], portraying the material’s ability to undergo a large amount of plastic deformation, hence good ductility. Grain structure is depicted in Figure 5 for different directions and magnification levels. Although the structure of the grains is similar within the layer and between the two successive layers, a difference in size can be observed, as shown in Figure 5a. Higher magnification images are presented in Figure 5b,c for the intralayer and interlayer microstructures, respectively. The same difference is also visible in SEM images in Figure 6a,b. Histogram for a part of each SEM image is given in Figure 6c,d for intralayer and interlayer grain diameter, respectively. As the samples have been taken from the steady stage area where equilibrium has been achieved, the grain structure is mostly ferritic equiaxed, as shown in Figure 5. The average grain size number was found to be 10.5, calculated following ASTM standard E112 [29].
Although hardness varies in direct proportion to the carbon content, fine grain size results in higher values of hardness [30]. The average hardness value of horizontal samples is approximately 149 BHN with a standard deviation of 1.35, while it is approximately 148.7 BHN with a standard deviation of 0.71 for vertical samples, as shown in Figure 7. Values are comparable to steel with similar carbon content.
Low carbon steel with a uniform microstructure is considered to have better toughness because of its ferritic structure. High carbon steel with a martensitic structure has more brittle sites, providing lesser resistance to crack propagation [31,32]. However, in this case, a uniform microstructure with a mostly ferritic structure proves to be a hindrance to dislocations in all directions, resulting in a slanted fracture in each plane, as shown in Figure 8. This slanted plane was identical in both the horizontal and vertical specimens, proving that the structure is uniform in both directions with decent penetration of each layer into the subsequent one.
The energy absorbed by the material in the plastic region is of importance, especially for structural steel; thus, maximum strength can be estimated by observing deformation ability before the final fracture in the inelastic region. Figure 9 shows the amount of deformation that each sample has undergone before the final fracture. Regardless of deposition direction, each sample has been deformed in a similar fashion with quite a large deformation before failure. This t includes lateral expansion of the specimen, which has been normalized for the sub-size sample (Figure 10). Average values for the horizontal and vertical specimens are approximately 46% and 51%, respectively.
The deformation behavior with an almost 45° fracture plane depicts shear stress that exceeds the shear strength of the structure, resulting in plastic yielding. The fibrous appearance and large deformation before fracture, along with the shear plane fracture, point towards the pure ductile fracture. The specimens had to be separated after being closed once at the hinges, according to instructions set by standard test methods for notched bar impact testing of metallic materials ASTM E23-07a [25]. There was no cleavage in the broken specimen; thus, it is considered a pure shear fracture, according to the mentioned standard. The coalescence of voids results in the development of a shear lip, which is responsible for a higher upper shelf energy fracture. Fractography of the specimens displays a dimpled surface with a fibrous fracture, as shown in Figure 11. Generally, brittle fracture in carbon steel is initiated by martensitic sites; however, the microstructure shown in Figure 5 shows that the structure obtained in this case is equiaxed and mostly ferritic. The fractography depicts pure ductile behavior, the reason why the results have been normalized by a factor of two, as presented in Figure 4.
The X-ray diffraction analysis supports the presence of a ferritic structure with mostly pure iron in the central part of the constructed wall, as shown in Figure 12. The trace elements were mostly evaporated or dragged to the extreme ends of the wall. In this kind of fully ferritic structure, microvoid nucleations generate at the grain boundary and deep equiaxed dimples are formed [33].
Another important factor responsible for the high absorbed energy is the formation of secondary cracks. The creation and motion of dislocations in the crystal lattice are responsible for the plastic deformation. The material dissipates energy during the dislocation movements and crack tip dislocation nucleation leads to intrinsic ductility [34]. The secondary cracks might also have been generated due to the stacked layers, which act as a crack divider, as depicted in Figure 13. This delamination phenomenon can occur even without a substantial difference between the interlayer and intralayer microstructures [35].
As the fracture was purely in the upper shelf region and was ductile in nature, fracture toughness can be estimated using the relation [36,37]:
KIC = 0.804 σys (CVN/σys − 0.0098)0.5
where KIC is the fracture toughness in MPa·m1/2, σys is the yield strength in MPa, and CVN is the Charpy impact absorbed energy in J. Using the average yield strength (330 MPa) of the structure from [16], the fracture toughness was found to be approximately 199 MPa·m1/2 and 206 MPa·m1/2 for the horizontal and vertical specimens, respectively.

4. Conclusion

This study presents an analysis to explain the different factors related to the Charpy impact energy absorbed by a structure made by GMAW additive manufacturing. The average absorbed energy in the horizontal and vertical direction was found to be 189 J and 202 J, respectively. The difference in the amount of energy in both directions is not substantial, which is also in conformance with the observed microstructure. The microstructure was found to be mostly equiaxed with a grain size number of about 10.5. The broken samples exhibit a large amount of deformation in all directions, thus absorbing a high amount of energy. Fractography of the broken samples reveals a highly fibrous fracture with dimples, suggesting a pure ductile fracture. The generation of secondary cracks is also indicative of high absorbed energy. As the fracture is in the upper shelf region, the estimated value for fracture toughness was calculated to be 199 MPa·m1/2 and 206 MPa·m1/2 for the horizontal and vertical specimens, respectively.

Author Contributions

Conceptualization, J.X.; funding acquisition, C.Z.; project administration, X.Q.; resources, H.W.; writing—original draft, A.W.

Funding

This research was financially supported by the National Natural Science Foundation of China, grant number 51805437.

Conflicts of Interest

The authors declare no conflict of interest.

References

  1. Frazier, E.W. Metal Additive Manufacturing: A Review. J. Mater. Eng. Perform. 2014, 23, 1917–1928. [Google Scholar] [CrossRef]
  2. Antonysamy, A. Microstructure, texture and mechanical property evolution during additive manufacturing of Ti6Al4V alloy for aerospace applications. PhD Thesis, University of Manchester, Manchester, UK, 2012. [Google Scholar]
  3. Buckner, M.; Lonnie, J. Automating and accelerating the additive manufacturing design process with multi-objective constrained evolutionary optimization and HPC/Cloud computing. In Proceedings of the 2012 Future of Instrumentation International Workshop (FIIW), Gatlinburg, TN, USA, 8–9 October 2012. [Google Scholar]
  4. Brandl, E.; Baufeld, B.; Leyens, C. Additive manufactured Ti-6Al-4V using welding wire: comparison of laser and arc beam deposition and evaluation with respect to aerospace material specifications. Physics Procedia 2010, 5(Part B), 595–606. [Google Scholar] [CrossRef]
  5. Pandremenos, J.; Doukas, C.; Stavropoulos, P.; Chryssolouris, G. Machining with robots: a critical review. In Proceedings of the 7th International Conference on Digital Enterprise Technology, Athens, Greece, 28–30 September 2011. [Google Scholar]
  6. Wang, Y.; Chen, X.; Konovalov, S. Additive manufacturing based on welding arc: a low-cost method. J. Surf. Invest. 2017, 11, 1317–1328. [Google Scholar] [CrossRef]
  7. Chen, X.; Su, C.; Wang, Y.; Siddiquee, A.N.; Sergey, K.; Jayalakshmi, S.; Singh, R.A. Cold Metal Transfer (CMT) Based Wire and Arc Additive Manufacture (WAAM) System. J. Surf. Invest. 2018, 12, 1278–1284. [Google Scholar] [CrossRef]
  8. Müller, J.; Grabowski, M.; Müller, C.; Hensel, J.; Unglaub, J.; Thiele, K.; Kloft, H.; Dilger, K. Design and Parameter Identification of Wire and Arc Additively Manufactured (WAAM) Steel Bars for Use in Construction. Metals 2019, 9, 725. [Google Scholar] [CrossRef]
  9. Rodrigues, T.A.; Duarte, V.; Avila, J.A.; Santos, T.G.; Miranda, R.; Oliveira, J. Wire and arc additive manufacturing of HSLA steel: Effect of thermal cycles on microstructure and mechanical properties. Addit. Manuf. 2019, 27, 440–450. [Google Scholar] [CrossRef]
  10. Oliveira, J.; Santos, T.; Miranda, R. Revisiting fundamental welding concepts to improve additive manufacturing: From theory to practice. Prog. Mater. Sci. 2019, 107, 100590. [Google Scholar] [CrossRef]
  11. Rodrigues, T.A.; Duarte, V.; Miranda, R.; Santos, T.G.; Oliveira, J. Current Status and Perspectives on Wire and Arc Additive Manufacturing (WAAM). Materials 2019, 12, 1121. [Google Scholar] [CrossRef]
  12. Cunningham, C.; Flynn, J.; Shokrani, A.; Dhokia, V.; Newman, S. Invited review article: Strategies and processes for high quality wire arc additive manufacturing. Addit. Manuf. 2018, 22, 672–686. [Google Scholar] [CrossRef]
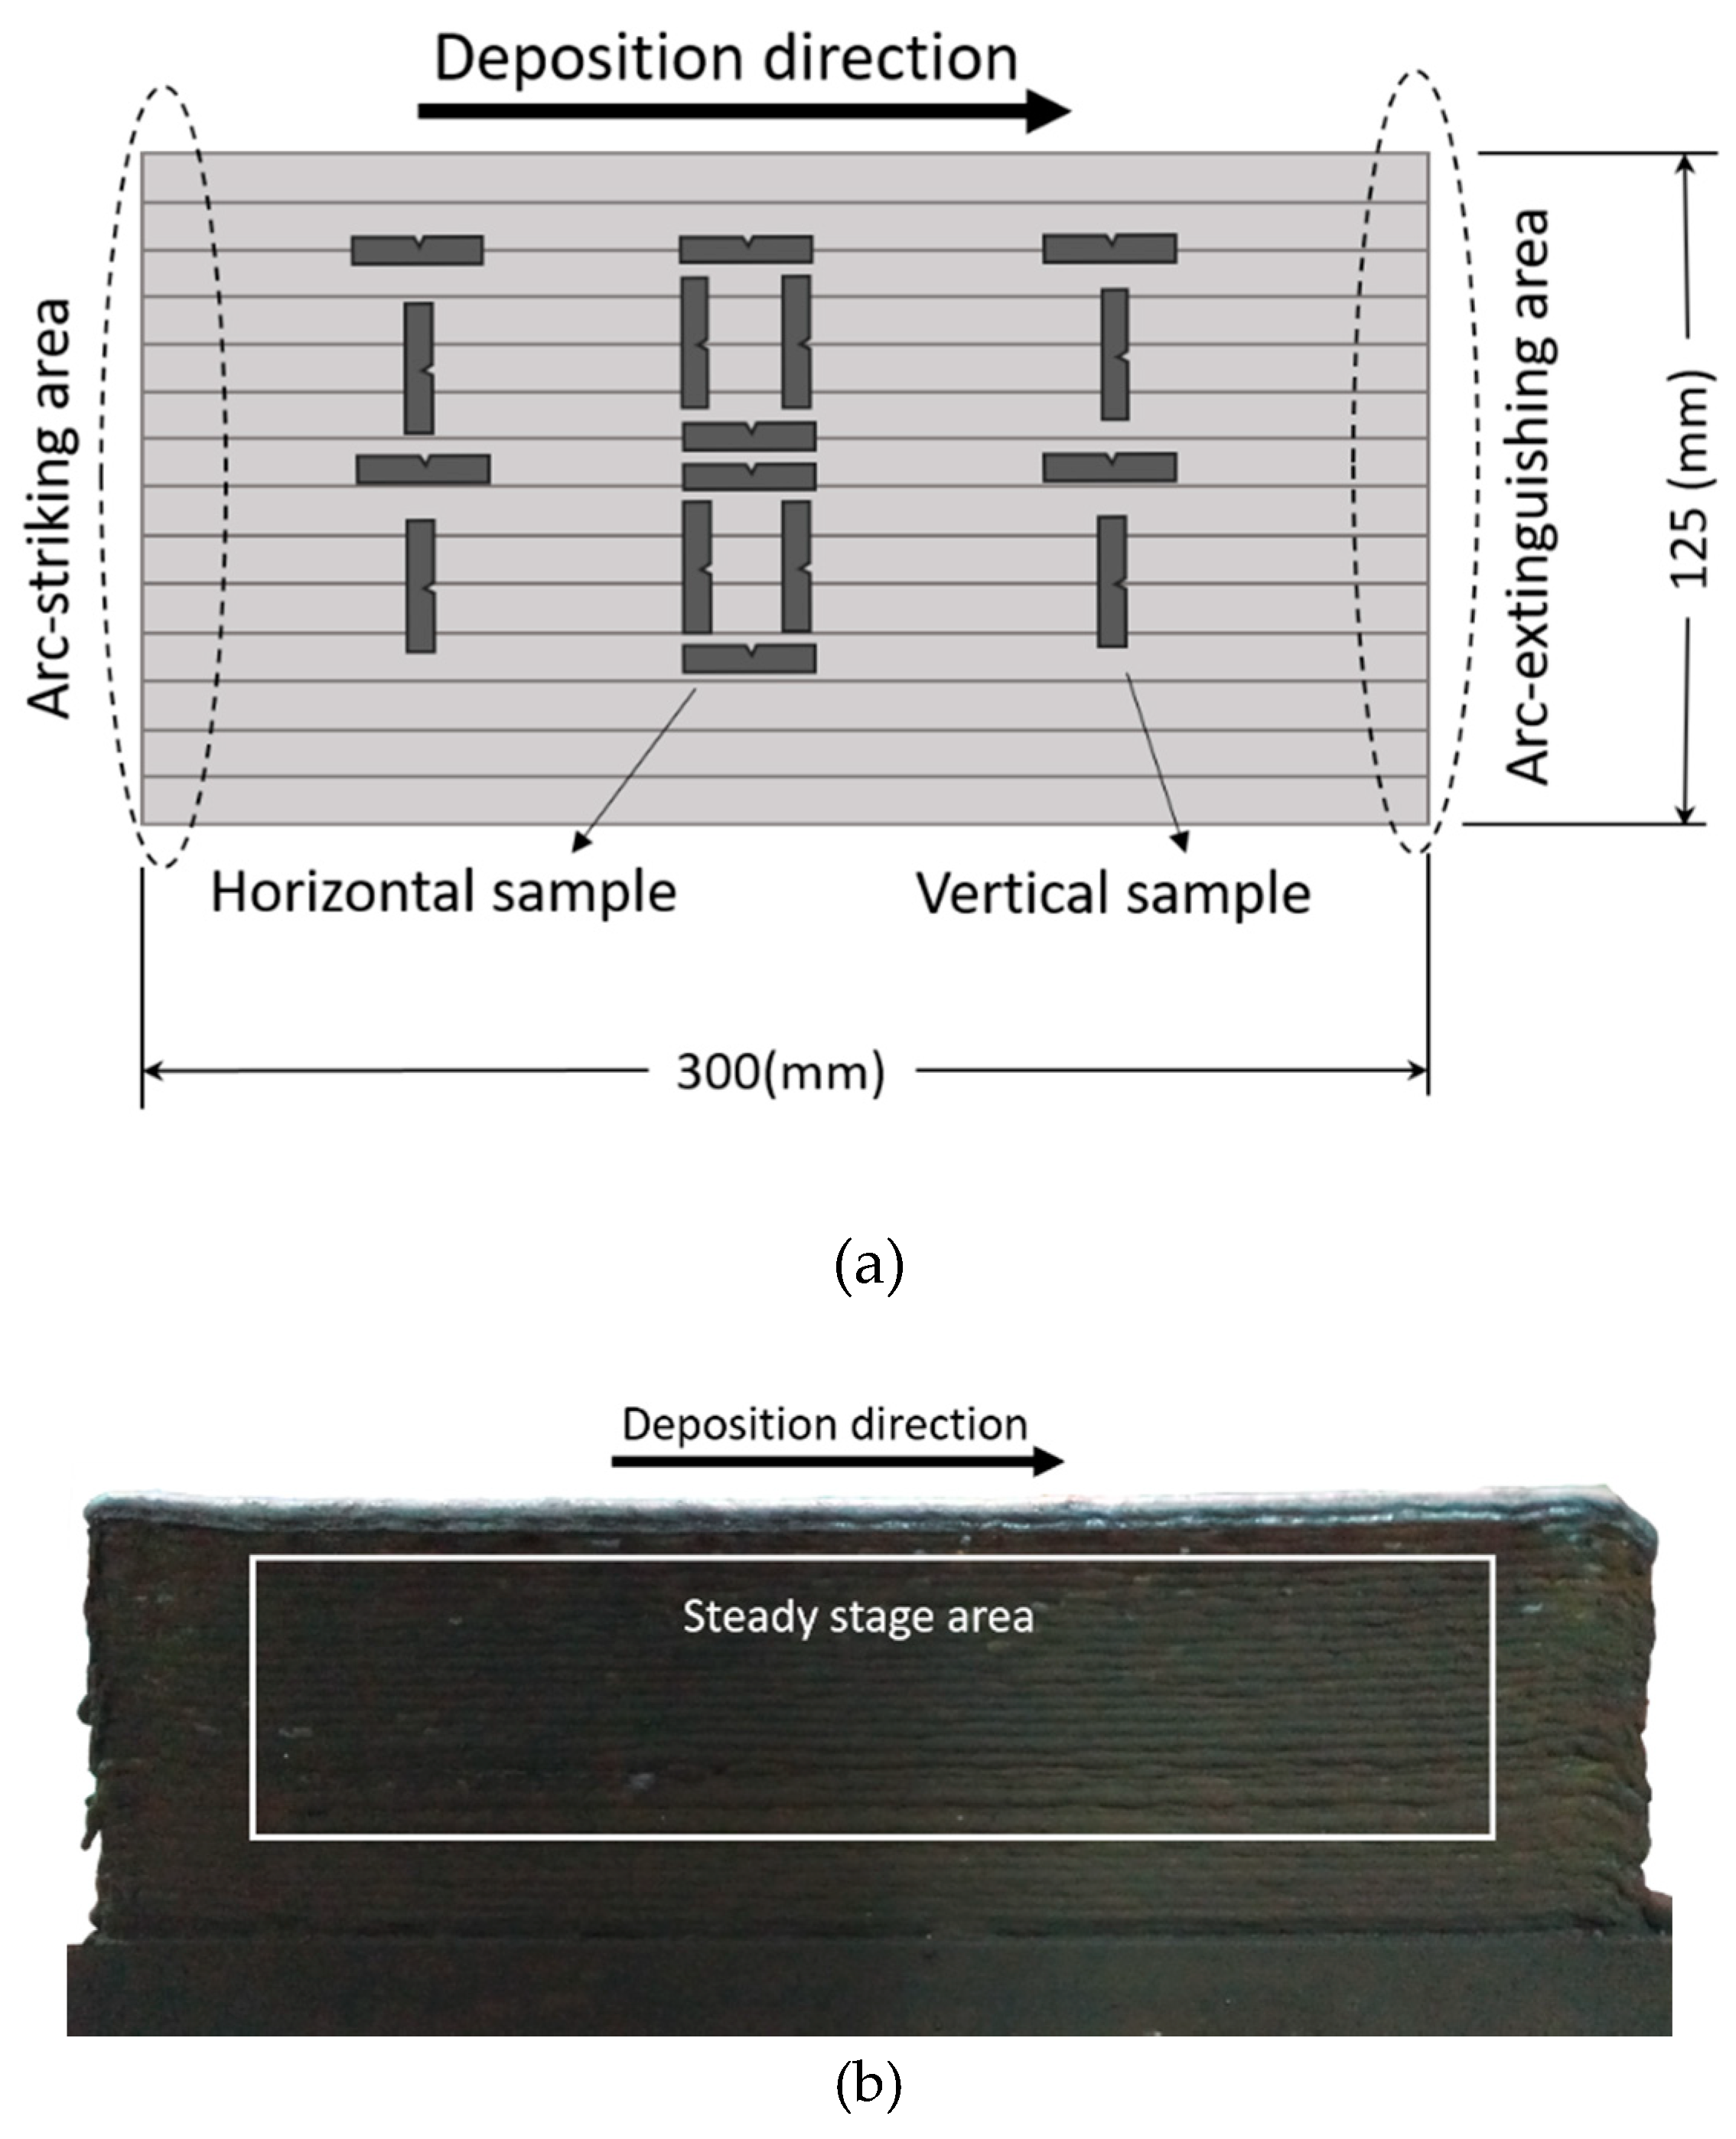
  13. Xiong, J.; Yin, Z.Q.; Zhang, W.H. Forming appearance control of arc striking and extinguishing area in multi-layer single-pass GMAW-based additive manufacturing. Int. J. Adv. Manuf. Tech. 2016, 87, 579–586. [Google Scholar] [CrossRef]
  14. Hu, Z.; Qin, X.; Shao, T.; Liu, H. Understanding and overcoming of abnormity at start and end of the weld bead in additive manufacturing with GMAW. Int. J. Adv. Manuf. Tech. 2018, 95, 2357–2368. [Google Scholar] [CrossRef]
  15. Zhang, Y.; Chen, Y.; Li, P.; Male, A.T. Weld deposition-based rapid prototyping: a preliminary study. J. Mater. Process. Technol. 2003, 135, 347–357. [Google Scholar] [CrossRef]
  16. Waqas, A.; Qin, X.; Xiong, J.; Wang, H.; Zheng, C. Optimization of Process Parameters to Improve the Effective Area of Deposition in GMAW-Based Additive Manufacturing and its Mechanical and Microstructural Analysis. Metals 2019, 9, 775. [Google Scholar] [CrossRef]
  17. Zhao, H.H.; Zhang, G.J.; Yin, Z.Q.; Wu, L. A 3D dynamic analysis of thermal behavior during single-pass multi-layer weld-based rapid prototyping. J. Mater. Process. Technol. 2011, 211, 488–495. [Google Scholar] [CrossRef]
  18. Cao, W.; Zhang, M.; Huang, C.; Xiao, S.; Dong, H.; Weng, Y. Ultrahigh Charpy impact toughness (~450 J) achieved in high strength ferrite/martensite laminated steels. Sci. Rep. 2017, 7, 41459. [Google Scholar] [CrossRef]
  19. Rojas, P.; Martinez, C.; Vera, R.; Puentes, M. Toughness of SAE 1020 Steel with and without Galvanization Exposed to Different Corrosive Environments in Chile. Int. J. Electrochem. Sci. 2014, 9, 2848–2858. [Google Scholar]
  20. Salimi, A.; Zadeh, H.M.; Toroghinejad, M.R.; Asefi, D.; Ansaripour, A. Influence of Sample Direction on the Impact Toughness of the Api-X42 Microalloyed Steel with a Banded Structure. Mater. Technol.. 2013, 47, 385–389. [Google Scholar]
  21. Lucon, E.; McCowan, C.N.; Santoyo, R.L. Certification of NIST Room Temperature Low-Energy and High-Energy Charpy Verification Specimens. J. Res. Nat. Inst. Stand. Technol. 2015, 120, 316–328. [Google Scholar] [CrossRef]
  22. Dean, S.W.; Manahan, M.P.; Mccowan, C.N. Percent Shear Area Determination in Charpy Impact Testing. J. ASTM Int. 2008, 5, 101662–101676. [Google Scholar] [CrossRef]
  23. Parrington, R.J. Fractographic features in metals and plastics. Adv. Mater. Processes 2003, 161, 37–40. [Google Scholar]
  24. Wei, R.P. Fracture mechanics: Integration of mechanics, materials science and chemistry; Cambridge University Press: Cambridge, UK, 2010; pp. 24–54. [Google Scholar]
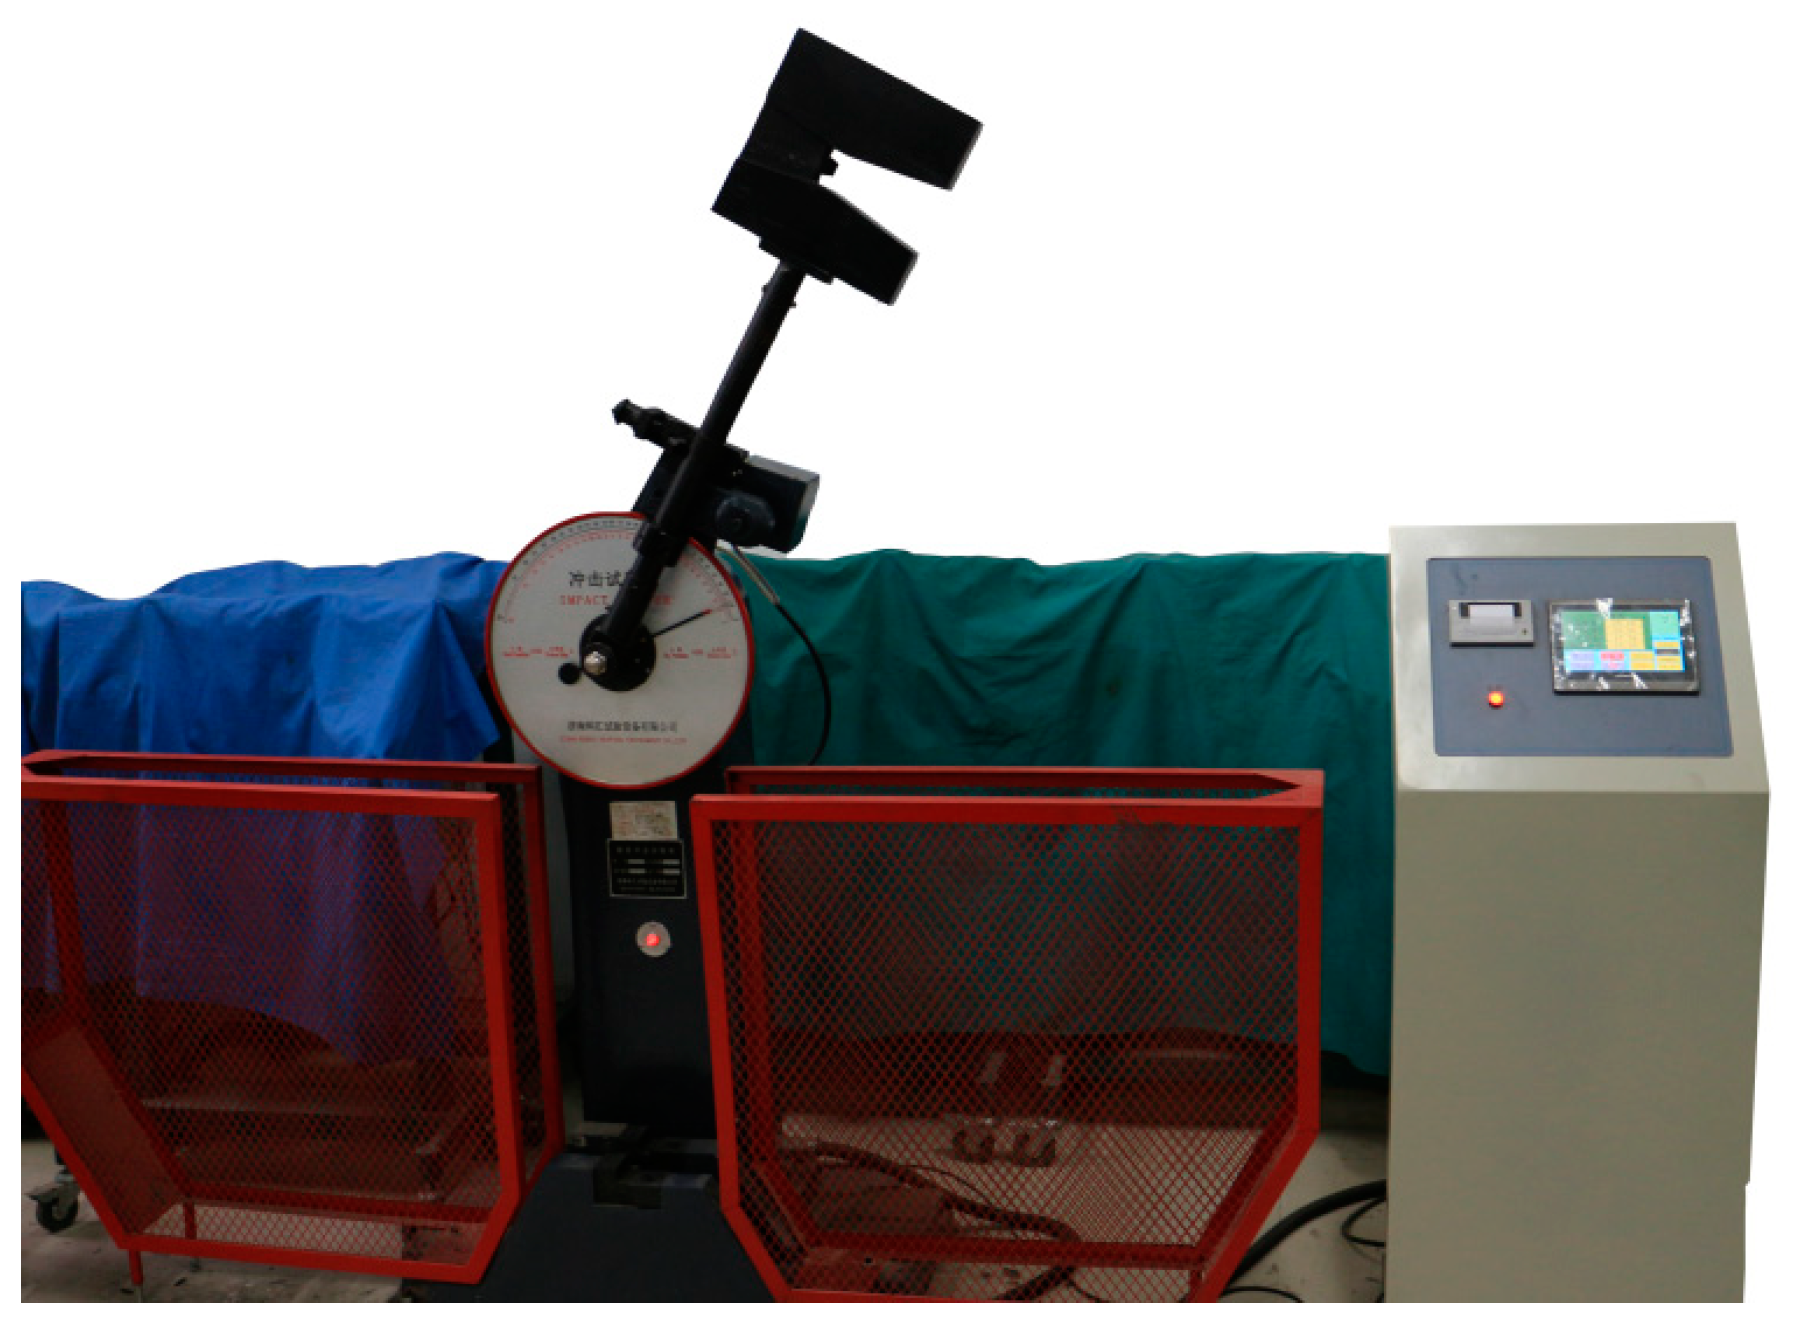
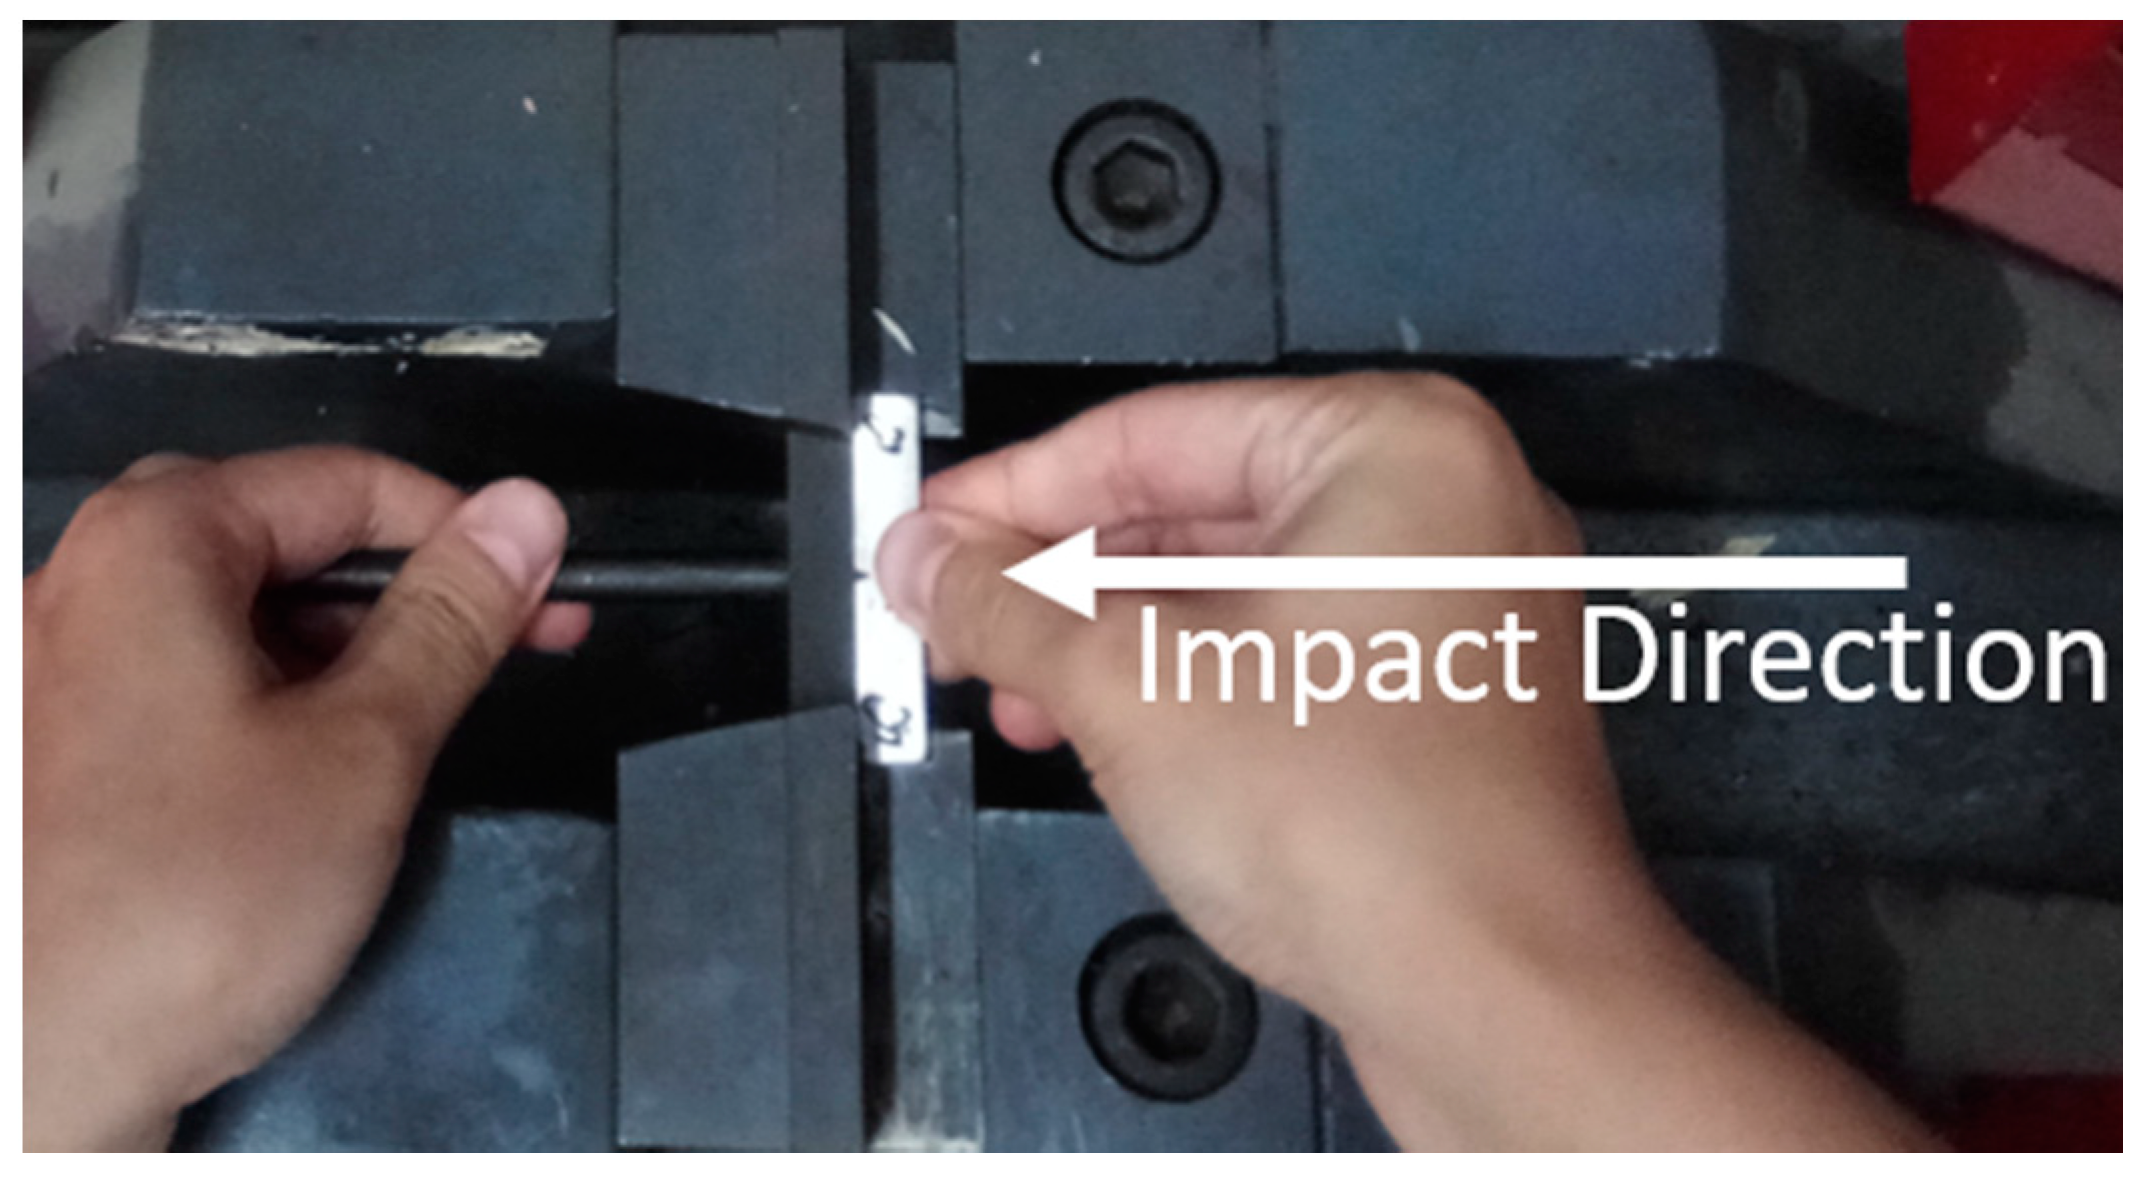
  25. ASTM E23: Standard Test Methods for Notched Bar Impact Testing of Metallic Materials; ASTM International: West Conshohocken, PA, USA, 2007.
  26. Davis, J. Metals Handbook, Desk, Edition, 2nd ed.; ASM International, The Materials Information Society: West Conshohocken, PA, USA, 1998; pp. 560–564. [Google Scholar]
  27. Arzt, E. Size effects in materials due to microstructural and dimensional constraints: a comparative review. Acta Mater. 1998, 46, 5611–5626. [Google Scholar] [CrossRef] [Green Version]
  28. Calcagnotto, M.; Adachi, Y.; Ponge, D.; Raabe, D. Deformation and fracture mechanisms in fine-and ultrafine-grained ferrite/martensite dual-phase steels and the effect of aging. Acta. Mater. 2011, 59, 658–670. [Google Scholar] [CrossRef]
  29. ASTM E112: Standard Test Methods for Determining Average Grain Size; ASTM International: West Conshohocken, PA, USA, 1996; pp. 4–20.
  30. Gharibshahiyan, E.; Raouf, A.H.; Parvin, N.; Rahimian, M. The effect of microstructure on hardness and toughness of low carbon welded steel using inert gas welding. Mater. Des. 2011, 32, 2042–2048. [Google Scholar] [CrossRef]
  31. Zhao, Y.; Tong, X.; Wei, X.; Xu, S.; Lan, S.; Wang, X.-L.; Zhang, Z. Effects of microstructure on crack resistance and low-temperature toughness of ultra-low carbon high strength steel. Int. J. Plast. 2019, 116, 203–215. [Google Scholar] [CrossRef]
  32. Thompson, S. Interrelationships between yield strength, low-temperature impact toughness, and microstructure in low-carbon, copper-precipitation-strengthened, high-strength low-alloy plate steels. Mater. Sci. Eng. A 2018, 711, 424–433. [Google Scholar] [CrossRef]
  33. Kocatepe, K.; Cerah, M.; Erdogan, M. The tensile fracture behaviour of intercritically annealed and quenched+ tempered ferritic ductile iron with dual matrix structure. Mater. Des. 2007, 28, 172–181. [Google Scholar] [CrossRef]
  34. Kysar, J.W. Energy dissipation mechanisms in ductile fracture. J. Mech. Phys. Solids 2003, 51, 795–824. [Google Scholar] [CrossRef]
  35. Das, A.; Viehrig, H.-W.; Altstadt, E.; Bergner, F.; Hoffmann, J. Why Do Secondary Cracks Preferentially Form in Hot-Rolled ODS Steels in Comparison with Hot-Extruded ODS Steels? Crystals 2018, 8, 306. [Google Scholar] [CrossRef]
  36. Chao, Y.J.; Ward Jr, J.; Sands, R.G. Charpy impact energy, fracture toughness and ductile-brittle transition temperature of dual-phase 590 Steel. Mater. Des. 2007, 28, 551–557. [Google Scholar] [CrossRef]
  37. Barsom, J.M.; Rolfe, S.T. Fracture and Fatigue Control in Structures: Applications of Fracture Mechanics; ASTM International: West Conshohocken, PA, USA, 1977; pp. 121–132. [Google Scholar]
Figure 1. (a) Schematic representation of the robot-assisted welded thin wall, highlighting important areas and the direction of specimen extraction. (b) An as-built wall with depiction of the steady stage from where samples were extracted for this study.
Metals 09 01208 g001
Figure 2. Charpy impact testing machine with a hammer having pre-lift angle of 150°.
Metals 09 01208 g002
Figure 3. Placement of sample and impact direction.
Metals 09 01208 g003
Figure 4. Absorbed impact energy in joules for horizontal and vertical specimens.
Metals 09 01208 g004
Figure 5. Microstructure attained by an optical microscope. (a) Intralayer microstructure with slightly more refined grains. Microstructure with a higher magnification for (b) intralayer and (c) interlayer grains.
Metals 09 01208 g005
Figure 6. Microstructure attained by an SEM with a slight difference in grain size for the (a) intralayer and (b) interlayer microstructure. Histogram of grain diameter for the (c) intralayer and (d) interlayer microstructure.
Metals 09 01208 g006
Figure 7. Brinell hardness for horizontal and vertical specimens.
Metals 09 01208 g007
Figure 8. Fractured sample after separation by joining the hinges (three views of the same sample).
Metals 09 01208 g008
Figure 9. (a) Multiple samples with identical fracture behavior. (b) SEM to show the twist in the deformed sample.
Metals 09 01208 g009
Figure 10. Normalized lateral expansion in percentage for the horizontal and vertical specimens.
Metals 09 01208 g010
Figure 11. Dimpled fracture surface with a fibrous tearing, showing it to be ductile. (a) Horizontal specimen, (b) vertical specimen.
Metals 09 01208 g011
Figure 12. XRD pattern.
Metals 09 01208 g012
Figure 13. (a) Macro-level secondary cracks, (b,c) micro-level secondary cracks, (d) enlarged view of secondary cracks.
Metals 09 01208 g013
Table 1. Typical chemical composition for electrode wire ER70S-6 (weight percentage).
ElementsCMnSiSPNiCrMoVCuFe
wt. %0.11.560.880.0120.0110.010.02<0.01<0.010.24Bal.
Table 2. Deposition parameters for the steady stage part of the layer.
ParametersCurrentVoltageWelding EnergyTravel Speed
Value (units)120 (A)19 (V)660 (J/mm)3.5 (mm/s)

