Article

The Nucleation and the Intrinsic Microstructure Evolution of Martensite from 332 113 β Twin Boundary in β Titanium: First-Principles Calculations

1
Shenyang National Laboratory for Materials Science, Institute of Metal Research, Chinese Academy of Sciences, Shenyang 110016, China
2
School of Materials Science and Engineering, University of Science and Technology of China, Shenyang 110016, China
*
Author to whom correspondence should be addressed.
Metals 2019, 9(11), 1202; https://doi.org/10.3390/met9111202
Submission received: 2 October 2019 / Revised: 1 November 2019 / Accepted: 4 November 2019 / Published: 7 November 2019

Abstract

:
A clear understanding on the inter-evolution behaviors between 332 113 β twinning and stress-induced martensite (SIM) α″ in β-Ti alloys is vital for improving its strength and ductility concurrently. As the preliminary step to better understand these complex behaviors, the nucleation and the intrinsic microstructure evolution of martensite α″ from 332 113 β twin boundary (TB) were investigated in pure β-Ti at atomic scale using first-principles calculations in this work. We found the α″ precipitation prefers to nucleate and grow at 332 113 β TB, with the transformation of 332 113 β TB→ 130 3 ¯ 10 α TB. During this process, α″ precipitation firstly nucleates at 332 113 β TB and, subsequently, it grows inwards toward the grain interiors. This easy transition may stem from the strong crystallographic correspondence between 332 113 β and 130 3 ¯ 10 α TBs, and the region close to the 332 113 β TB presents the characteristics of intermediate structure between β and α″ phases. Kinetics calculations indicate the α″ phase barrierlessly nucleates at 332 113 β TB rather than in grain interior, where there is higher critical driving energy. Our calculations provide a unique perspective on the “intrinsic” microstructure evolution of martensite α″ from 332 113 β TB, which may deepen our understanding on the precipitation of martensite α″ and the inter-evolution behaviors between 332 113 β twinning and martensite α″ in β-Ti alloys at atomic scale.

Graphical Abstract

1. Introduction

Metastable β-Ti alloys have some excellent properties, such as high strength, low density, and biocompatibility, which make them a promising material in aerospace and biomedical applications [1,2]. However, the lack of strain-hardening limits their use in advanced applications [3,4]. By controlling the stability of the β matrix through its chemical compositions, a strategy that triggers martensitic transformation and/or twinning under applied stress, termed transformation-induced plasticity (TRIP) and twinning-induced plasticity (TWIP), in β-Ti alloys has been developed to improve the strength and ductility concurrently [5,6,7,8,9]. It has been reported that the α″ and ω phases, 332 113 β and 112 111 β twins are the major deformation products during the process of TRIP/TWIP, which are clearly observed in a variety of β-Ti alloys [10,11,12]. Generally, α″ phases and 332 113 β twins are observed in a much larger volume fraction when the concentration of β-stabilizing element is low [13,14,15,16].
Sun et al. suggested that 332 113 β twinning and stress-induced martensite (SIM) α″ can be activated simultaneously from the onset of plasticity in a deformed Ti-12Mo (wt.%) alloy [13]. The volume fraction of both 332 113 β twin boundary (TB) and SIM α″ increases with strain. They further observed the activation of secondary 332 113 β twinning and secondary α″ precipitation within the primary 332 113 β TB. The identical phenomenon was also noted in the very recent study of Ti–10V–4Cr–1Al (wt.%) by Lilensten et al. [15]. However, Castany et al. suggested that the 332 113 β TB is not formed directly in the β phase, but is the result of the reversion of 130 3 ¯ 10 α parent twins occurring in SIM α″ phase under stress [14]. In their study of Ti–27Nb (at.%) alloy, the β phase transforms firstly into α″ martensite which subsequently occurs 130 3 ¯ 10 α twinning with increasing the applied strain; the α″ martensite transforms back to the β phase, thereby leading to the transformation of 130 3 ¯ 10 α to 332 113 β TB when the stress is released [14]. The similar 332 113 β twinning assisted by SIM α″ was also observed in other Ti–Nb-based alloys [17,18]. It is seen that the formation and activation sequences of 332 113 β TB and SIM α″ in Ti–Mo (V) and Ti–Nb alloys during TRIP/TWIP processes are very different, or even in contrast. In the minds of Castany et al., 332 113 β twinning is always formed from the reversion of 130 3 ¯ 10 α twins in superelastic alloys due to its less stability, and the SIM transformation of 130 3 ¯ 10 α twins still occurs but not in a reversible manner and leads to a TRIP effect when the β stability increases, and there is no more SIM transformation to initiate 332 113 β twinning in more stable β phase, making the classical 112 111 β twinning easier to form instead [14]. As a better β-stabilizer of Mo than Nb [19,20], it is expected that SIM α″ is more difficult to be formed in Ti–Mo than in Ti–Nb. However, it is the fact that SIM α″ was activated at the strain of 0.7% in Ti–12Mo (wt.%) alloy [13], while the SIM α″ was only found from 3% strain in Ti–27Nb (at.%) alloy which is superelastic [14].
It is seen that it is hard to reach a “universal mechanism” for the deformation product of 332 113 β TB and SIM α″ in β-Ti alloys, since the stability of β-Ti alloys is highly associated with the chemical compositions. The kind and concentration of the chemical elements largely dominate the specific mechanism of the deformation product of 332 113 β TB and SIM α″, and their activation sequence or inter-evolution behaviors. However, it is difficult to quantitatively reveal which and how the chemical elements control the formation behaviors of 332 113 β TB and SIM α″. As a preliminary step to better understand the complicated process of TRIP/TWIP, it is very important to uncover the “intrinsic” inter-evolution behaviors between 332 113 β TB and SIM α″, which is generally veiled by the complex effects of chemical compositions and external applied stress. In this work, we aim to unveil the “intrinsic” inter-evolution behaviors between 332 113 β TB and SIM α″ using a pure Ti model, which was chosen to eliminate the effects of chemical compositions, and to strive to describe the specific microstructure evolution from 332 113 β TB using the first-principles method. Though this work is strongly limited to pure Ti and the external applied stress is not considered, a unique perspective on the microstructure evolution of 332 113 β TB is provided at atomic scale, which is beyond the present experimental techniques.

2. Computational Methods and Model

2.1. Computational Methods

Our first-principles calculations were performed with the density functional theory (DFT), as implemented in the VASP code [21,22,23]. The electron exchange–correlation interactions were described with the generalized gradient approximation of Perdew, Burke, and Ernzerhof (PBE) [24], and ion–electron interactions were treated with the projector-augmented wave (PAW) method [25], together with the plane wave basis set with a kinetic energy cutoff of 350 eV. During our calculations, all the degrees of atomic freedom (ions, cell volume, and shape) were relaxed using the conjugate gradient algorithm, with the convergence criteria for energy and force being 10−6 eV atom−1 and 0.01 eV Å−1, respectively. The results obtained with the conjugate gradient algorithm were further examined and confirmed with the quasi-Newton algorithm and the generalized solid-state nudged elastic band (G-SSNEB) method [26] using similar convergence criteria.

2.2. 332 113 β Twin Boundary Model

A grain boundary structure can be described as a combination of structural units in two dimensions [27]. Thus, the 332 113 β TB model was constructed using the structural unit model [28,29] in our calculations, and the corresponding structural units were denoted with ‘A’ (2-atom structural unit, blue region) and ‘C’ (4-atom structural unit, green region) in Figure 1a,b. Note that the ‘A’ unit simply describes the lattice of bcc crystal along 0 2 ¯ 3 direction projected on 1 1 ¯ 0 plane, and the ‘C’ unit describes a tetrahedron projected on 1 1 ¯ 0 plane. Our 332 113 β TB model is consistent with the model used in other literatures [30,31]. The three lattice vectors of the bi-crystal model, 332 113 β TB, 1 1 ¯ 0 β , 11 3 ¯ β , and 332 β , were orientated in parallel with the x, y, and z axis, respectively, and periodic boundary conditions were applied in the three directions. The dimensions of the bi-crystal model were 4.59 × 5.39 × 50.66 Å, as listed in Table 1, with the Г-centered Monkhorst-Pack [32,33] k-points grid of 11 × 9 × 1 used in the calculations. As shown in Figure 1a, the bi-crystal model adopted a “sandwich” configuration containing two identical 332 113 β TBs positioned at the middle and the boundary of the model. In this case, the periodical TBs were separated by 34 atom planes in 332 β direction, with the distance about 25 Å. This distance was within the reasonable range between two TBs, which ensured the convergence of interfacial energy in other studies of TB in α-Ti [34,35]. Our tests also show that this distance can afford the convergent interface energy within the error of ~5 mJ/m2. Thus, the interactions between the two TBs could be ignored and the final result was converged at such large distance in our work.
It is well known that pure β-Ti is unstable at 0 K under ambient pressure [36]. Therefore, the bi-crystal model containing 332 113 β TB prefers to relax into the configuration with the lower energy directly, and the initial and optimal 332 113 β TB cannot be obtained by direct relaxation. To eliminate any artificial influences during the modeling process as much as possible, the constructed 332 113 β TB structure was optimized using static calculation method with the same convergence criteria mentioned above before full relaxation. Firstly, the interatomic distance dA between the atom ‘0a’ and ‘0b’ was changed by moving the atom ‘0b’ along y axis, as shown in Figure 1b. The total energy is functioned with dA, and it is minimum when dA = 1.87 Å, as the black line shown in Figure 1c. Thus, the optimal interatomic distance dA was 1.87 Å. Secondly, the 332 113 β TB structure was further optimized by changing the interplanar spacing between the TB plane and its first neighboring atom plane with the interval of δ = 0.05 Å when dA was set to 1.87 Å. This optimization was applied on both sides of the TB simultaneously, d1 = d1 = 2d + δ, where d is the interplanar spacing of (332) plane in bulk. The total energy as a function of δ is also illustrated in Figure 1c. As indicated by the blue line, the total energy is minimum when δ = −0.15 Å. Correspondingly, the optimal interplanar spacing is d1 = d1 = 1.24 Å. Then, the optimized structure of 332 113 β TB was used in following calculations.
In our calculations, the interface energy of interface P1/P2 for the two phases P1 and P2 was calculated as the following equation:
γ I T = E t o t a l n E P 1 m E P 2 S ,
where Etotal is the total energy of the supercell model containing interface P1/P2, n and m are the atom numbers of the phase P1 and P2 in the model, EP1 and EP2 are the energy per atom of the phase P1 and P2 in bulk state, respectively, and S is the interface area. For the calculation of TB, Equation (1) becomes as follows, since it consists of two same phases:
γ T B = E t o t a l n E P 2 S ,
where the factor 2 accounts for the two identical TBs in the model.

3. Results and Discussions
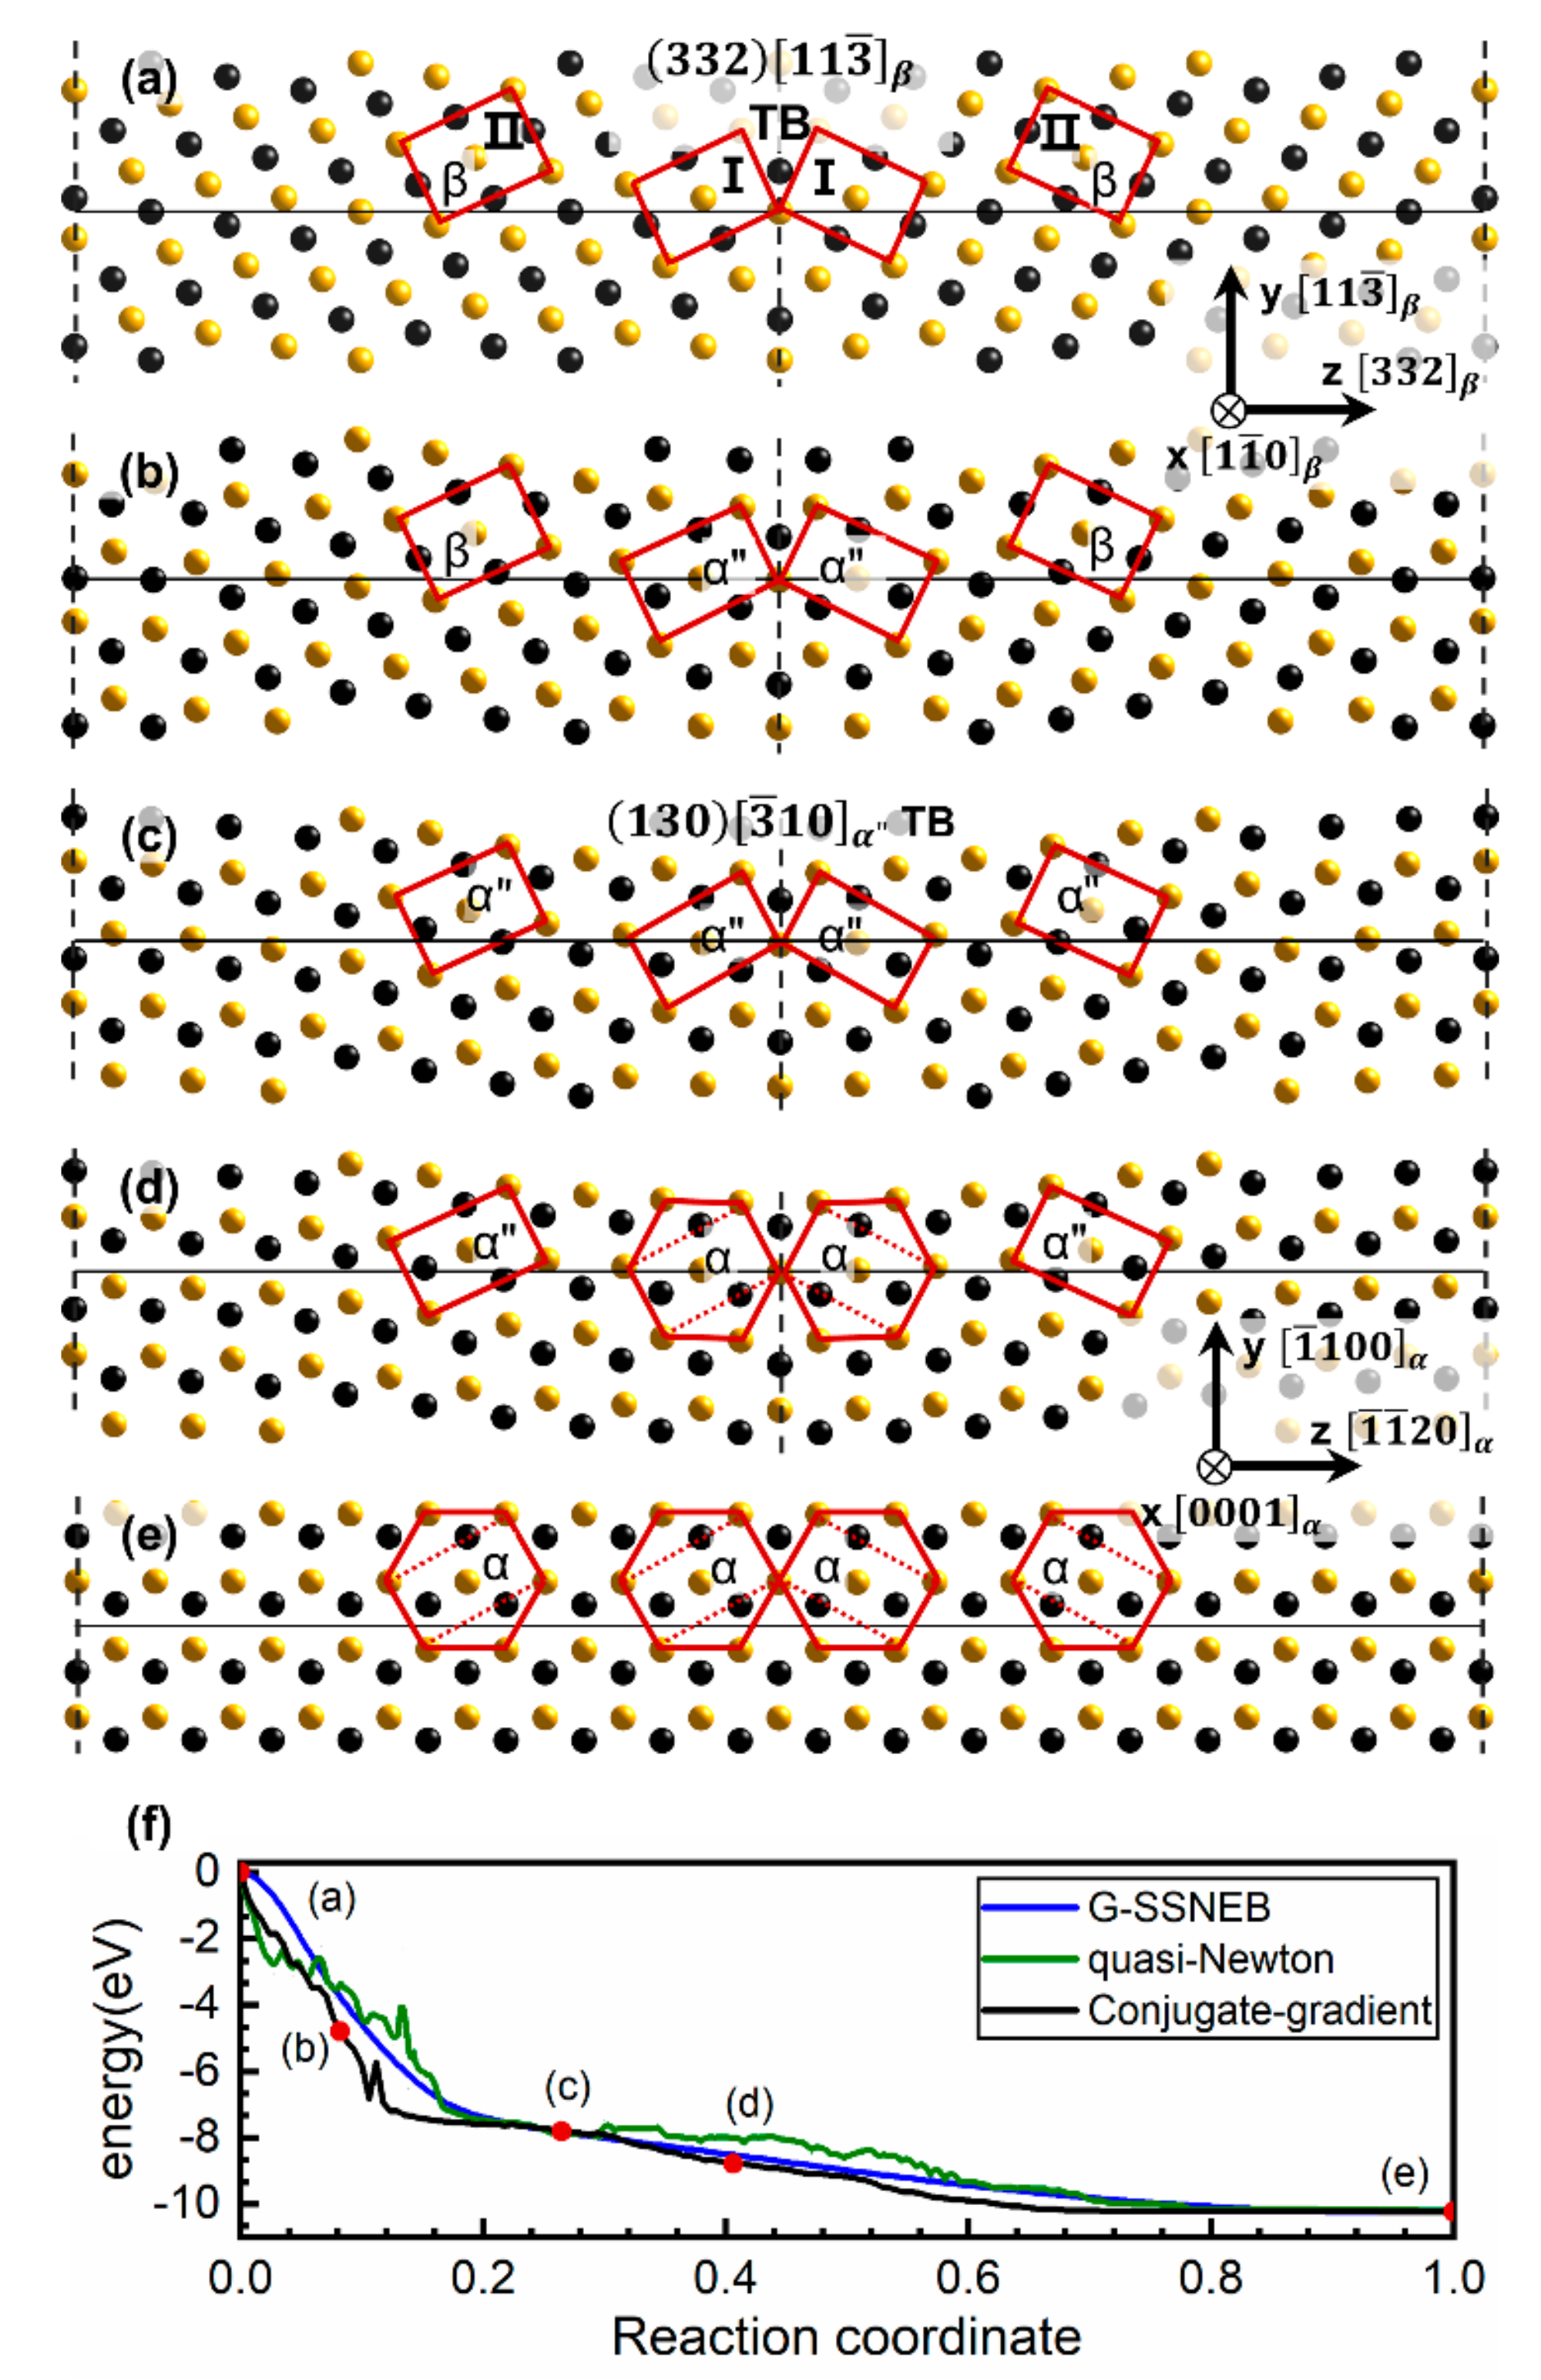
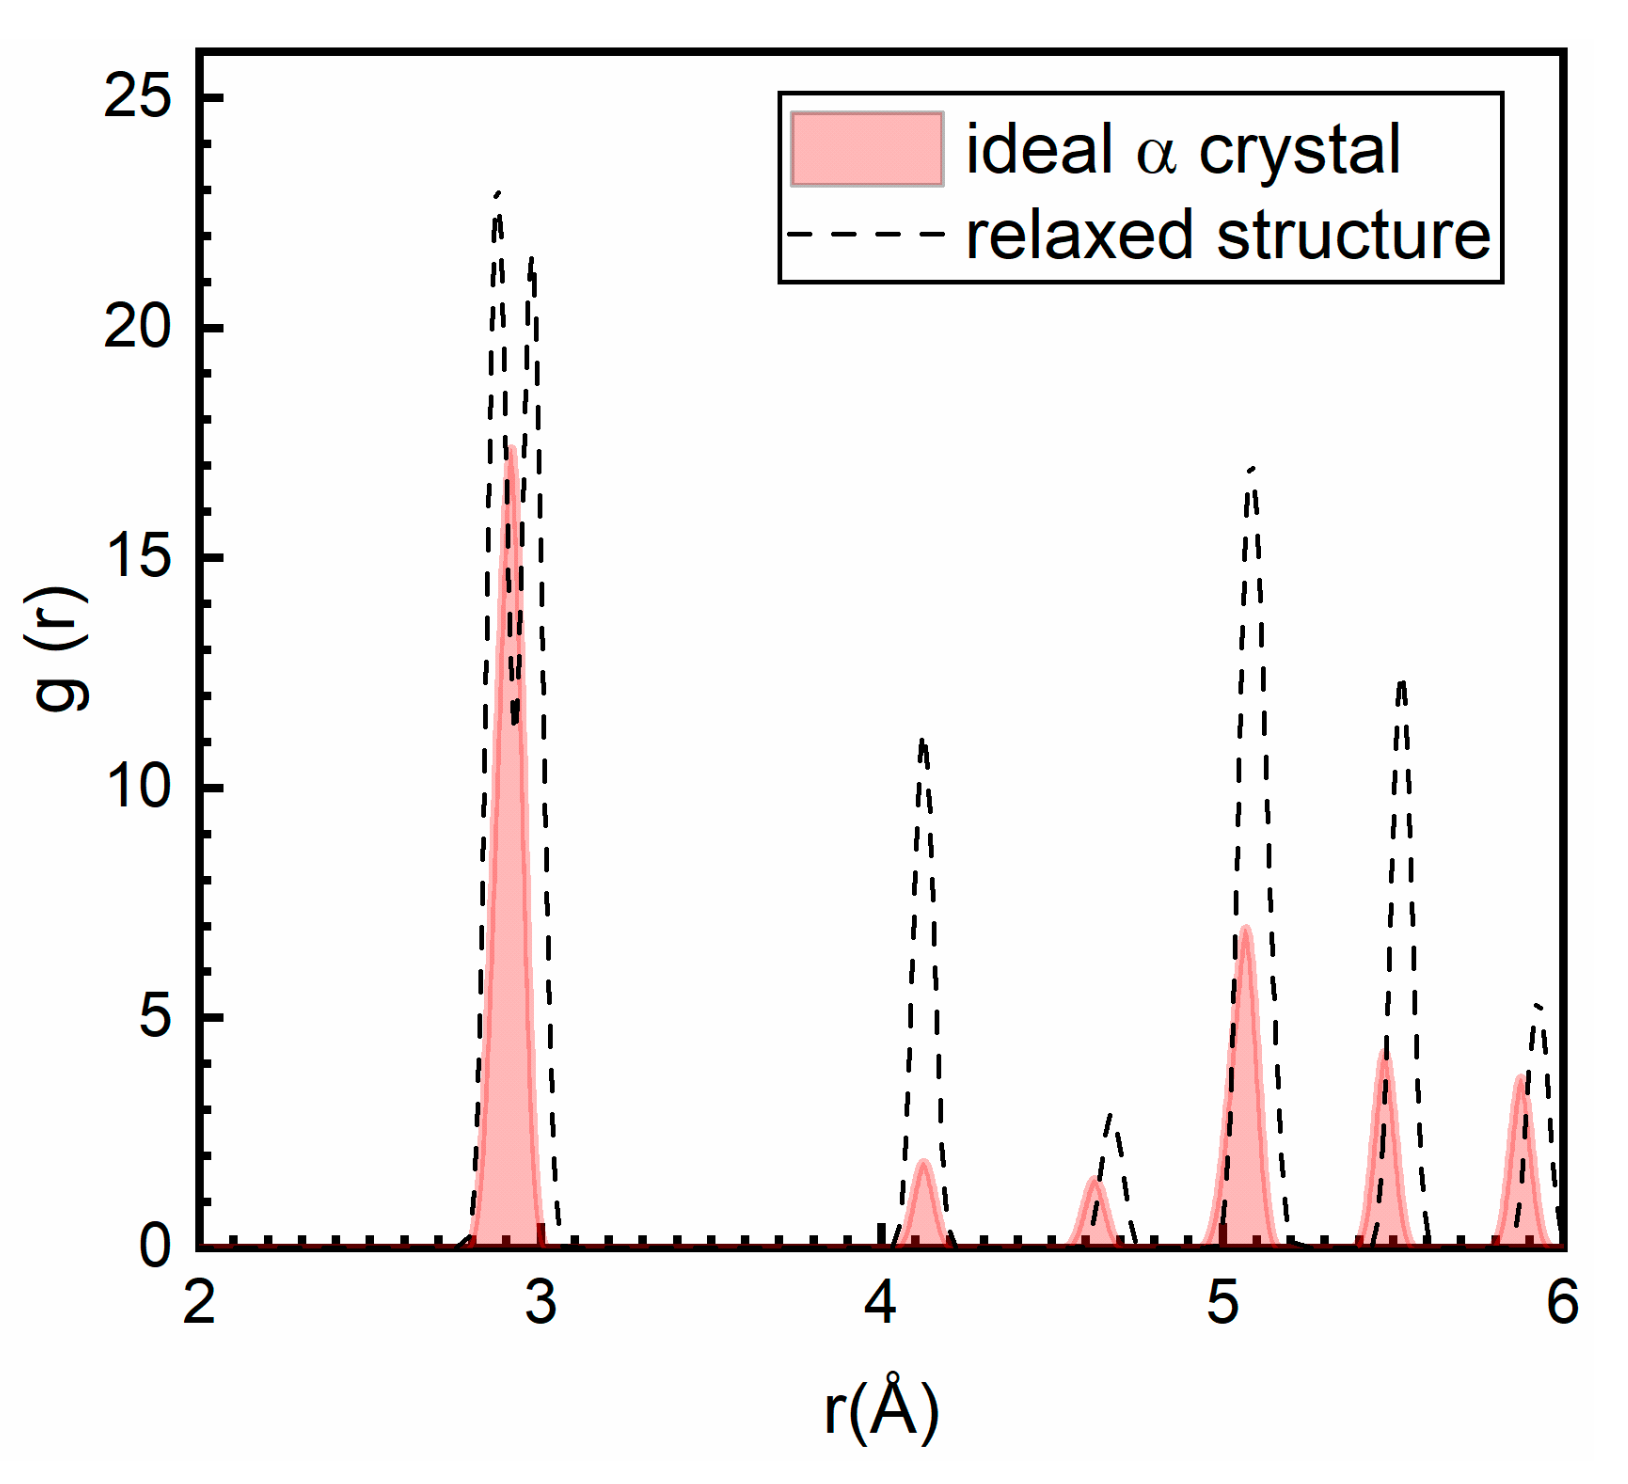
3.1. The Intrinsic Evolution from 332 113 β TB to α Phase

It should be noted that pure β-Ti is statically metastable (or dynamically unstable) in DFT simulation at 0 K [37,38]. Therefore, it sounds illogical to study the microstructure evolution of 332 113 β TB in pure β-Ti from the black side view when the issue is divided into two sides. However, from the white side view, its static metastability indicates that β-Ti can naturally evolve into lower energy state along the gradient route of energy landscape once slight perturbation is introduced. Therefore, its static metastability can help us uncover the “intrinsic” microstructure evolution of 332 113 β TB at atomic scale when it is introduced. As shown in Figure 2, it can be found that the initial β phase containing 332 113 β TB (Figure 2a) experiences significant changes in structure, and finally relaxes into α phase (Figure 2e). There is no interface in the final relaxed structure. The lattice parameters of the relaxed unit-cell are a = 2.93 Å and c = 4.65 Å, which is in agreement with the measurements of hcp α phase [39], as listed in Table 2. Furthermore, the relaxed structure was further analyzed using radial distribution function g(r), as illustrated in Figure 3. It can be found that the g(r) of the relaxed structure is well consistent with that of the ideal α phase. It demonstrates that the final relaxed structure shown in Figure 2e is identical to the ideal α phase. Though it is thermodynamically expected that the metastable β-Ti prefers to relax into the stable α phase when any slightly perturbation is introduced, the evolution from 332 113 β TB to the flawless α phase in our calculations implies the probability of α precipitation at 332 113 β TB in β-Ti.
To clearly show the microstructure evolution during this transformation, we analyzed the relaxation processes and determined a series of intermediate transition configurations representing the transformation sequence, as shown in Figure 2b–d. With the assistance of unit-cell I and II outlined by the red lines in Figure 2a, these transition configurations can provide the local structure changes in details, especially for the displacement sequence of atoms in different regions, close to and far away from 332 113 β TB. In comparison with the initial structure, one can observe the noticeable atoms displacements in the vicinity of 332 113 β TB, which leads to the visible changes of unit-cell I, as shown in Figure 2b. The changed unit-cell I presents the characteristic of α″ phase, which is base-centered orthorhombic (Cmcm) structure with atomic positions of (0, 0, 0), (1/2, 1/2, 0), (0, y, 0), and (0, 1/2+y, 1/2) in the unit-cell. The basal shuffle, y, changes with the different alloying element and composition [41]. In our work, the lattice parameters of α″ phase are a = 3.08 Å, b = 4.60 Å, c = 4.85 Å, and y = 0.13 in Wyckoff position, which is in agreement with the measurements of α″ phase, as listed in Table 2. It should be noted that α″ phase is unstable in pure Ti. The α″ phase here is just a snapshot of transition structure presenting the characteristic of α″ phase to show the important intermediate transition state during the relaxation process. Additionally, the unchanged unit-cell II indicates that the atoms far away from the TB remain immobile at the same time. This suggests that the transformation firstly takes place at both sides of the 332 113 β TB, resulting in the formation of α″ embryos. As the continuation of this transformation, the α″ embryos grow inwards toward the grain interiors, and then the grains transform from β into α″ phase, and finally result in the formation of 130 3 ¯ 10 α TB, as shown in Figure 2c. Subsequently, the α embryos form at both sides of the 130 3 ¯ 10 α TB, as shown in Figure 2d, whereas the α″ phase in grain interiors has yet to undergo transformation. As the transformation proceeding, the α embryos spread toward the grain interiors. Finally, the 130 3 ¯ 10 α TB disappears, and the β phase containing 332 113 β TB completely transforms into α phase, as shown in Figure 2e. In addition, the abovementioned microstructure evolution was further examined and confirmed using the quasi-Newton algorithm and the G-SSNEB method. The identical microstructure evolution can also be observed in the calculations performed with the quasi-Newton algorithm and the G-SSNEB method. The energy profiles obtained by the conjugate gradient algorithm, quasi-Newton algorithm, and the G-SSNEB method are very similar, as shown in Figure 2f. This indicates that this microstructure evolution described by the conjugate gradient algorithm is reliable.

3.2. The Different Displacements of Atoms Close to and Far Away from 332 113 β TB

Actually, the local microstructure evolutions at the TB and grain interior are somewhat different, which results in a different formation process of α phase at TB and in grain interior. To explicitly elaborate this difference, we tracked the atoms displacements in unit-cell I and II, and illustrated them in Figure 4. As shown in Figure 4a, the formation process of α phase at 332 113 β TB involves two steps: The atoms (blue circle) initially go through shuffle to the sites of green circles, forming α″ phase; subsequently, the atoms shift from green circles to orange ones, forming α phase. During this process, the shifts of atoms 1, 3, 5, and 7 to atoms 1″, 3″, 5″, and 7″ result in the contraction and expansion of lattices along 001 β and 1 ¯ 1 ¯ 0 β directions, respectively.
Different from the formation of α phase at 332 113 β TB, the changes of unit-cell II indicate that the formation process of α phase in grain interior can be divided into three steps, as shown in Figure 4b. The first two steps associated with the formation of α″ phase: The initial atoms (blue circles) shift to the sites of lavender circles, driving the formation of distorted α″ phase; the atoms (lavender circles) then move to the green ones, forming α″ phase. Subsequently, the atoms (green circles) shift to the sites of orange circles, and the α″ phase converts into α phase. During the entire transformation, the lattices of β phase (plotted by atoms 13, 15, 17, and 19) experiences contraction and expansion along 001 β and 1 ¯ 1 ¯ 0 β directions, respectively. Meanwhile, the atoms 12, 14, 16, and 18 go through shuffle to atoms 12″, 14″, 16″, and 18″, forming the final α phase. The orientation relationships of β and α″ phases are 1 1 ¯ 0 β / / 001 α , 00 1 ¯ β / / 100 α , 110 β / / 010 α , in agreement with other literature [42].

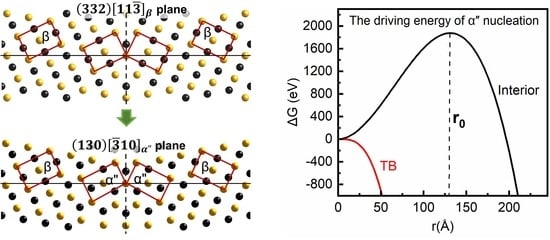
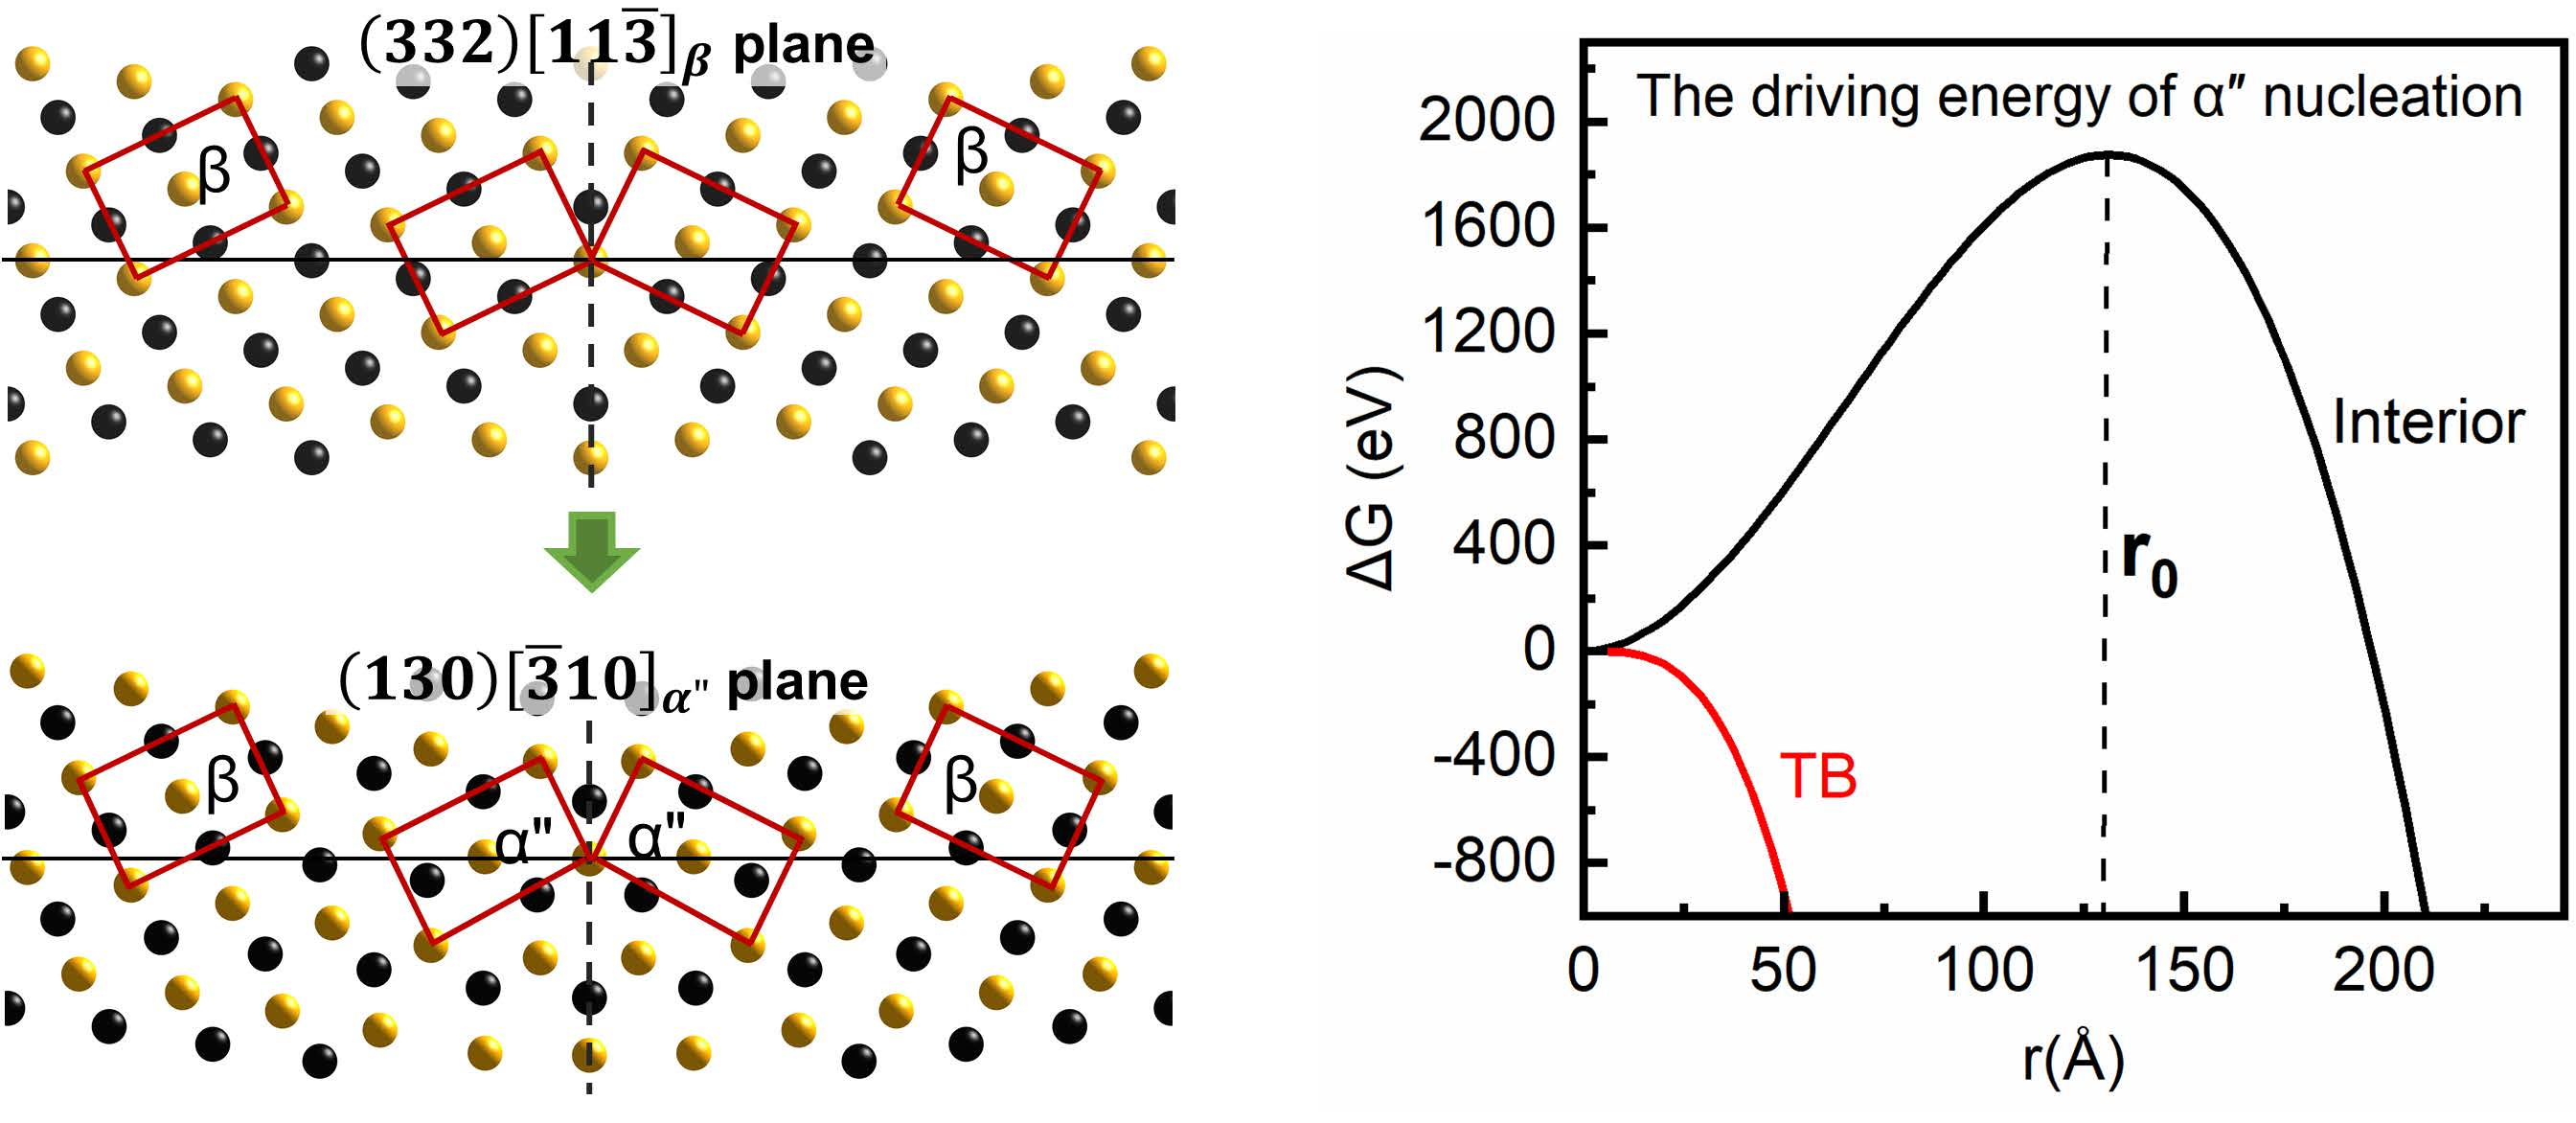
3.3. The Nucleation and Structure Evolution of Martensite from Crystallographic Perspective

Our calculations uncover the intrinsic microstructure evolution of 332 113 β TB to 130 3 ¯ 10 α TB. This easy transition may stem from the strong crystallographic correspondence between 332 113 β and 130 3 ¯ 10 α TBs, as demonstrated by Bertrand et al. in the study of Ti–25Ta–20Nb alloys [43]. Under applied stress, the precipitation of α″ martensite at 332 113 β TB in β-Ti alloys has been observed in many experiments [13,15,44]. In our calculations, the complicated synergy effects of β-stabilizing elements and applied stress were fully eliminated. Thus, it is not reasonable to directly compare our results to these experiments. However, our calculations show that the nucleation and growth of α″ precipitation at 332 113 β TB is feasible. Based on this, it is reasonable to infer that the applied stress inducing the α″ precipitation within 332 113 β TB may partly play the role of facilitating the displacing of atoms to overcome the transition barrier of β→α″ at 332 113 β TB in β-Ti alloys. Here, our calculations provide a unique perspective on the microstructure evolution and martensite precipitation at 332 113 β TB, which can be used to better understand the experimental observed α″ precipitation at 332 113 β TB.
In our calculations, the formation of martensite is, in fact, induced by the higher interface energy of 332 113 β TB, rather than applied stress, and driven by the energy difference between β and α″ phases. As the calculated energies listed in Table 1 and Table 2 (the interface energies were calculated using supercell model with lattice parameters listed in Table 1), the interface energy difference between 130 3 ¯ 10 α and 332 113 β TBs is about −700 mJ m−2, and the energy difference between α″ and β phases is about −0.09 eV atom−1. Additionally, one can note that the α″ phase can be formed by shifting the black atoms of β phase along the arrow collectively, as shown in Figure 5c. It is clearly seen that the displacements of black atoms in the vicinity of 332 113 β TB are small compared with that in β phase. The radial distribution function (RDF) analysis further shows that 332 113 β TB presents the structural characteristics between β and α″ phases, as displayed in Figure 5d, which indicates that the unit-cell in the vicinity of 332 113 β TB can be considered as an intermediate structure between β and α″ phases. Therefore, the nucleation of α″ phase at 332 113 β TB is not only more favorable in energy, but also in crystallographic structure than its nucleation directly in β grain interior.

3.4. The Nucleation and Structure Evolution of Martensite from Kinetic Calculations

The nucleation of α″ precipitation at 332 113 β TB can also be further demonstrated within the framework of classical nucleation theory [45], by evaluating its nucleation driving energy and critical nucleation radius. Classical nucleation theory suggests that the nucleation of a new second phase is driven by volumetric energy reduction due to phase transformation, at the energy expense of creating new interphase interfaces. The driving energy (ΔG) for the formation of the new second phase can be expressed as:
Δ G = v Δ G v + Σ S γ ,
where v is volume of the new phase, ΔGv is the free energy change per unit volume between the new and the parent phases, and ΣSγ accounts for all interface energy contributions. In Equation (3), the strain energy can be incorporated into the interface energy owing to interface commensuration [46]. As the schematic shown in Figure 6a, the total driving energy for the nucleation scenario of α″ at 332 113 β TB can be expressed as:
Δ G 1 = v Δ G v 332 β α + S 1 + S 2 γ 110 β / / 001 α + S 1 γ 130 α γ 332 β = 1 8 π r 3 Δ G v 332 β α + 5 4 π r 2 γ 110 β / / 001 α + π r 2 γ 130 α γ 332 β ,
where Δ G v 332 β α is the energy change due to the nucleation of α″ at TB, which is evaluated from the energy difference between the instant structure firstly presenting α″ phase at TB and the optimized 332 113 β TB; and S1 and S2 are the areas of top/bottom and side surface of α″ phase, respectively. Here, we suppose that the α″ embryo takes a thin plate shape with the aspect ratio of h = 1/8r, where h is the thickness and r is the radius of the thin plate, since α″ phase is generally observed in plate shape [47]. The thickness of α″ plate is so small that we treat γ 110 β / / 001 α as the side interface energy between α″ plate and β matrix, based on the orientation relationship of 110 β / / 001 α determined in experiments [48,49]. The last term of Equation (4) accounts for the formation of 130 3 ¯ 10 α TB from 332 113 β TB. For the α″ nucleation in β grain interior, its driving energy can be expressed as:
Δ G 2 = v Δ G v β α + S γ 110 β / / 001 α = 1 8 π r 3 Δ G v β α + 9 4 π r 2 γ 110 β / / 001 α .
Based on the energies listed in Table 1 and Table 2, the driving energies of α″ nucleation at 332 113 β TB and in β grain interior were evaluated and are shown in Figure 6b. Note that the formation of α″ phase at 332 113 β TB is almost barrierless. However, there is an evident energy barrier of ~1900 eV for the formation of α″ plate with the critical radius ( r 0 ) of ~130 Å and the thickness of ~16 Å in β grain interior. This indicates that only the α″ embryo with radius larger than r 0 can continue to grow up, otherwise it tends to disappear.
Though the applied stress was not considered in our calculations, to some extent, this result can help us understand the reason why α″ phase is easy to find when 332 113 β TB exists in the experiments [13,15,50]. In the experimental study of Ti–Mo (wt.%) alloy, it is evidently shown that the volume fraction of α″ phase from parent 332 113 β TB is much higher than that of α″ phase directly formed in β grain interior [13]. Based on our calculations, this higher volume fraction of α″ phase from parent 332 113 β TB may be well understood since the α″ precipitation prefers to nucleate and grow at 332 113 β TB rather than in β grain interior under the same external applied stress. It should be noted that the nucleation of martensite and its corresponding microstructure evolution from 332 113 β TB in our calculations are not universal but intrinsic, and the exact evolution process may be strongly dependent on the specific β-stabilizers. How the kind and concentration of β-stabilizers affect the inter-evolution between 332 113 β TB and α″ phase will be further investigated in our following studies.

4. Conclusions

In conclusion, our first-principles calculations show that pure β-Ti containing 332 113 β TB has a tendency of transforming into α″ phase. In this process, the martensite firstly nucleates at 332 113 β TB, accompanying the transformation of 332 113 β into 130 3 ¯ 10 α TB, and it subsequently grows inwards toward the grain interiors. The 332 113 β TB presents the characteristics of intermediate configuration between β and α″ phases from the perspective of crystallography. The kinetic calculations show that α″ phase prefers to nucleate at 332 113 β TB and then grow inwards toward grain interiors barrierlessly, rather than in β grain interior. In this case, the critical driving energy of α″ phase nucleation in β grain interior is estimated up to ~1900 eV, with the critical radius of ~130 Å. This study provides a detailed description of the martensite nucleation and its intrinsic microstructure evolution from 332 113 β TB at atomic scale from a unique perspective, which may deepen our understanding on the precipitation of SIM α″ phase within the 332 113 β TB in β-Ti alloys. As a preliminary step, it also contributes to better understanding on the inter-evolution behaviors between 332 113 β twinning and SIM α″ and further study on the complicated process of TRIP/TWIP.

Author Contributions

Conceptualization, Q.-J.C. and S.-Y.M.; formal analysis, S.-Y.M.; funding acquisition, S.-Q.W.; investigation, Q.-J.C.; methodology, Q.-J.C. and S.-Y.M.; project administration, S.-Q.W.; supervision, S.-Q.W.; validation, Q.-J.C. and S.-Y.M.; writing—original draft, Q.-J.C.; writing—review and editing, S.-Y.M.

Funding

This work was funded by the National Key R&D Program of China, grant number 2016YFB0701302, and the CAS Frontier Science Research Project, grant numbers QYZDJ-SSW-JSC015 and QYZDY-SSW-JSC027.

Acknowledgments

This work was supported by the National Key R&D Program of China (No. 2016YFB0701302) and the CAS Frontier Science Research Project (No. QYZDJ-SSW-JSC015, QYZDY-SSW-JSC027). The authors thank the computational support from the Special Program for Applied Research on Super Computation of the NSFC-Guangdong Joint Fund (the second phase) under Grant No.U1501501. Most of the calculations in this study were done on the Tianhe-II high performance computer system in the National Supercomputer Center in Guangzhou, China.

Conflicts of Interest

The authors declare no conflicts of interest.

References

  1. Niinomi, M. Recent research and development in titanium alloys for biomedical applications and healthcare goods. Sci. Technol. Adv. Mater. 2003, 4, 445–454. [Google Scholar] [CrossRef] [Green Version]
  2. Banerjee, D.; Williams, J.C. Perspectives on Titanium Science and Technology. Acta Mater. 2013, 61, 844–879. [Google Scholar] [CrossRef]
  3. Weiss, I.; Semiatin, S.L. Thermomechanical processing of beta titanium alloys—An overview. Mater. Sci. Eng. A 1998, 243, 46–65. [Google Scholar] [CrossRef]
  4. Williams, J.C.; Starke, E.A. Progress in structural materials for aerospace systems11The Golden Jubilee Issue—Selected topics in Materials Science and Engineering: Past, Present and Future, edited by S. Suresh. Acta Mater. 2003, 51, 5775–5799. [Google Scholar] [CrossRef]
  5. Grosdidier, T.; Philippe, M.J. Deformation induced martensite and superelasticity in a β-metastable titanium alloy. Mater. Sci. Eng. A 2000, 291, 218–223. [Google Scholar] [CrossRef]
  6. Min, X.H.; Tsuzaki, K.; Emura, S.; Tsuchiya, K. Enhancement of uniform elongation in high strength Ti–Mo based alloys by combination of deformation modes. Mater. Sci. Eng. A 2011, 528, 4569–4578. [Google Scholar] [CrossRef]
  7. Marteleur, M.; Sun, F.; Gloriant, T.; Vermaut, P.; Jacques, P.J.; Prima, F. On the design of new β-metastable titanium alloys with improved work hardening rate thanks to simultaneous TRIP and TWIP effects. Scr. Mater. 2012, 66, 749–752. [Google Scholar] [CrossRef]
  8. Ahmed, M.; Wexler, D.; Casillas, G.; Savvakin, D.G.; Pereloma, E.V. Strain rate dependence of deformation-induced transformation and twinning in a metastable titanium alloy. Acta Mater. 2016, 104, 190–200. [Google Scholar] [CrossRef]
  9. Gao, J.; Huang, Y.; Guan, D.; Knowles, A.J.; Ma, L.; Dye, D.; Rainforth, W.M. Deformation mechanisms in a metastable beta titanium twinning induced plasticity alloy with high yield strength and high strain hardening rate. Acta Mater. 2018, 152, 301–314. [Google Scholar] [CrossRef]
  10. Sun, F.; Zhang, J.Y.; Marteleur, M.; Brozek, C.; Rauch, E.F.; Veron, M.; Vermaut, P.; Jacques, P.J.; Prima, F. A new titanium alloy with a combination of high strength, high strain hardening and improved ductility. Scripta Mater. 2015, 94, 17–20. [Google Scholar] [CrossRef]
  11. Ahmed, M.; Gazder, A.A.; Saleh, A.A.; Wexler, D.; Pereloma, E.V. Stress-Induced Twinning and Phase Transformations during the Compression of a Ti-10V-3Fe-3Al Alloy. Metall. Mater. Trans. A 2017, 48, 2791–2800. [Google Scholar] [CrossRef]
  12. Zhang, J.Y.; Li, J.S.; Chen, Z.; Meng, Q.K.; Sun, F.; Shen, B.L. Microstructural evolution of a ductile metastable β titanium alloy with combined TRIP/TWIP effects. J. Alloys Compd. 2017, 699, 775–782. [Google Scholar] [CrossRef]
  13. Sun, F.; Zhang, J.Y.; Marteleur, M.; Gloriant, T.; Vermaut, P.; Laillé, D.; Castany, P.; Curfs, C.; Jacques, P.J.; Prima, F. Investigation of early stage deformation mechanisms in a metastable β titanium alloy showing combined twinning-induced plasticity and transformation-induced plasticity effects. Acta Mater. 2013, 61, 6406–6417. [Google Scholar] [CrossRef]
  14. Castany, P.; Yang, Y.; Bertrand, E.; Gloriant, T. Reversion of a Parent {130} 〈310〉 α″ Martensitic Twinning System at the Origin of {332} 〈113〉 β Twins Observed in Metastable β Titanium Alloys. Phys. Rev. Lett. 2016, 117, 245501. [Google Scholar] [CrossRef]
  15. Lilensten, L.; Danard, Y.; Brozek, C.; Mantri, S.; Castany, P.; Gloriant, T.; Vermaut, P.; Sun, F.; Banerjee, R.; Prima, F. On the heterogeneous nature of deformation in a strain-transformable beta metastable Ti-V-Cr-Al alloy. Acta Mater. 2019, 162, 268–276. [Google Scholar] [CrossRef]
  16. Ahmed, M.; Wexler, D.; Casillas, G.; Ivasishin, O.M.; Pereloma, E.V. The influence of beta phase stability on deformation mode and compressive mechanical properties of Ti-10V-3Fe-3Al alloy. Acta Mater. 2015, 84, 124–135. [Google Scholar] [CrossRef]
  17. Chen, B.; Sun, W. Transitional structure of {332}β twin boundary in a deformed metastable β-type Ti-Nb-based alloy, revealed by atomic resolution electron microscopy. Scr. Mater. 2018, 150, 115–119. [Google Scholar] [CrossRef]
  18. Lai, M.J.; Tasan, C.C.; Raabe, D. On the mechanism of {332} twinning in metastable β titanium alloys. Acta Mater. 2016, 111, 173–186. [Google Scholar] [CrossRef]
  19. Raabe, D.; Sander, B.; Friak, M.; Ma, D.; Neugebauer, J. Theory-guided bottom-up design of beta-titanium alloys as biomaterials based on first principles calculations: Theory and experiments. Acta Mater. 2007, 55, 4475–4487. [Google Scholar] [CrossRef]
  20. Zhou, W.C.; Sahara, R.; Tsuchiya, K. First-principles study of the phase stability and elastic properties of Ti-X alloys (X = Mo, Nb, Al, Sn, Zr, Fe, Co, and O). J. Alloys Compd. 2017, 727, 579–595. [Google Scholar] [CrossRef]
  21. Kresse, G.; Hafner, J. Ab initio molecular-dynamics simulation of the liquid-metal--amorphous-semiconductor transition in germanium. Phys. Rev. B 1994, 49, 14251–14269. [Google Scholar] [CrossRef] [PubMed]
  22. Kresse, G.; Furthmüller, J. Efficient iterative schemes for ab initio total-energy calculations using a plane-wave basis set. Phys. Rev. B 1996, 54, 11169–11186. [Google Scholar] [CrossRef] [PubMed]
  23. Kresse, G.; Furthmuller, J. Efficiency of ab-initio total energy calculations for metals and semiconductors using a plane-wave basis set. Comput. Mater. Sci. 1996, 6, 15–50. [Google Scholar] [CrossRef]
  24. Perdew, J.P.; Burke, K.; Ernzerhof, M. Generalized Gradient Approximation Made Simple. Phys. Rev. Lett. 1996, 77, 3865–3868. [Google Scholar] [CrossRef] [Green Version]
  25. Kresse, G.; Joubert, D. From ultrasoft pseudopotentials to the projector augmented-wave method. Phys. Rev. B 1999, 59, 1758–1775. [Google Scholar] [CrossRef]
  26. Sheppard, D.; Xiao, P.; Chemelewski, W.; Johnson, D.D.; Henkelman, G. A generalized solid-state nudged elastic band method. J. Chem. Phys. 2012, 136, 074103. [Google Scholar] [CrossRef]
  27. Han, J.; Vitek, V.; Srolovitz, D.J. The grain-boundary structural unit model redux. Acta Mater. 2017, 133, 186–199. [Google Scholar] [CrossRef]
  28. Sutton, A.P.; Vitek, V. On the structure of tilt grain boundaries in cubic metals I. Symmetrical tilt boundaries. Philos. Trans. R. Soc. A-Math. Phys. Eng. 1983, 309, 1–36. [Google Scholar] [CrossRef]
  29. Tschopp, M.A.; Solanki, K.N.; Gao, F.; Sun, X.; Khaleel, M.A.; Horstemeyer, M.F. Probing grain boundary sink strength at the nanoscale: Energetics and length scales of vacancy and interstitial absorption by grain boundaries in alpha-Fe. Phys. Rev. B 2012, 85, 064108. [Google Scholar] [CrossRef]
  30. Bhattacharya, S.K.; Tanaka, S.; Shiihara, Y.; Kohyama, M. Ab initio study of symmetrical tilt grain boundaries in bcc Fe: Structural units, magnetic moments, interfacial bonding, local energy and local stress. J. Phys. Condens. Matter 2013, 25, 135004. [Google Scholar] [CrossRef]
  31. Hahn, E.N.; Fensin, S.J.; Germann, T.C.; Meyers, M.A. Symmetric tilt boundaries in body-centered cubic tantalum. Scr. Mater. 2016, 116, 108–111. [Google Scholar] [CrossRef] [Green Version]
  32. Monkhorst, H.J.; Pack, J.D. Special points for Brillouin-zone integrations. Phys. Rev. B 1976, 13, 5188–5192. [Google Scholar] [CrossRef]
  33. Pack, J.D.; Monkhorst, H.J. “Special points for Brillouin-zone integrations”—A reply. Phys. Rev. B 1977, 16, 1748–1749. [Google Scholar] [CrossRef]
  34. Joost, W.J.; Ankem, S.; Kuklja, M.M. Interaction between oxygen interstitials and deformation twins in alpha-titanium. Acta Mater. 2016, 105, 44–51. [Google Scholar] [CrossRef] [Green Version]
  35. Kumar, A.; Wang, J.; Tome, C.N. First-principles study of energy and atomic solubility of twinning-associated boundaries in hexagonal metals. Acta Mater. 2015, 85, 144–154. [Google Scholar] [CrossRef] [Green Version]
  36. Mei, Z.-G.; Shang, S.-L.; Wang, Y.; Liu, Z.-K. Density-functional study of the thermodynamic properties and the pressure--temperature phase diagram of Ti. Phys. Rev. B 2009, 80, 104116. [Google Scholar] [CrossRef]
  37. Persson, K.; Ekman, M.; Ozolins, V. Phonon instabilities in bcc Sc, Ti, La, and Hf. Phys. Rev. B 2000, 61, 11221–11224. [Google Scholar] [CrossRef] [Green Version]
  38. Grimvall, G.; Magyari-Kope, B.; Ozolins, V.; Persson, K.A. Lattice instabilities in metallic elements. Rev. Mod. Phys. 2012, 84, 945–986. [Google Scholar] [CrossRef] [Green Version]
  39. Vohra, Y.K.; Spencer, P.T. Novel gamma-phase of titanium metal at megabar pressures. Phys. Rev. Lett. 2001, 86, 3068–3071. [Google Scholar] [CrossRef]
  40. Zimmermann, F.; Humbert, M. Determination of the habit plane characteristics in the β–α′ phase transformation induced by stress in Ti–5Al–2Sn–4Zr–4Mo–2Cr–1Fe. Acta Mater. 2002, 50, 1735–1740. [Google Scholar] [CrossRef]
  41. Li, C.-X.; Luo, H.-B.; Hu, Q.-M.; Yang, R.; Yin, F.-X.; Umezawa, O.; Vitos, L. Lattice parameters and relative stability of α″ phase in binary titanium alloys from first-principles calculations. Solid State Commun. 2013, 159, 70–75. [Google Scholar] [CrossRef]
  42. Kim, H.Y.; Ikehara, Y.; Kim, J.I.; Hosoda, H.; Miyazaki, S. Martensitic transformation, shape memory effect and superelasticity of Ti–Nb binary alloys. Acta Mater. 2006, 54, 2419–2429. [Google Scholar] [CrossRef]
  43. Bertrand, E.; Castany, P.; Yang, Y.; Menou, E.; Gloriant, T. Deformation twinning in the full-α″ martensitic Ti–25Ta–20Nb shape memory alloy. Acta Mater. 2016, 105, 94–103. [Google Scholar] [CrossRef]
  44. Mantri, S.A.; Sun, F.; Choudhuri, D.; Alam, T.; Gwalani, B.; Prima, F.; Banerjee, R. Deformation Induced Hierarchical Twinning Coupled with Omega Transformation in a Metastable β-Ti Alloy. Sci. Rep. 2019, 9, 1334. [Google Scholar] [CrossRef] [PubMed]
  45. Drossinos, Y.; Kevrekidis, P.G. Classical nucleation theory revisited. Phys. Rev. E 2003, 67, 026127. [Google Scholar] [CrossRef] [PubMed]
  46. Li, D.; Wan, W.; Zhu, L.; Jiang, Y.; Shao, S.; Yang, G.; Liu, H.; Yi, D.; Cao, S.; Hu, Q. Experimental and DFT characterization of interphase boundaries in titanium and the implications for ω-assisted α phase precipitation. Acta Mater. 2018, 151, 406–415. [Google Scholar] [CrossRef]
  47. Yin, J.O.; Chen, G.; Zhao, S.Y.; Ge, Y.; Li, Z.F.; Yang, P.J.; Han, W.Z.; Wang, J.; Tang, H.P.; Cao, P. Microstructural characterization and properties of Ti-28Ta at.% powders produced by plasma rotating electrode process. J. Alloys Compd. 2017, 713, 222–228. [Google Scholar] [CrossRef]
  48. Frutos, E.; Karlík, M.; Jiménez, J.A.; Langhansová, H.; Lieskovská, J.; Polcar, T. Development of new β/α″-Ti-Nb-Zr biocompatible coating with low Young’s modulus and high toughness for medical applications. Mater. Des. 2018, 142, 44–55. [Google Scholar] [CrossRef]
  49. Yao, T.; Du, K.; Wang, H.; Huang, Z.; Li, C.; Li, L.; Hao, Y.; Yang, R.; Ye, H. In situ scanning and transmission electron microscopy investigation on plastic deformation in a metastable β titanium alloy. Acta Mater. 2017, 133, 21–29. [Google Scholar] [CrossRef]
  50. Furuhara, T.; Nakamori, H.; Maki, T. Crystallography of α Phase Precipitated on Dislocations and Deformation Twin Boundaries in a β Titanium Alloy. Mater. Trans. JIM 1992, 33, 585–595. [Google Scholar] [CrossRef]
Figure 1. (a,b) The 1 × 2 × 1 initial configuration of 332 113 β twin boundary (TB) projected on 1 1 ¯ 0 plane. Yellow and black spheres represent the atoms at the adjacent 1 1 ¯ 0 planes. Black dashed line denotes grain boundary plane, d is the interplanar spacing of 332 plane in bulk. ‘1’ and ‘−1’ denote the atomic planes. (c) The energy of the bi-crystal model as a function of d A and δ .
Metals 09 01202 g001
Figure 2. The intrinsic microstructure evolution of martensite (α″ and α) from 332 113 β TB through the initial (a), intermediate (bd), and the final (e) atomic configurations. The energy profiles obtained by the algorithms of the conjugate gradient, quasi-Newton, and G-SSNEB are shown in (f) for comparison. Yellow and black spheres represent the atoms in the adjacent 1 1 ¯ 0 β and 0001 α planes, respectively. The unit-cells are outlined by the red lines.
Metals 09 01202 g002
Figure 3. The radial distribution functions of ideal α crystal and the final relaxed structure.
Metals 09 01202 g003
Figure 4. Schematic illustration of α phase formation process projected on the 1 1 ¯ 0 β plane at 332 113 β TB (a) and grain interior (b), using the two unit-cell I and II shown in Figure 1a. Blue and orange circles denote the initial and final structures, respectively. Green and lavender circles denote the intermediate structures. All the atomic displacements refer to the original atom 0a (a) and 11 (b).
Metals 09 01202 g004
Figure 5. The illustration of α″ formation through atom collective displacements. The local atomic configurations of 332 113 β TB (a), β and α″ (b). (c) The displacements of atoms projected on the 1 1 ¯ 0 β plane for the formation of α″ phase in β phase and at 332 113 β TB. (d) The radial distribution functions of β phase, the local region of 332 113 β TB and α″ phase.
Metals 09 01202 g005
Figure 6. The kinetic behaviors of α″ formation at the TB and in β grain interior. (a) The schematic of the different nucleation sites for α″ phase at 332 113 β TB and in β grain interior. (b) The driving energy curves associated with the formation of α″ phase at 332 113 β TB and in β grain interior.
Metals 09 01202 g006
Table 1. The lattice parameters of various interface models used in this work and the corresponding interface energies.
InterfacesLattice Parameters (Å)Interface Energy (mJ/m2)
abc
332 113 β 4.595.3950.66777.38
130 3 ¯ 10 α 4.5910.6237.4576.71
110 β / / 001 α 3.154.5937.93740.04
Table 2. The lattice parameters and energies of various Ti phases.
PhasesLattice Parameters (Å)Energy (eV/atom)
abc
β3.25 −7.69
3.32 [2]
α″3.084.604.85−7.78
2.94 [40]4.63 [40]5.01 [40]
α2.93 4.65−7.80
2.96 [39] 4.69 [39]

