Article

Large-Scale Molecular Dynamics Simulations of Homogeneous Nucleation of Pure Aluminium

1
Manufacturing Theme, Cranfield University, Cranfield MK430AL, UK
2
Department of Mechanical Aerospace and Engineering, University of Strathclyde, Glasgow G1 1XJ, UK
*
Author to whom correspondence should be addressed.
Metals 2019, 9(11), 1217; https://doi.org/10.3390/met9111217
Submission received: 26 September 2019 / Revised: 7 November 2019 / Accepted: 8 November 2019 / Published: 12 November 2019

Abstract

:
Despite the continuous and remarkable development of experimental techniques for the investigation of microstructures and the growth of nuclei during the solidification of metals, there are still unknown territories around this topic. The solidification in nanoscale can be effectively investigated by means of molecular dynamics (MD) simulations which can provide a deep insight into the mechanisms of the formation of nuclei and the induced crystal structures. In this study, MD simulations were performed to investigate the solidification of pure Aluminium and the effects of the cooling rate on the final properties of the solidified material. A large number of Aluminium atoms were used in order to investigate the grain growth over time and the formation of stacking faults during solidification. The number of face-centred cubic (FCC), hexagonal close-packed (HCP) and body-centred cubic (BCC) was recorded during the evolution of the process to illustrate the nanoscale mechanisms initiating solidification. The current investigation also focuses on the exothermic nature of the solidification process which has been effectively captured by means of MD simulations using 3 dimensional representations of the kinetic energy across the simulation domain.

1. Introduction

The dependence of the mechanical properties of crystalline materials on their grain structure has been known since the early 1950s, when Hall and Petch proposed a relationship connecting the yield strength to the grain size [1,2]. Therefore, the manufacturing process selected (casting, heat treatment, welding) as well as the corresponding process parameters (e.g., cooling rate) play an important role in the final properties of the manufactured material. This is because the micro- and nano-structure of metals is dependent on the phase transformation phenomena occurring during solidification and nucleation. As reported in previous studies, nucleation can be classified into homogeneous and heterogeneous [3]. The first one occurs when nuclei form and grow within the liquid phase of the metal while the latter one involves the existence of a nucleating agent (e.g., a cold wall), providing a lower energy barrier for the formation of the solid phase. The real time observation and interpretation of the phenomena occurring during solidification in the bulk material still remains a challenging task [4].
The classical nucleation theory (CNT) proposed by Vomer and Weber [5], was the first theoretical approach used for studying homogeneous nucleation of droplets from vapour. Later on, it was extended to solidification processes. According to the CNT, when the more stable phase is formed, it is separated from the surrounding and less stable one by a thin and sharp interface. CNT states that there are 2 competing phenomena controlling the evolution of the phase change process. Taking solidification as an example, the first phenomenon is that the solid phase is more energetically favourable than the liquid phase. However, phase change is also associated with an additional energy penalty associated with the formation of the grain boundary interface (surface energy). As a result, there is a critical value of the nucleus radius (rc) which determines whether a nucleus will shrink (r < rc) or grow (r > rc). CNT has been widely applied to vapour-liquid systems over the last two decades and the predicted nucleation rates are in agreement with experimental studies [6,7]. However, the nucleation in liquid-solid systems follows more complex paths and CNT fails to capture the nature and evolution of the nucleation process [8]. This is attributed to the fact that according to CNT, nucleation can commence at any point within the melt with equal probability, whereas in reality the melt is not spatially uniform. In fact, there are variations in local order parameters [9].
The shortcomings of CNT and the experimental challenges encountered when observing nucleation in liquid-solid systems led to the development of numerical models for investigating these phenomena. One of the most common computational quantum methods employed for investigating nucleation is the density functional theory (DFT) which has been employed by researchers to investigate nucleation [10]. However, DFT calculations are mostly focused on electronic structure calculations and are limited to some hundreds of atoms [11]. Mesoscale methods such as the cellular automata [12], Monte Carlo [13] and phase-field models [14] have also been employed for the investigation of crystal growth. However, these methods rely on constitutive equations and ab initio assumptions while atomistic detail is averaged out.
The molecular dynamics simulations method has been increasingly and effectively employed for modelling manufacturing processes, including nanocutting [15,16], indentation [17] and laser ablation [18], in nanoscale. This method can effectively bridge the gap between DFT scales and micro/mesoscale as the interaction between atoms is modelled using interatomic potentials and no ab initio assumptions are made. This is the reason for the extensive application of this technique for studying the nuclei formation. The first molecular dynamics (MD) simulations on nucleation contained just a few thousands of atoms [19,20]. However, according to [21], large-scale MD simulations should be performed in order to reproduce solidified geometries which are independent of the size of the simulation domain. Large-scale MD simulations have been performed by Mahata et al. [22] who investigated the crystal structure of nuclei and determined the critical nucleus size, critical temperature and nucleation rate in pure Aluminium. The effect of the cooling rate on the solidified structure was investigated by Hou et al. [23] via large scale MD simulations. They suggested that amorphous structures can be obtained for cooling rates in the order of 10 K/ps. Moreover, they found that icosahedral (ICO) structures can be dominant in the liquid and solid phases depending on the adopted cooling rate. The largest scale MD simulation ever reported was performed by Shibuta et al. [24]. They performed a 1 billion-atom MD simulation of homogeneous nucleation and observed the formation of grains. They suggested that grains with a twin boundary can be formed by heterogeneous nucleation; the surface of previously formed grains can act as a nucleating agent. Moreover, the authors proposed a local heterogeneity model according to which satellite-like grains are formed in the vicinity of previously formed grains.
In this investigation, large-scale MD simulations were performed to study the nucleation of pure Al. The number and size of grains as well as the evolution of various atom structures (face-centred cubic (FCC), hexagonal close-packed (HCP) and ICO) have been recorded over the evolution of nucleation. However, the novelty of this investigation lies on the drawn 3 dimensional kinetic energy contours which reveal the release of the latent heat of fusion in the vicinity of the formed grains during phase change. According to the authors’ best knowledge, this is the first MD investigation capturing this phenomenon.

2. Simulation Methodology

The simulation domain is a 25 × 25 × 25 nm3 rectangular box containing 1,000,188 Aluminium atoms initially arranged in a FCC lattice. The interactions between the Aluminium atoms were modelled using the Finnis-Sinclair (FS) potential [25] which has been widely implemented in previous MD studies [26,27]. The advantage of the FS potentials compared to classical interatomic ones, such as Lennard Jones (LJ), lies on the fact that they can capture the local density dependence of atomic interactions. According to the FS formalism, the total energy of a system consisting of N atoms is given by:
E t o t = 1 2 i = 1 N j = 1 N V i j r i j A i = 1 N ρ i
where V i j is the potential energy for the pair i j , r i j the interatomic distance between atoms i and j and ρ i the local electronic charge in the vicinity of atom i given by:
ρ i = j = 1 ,   i j N φ i j r i j
In Equation (2), φ i j r i j is the atomic charge density:
φ i j r i j = r i j d 2 + β r i j d 3 d r i j d 0 r i j > d
The potential energy is estimated as follows:
V i j r i j = r i j c 2 c 0 + c 1 r i j + c 2 r i j 2 r i j c 0 r i j > c
In Equations (1)–(4), A is the binding energy, c , d are the cutoff distances, c i are constants used for fitting the potential to experimental data and β a parameter defining the maximum value of the atomic charge density within the nearest-neighbour distance.
The Al melt was prepared starting from a FCC crystal, initially equilibrated at 273 K and isothermally annealed to 1173 K. The melt was equilibrated at 1173 K for 20,000 timesteps and subsequently quenched under 5 different cooling rates, ranging from 0.5 to 12 K/ps with a 2 fs timestep. All of the simulations were performed using the NPT (isothermal-isobaric) ensemble while a Nose-Hoover thermostat and barostat were applied to control the temperature and the pressure respectively. The temperature and pressure damping parameters were set equal to 100 and 1000 timesteps (0.2 and 2 ps) respectively. The simulation parameters are summarised in Table 1.
In order to investigate the local structure of the atoms in various timesteps, the radial distribution function (RDF) was employed which can be calculated as follows:
g r = V N 2 i i j δ r r i j
where N and V are the number of atoms and the volume of the system, respectively. The delta function δ r r i j is equal to 1 if the separation distance r r i j is in the range r Δ r / 2 , r + Δ r / 2 and equal to 0 in every other case. As a result, the term i j δ r r i j is equal to the number of particles lying within a sphere cell with the atom i at its centre, having a radius equal to r and a thickness equal to Δ r .
Over the years, homogeneous nucleation has been conceived as a process which occurs stochastically in the melt and requires supercooling, while supersaturation has been considered to be the driving force of nucleation. Nucleation starts with the formation of mini particles in the melt which are also called “embryos”. It is generally considered that embryos are formed due to fluctuations in the local melt density and atomic configurations [28]. Recent advances in classical density functional theory (cDFT) have shed light on the mechanisms driving the formation of embryos and suggest that crystallisation commences from high concentration droplets which subsequently densify and gradually obtain a crystal structure as they grow [29]. Similar to the cDFT method, the results of molecular dynamics simulations depend only on the interatomic potential selected. Thus, growth kinetics and dynamics are inherently captured. However, as it is shown in the results section, during phase change the potential energy of the Al atoms decreases sharply (increases in magnitude). This is accompanied by the formation of the first nuclei (grains) which subsequently grow. In order to obtain a clear understanding of the growth kinetics and dynamics, the potential and kinetic energy distribution over the simulation domain was monitored and the corresponding 3-dimensional profiles were drawn. In order to achieve high accuracy as well as spatial resolution in the obtained 3d profiles, the per atom potential and kinetic energy were estimated and averaged over discrete time windows, as it is further elaborated in the Results section. This time averaging strategy was used to eliminate the high noise produced by per atom quantities.
The MD simulations of this study have been performed using the LAMMPS Molecular Dynamics simulator [30]. The OVITO software [31] along with the integrated modifiers and in-house post-processing scripts were used for visualising the simulation domain and monitoring the nucleation process by identifying and tracking crystalline structures over the course of solidification process. The identification of the various atom types (FCC, BCC, HCP, ICO and AMO) was performed using the common neighbour analysis (CNA) modifier of OVITO. This algorithm has been designed for the characterisation of the local atomic structure based on the identification of structural ordering in the vicinity of pairs of atoms in terms of common neighbours [32]. The identification of the grains was also performed with the help of the cluster analysis modifier embedded in the OVITO software. This algorithm decomposes a system of particles into subsystems (clusters) based on a distance criterion. More specifically, all of the atom types with the exception of the FCC type were deleted. Subsequently, the remaining FCC atoms were categorised into clusters and the grains were identified.

3. Results and Discussion

In this section, the effects of the cooling rate on the structural properties, nucleation and kinetic energy distribution over the simulation domain is discussed. The obtained results are both qualitatively and quantitatively presented. Since the average simulation domain temperature is a linear function of time (i.e., the cooling rate is constant), dynamic quantities such as the potential energy and the mean square displacement (MSD) is plotted as a function of temperature. This is a convenient way of associating abrupt changes in the obtained graph trends with specific values of temperature. Moreover, plotting against temperature instead of time allows for the comparison of the aforementioned properties between simulations with different cooling rates and consequently, a variable number of timesteps. It should be clarified that the direction of time in the simulation with respect to the plots against temperature is leftwards (quenching). Finally, the temperature variable on the x-axes of the temperature plots refers to the average simulation domain temperature at the current timestep.

3.1. Structural Properties

The nucleation process during quenching with a cooling rate of 0.5 K/ps can be visualised in Figure 1. It can be seen that the initial structure corresponds to the liquid phase, while FCC nuclei start to form during the evolution of the process. By the time the temperature of the simulation domain reaches 507 K, solidification seems to be completed. Grains occupy almost the entire simulation domain, while grain boundaries, which consist mainly of amorphous atoms and hcp solidification defects can be clearly visualised.
In order to obtain a clear look at the atom type transformations during solidification, the population of each atom type was plotted over the domain temperature for various cooling rates (Figure 2). The obtained results present similar trends with [23]. It is evident that in most cases, the FCC and HCP atoms are significantly more than the body-centred cubic (BCC) and icosahedral (ICO) atoms, especially for slow cooling rates. This is because slow cooling rates favour the formation of grains and consequently the more stable FCC/HCP phases. However, the obtained results indicate that in the commencement of nucleation, there are more BCC than FCC atoms for all the cooling rates under examination. Thus, it is concluded that Al atoms pass through the BCC metastable phase and consequently undergo a transition to the FCC/HCP phase as reported by previous investigations. This in accordance with the observations of Stranksi and Totomanow [33] who suggested that the phase with the lowest free energy barrier is the one first formed. Similar observations have been made by Rein ten Wolde et al. [34] and Lü et al. [35].
In Figure 2a, it can be observed that the population of the FCC clusters starts increasing sharply at a temperature about equal to 580 K. The increase rate is apparently dependent on the cooling rate; lower cooling rates lead to a sharp increase of the FCC atoms as well as to a higher final number of FCC atoms. On the contrary, supercooling leads to a smoother increase and fewer FCC atoms in the solid phase. One of the reasons contributing to the decrease of the final number of the FCC atoms for higher cooling rates is that supercooling promotes the formation of amorphous solids [23]. However, as it is shown in the following paragraphs, higher cooling rates promote the formation of more grains within the simulation domain. This in turn leads to an increased number of amorphous grain boundary atoms, increased number of amorphous atoms and fewer FCC atoms.
The evolution of the HCP atoms population with temperature (Figure 2b) follows a similar trend with the FCC atoms. However, it seems that for cooling rates in the range of 0.5–2 K/ps, the number of HCP atoms increases while the opposite trend is observed for higher cooling rates. This is because of the superposition of two conflicting phenomena: Higher cooling rates introduce more stacking faults but on the other hand, they also promote the formation of the amorphous phase instead of the FCC/HCP one.
Figure 2c suggests that the icosahedral short range order (ISRO) is already present in the undercooled melt before the first grains start to form and it becomes more pronounced during cooling [36]. The number of ICO atoms starts to reduce as the FCC phase becomes dominant because, as previously formed grains grow, the ICO atoms transform to FCC and HCP ones. For high cooling rates (4–12 K/ps), ICO structures can also be encountered in the solid phase, because atoms get rapidly immobilised.
As shown in Figure 2d, as the temperature decreases, the number of BCC atoms increases sharply when nucleation starts due to the formation of the crystalline phase. As is shown later on, the number of the BCC atoms is strongly associated with the nuclei formation and growth. This is because of the fact that the BCC phase is formed prior the FCC/HCP phases. Thus, the number of BCC atoms is proportional to the nucleation rate as well as to the area of the liquid-solid interface.
In order to investigate the local structure of atoms, the radial distribution function (RDF) was plotted as a function of distance for various cooling rates and for 4 different values of temperature (Figure 3). The obtained RDFs are in a good agreement with the results of Hou et al. [23]. It can be observed that as the melt cools down, the peaks in the RDF profiles become more pronounced. This enhanced ordering is due to the densification during solidification. Moreover, it can be observed that during cooling, some additional peaks emerge in between the initial ones, which indicate the formation of new crystals. As expected, all of the peaks observed in the RDF profiles, including the sub-peaks, are more pronounced for slower cooling rates, which in contrast to higher ones, promote the FCC/HCP phase formation, as discussed above. It has also been observed that all of the peaks, with the exception of the first one are shifted leftwards, due to the shrinkage induced during solidification.
Figure 4 illustrates the per atom normalised potential energy as a function of temperature which is similar to the results presented in previous studies [22,23,37]. For all cooling rates under examination, potential energy appears to drop linearly with temperature during quenching, up to the point of T 580 K , where a step downwards can be identified. This step is indicative of the commencement of crystallisation and is steeper for slower cooling rates; i.e., solidification takes place within narrower temperature ranges for lower cooling rates. Moreover, it can be observed that the potential energy at the end of cooling (273 K) is always lower for slower cooling rates. This is in accordance with the results presented in Figure 2a indicating that the FCC phase, being the most energy favourable for Aluminium, is more dominant for low cooling rates.
In order to visualise the local evolution of the potential energy distribution over the simulation domain, the per-atom potential energy over time windows of N t s / 50 timesteps was calculated, where N t s is the total number of timesteps of each simulation corresponding to a specific cooling rate. As illustrated in Figure 5, the potential energy distribution across the simulation domain is not uniform. As expected, the per-atom potential energy is much lower in the region of the grains, which consist of the energetically favourable FCC/HCP phases and higher in the melt region. It can be observed that the amorphous structure in the solidified material grain boundaries has also higher potential energy compared to the grains. Due to the averaging process, the recently formed grains and the growth direction can be identified by the light blue atoms surrounding the growing grains (Figure 5a). Thus, it can be concluded that grains tend to grow as spheres in all directions, unless there are any neighbouring grains which may act as constraints.

3.2. Nucleation

The nucleation process is illustrated in Figure 6 (see also Supplementary Materials). It starts from small nuclei which subsequently grow in size as sphere-like grains once their size has exceeded the critical nucleus size [22]. According to previous investigations, the critical nucleus size (diameter) is in the order of a few nanometers [22,38]. Grains grow in size as additional liquid Al atoms are attracted to their interface and eventually transform to the energy favourable FCC phase after passing through the BCC metastable phase.
One of the most important steps for investigating the dynamics during solidification is to plot the mean square displacement (MSD) during solidification for the atoms contained in the simulation domain. The MSD is indicative of the mobility of the Aluminium atoms and is calculated as follows:
M S D t = r i t r i 0 2 = 1 N i = 1 N r i t r i 0 2
where r i t r i 0 denotes the distance between a particle’s current position and its initial one and N is the total number of particles in the simulation domain. In Figure 7, the MSD is plotted as a function of temperature for various cooling rates. It is shown that for all the cases under examination, the MSD increases parabolically as the temperature decreases and subsequently obtains an approximately constant value at a temperature value which coincides with the one for which the nucleation commences (Figure 2). Consequently, the diffusion coefficient, which is proportional to the slope of the MSD profile, decreases roughly linearly as the temperature drops and becomes approximately equal to zero when solidification has taken place. Higher cooling rates decrease the mobility of the Al atoms and consequently lead to reduced MSD values. The decreased mobility observed in this case is responsible for the prevalent amorphous structure obtained at the end of quenching. Moreover, right at the point before the MSD obtains a constant value, there is a step which is more pronounced for low cooling rates. This step indicates that there is a sudden release of energy (latent heat). This observation is further discussed in the following paragraphs.
In order to quantitatively study nucleation, the number of grains was plotted as a function of temperature (Figure 8). The obtained profiles follow similar trends with the ones obtained by Shibuta et al. [24] and Hu et al. [23]. It can be observed that higher cooling rates lead to the formation of more grains during solidification. This is because solidification occurs in a wider range of temperatures compared to lower cooling rates. The decreased mobility of the Al atoms (Figure 7) hinders grain growth and consequently additional nuclei can be formed within the simulation domain volume. However, this trend cannot be observed for very high cooling rates (8, 12 K/ps) due to the current temperature range and the rapid cooling.
Grain growth occurs after the point in time when an embryo’s radius surpasses its critical value. During the growth phase, additional Al atoms (previously being in liquid state) get attached to the unoccupied sites of the already formed FCC crystalline structure, which represents the energetically favourable state. Grain growth has been plotted over temperature in Figure 9. It is clear that lower cooling rates contribute towards larger grains. This is in agreement with the evolution of the population of the FCC phase as illustrated in Figure 2a. According to Figure 10, the average grain size at 273 K reduces parabolically with the cooling rate. By combining the aforementioned observations, it can be concluded that the final atomic configuration at 273 K consists of a small number of large grains for low cooling rates. On the other hand, high cooling rates lead to a high number of small grains which might coexist with an amorphous phase in the final configuration. Assuming that grains are spherical, the average grain diameter D g can be estimated as follows:
D g = 2 × N m A l 4 3 π ρ A l 3
where N is the number of atoms contained in a hypothetically spherical grain with diameter D g , m A l = 4.48 · 10 26   kg the mass of a single Aluminium atom and ρ A l = 2710   kg / m 3 the density of pure Aluminium. By substituting N = 3300 into Equation (7) (Figure 10), it can be estimated that the average grain diameter for a cooling rate of 0.5 K/ps corresponds to 4.7 nm. This value is close to the grain sizes observed in [22] but quite small compared to experimental observations [39]. This is a consequence of the very high cooling rates employed in MD simulations.

3.3. Kinetic Energy and Temperature

It is well known that nucleation and crystal growth are exothermic processes [40]. The latent heat of crystallisation is released at the nuclei-melt interface and the kinetic energy in the vicinity of the formed grains is affected. In order to investigate this phenomenon via MD simulations the kinetic energy of every atom was calculated as follows:
K E i = 1 2 m i v i 2
In order to eliminate noise, the kinetic energy of each atom was averaged over a time window of N t s / 50 timesteps, where N t s is the total number of timesteps of each simulation corresponding to a specific cooling rate (similarly to the estimation of the potential energy, as illustrated in Figure 5).
In this investigation, molecular dynamics simulations were used as a tool for capturing the exothermic nature of the nucleation and grain growth processes. As illustrated in Figure 11a, the kinetic energy rises significantly in the vicinity of the newly formed grains, while the kinetic energy of the melt is significantly lower. This sudden increase of the kinetic energy is due to the release of the latent heat of crystallisation, as previously mentioned. High kinetic energy regions also imply higher values of the local temperature. As the grain growth progresses (Figure 11b), it can be observed that the kinetic energy of the previously formed grains drops significantly. More specifically, by comparing Figure 11a,b, it is evident that the low kinetic energy regions of the latter one correspond to either grains formed in the commencement of nucleation which gradually cooled down or undercooled melt. The regions with higher kinetic energy of Figure 11b indicate the more recently formed grains.
Although the results presented in Figure 11 are indicative of the exothermic nature of the nucleation and grain growth processes, it is of utmost significance to provide a quantitative estimation of the instantaneous temperature evolution of each phase over the simulation domain. For this reason, the simulation domain atoms have been categorised into (a) solid phase and (b) amorphous/melt phase atoms based on the results of the common neighbour analysis. More specifically, the FCC/HCP/BCC atoms were allocated to the solid phase group while the ICO and amorphous atoms to the liquid/amorphous phase respectively. The instantaneous temperature of each phase was measured using the equipartition theorem:
T = K E d i m 2 k B
where kB = 1.38·10−23 m2 kg s−2 K−1 the Boltzmann constant, d i m = 3 the number of dimensions of the simulation and K E the phase ensemble average of the kinetic energy. The instantaneous temperature of each phase was estimated according to Equation (9) and plotted against the temperature of the simulation domain (Figure 12).
As expected, when the simulation domain temperature is higher than the temperature value at which nucleation commences, the temperatures of the two phases and the domain temperature are equal between them. However, when the first grains start to form, the solid phase temperature starts to diverge from the linear relationship between the temperature of the phases and the domain; this is due to the exothermic nature of nucleation and grain growth. This divergence cannot be noticed for cooling rates higher than 8 K/ps, as the amorphous phase becomes more dominant. It can also be observed that as the cooling rate increases, the divergence expands to a wider range of simulation domain temperatures. This is in accordance with the previous observations suggesting that for higher values of the cooling rate, nucleation takes place for a wider range of simulation domain temperatures.
It is also apparent that the divergence (peak) from the line is higher for a cooling rate of 1 K/ps. More specifically, this divergence increases for cooling rates in the range of 0.5–1 K/ps and subsequently drops for higher cooling rates. The observed behaviour is attributed to the superposition of two conflicting phenomena. Low cooling rates lead to a smoother increase of the number grains (Figure 8) but on the other hand, they foster the formation of the FCC/HCP phase (Figure 2a) and higher grain size growth rates (Figure 9). The nonmonotonous behaviour of the divergence of the phase temperature is attributed to the aforementioned reasons. Moreover, it can be observed that the maximum divergence in Figure 12 is achieved approximately at the domain temperature range for which the corresponding number of grains versus temperature curves obtain their steeper slope. This is because the simultaneous nucleation of multiple grains leads to a higher instant temperature of the solid phase.
Finally, with a closer look at Figure 12, it can be observed that there is also a smoother and counter-directional divergence in the amorphous/liquid phase temperature as well. This divergence is due to the implementation of the isobaric-isothermal ensemble (NPT) which maintains the simulation domain temperature in steady levels over specific relaxation periods. The divergence is smoother due to the higher population of the amorphous atoms at the corresponding timesteps; i.e., the FCC phase is not dominant. The NPT ensemble was implemented in almost all of the previous MD simulations on solidification [21,22,23,24]. However, based on the preceding analysis, it appears that it can potentially induce undesirable and non-realistic alterations in the system dynamics and its use should be questioned. Therefore, future research could be directed towards the investigation of the suitability of the NPT ensemble for investigating solidification and its capability to reproduce realistic results.

4. Conclusions

In this study, molecular dynamics simulations were performed to investigate homogeneous nucleation in pure Aluminium. The Finnis-Sinclair potential was used to model the interactions of a group of 1 million Aluminium atoms quenched under various cooling rates ranging from 0.5 to 12 K/ps. The atomistic structure, grain formation and growth as well as the local and average temperature evolution of the simulation domain were investigated by means of both quantitative assessment and visual inspection. The main conclusions drawn from this investigation are listed below:
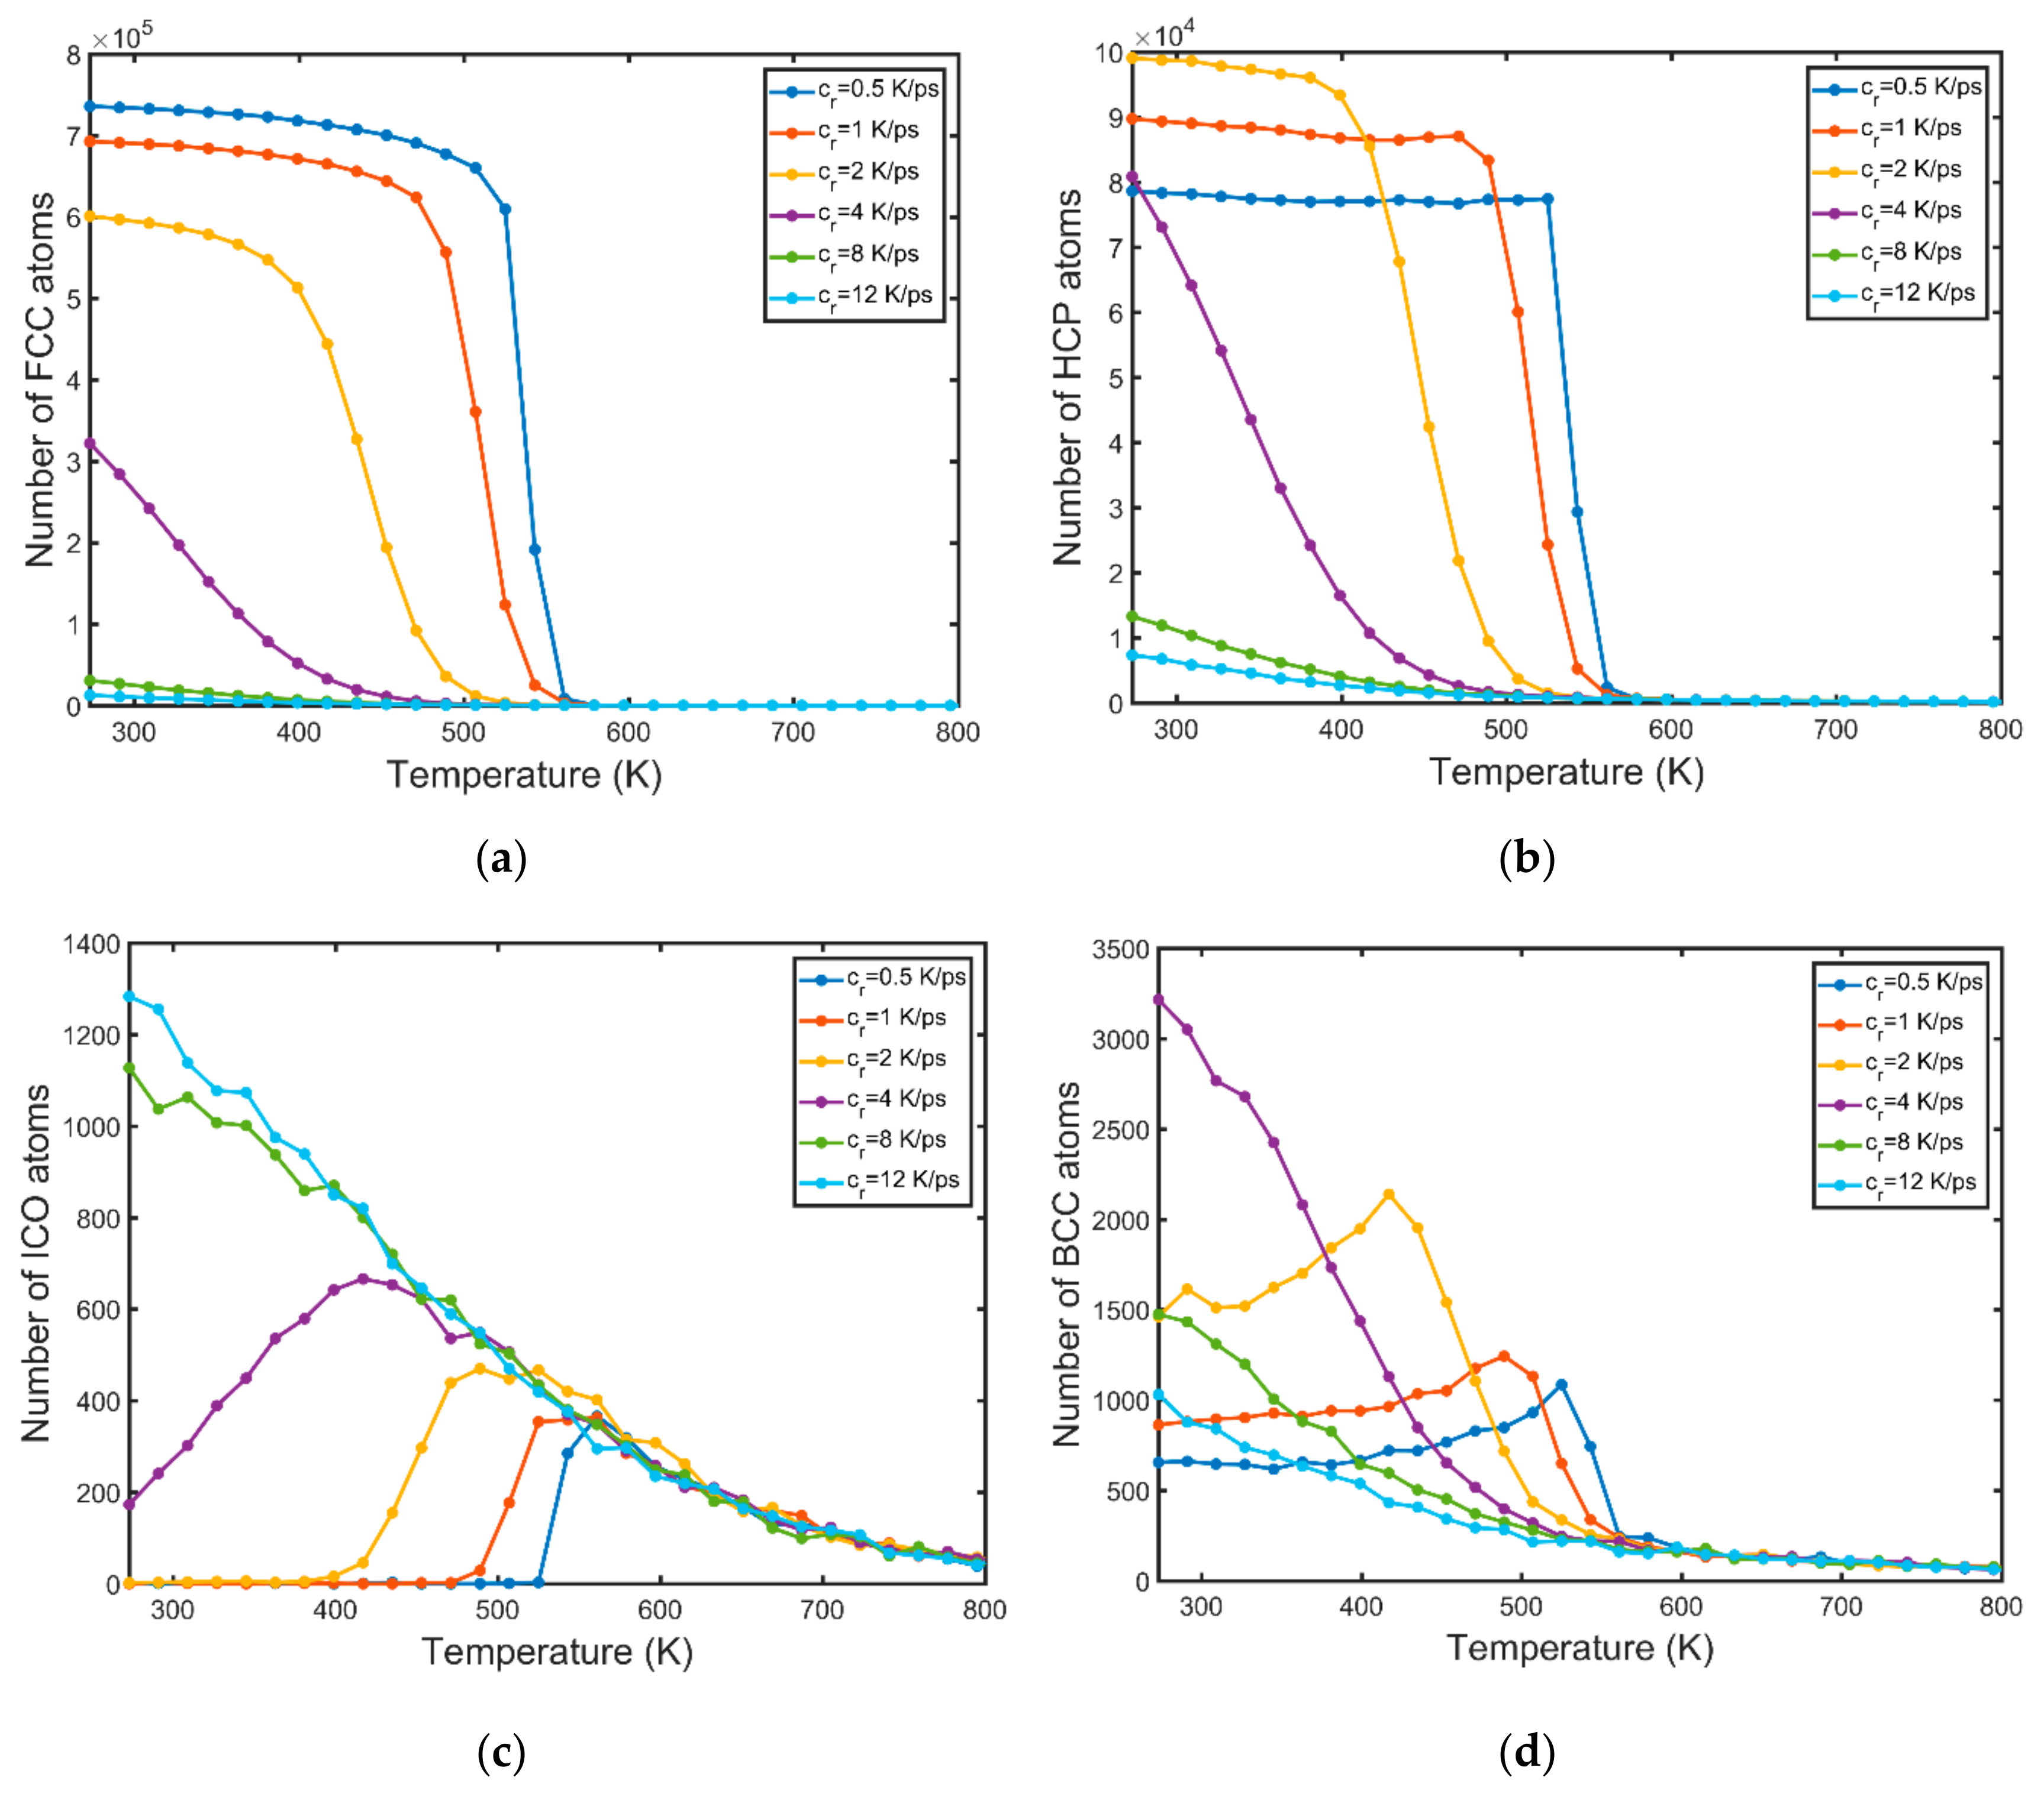
  • The BCC phase is formed prior to the FCC and HCP phases. A high number of BCC atoms is indicative of high nucleation and growth rates.
  • Solidification occurs in a wider range of temperatures for higher values of the cooling rate.
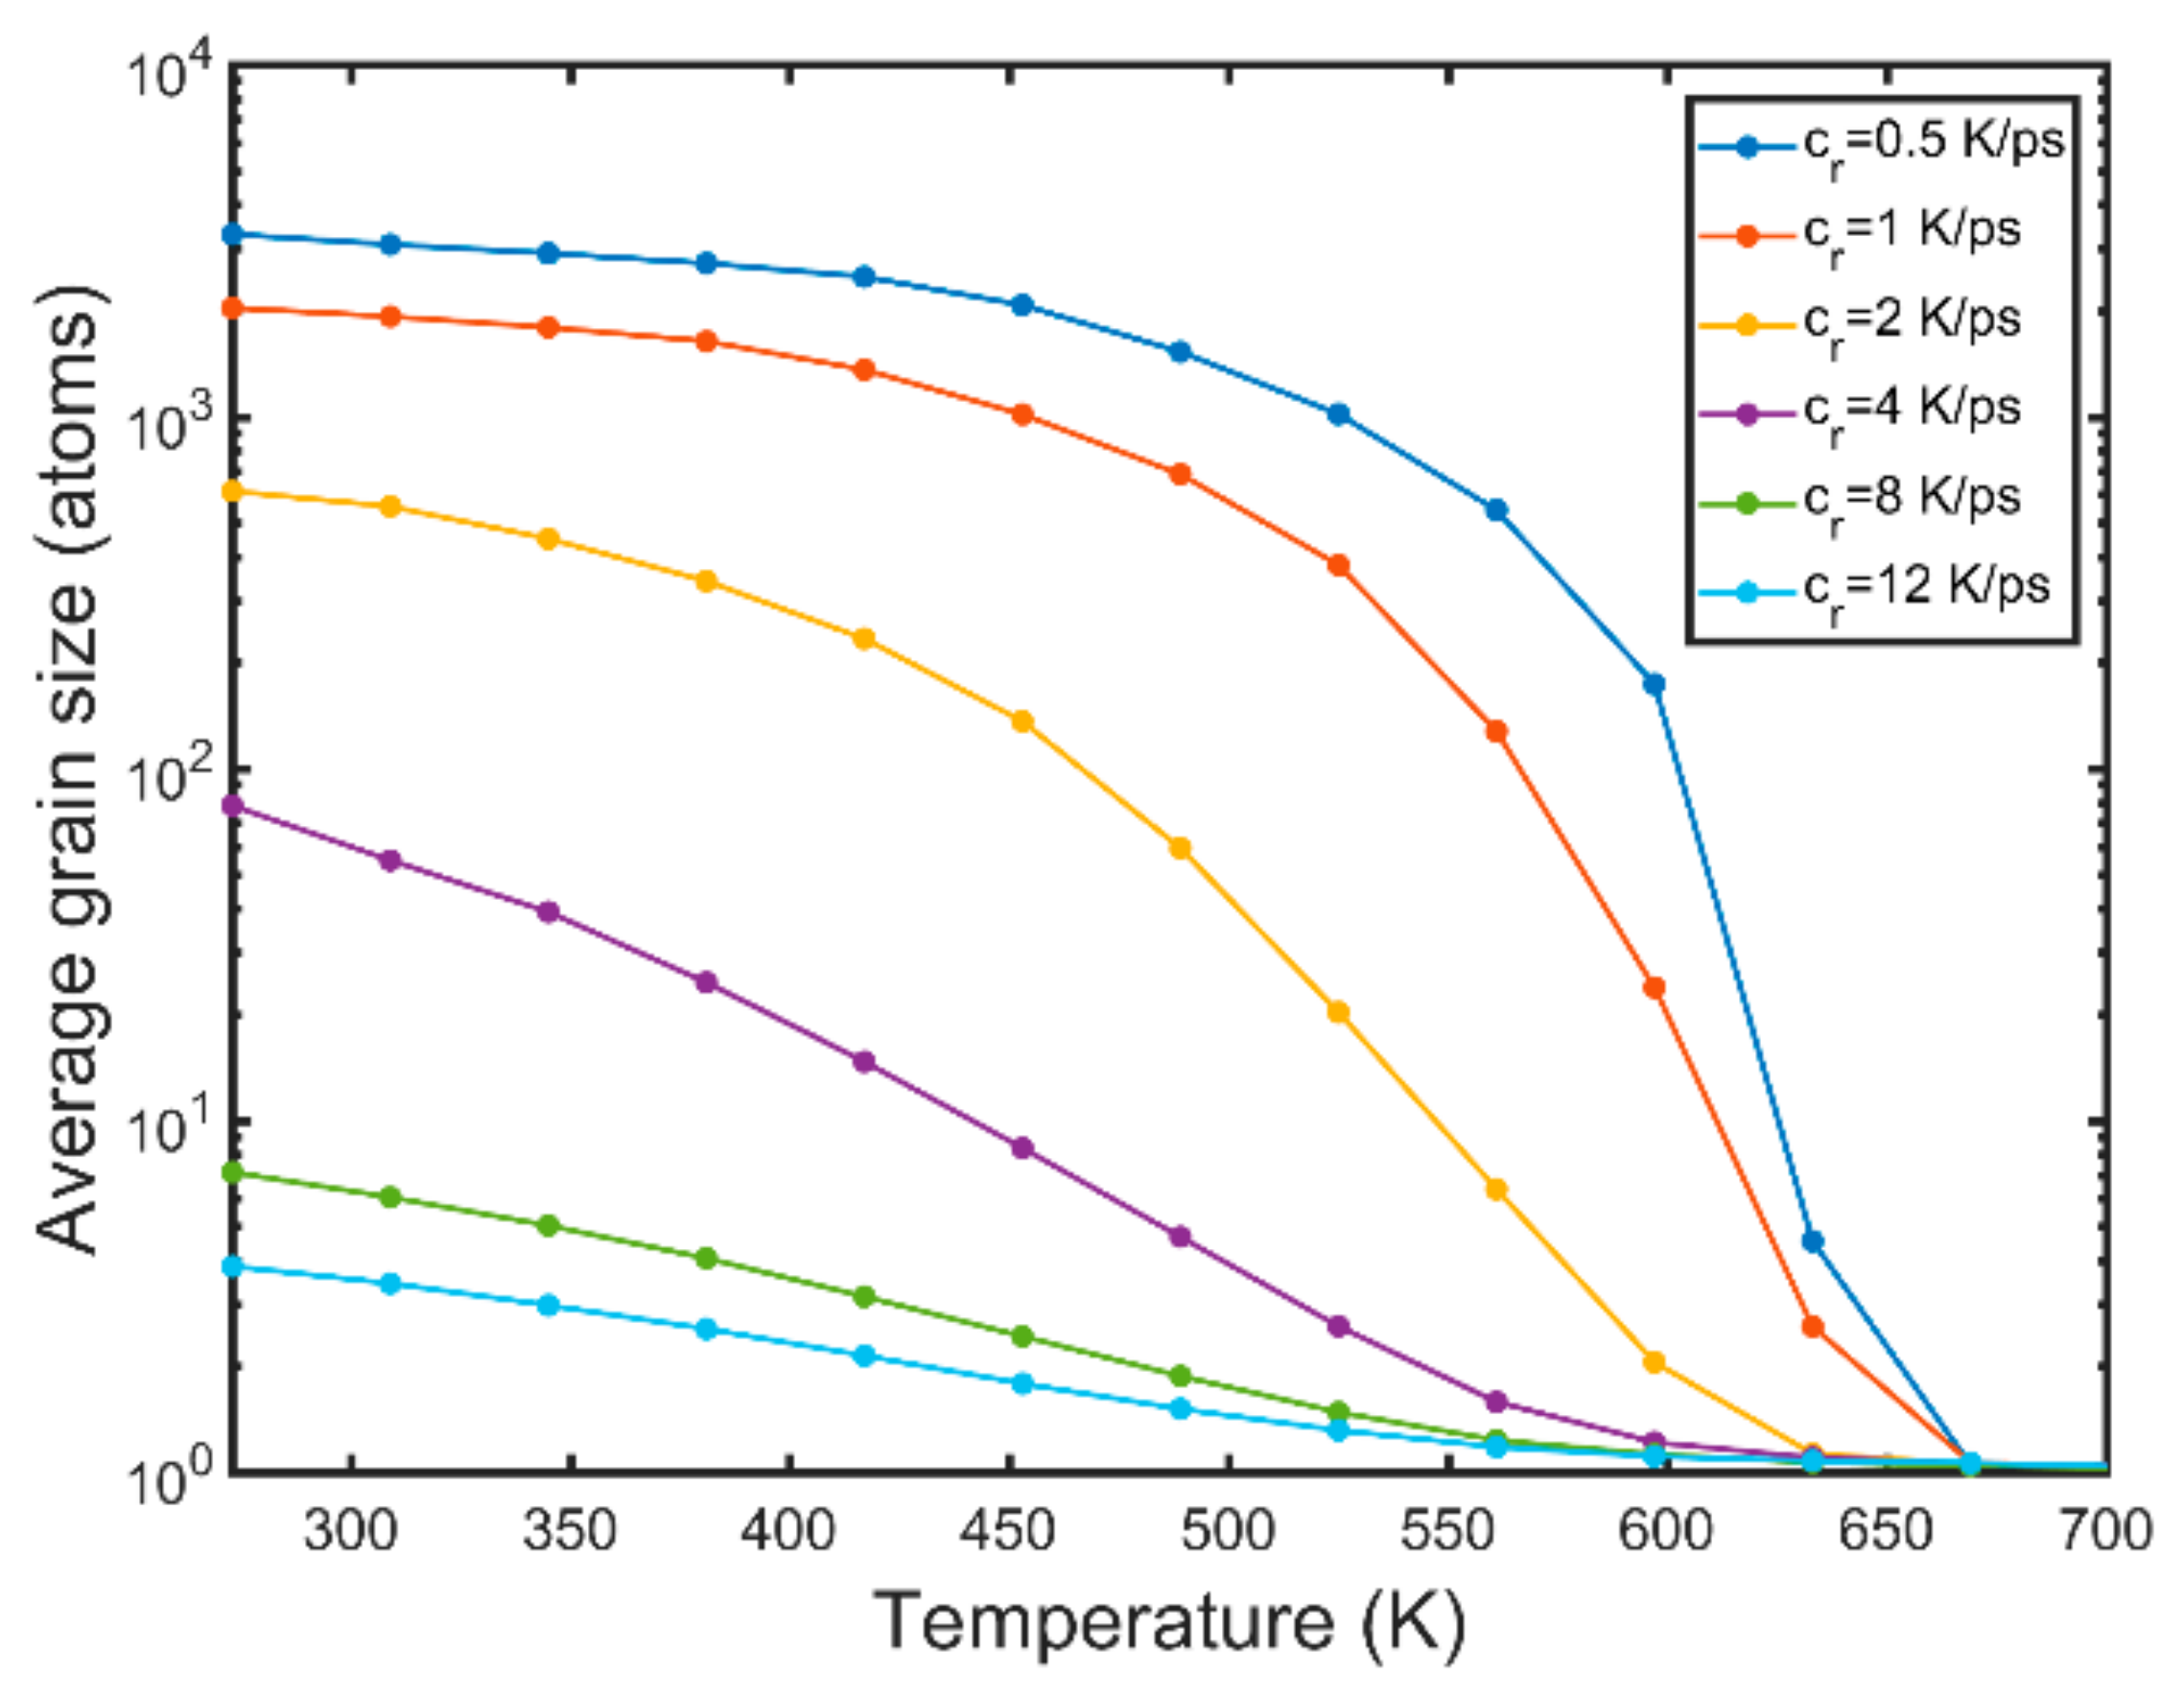
  • High cooling rates favour the formation of a large number of small grains while low cooling rates generate fewer but larger grains. The FCC/HCP phase is dominant for low cooling rates while the amorphous phase is favoured by rapid quenching.
  • The average grain size at the end of quenching drops parabolically with the cooling rate.
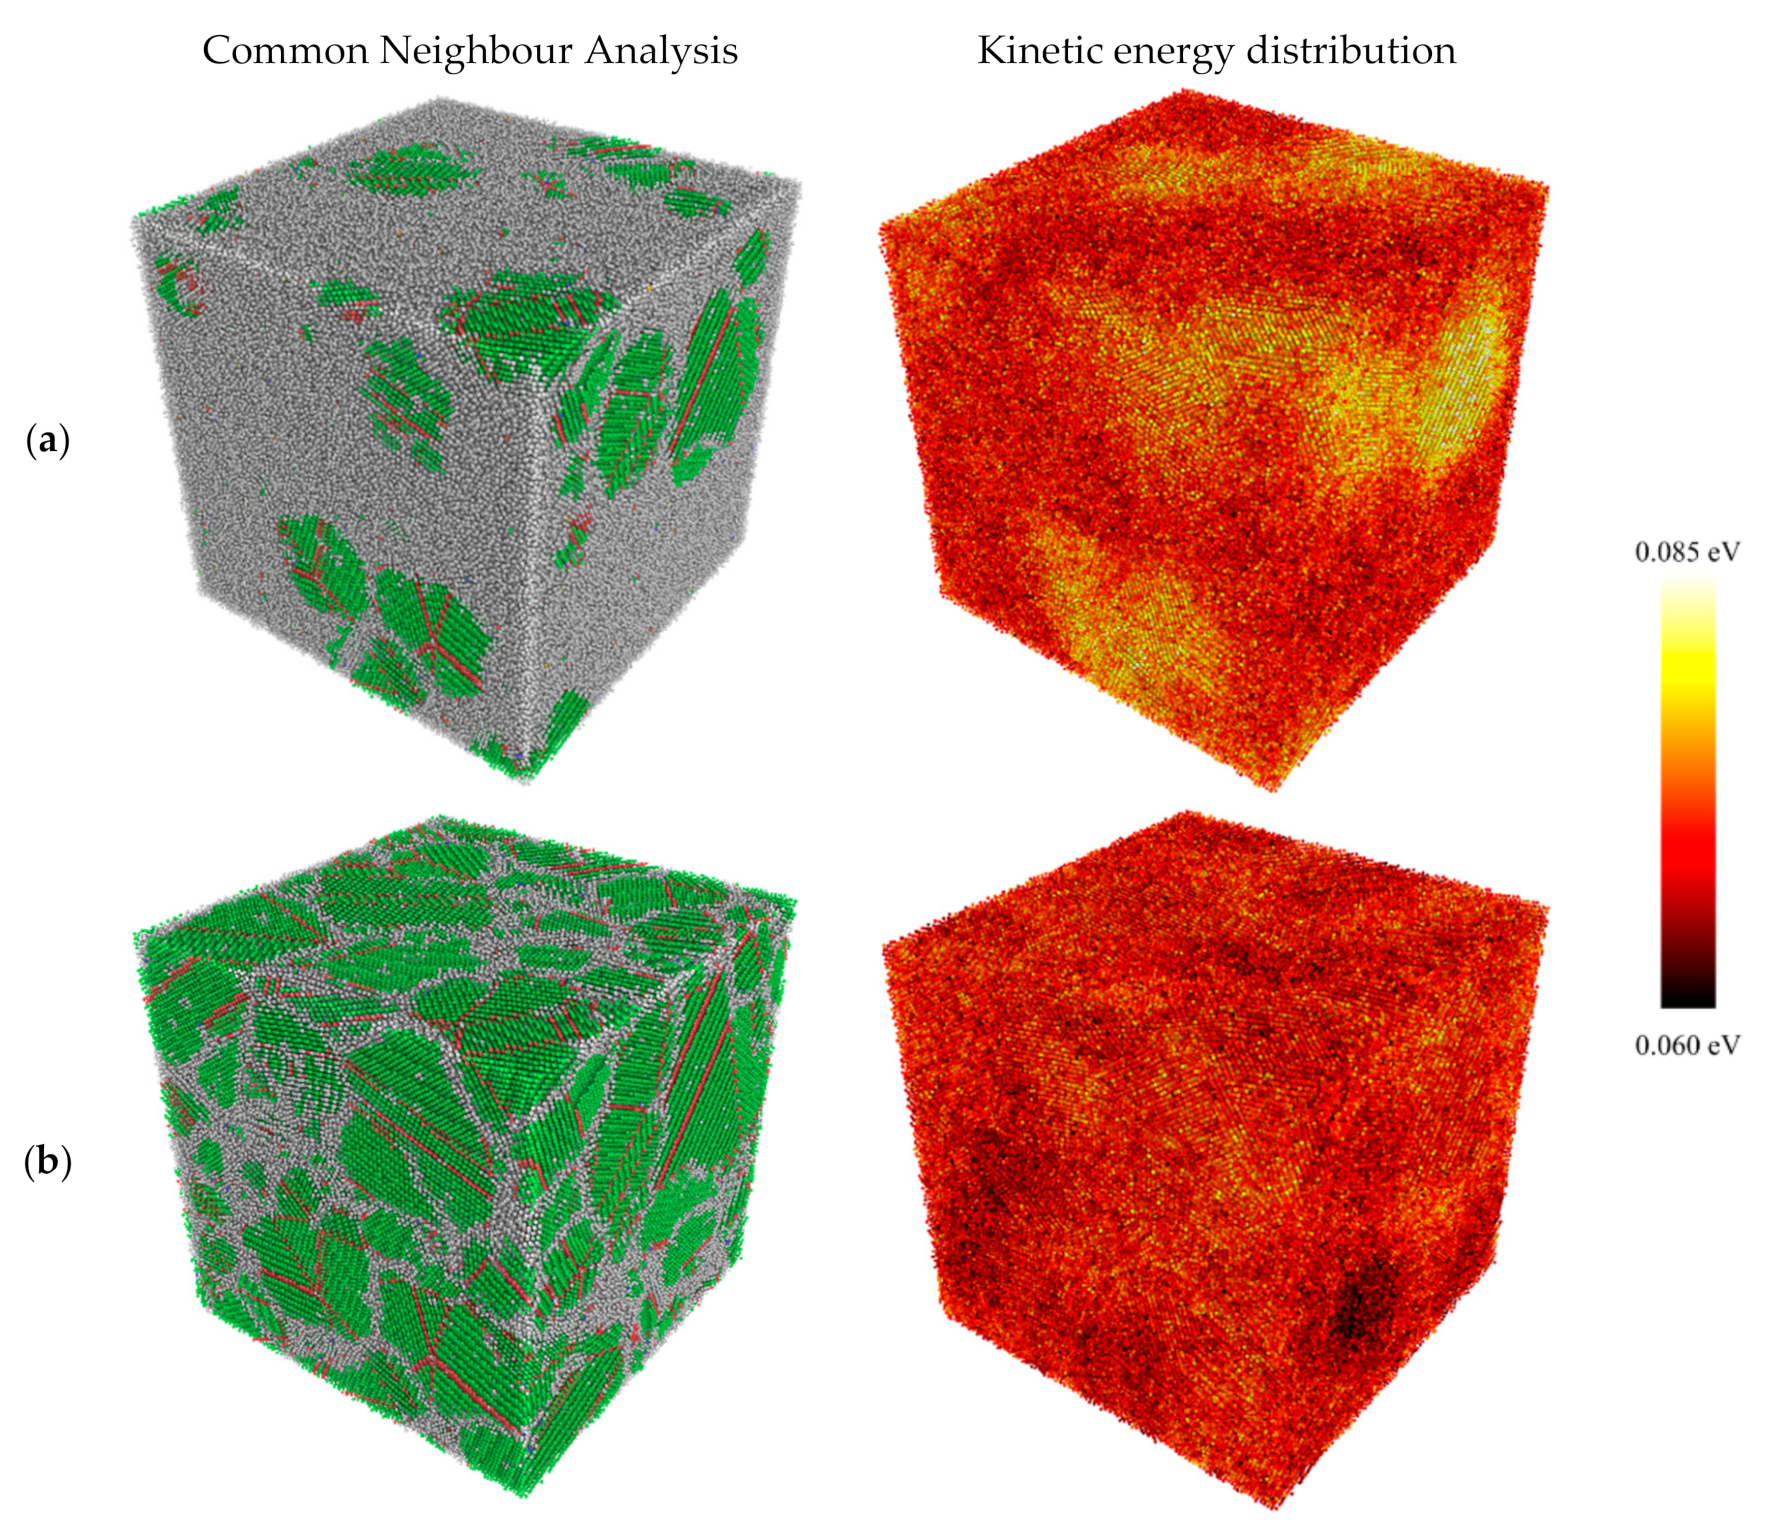
  • Kinetic energy rises sharply in the vicinity of the newly formed grains while the melt kinetic energy remains significantly lower. This is because of the exothermic nature of the solidification process which is accompanied by the release of the latent heat of crystallisation.
  • The solid phase temperature diverges from the linear cooling curve. The magnitude of the observed divergence is non-monotonous and dependent on the nucleation and growth rates. The concurrent nucleation of multiple grains increases significantly the instant temperature of the solid phase when the FCC/HCP phase is dominant.

Supplementary Materials

The following are available online at https://www.mdpi.com/2075-4701/9/11/1217/s1.

Author Contributions

Conceptualization, M.P.; methodology, M.P.; software, M.P. and M.F.; validation, M.P.; formal analysis, M.P.; investigation, M.P.; resources, K.S. and M.J.; data curation, M.P.; writing—original draft preparation, M.P.; writing—review and editing, M.P., K.S. and M.F.; visualization, M.P.; supervision, K.S. and M.J.; project administration, K.S.; funding acquisition, M.J. and K.S.

Funding

This research was funded by the UK EPSRC project “Energy Resilient Manufacturing 2: Small Is Beautiful Phase 2 (SIB2)” under grant EP/P012272/1.

Conflicts of Interest

The authors declare no conflict of interest.

References

  1. Hall, E.O. The Deformation and Ageing of Mild Steel: III Discussion of Results. Proc. Phys. Soc. Sect. B 1951, 64, 747–753. [Google Scholar] [CrossRef]
  2. Petch, N.J. The cleavage strength of polycrystals. J. Iron Steel Inst. 1953, 174, 25–28. [Google Scholar]
  3. Jackson, K.A. Kinetic Processes: Crystal Growth, Diffusion, and Phase Transformations in Materials; John Wiley & Sons: Hoboken, NJ, USA, 2006. [Google Scholar]
  4. Iqbal, N.; van Dijk, N.H.; Offerman, S.E.; Moret, M.P.; Katgerman, L.; Kearley, G.J. Real-time observation of grain nucleation and growth during solidification of aluminium alloys. Acta Mater. 2005, 53, 2875–2880. [Google Scholar] [CrossRef]
  5. Volmer, M.; Weber, A. Keimbildung in übersättigten Gebilden. Z. Phys. Chem. 1926, 119, 277–301. [Google Scholar] [CrossRef]
  6. Miller, R.C.; Anderson, R.J.; Kassner, J.L.; Hagen, D.E. Homogeneous nucleation rate measurements for water over a wide range of temperature and nucleation rate. J. Chem. Phys. 1983, 78, 3204–3211. [Google Scholar] [CrossRef]
  7. Brus, D.; Ždímal, V.; Uchtmann, H. Homogeneous nucleation rate measurements in supersaturated water vapor II. J. Chem. Phys. 2009, 131, 074507. [Google Scholar] [CrossRef] [PubMed]
  8. Russo, J.; Tanaka, H. The microscopic pathway to crystallization in supercooled liquids. Sci. Rep. 2012, 2, 505. [Google Scholar] [CrossRef] [PubMed]
  9. Karthika, S.; Radhakrishnan, T.K.; Kalaichelvi, P. A Review of Classical and Nonclassical Nucleation Theories. Cryst. Growth Des. 2016, 16, 6663–6681. [Google Scholar] [CrossRef]
  10. Del Vitto, A.; Pacchioni, G.; Delbecq, F.; Sautet, P. Au atoms and dimers on the MgO (100) surface: A DFT study of nucleation at defects. J. Phys. Chem. B 2005, 109, 8040–8048. [Google Scholar] [CrossRef] [PubMed]
  11. Gähler, F.; Benkert, K. Atomistic Simulations on Scalar and Vector Computers. In High Performance Computing on Vector Systems; Springer: Berlin/Heidelberg, Germany, 2006; pp. 173–186. [Google Scholar]
  12. Kumar, M.; Sasikumar, R.; Nair, P.K. Competition between nucleation and early growth of ferrite from austenite—Studies using cellular automaton simulations. Acta Mater. 1998, 46, 6291–6303. [Google Scholar] [CrossRef]
  13. Nie, Y.; Liang, C.; Cha, P.-R.; Colombo, L.; Wallace, R.M.; Cho, K. A kinetic Monte Carlo simulation method of van der Waals epitaxy for atomistic nucleation-growth processes of transition metal dichalcogenides. Sci. Rep. 2017, 7, 2977. [Google Scholar] [CrossRef] [PubMed]
  14. Qin, R.S.; Bhadeshia, H.K.D.H. Phase-field model study of the effect of interface anisotropy on the crystal morphological evolution of cubic metals. Acta Mater. 2009, 57, 2210–2216. [Google Scholar] [CrossRef]
  15. Papanikolaou, M.; Salonitis, K. Fractal roughness effects on nanoscale grinding. Appl. Surf. Sci. 2019, 467–468, 309–319. [Google Scholar] [CrossRef]
  16. Papanikolaou, M.; Salonitis, K. Contact stiffness effects on nanoscale high-speed grinding: A molecular dynamics approach. Appl. Surf. Sci. 2019, 493, 212–224. [Google Scholar] [CrossRef]
  17. Fu, T.; Peng, X.; Zhao, Y.; Sun, R.; Weng, S.; Feng, C.; Wang, Z. Molecular dynamics simulation of TiN (001) thin films under indentation. Ceram. Int. 2015, 41, 14078–14086. [Google Scholar] [CrossRef]
  18. Povarnitsyn, M.E.; Fokin, V.B.; Levashov, P.R.; Itina, T.E. Molecular dynamics simulation of subpicosecond double-pulse laser ablation of metals. Phys. Rev. B 2015, 92, 174104. [Google Scholar] [CrossRef]
  19. Tian, Z.-A.; Liu, R.-S.; Liu, H.-R.; Zheng, C.-X.; Hou, Z.-Y.; Peng, P. Molecular dynamics simulation for cooling rate dependence of solidification microstructures of silver. J. Non-Cryst. Solids 2008, 354, 3705–3712. [Google Scholar] [CrossRef]
  20. Tian, Z.-A.; Liu, R.-S.; Zheng, C.-X.; Liu, H.-R.; Hou, Z.-Y.; Peng, P. Formation and Evolution of Metastable bcc Phase during Solidification of Liquid Ag: A Molecular Dynamics Simulation Study. J. Phys. Chem. A 2008, 112, 12326–12336. [Google Scholar] [CrossRef] [PubMed]
  21. Streitz, F.H.; Glosli, J.N.; Patel, M. V Beyond finite-size scaling in solidification simulations. Phys. Rev. Lett. 2006, 96, 225701. [Google Scholar] [CrossRef] [PubMed]
  22. Mahata, A.; Zaeem, M.A.; Baskes, M.I. Understanding homogeneous nucleation in solidification of aluminum by molecular dynamics simulations. Model. Simul. Mater. Sci. Eng. 2018, 26, 025007. [Google Scholar] [CrossRef]
  23. Hou, Z.Y.; Dong, K.J.; Tian, Z.A.; Liu, R.S.; Wang, Z.; Wang, J.G. Cooling rate dependence of solidification for liquid aluminium: A large-scale molecular dynamics simulation study. Phys. Chem. Chem. Phys. 2016, 18, 17461–17469. [Google Scholar] [CrossRef] [PubMed]
  24. Shibuta, Y.; Sakane, S.; Miyoshi, E.; Okita, S.; Takaki, T.; Ohno, M. Heterogeneity in homogeneous nucleation from billion-atom molecular dynamics simulation of solidification of pure metal. Nat. Commun. 2017, 8, 10. [Google Scholar] [CrossRef] [PubMed]
  25. Finnis, M.W.; Sinclair, J.E. A simple empirical N-body potential for transition metals. Philos. Mag. A 1984, 50, 45–55. [Google Scholar] [CrossRef]
  26. Shibuta, Y.; Suzuki, T. Melting and solidification point of fcc-metal nanoparticles with respect to particle size: A molecular dynamics study. Chem. Phys. Lett. 2010, 498, 323–327. [Google Scholar] [CrossRef]
  27. Shibuta, Y.; Oguchi, K.; Ohno, M. Million-atom molecular dynamics simulation on spontaneous evolution of anisotropy in solid nucleus during solidification of iron. Scr. Mater. 2014, 86, 20–23. [Google Scholar] [CrossRef]
  28. Stefanescu, D.M. Science and Engineering of Casting Solidification; Springer: Berlin/Heidelberg, Germany, 2015. [Google Scholar]
  29. Lutsko, J.F. How crystals form: A theory of nucleation pathways. Sci. Adv. 2019, 5. [Google Scholar] [CrossRef] [PubMed]
  30. LAMMPS Molecular Dynamics Simulator. Available online: https://lammps.sandia.gov/ (accessed on 1 October 2019).
  31. Stukowski, A. Visualization and analysis of atomistic simulation data with OVITO-the Open Visualization Tool. Model. Simul. Mater. Sci. Eng. 2010, 18. [Google Scholar] [CrossRef]
  32. Honeycutt, J.D.; Andersen, H.C. Molecular dynamics study of melting and freezing of small Lennard-Jones clusters. J. Phys. Chem. 1987, 91, 4950–4963. [Google Scholar] [CrossRef]
  33. Stranski, I.N.; Totomanow, D. Keimbildungsgeschwindigkeit und Ostwaldsche Stufenregel. Z. Phys. Chem. 1933, 163, 399–408. [Google Scholar] [CrossRef]
  34. Rein ten Wolde, P.; Ruiz-Montero, M.J.; Frenkel, D. Numerical calculation of the rate of crystal nucleation in a Lennard-Jones system at moderate undercooling. J. Chem. Phys. 1996, 104, 9932–9947. [Google Scholar] [CrossRef]
  35. Lü, Y.J.; Chen, M.; Yang, H.; Yu, D.Q. Nucleation of Ni–Fe alloy near the spinodal. Acta Mater. 2008, 56, 4022–4027. [Google Scholar] [CrossRef]
  36. Schenk, T.; Holland-Moritz, D.; Simonet, V.; Bellissent, R.; Herlach, D.M. Icosahedral short-range order in deeply undercooled metallic melts. Phys. Rev. Lett. 2002, 89, 75507. [Google Scholar] [CrossRef] [PubMed]
  37. Hou, Z.; Tian, Z.; Liu, R.; Dong, K.; Yu, A. Formation mechanism of bulk nanocrystalline aluminium with multiply twinned grains by liquid quenching: A molecular dynamics simulation study. Comput. Mater. Sci. 2015, 99, 256–261. [Google Scholar] [CrossRef]
  38. Schumacher, P.; Greer, A.L.; Worth, J.; Evans, P.V.; Kearns, M.A.; Fisher, P.; Green, A.H. New studies of nucleation mechanisms in aluminium alloys: Implications for grain refinement practice. Mater. Sci. Technol. 1998, 14, 394–404. [Google Scholar] [CrossRef]
  39. Nowak, M.; Bolzoni, L.; Hari Babu, N. Grain refinement of Al–Si alloys by Nb–B inoculation. Part I: Concept development and effect on binary alloys. Mater. Des. 2015, 66, 366–375. [Google Scholar] [CrossRef]
  40. Sosso, G.C.; Chen, J.; Cox, S.J.; Fitzner, M.; Pedevilla, P.; Zen, A.; Michaelides, A. Crystal Nucleation in Liquids: Open Questions and Future Challenges in Molecular Dynamics Simulations. Chem. Rev. 2016, 116, 7078–7116. [Google Scholar] [CrossRef] [PubMed] [Green Version]
Figure 1. Atom types for a cooling rate 0.5 K/ps at (a) T = 579 K, (b) T = 543 K and (c) T = 507 K.
Metals 09 01217 g001
Figure 2. Temperature dependence of the population of (a) face-centred cubic (FCC), (b) hexagonal close-packed (HCP), (c) icosahedral (ICO) and (d) body-centred cubic (BCC) atom clusters.
Metals 09 01217 g002
Figure 3. Radial distribution functions (RDFs) during solidification for various cooling rates: (a) 0.5 K/ps, (b) 4 K/ps and (c) 12 K/ps.
Metals 09 01217 g003
Figure 4. Normalised potential energy as a function of temperature for various cooling rates.
Metals 09 01217 g004
Figure 5. Common neighbour analysis and potential energy distribution for a cooling rate of 0.5 K/ps at 2 successive averaging points corresponding to (a) T = 548 K and (b) T = 530 K.
Metals 09 01217 g005
Figure 6. Nucleation and solidification for a cooling rate of 0.5 K/ps at (a) 567 K, (b) 548 K, (c) 530 K and (d) 273 K.
Metals 09 01217 g006
Figure 7. Mean square displacement versus temperature for various cooling rates.
Metals 09 01217 g007
Figure 8. Number of grains versus temperature.
Metals 09 01217 g008
Figure 9. Grain growth vs. temperature.
Metals 09 01217 g009
Figure 10. Average grain size at the end of quenching for various cooling rates.
Metals 09 01217 g010
Figure 11. Common neighbour analysis and kinetic energy distribution for a cooling rate of 0.5 K/ps at 2 successive averaging points corresponding to (a) T = 548 K and (b) T = 530 K.
Metals 09 01217 g011
Figure 12. Phase temperature versus simulation domain temperature for cooling rates of (a) 0.5 K/ps, (b) 1 K/ps, (c) 2 K/ps and (d) 4 K/ps.
Metals 09 01217 g012
Table 1. Simulation parameters.
Number of Atoms1,000,188
Timestep (fs)2
Pressure (Pa)0
EnsembleNPT
Al-Mass (amu)26.98
Cooling Rates (K/ps)0.5, 1, 2, 4, 8, 12
Temperature Damping Parameter (ps)0.2
Pressure Damping Parameter (ps)2

