Abstract
Ti15Mo metastable beta Ti alloy was solution treated and subsequently deformed by high-pressure torsion (HPT). HPT-deformed and benchmark non-deformed solution-treated materials were annealed at 400 °C and 500 °C in order to investigate the effect of UFG microstructure on the α-phase precipitation. Phase evolution was examined using laboratory X-ray diffraction (XRD) and by high-energy synchrotron X-ray diffraction (HEXRD), which provided more accurate measurements. Microstructure was observed by scanning electron microscopy (SEM) and microhardness was measured for all conditions. HPT deformation was found to significantly enhance the α phase precipitation due the introduction of lattice defects such as dislocations or grain boundaries, which act as preferential nucleation sites. Moreover, in HPT-deformed material, α precipitates are small and equiaxed, contrary to the α lamellae in the non-deformed material. ω phase formation is suppressed due to massive α precipitation and consequent element partitioning. Despite that, HPT-deformed material after ageing exhibits the high microhardness exceeding 450 HV.
1. Introduction
The interest in metastable β-Ti alloys has gradually increased due to their high specific strength, which make them ideal for applications in the aerospace industry [1]. Manufacturing of medical implants and devices is another high-added-value field and constitutes a prospective application of metastable β titanium alloys [2]. These alloys offer higher strength levels than commonly used α + β alloys due to controlled precipitation of tiny particles of α phase [3]. The strength of titanium and Ti-based alloys can be further improved by achieving an ultra-fine grained (UFG) structure via severe plastic deformation methods (SPD) [4,5,6,7]. Manufacturing of UFG metastable β-Ti alloys is of significant interest as demonstrated by recent reports [8,9,10,11]. This study focuses on the effect of microstructure refinement by SPD on the precipitation of α phase upon subsequent thermal treatment.
The α phase forms in metastable β Ti alloys by a standard mechanism of nucleation and growth. The kinetics of α phase formation in a solution-treated material is generally given by chemical composition of the alloy and the temperature of ageing. However, α phase precipitation also strongly depends on the microstructure since α phase particles nucleate at preferential sites such as grain and subgrain boundaries and dislocations [12,13].
In some β-Ti alloy, nanosized ω phase particles can also act as preferential nucleation sites for precipitation of α phase, although the exact mechanism of ω formation has not been fully resolved yet [14,15,16,17,18]. It is therefore of significant interest to investigate α phase precipitation in the presence of high concentration of lattice defects (UFG material) in an alloy prone to the ω phase formation. Binary metastable Ti15Mo alloy used in this study consists, similarly to other β-Ti alloys with similar degree of β stabilization, of a mixture of β and ωath (athermal ω) phases in the solution-treated (ST) condition [19,20]. This ωath phase forms during quenching of the alloy from the temperatures above β transus by a displacive diffusionless mechanism [21]. However, it was also reported that ω phase can form as a result of high deformation, and is referred to as deformation induced ω [8,22]. The β → ωath transformation is reversible up to a temperature of 110 °C [23]. Upon ageing at higher temperatures, the ωath particles become stabilized by diffusion i.e., in Ti15Mo alloy by expelling Mo. This phase is referred to as ωiso (isothermal ω) [24]. The size of particles of ωiso phase is typically in the range of few nanometers up to 100 nm [19,24].
Solution-treated Ti15Mo alloy was processed by high-pressure torsion (HPT) [5] in order to achieve ultra-fine grained (UFG) microstructure with a high density of lattice defects. The equivalent von Mises strain achieved by HPT is heterogeneous and can be calculated according to Equation (1) [25]:
where r represents the distance from the center of the sample, h is the thickness of the specimen, and N is the number of revolutions. The equivalent inserted von Mises strain after a single HPT rotation (N = 1, r = 10 mm and thickness h of 1 mm) ranges from 0 (the exact center) up to 35 = 3500% (periphery). Such extreme strain results in a dislocation density exceeding ρ = 5 × 10¹⁴ m−2 and grain size in the range of hundreds of nanometers [11,26].
The objective of this study was to investigate the effect of SPD on the mechanisms and kinetics of α phase precipitation and to compare it with the precipitation in the non-deformed solution-treated material. Both laboratory X-ray diffraction (XRD) and high-energy XRD using synchrotron radiation (HEXRD) were employed for this experimental study.
2. Materials and Methods
Ti15Mo (wt%) alloy was supplied by Carpenter Co. (Richmond, VA, USA) in the form of a rod with the diameter of 10 mm. The as-received material was solution treated (ST) in an inert Ar atmosphere at the temperature of 810 °C for 4 h and subsequently water quenched. The cylindrical samples of the length of 5 mm were first cut from the rod and pressed with 6 GPa to achieve disk-shaped samples with the diameter of 20 mm and the thickness of approximately 1 mm. Disk samples were subsequently subjected to HPT deformation at room temperature at Ufa State Aviation Technical University (USATU), Russian Federation. Note that this pre-HPT deformation induced deformation of about 75% is significantly lower than the actual HPT deformation. The detailed description of the HPT method can be found elsewhere [5]. For this study, samples after N = 1 HPT rotation were prepared.
ST and HPT deformed samples (hereafter referred to as non-deformed and HPT-deformed, respectively) were aged at temperatures of 400 °C and 500 °C for 1, 4, and 16 h. The ageing was performed by immersing the samples to preheated salt-bath (i.e., with very high heating rate) without air access and subsequently water quenched. HPT samples for scanning electron microscopy (SEM) and microhardness study were prepared from the periphery part of the disks (>5 mm from the center) where the imposed strain is maximum. For XRD measurements, a quarter of a disk-shaped sample was used. All samples were mechanically grinded and polished by standard methods followed by a three-step vibratory polishing.
The microstructure of the specimens was observed using SEM Zeiss Auriga Compact Cross Beam (Jena, Germany) equipped with the energy dispersive spectroscopy (EDS) detector operated at 4 kV. K-line and L-line for Ti and Mo, respectively, were used for quantification of EDS data.
XRD measurement of the non-deformed Ti15Mo alloy was performed employing a Bruker D8 Advance powder X-ray diffractometer using Cu Kα radiation (Bruker AXS GmbH, Karlsruhe, Germany), with a variable divergent slit and a Sol X detector. The width of the beam was 6 mm and the sample was rotated, allowing it to probe the whole specimen surface. XRD measurements of the HPT-deformed Ti15Mo alloy were carried out on Bruker D8 Discover powder X-ray diffractometer. Vertical Bragg-Brentano geometry (2.5° Soller slits in both primary and secondary beam and 0.24° divergence slit) with filtered Cu Kα radiation was used. Beam size of 20 mm × 5–15 mm (depending on the angle) was used. Note that the beam size is comparable to the size of the HPT disk. Diffraction patterns in both cases were collected at room temperature in the 2 range from 30° to 130° and were analyzed using LeBail approach in the program Jana2006 (Václav Petríček, Michal Dušek and Lukáš Palatinus, Institute of Physics Academy of Sciences, Prague, Czech Republic).
The HEXRD measurement was carried out at the P07-HEMS beamline of PETRA III (Deutsches Elektronen-Synchrotron, Hamburg, Germany) [27] using the energy of 100 keV (λ = 0.124 Å) in a transmission mode perpendicular to the HPT surface. Patterns of entire Debye–Scherrer rings were acquired ex-situ from the bulk of Ti15Mo samples at room temperature. A PerkinElmer XRD 1621 image plate detector was used. The samples were kept fixed during the acquisition and measured 5 mm from the center of the sample with an incident beam of slit size of 1 × 1 mm2. The acquired diffraction patterns were processed by Rietveld structural refinement using FullProf software (Juan Rodriguez Carvajal, ILL Grenoble, France). Azimuthal averaging over 360° was performed first. HEXRD diffractograms after azimuthal averaging were treated by the March–Dollase approach in order to obtain at least rough estimates of volume fractions of individual phases. In fact, β phase peaks, which are the most intensive, could be fitted without the March–Dollase ‘adjustment’. Nevertheless, diffractions of evolving α and ω phases had to be treated by the March–Dollase approach to achieve reasonable agreement with the measured data [28]. Even with the use of the March–Dollase approach the resulting R-factors of the fit accuracy range between 15–20 for α and ω phases, while R-factor for β phase is around 10.
The microhardness of the samples was measured using the Vickers method with the use of microhardness tester Qness Q10a (Golling, Austria). Note that all samples from HPT disks were cut from the area at least 5 mm distant from the center where microhardness of HPT N = 1 condition is saturated [8]. For each specimen 0.5 kg load and the dwell time of 10 s were applied. At least 20 indents were evaluated for each sample in order to get satisfactory statistical results.
3. Results
3.1. Initial Conditions
Microstructure
The initial microstructure of the ST Ti15Mo alloy is shown in Figure 1. A coarse-grained (CG) structure consisting of grains of the average size of ~50 μm is well visible due to the channeling contrast. In addition, brighter and darker and areas are also visible in the material due to the chemical contrast (marked by yellow arrows in Figure 1). These chemical inhomogeneities were investigated by EDS. Table 1 summarizes the results of the EDS point analysis. Note that results were obtained by standardless EDS in which the measured spectra are compared to the data collected from standards by the EDS manufacturer under different conditions (namely different beam conditions). Such data are therefore subjected to systematic error and as such they are not fully reliable in terms of exact quantitative Mo content determination. However, the relative difference in chemical composition between different areas is accurate and unambiguous.

Figure 1.
Scanning electron microscopy–back-scattered electrons (SEM–BSE) micrograph of the solution-treated (ST) Ti15Mo alloy (the yellow arrows indicate chemical inhomogeneities in the material).

Table 1.
Chemical composition of the darker and brighter bands (marked by yellow arrows in Figure 1) as determined by energy dispersive spectroscopy (EDS) point analysis.
Local chemical inhomogeneities in the ST material were also investigated by EDS mapping. In Figure 2a, several β-grains and darker and lighter areas (visible especially in the top left corner of the image) are visible due to channeling contrast and chemical contrast (Z-contrast), respectively. EDS mapping confirms the chemical inhomogeneity—darker areas in Figure 2a contain less Mo as shown in Figure 2b. Variations in the local content of Mo (β stabilizing element) may affect the phase stability of the β phase matrix.
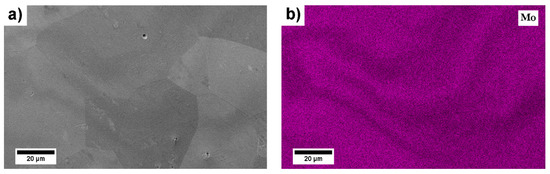
Figure 2.
Local chemical inhomogeneities in ST Ti15Mo alloy: (a) scanning electron microscopy–secondary electrons (SEM–SE) micrograph of the area of interest, (b) corresponding element map of Mo using EDS.
The chemical inhomogeneities were also studied in the HPT-deformed sample. The SEM–BSE micrograph in Figure 3 clearly shows lighter and darker bands corresponding to the chemical composition differences, which were also confirmed by EDS. Darker areas with lower Mo were formed from curly bands in the non-deformed material (Figure 1). In HPT deformed material, they are elongated in the direction of the deformation (Figure 3).
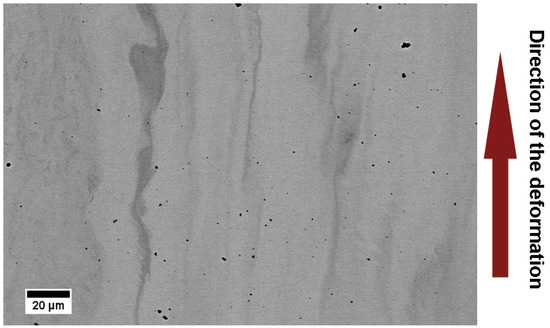
Figure 3.
SEM–BSE micrograph of Ti15Mo alloy after high-pressure torsion (HPT) processing. Surface of HPT disk with highlighted direction of deformation (azimuthal direction). Darker and brighter areas are caused by the difference in chemical composition (black dots are polishing artefacts).
3.2. Non-Deformed and HPT-Deformed Material after Ageing
3.2.1. The Evolution of Microstructure during Ageing
SEM–BSE micrographs in Figure 4 show the evolution of the microstructures of the non-deformed material after ageing at 400 °C and 500 °C for 1–16 h. The microstructure consists of coarse-grained β matrix. At least one triple-junction is shown in each image. After ageing at 400 °C for 1 and 4 h, only β matrix is observed. In the specimen aged for a longer time (400 °C/16 h), nanometer-sized precipitates are seen in the SEM–BSE micrograph (note the higher magnification of this micrograph). These small ellipsoidal particles are particles of ω phase, which are visible due to chemical partitioning—ω phase particles are slightly Mo depleted [29]. Ageing at the higher temperature of 500 °C resulted in a precipitation of continuous and coarse α phase along grain boundaries (hereafter referred to as grain boundary α or GB α), which is also Mo depleted and appears as a long dark particle along the former β/β boundary (indicated by a yellow arrow). In the vicinity of the β grain boundaries, α phase particles with a typical lamellar morphology precipitated. Small ellipsoidal particles in the grain interior belong to ω phase. The contrast of these particles increases with the increasing ageing time due to ongoing chemical partitioning. After ageing at 500 °C for 16 h, tiny ellipsoidal ω particles are clearly seen in grain interiors, GB α is visible along the former β/β grain boundaries and α lamellae span from the GB α to the grain interiors. In conclusion, ω particles with ellipsoidal morphology can be observed by SEM in the grain interior after ageing at 500 °C and the fraction of α phase particles with lamellar morphology increases with increasing time of ageing at 500 °C. The coexistence of all three β, α, and ω phases is observed.
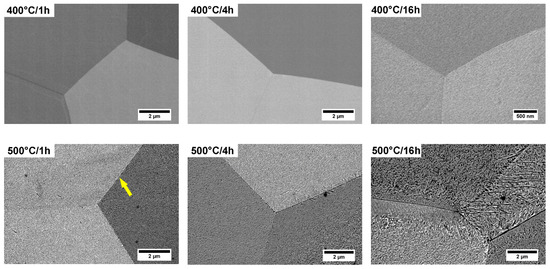
Figure 4.
SEM–BSE micrographs of the non-deformed samples after ageing.
Figure 5 shows the microstructures of the HPT-deformed samples after ageing. Already after ageing at 400 °C/1 h, significant differences between the non-deformed and HPT-deformed specimens can be observed. In the non-deformed material, there is no evidence of α phase particles. On the other hand, small and equiaxed α particles already precipitated in HPT sample. In specimens aged at 400 °C for longer times of 4 h and 16 h, the volume fraction of the α phase increased and, simultaneously, α precipitates coarsened. Moreover, the precipitation is not homogeneous—some areas contain clearly more α phase particles. Ageing at 500 °C resulted in the formation of larger α particles, which are generally equiaxed, but not round—rather polygonal and sharp edged.
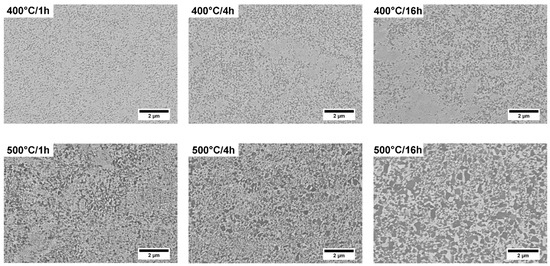
Figure 5.
SEM–BSE micrographs of the samples deformed by high-pressure torsion (HPT-deformed samples) after ageing.
3.2.2. Evolution of Phase Composition during Ageing
The phase composition of the non-deformed and HPT-deformed samples before and after ageing is shown in laboratory XRD patterns in Figure 6 and Figure 7, respectively. Both the measured (thin black curves) and fitted (colored curves) XRD patterns are shown. The interplanar distance is displayed on the horizontal axis for the comparison to the HEXRD data, while the y-axis shows the intensity in a logarithmic scale, allowing one to distinguish small peaks. The most important peaks, which best describe the evolution of emerging phases, are marked with arrows—full and open arrows for α and ω phase, respectively. A quantitative determination of phase content is not possible. The non-deformed specimen contains large grains with the size of hundreds of micrometers while HPT-deformed material is severely plastically deformed with high dislocation density and high internal stress resulted in the broadening of XRD peaks. Moreover, in both conditions, the grains have a preferred orientation as can be revealed from the relative intensity of the peaks. Therefore, laboratory XRD patterns could not be successfully fitted by any other method than the simple LeBail approach. However, several qualitative comparisons can be made.
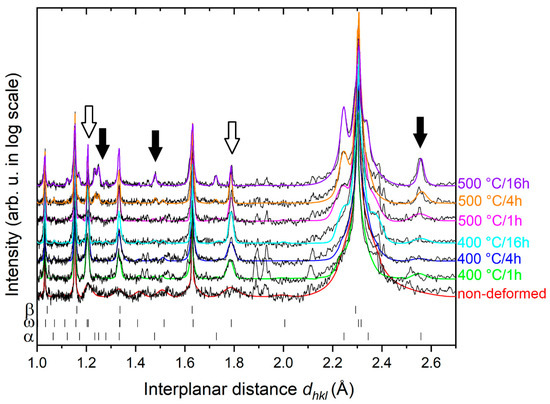
Figure 6.
X-ray diffraction (XRD) patterns (in log-scale) of aged conditions of the non-deformed Ti15Mo alloy. Black thin curves correspond to data, colored curves are numerical fits. Non-deformed without ageing (red curve) and aged conditions (other colored curves) are displayed. The patterns are vertically shifted for clarity. The most important peaks are marked by full and open arrows for α and ω phase, respectively. Two unfitted peaks around dhkl = 1.9 originated from the sample holder.
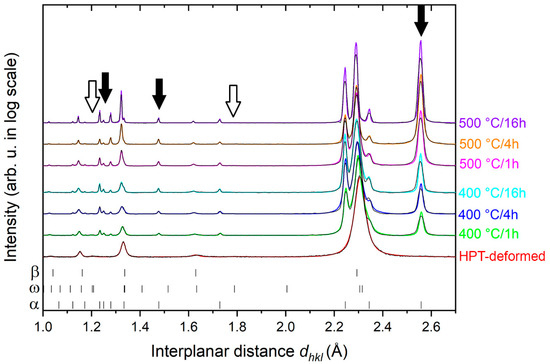
Figure 7.
XRD patterns of aged conditions of the HPT-deformed Ti15Mo alloy: HPT-deformed without ageing (black curve) and aged under different conditions (colored curves) are displayed. The patterns are vertically shifted for clarity. The most important peaks are marked by full and open arrows for α and ω phase, respectively.
The non-deformed Ti15Mo alloy contains a mixture of β and ω phases. However, the identification of the ω phase content is difficult due to overlapping peaks of β and ω peaks. Nevertheless, ω peaks (11–22)ω and (11–21)ω can be observed at the inter planar distances dhkl ≈ 1.2 Å and dhkl ≈ 1.8 Å, respectively, as shown in Figure 6. Ageing of the non-deformed specimen at 400 °C/1 h (red curve in Figure 8) resulted in an increase of the intensity and narrowing of ω peaks (open arrows). In addition, small α phase peaks are also visible (full black arrows). XRD patterns of the non-deformed material aged at 400 °C for 1, 4, and 16 h are very similar. In the specimen aged at 500 °C for 1 h, the α phase is clearly present (full arrows in Figure 6). Moreover, its volume fraction increases with increasing ageing time (4–16 h), as also confirmed by SEM observations (cf. Figure 5); ω phase is still present in the specimen aged 500 °C even for the longest time of 16 h reported in [29].
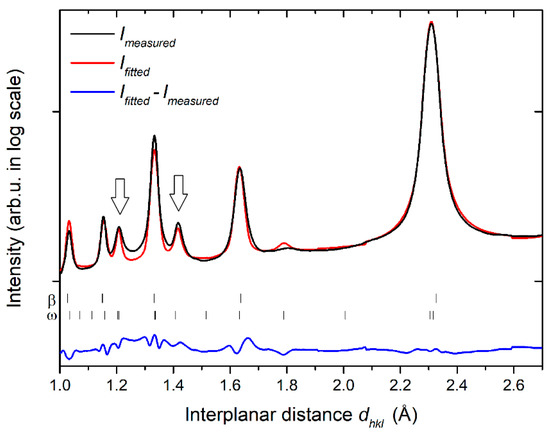
Figure 8.
High-energy synchrotron X-ray diffraction (HEXRD) pattern of the HPT-deformed sample.
The XRD pattern of the HPT deformed specimen exhibits significantly broadened peaks due to enhanced dislocation density and reduced crystallite size in this specimen. Moreover, the peaks are slightly shifted to different values of interplanar distances due to residual stresses in the deformed material—the direction of the shift depends on the type of the residual stress [30].
The ω phase content in the HPT sample seems to be inferior to that in the non-deformed sample; only a tiny peak can be resolved at the interplanar distance dhkl ≈ 1.2 Å. However, the most intensive peaks of the ω phase coincide with the peaks of the β phase.
In order to obtain more precise information about volume fraction of individual phases, HEXRD measurement was carried out on the HPT-deformed sample. In contrast to the laboratory XRD, HEXRD provides a better signal-to-noise ratio and the simultaneous measurement of the scattering signal in various directions due to the use of a 2D detector and subsequent azimuthal averaging. Consequently, a better resolution of small peaks, namely those of the ω phase, is achieved. Figure 8 shows the HEXRD pattern of the HPT specimen. Both the measured and fitted intensities as well as the difference curve between the fitted and measured intensity are shown in Figure 8. The results indicate that the HPT-deformed alloy is a two-phase material with volume fractions of the β and ω phase of 72% and 28%, respectively (the error of the volume fractions estimation is approximately ±5%).
In order to get more accurate results, the selected HPT-deformed specimen after ageing at 400 °C/1 h was examined using HEXRD. Both the measured and fitted intensity and the difference between the fitted and measured data are displayed in Figure 9.
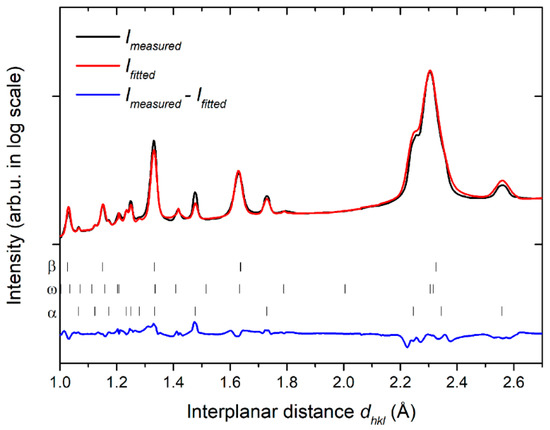
Figure 9.
HEXRD pattern of the HPT-deformed sample after aging 400 °C/1 h.
The volume fractions of individual phases in HPT-deformed sample before and after ageing at 400 °C/1 h are summarized in Table 2. The non-aged HPT-deformed material contains a high-volume fraction of the ω phase (28%). After ageing, the volume fraction decreases to approximately 9%. This is caused by enhanced volume fraction of the α phase, which reaches 23% in the aged condition.
Table 2.
Volume fraction of individual phases in HPT-deformed Ti15Mo alloy as determined from high energy synchrotron X-ray diffraction (HEXRD). The experimental errors are also shown.
3.2.3. Microhardness Evolution during Ageing
Figure 10 shows the dependence of Vickers microhardness on ageing of the non-deformed and HPT-deformed samples. Ageing of both samples at 400 °C resulted in an abrupt increase of microhardness. In the non-deformed specimen, the microhardness increases with increasing ageing time at 400 °C. On the other hand, in the HPT-deformed sample aged at 400 °C for 1 h the microhardness reaches the maximum (500 HV). With increasing ageing time at 400 °C the microhardness continuously decreases. Specimens aged at 500 °C exhibit lower microhardness than specimens aged at 400 °C. The microhardness of HPT sample aged at 500 °C for 16 h even drops below the microhardness of the non-aged HPT specimen.
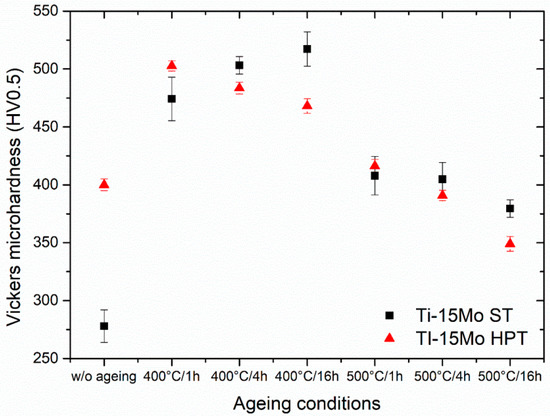
Figure 10.
The evolution of the microhardness during ageing in the non-deformed and HPT-deformed samples.
4. Discussion
4.1. Enhanced α Phase Precipitation
A significant difference in the evolution of α phase in the non-deformed and the HPT-deformed conditions was observed. α phase is known to precipitate preferentially along the grain boundaries as so-called grain boundary α (GB α) [31]. Enhanced α phase precipitation was also found in pre-deformed materials due to the high dislocation density [32,33]. High concentration of defects in the HPT-deformed condition reduce the energy barrier for the nucleation of α phase. The growth of an α nuclei and its coarsening is controlled by the diffusion of Mo (β stabilizing element) in the β matrix [34]. It is well-known known that the pipe diffusion along dislocation cores as well as the diffusion rate along grain boundaries are several orders of magnitude higher than the bulk diffusion [35]. As a consequence, the growth of the α precipitates along grain boundaries is also accelerated. The enhanced precipitation of the α phase in severely deformed metastable β Ti alloys was reported in several studies [36,37]. In the coarse-grained material, α phase particles precipitate in the form of lamellae, because certain mutual orientations of neighboring α and β lattices are associated with the significantly lower interfacial energy and therefore, lamellar shape is optimal for the reduction of the total interfacial energy of a precipitate [38]. On the other hand, α particles in the HPT-deformed materials are equiaxed, but not round—detailed inspection of Figure 5 reveals that particles are rather polygonal and sharp edged. It is assumed that α phase particles nucleate at triple junctions and all observed α particles are in fact GB α.
Ageing of HPT-deformed material (particularly at 400 °C/16 h) resulted in an inhomogeneous precipitation of α particles. Such inhomogeneity was reported to be caused by shear bands formed in the HPT deformed material [36,37,39,40]. However, we did not find any shear bands in the HPT material. On the other hand, we observed chemical inhomogeneities both in the non-deformed and in the HPT-deformed sample. In the latter case, the inhomogeneities are extended in the direction of HPT deformation (cf. Figure 3). As a consequence, the nucleation of the α phase particles may be therefore promoted in the areas depleted in Mo, even if the shape and the scale of precipitation inhomogeneities in Figure 5 cannot be directly compared to Mo-depleted regions in Figure 3 due to very different magnification (zone of observation).
In the specimen aged at 500 °C, ω phase was retained in the non-deformed material while it was completely absent in the HPT-deformed specimen. Enhanced precipitation of the α phase results in the rejection of the β stabilizing Mo to the surrounding β matrix causing a thermodynamic stabilization of the β matrix and suppression of the formation of the ω phase HPT deformed material [26]. Similar behavior, i.e., the preferred α phase precipitation over the formation of the ω phase, was observed in Ti-25Nb-2Mo–4Sn alloy deformed by cold-rolling [41].
4.2. Microhardness Evolution
Microhardness is significantly increased by HPT deformation as discussed in detail in [8] due to the microstructural refinement, the introduction of high dislocation density, and increased content of ω phase. Ageing of both non-deformed and HPT-deformed materials at 400 °C resulted in microhardness increase. Moreover, similar microhardness values were observed in both conditions. However, the similar increase of the microhardness can be attributed to different effects in both conditions.
The hardening of the non-deformed material aged at 400 °C is caused by the ω particles—the nano-sized ω particles are stabilized by diffusion, their size increases, and they act as much stronger obstacles for motion of dislocations. One may assume that a moving dislocation can pass through (cut) ωath particles (known as Friedel effect [42]) as they are small and coherent. It is well known that the shear stress required for a dislocation to pass through a precipitate increases with its increasing size (within the Friedel’s limit) and/or with increasing strength of the obstacle to dislocation motion [42,43]. Due to this and also because of the increasing volume fraction of ω phase, the hardness of the non-deformed material increases with increasing ageing time at 400 °C.
In HPT-deformed material, ageing at 400 °C already for 1 h results in the precipitation of tiny α phase particles, which are incoherent and cause significant Orowan strengthening. On the other hand, ω phase content is relatively low. The decreasing microhardness of the HPT material aged at 400 °C for longer times (4 and 16 h) may be related to the coarsening of the α + β microstructure. Both β matrix grains and α phase precipitates coarsen with increasing ageing time. The same process is even more pronounced during ageing at 500 °C. The microhardness was found to monotonically decrease with increasing ageing temperature and time. The maximum microhardness is therefore achieved in the HPT specimen aged at 400 °C. In a recent study [44], HPT deformation of Ti15Mo/TiB composite was performed at 400 °C and very high microhardness values (650 HV after N = 1 HPT revolution) were achieved.
The microhardness of the non-deformed material aged at 500 °C is inferior to that of the material aged at 400 °C for all ageing times. The relative decrease of microhardness of the non-deformed material with increasing temperature of ageing may be attributed to the decreasing volume fraction and increasing size of ω particles, whose size is well beyond the Friedel’s limit.
Severe plastic deformation of the parent β phase and the introduction of high density of defects significantly accelerates the α phase precipitation. An important additional effect of this enhancement is the reduction of the content of ω phase and its disappearance at comparatively low ageing temperatures.
5. Conclusions
Metastable β titanium Ti15Mo alloy was prepared by HPT and subsequently aged at 400 °C and 500 °C. Phase transformations were observed by XRD and SEM. The following conclusions can be drawn from this study:
Precipitation of the α phase in the HPT-deformed material is significantly enhanced by the high density of lattice defects such as dislocations or grain boundaries, which act as preferential nucleation sites for α phase precipitation.
α phase particles in the non-deformed material precipitate in the form of lamellae, while in the HPT-deformed material, α precipitates are small, equiaxed, and polygonal in shape suggesting that they all formed as grain boundary α at the β grains triple junctions.
Two-phase α + β microstructure continuously coarsens with increasing temperature and time of ageing.
Deformation by HPT significantly increases the microhardness due to microstructural refinement, but also due to the formation of ω phase.
During annealing, the microhardness of the non-deformed material is governed mainly by the evolution of ω phase. In the HPT-deformed material, the main strengthening mechanism is the precipitation of fine α phase particles.
Author Contributions
K.B. conducted SEM experiments, interpreted the results, and wrote the majority of the manuscript. J.S. and M.J. discussed achieved results and wrote parts of the manuscript. A.V. cooperated on SEM observations and microhardness measurements. P.S. interpreted achieved mechanical properties. P.B.-V. conducted HEXRD experiment. F.L. and P.D. conducted laboratory XRD experiments. V.P. and I.S. prepared material by HPT.
Funding
This work was financially supported by the Czech Science Foundation under the project 17-04871S and by ERDF, project No. CZ.02.1.01/0.0/0.0/15_003/0000485. The Deutsches Elektronen-Synchrotron (DESY) is acknowledged for the provision of synchrotron radiation facilities in the framework of the proposal I-20150533 EC. Partial financial support by the Czech Ministry of Education, Youth and Sports under the project LTARF18010 is also gratefully acknowledged.
Conflicts of Interest
The authors declare no conflict of interest.
References
- Boyer, R.R. An overview on the use of titanium in the aerospace industry. Mater. Sci. Eng. A 1996, 213, 103–114. [Google Scholar] [CrossRef]
- Steinemann, S.G. Titanium—the material of choice? Periodontol 2000 1998, 17, 7–21. [Google Scholar] [CrossRef]
- Weiss, I.; Semiatin, S.L. Thermomechanical processing of beta titanium alloys—An overview. Mater. Sci. Eng. A 1998, 243, 46–65. [Google Scholar] [CrossRef]
- Valiev, R.Z.; Islamgaliev, R.K.; Alexandrov, I.V. Bulk nanostructured materials from severe plastic deformation. Prog. Mater. Sci. 2000, 45, 103–189. [Google Scholar] [CrossRef]
- Zhilyaev, A.P.; Langdon, T.G. Using high-pressure torsion for metal processing: Fundamentals and applications. Prog. Mater. Sci. 2008, 53, 893–979. [Google Scholar] [CrossRef]
- Kawabe, Y.; Muneki, S. Strengthening and Toughening of Titanium Alloys. ISIJ Int. 1991, 31, 785–791. [Google Scholar] [CrossRef]
- Valiev, R.Z.; Langdon, T.G. Principles of equal-channel angular pressing as a processing tool for grain refinement. Prog. Mater. Sci. 2006, 51, 881–981. [Google Scholar] [CrossRef]
- Václavová, K.; Stráský, J.; Polyakova, V.; Stráská, J.; Nejezchlebová, J.; Seiner, H.; Semenova, I.; Janeček, M. Microhardness and microstructure evolution of ultra-fine grained Ti-15Mo and TIMETAL LCB alloys prepared by high pressure torsion. Mater. Sci. Eng. A 2017, 682, 220–228. [Google Scholar] [CrossRef]
- Kent, D.; Wang, G.; Yu, Z.; Ma, X.; Dargusch, M. Strength enhancement of a biomedical titanium alloy through a modified accumulative roll bonding technique. J. Mech. Behav. Biomed. 2011, 4, 405–416. [Google Scholar] [CrossRef]
- Yilmazer, H.; Niinomi, M.; Nakai, M.; Cho, K.; Hieda, J.; Todaka, Y.; Miyazaki, T. Mechanical properties of a medical β-type titanium alloy with specific microstructural evolution through high-pressure torsion. Mater. Sci. Eng. C 2013, 33, 2499–2507. [Google Scholar] [CrossRef]
- Janeček, M.; Čížek, J.; Stráský, J.; Václavová, K.; Hruška, P.; Polyakova, V.; Gatina, S.; Semenova, I. Microstructure evolution in solution treated Ti15Mo alloy processed by high pressure torsion. Mater. Charact. 2014, 98, 233–240. [Google Scholar] [CrossRef]
- Ivasishin, O.M.; Markovsky, P.E.; Semiatin, S.L.; Ward, C.H. Aging response of coarse- and fine-grained β titanium alloys. Mater. Sci. Eng. A 2005, 405, 296–305. [Google Scholar] [CrossRef]
- Makino, T.; Chikaizumi, R.; Nagaoka, T.; Furuhara, T.; Makino, T. Microstructure development in a thermomechanically processed Ti15V3Cr3Sn3Al alloy. Mater. Sci. Eng. A 1996, 213, 51–60. [Google Scholar] [CrossRef]
- Barriobero-Vila, P.; Requena, G.; Schwarz, S.; Warchomicka, F.; Buslaps, T. Influence of phase transformation kinetics on the formation of α in a β-quenched Ti–5Al–5Mo–5V–3Cr–1Zr alloy. Acta Mater. 2015, 95, 90–101. [Google Scholar] [CrossRef]
- Barriobero-Vila, P.; Requena, G.; Warchomicka, F.; Stark, A.; Schell, N.; Buslaps, T. Phase transformation kinetics during continuous heating of a β-quenched Ti–10V–2Fe–3Al alloy. J. Mater. Sci. 2015, 50, 1412–1426. [Google Scholar] [CrossRef]
- Zheng, Y.; Williams, R.E.A.; Sosa, J.M.; Talukder, A.; Wang, Y.; Banerjee, R.; Fraser, H.L. The indirect influence of the ω phase on the degree of refinement of distributions of the α phase in metastable β-Titanium alloys. Acta Mater. 2016, 103, 165–173. [Google Scholar] [CrossRef]
- Zheng, Y.; Williams, R.E.A.; Wang, D.; Shi, R.; Nag, S.; Kami, P.; Banerjee, R.; Wang, Y.; Fraser, H.L. Role of ω phase in the formation of extremely refined intragranular α precipitates in metastable β-titanium alloys. Acta Mater. 2016, 103, 850–858. [Google Scholar] [CrossRef]
- Li, T.; Kent, D.; Sha, G.; Liu, H.; Fries, S.G.; Ceguerra, A.V.; Dargusch, M.S.; Cairney, J.M. Nucleation driving force for ω-assisted formation of α and associated ω morphology in β-Ti alloys. Scripta Mater. 2018, 155, 149–154. [Google Scholar] [CrossRef]
- Zháňal, P.; Harcuba, P.; Hájek, M.; Smola, B.; Stráský, J.; Šmilauerová, J.; Veselý, J.; Janeček, M. Evolution of ω phase during heating of metastable β titanium alloy Ti–15Mo. J. Mater. Sci. 2018, 53, 837–845. [Google Scholar] [CrossRef]
- Nag, S.; Banerjee, R.; Srinivasan, R.; Hwang, J.Y.; Harper, M.; Fraser, H.L. ω-Assisted nucleation and growth of α precipitates in the Ti–5Al–5Mo–5V–3Cr–0.5Fe β titanium alloy. Acta Mater. 2009, 57, 2136–2147. [Google Scholar] [CrossRef]
- Šmilauerová, J.; Harcuba, P.; Kriegner, D.; Holý, V. On the completeness of the β→ω transformation in metastable β titanium alloys. J. Appl. Crystallogr. 2017, 50, 283–287. [Google Scholar] [CrossRef]
- Kuan, T.S.; Ahrens, R.R.; Sass, S.L. The stress-induced omega phase transformation in Ti-V alloys. Metall. Trans. A 1975, 6, 1767–1774. [Google Scholar] [CrossRef]
- Zháňal, P.; Harcuba, P.; Šmilauerová, J.; Stráský, J.; Janeček, M.; Smola, B.; Hájek, M. Phase Transformations in Ti-15Mo Investigated by in situ Electrical Resistance. Acta Phys. Pol. A 2015, 128, 779–783. [Google Scholar] [CrossRef]
- Devaraj, A.; Nag, S.; Srinivasan, R.; Williams, R.E.A.; Banerjee, S.; Banerjee, R.; Fraser, H.L. Experimental evidence of concurrent compositional and structural instabilities leading to ω precipitation in titanium–molybdenum alloy. Acta Mater. 2012, 60, 596–609. [Google Scholar] [CrossRef]
- Valiev, R.Z.; Ivanisenko, Y.V.; Rauch, E.F.; Baudelet, B. Structure and deformaton behaviour of Armco iron subjected to severe plastic deformation. Acta Mater. 1996, 44, 4705–4712. [Google Scholar] [CrossRef]
- Václavová, K.; Stráský, J.; Zháňal, P.; Veselý, J.; Polyakova, V.; Semenova, I.; Janeček, M. Ultra-fine grained microstructure of metastable beta Ti-15Mo alloy and its effects on the phase transformations. IOP Conf. Ser. Mater. Sci. Eng. 2017, 194, 012021. [Google Scholar] [CrossRef]
- Schell, N.; King, A.; Beckmann, F.; Fischer, T.; Müller, M.; Schreyer, A. The High Energy Materials Science Beamline (HEMS) at PETRA III. Mater. Sci. Forum 2014, 772, 57–61. [Google Scholar] [CrossRef]
- Dollase, W.A. Correction of intensities for preferred orientation in powder diffractometry: Application of the March model. J. Appl. Crystallogr. 1986, 19, 267–272. [Google Scholar] [CrossRef]
- Bartha, K. Phase transformation in ultra-fine grained titnaium alloys. Ph.D. Thesis, Charles University, Prague, Czech Republic, 19 June 2019. [Google Scholar]
- Hauk, V. Structural and Residual Stress Analysis by Nondestructive Methods, 1st ed.; Elsevier: Amsterdam, Netherlands, 1997. [Google Scholar]
- Šmilauerová, J.; Janeček, M.; Harcuba, P.; Stráský, J.; Veselý, J.; Kužel, R.; Rack, H.J. Ageing response of sub-transus heat treated Ti–6.8Mo–4.5Fe–1.5Al alloy. J. Alloy. Compd. 2017, 724, 373–380. [Google Scholar] [CrossRef]
- Furuhara, T.; Nakamori, H.; Maki, T. Crystallography of α Phase Precipitated on Dislocations and Deformation Twin Boundaries in a β Titanium Alloy. Mater. Trans. JIM 1992, 33, 585–595. [Google Scholar] [CrossRef]
- Zhang, B.; Yang, T.; Huang, M.; Wang, D.; Sun, Q.; Wang, Y.; Sun, J. Design of uniform nano α precipitates in a pre-deformed β-Ti alloy with high mechanical performance. J. Mater. Res. Technol. 2019, 8, 777–787. [Google Scholar] [CrossRef]
- Semiatin, S.L.; Knisley, S.L.; Fagin, P.N.; Barker, D.R.; Zhang, F. Microstructure evolution during alpha-beta heat treatment of Ti-6Al-4V. Metall. Mater. Trans. A 2003, 34, 2377–2386. [Google Scholar] [CrossRef]
- Legros, M.; Dehm, G. Obsevation of Giant diffusivitiy along dislocation core. Science 2008, 319, 1646–1649. [Google Scholar] [CrossRef] [PubMed]
- Jiang, B.; Tsuchiya, K.; Emura, S.; Min, X. Effect of High-Pressure Torsion Process on Precipitation Behavior of α Phase in β-Type Ti–15Mo Alloy. Mater. Trans. 2014, 55, 877–884. [Google Scholar] [CrossRef]
- Zafari, A.; Xia, K. Formation of equiaxed α during ageing in a severely deformed metastable β Ti alloy. Scr. Mater. 2016, 124, 151–154. [Google Scholar] [CrossRef]
- Furuhara, T.; Makino, T.; Idei, Y.; Ishigaki, H.; Takada, A.; Maki, T. Morphology and Crystallography of α Precipitates in β Ti–Mo Binary Alloys. Mater. Trans. JIM 1998, 39, 31–39. [Google Scholar] [CrossRef]
- Xu, W.; Wu, X.; Stoica, M.; Calin, M.; Kühn, U.; Eckert, J.; Xia, K. On the formation of an ultrafine-duplex structure facilitated by severe shear deformation in a Ti–20Mo β-type titanium alloy. Acta Mater. 2012, 60, 5067–5078. [Google Scholar] [CrossRef]
- Xu, W.; Edwards, D.P.; Wu, X.; Stoica, M.; Calin, M.; Kühn, U.; Eckert, J.; Xia, K. Promoting nano/ultrafine-duplex structure via accelerated α precipitation in a β-type titanium alloy severely deformed by high-pressure torsion. Scr. Mater. 2013, 68, 67–70. [Google Scholar] [CrossRef]
- Guo, S.; Meng, Q.; Hu, L.; Liao, G.; Zhao, X.; Xu, H. Suppression of isothermal ω phase by dislocation tangles and grain boundaries in metastable β-type titanium alloys. J. Alloy. Compd. 2013, 550, 35–38. [Google Scholar] [CrossRef]
- Friedel, J. Dislocations, 1st ed.; Smoluchovski, R., Kurti, N., Eds.; Pergamon Press: Oxford, UK, 1964. [Google Scholar]
- Labusch, R. A Statistical Theory of Solid Solution Hardening. Phys. Status Solidi (b) 1970, 41, 659–669. [Google Scholar] [CrossRef]
- Zherebtsov, S.; Ozerov, M.; Klimova, M.; Stepanov, N.; Vershinina, T.; Ivanisenko, Y.; Salishchev, G. Effect of High-Pressure Torsion on Structure and Properties of Ti-15Mo/TiB Metal-Matrix Composite. Materials 2018, 11, 2426. [Google Scholar] [CrossRef] [PubMed]
© 2019 by the authors. Licensee MDPI, Basel, Switzerland. This article is an open access article distributed under the terms and conditions of the Creative Commons Attribution (CC BY) license (http://creativecommons.org/licenses/by/4.0/).