Article

Texture Evolution and Anisotropy of Plastic Flow in Hot Compression of Extruded ZK60-T5 Magnesium Alloy Plate

1
Department of Mechanical Engineering, McMaster University, Hamilton, ON L8S 4L7, Canada
2
Department of Biomedical Engineering, City University of Hong Kong, Tat Chee Avenue, Kowloon, Hong Kong
3
Independent Researcher, (formerly with City University of Hong Kong), No. 2/B, Vinayaka Nagar, Hebbal, Bengaluru, 560024, India
*
Author to whom correspondence should be addressed.
Currently with Marine Additive Manufacturing Centre of Excellence (MAMCE), University of New Brunswick, 15 Dineen Drive, P.O. Box 4400 Fredericton, NB, Canada.
Metals 2019, 9(11), 1170; https://doi.org/10.3390/met9111170
Submission received: 24 September 2019 / Revised: 20 October 2019 / Accepted: 25 October 2019 / Published: 30 October 2019

Abstract

:
The texture evolution during hot compression of extruded ZK60A-T5 magnesium alloy plate loaded along the extrusion direction (ED) and the normal direction (ND) has been examined with the help of pole figures obtained on specimens deformed in the ranges of 200 °C to 500 °C and 0.0003 s−1 to 10 s−1. The results are interpreted in terms of the operating slip systems and mechanisms identified based on processing maps developed for the above two initial specimen orientations. The processing map for the initial ED orientation exhibited three domains. In Domains 1 and 3, first-order pyramidal slip {10 1 ¯ l} <11 2 ¯ 0> occurs, while in Domain 2, second-order pyramidal slip {11 2 ¯ 2} <11 2 ¯ 3> occurs. The pole figures obtained on specimens deformed in Domains 1 and 3 are strikingly similar, indicating that the operating slip system controls the texture evolution. Compression in Domains 1 and 3 nearly randomizes the intense basal texture in the as-received specimens, while a new texture is generated in Domain 2 with basal poles at 45° to ND or transverse direction (TD). This new texture will promote basal slip when loaded in a transverse direction. When loaded in the normal direction (ND), the processing map exhibited four domains. In Domains 1 and 4, {10 1 ¯ l} <11 2 ¯ 3> slip occurs, while {11 2 ¯ 2} <11 2 ¯ 3> slip occurs in Domains 2 and 3. The pole figures obtained from specimens deformed in Domains 1 and 4 have similar features, while those deformed in Domains 2 and 3 exhibited similar features to one another, confirming that the operating slip systems control the texture development since they are the same in each pair. The compression along ND produces strong basal textures with the basal planes normal to the ED. The texture gets intensified with increased temperature of deformation and causes strong anisotropy in mechanical properties.

Graphical Abstract

1. Introduction

Given the availability of a limited number of slip systems in Mg at room temperature, thermo-mechanical processing is usually carried out at elevated temperatures to take advantage of the plasticity offered by the non-basal slip systems [1,2,3]. Conditions that promote superplastic deformation, such as the generation of fine grain microstructure by equal-channel angular pressing (ECAP) have been explored in the literature to improve the thermo-mechanical response of Mg alloys [4,5,6,7]. Wrought Mg alloys generate strong crystallographic texture during mechanical processing which depends not only on the deformation conditions but also on the geometry and state-of-stress [8,9,10,11,12,13,14]. Although it is well known that Mg alloys with different initial crystal orientations or textures exhibit anisotropy of mechanical properties, such as yield strength, strain hardening, and ductility [8,9,10,11,12,13,14], hot working behavior is also texture dependent [15,16,17]. This is attributed to changes in active slip systems and associated recovery mechanisms caused by the different specimen loading directions.
Age-hardenable alloy ZK60 (Mg-6Zn-0.5Zr) is one of the high strength wrought Mg alloys being widely used for automotive components [18]. A critical microstructural change that occurs during the deformation of extruded ZK60 is the development of texture, which depends on the loading direction if the starting material has preferred orientation, and on the temperature and strain rate conditions of deformation. Hot deformation behavior of extruded (but not aged) ZK60 alloy was investigated by compression tests along the extrusion direction in the temperature range of 250–400 °C and strain rate range of 0.001–1 s−1 [19], and its processing map revealed a domain of superplasticity and flow instability regions. In another study [20], the occurrence of twinning was reported for the hot deformation of an extruded Mg-Zn-Zr alloy which was subjected to compression testing along the extrusion direction at temperatures of 350–450 °C and strain rates of 0.01–10 s−1. The formation of twins even under such higher temperatures was due to the strong initial texture in the as-extruded condition. During the creep studies on extruded ZK60 under a wide range of applied stress in the temperature range between 100–300 °C [21], superplastic behavior by the diffusion-controlled mechanisms were observed at 300 °C and at 0.005 s−1. A. Hadadzadeh et al. [22] studied the hot deformation behavior of as-extruded ZK60 by machining the compression samples from the billet in both the extrusion and radial directions. The tests were performed over the temperature range of 300–450 °C under strain rates of 0.001–1 s−1 and processing maps were developed. Wang et al. [23] studied the evolution of texture during hot rolling of cast ZK60 alloy and reported the mechanisms affecting the activity of non-basal slip. Most of the available studies in the literature on the hot workability of ZK60 alloy are only in the as-extruded condition, in billet form, and with characterization limited to along the extrusion direction. The role of initial texture on the hot deformation behavior of extruded ZK60 alloy plate in T5 treated condition along extrusion direction and normal direction at a wide range of temperatures (200–500 °C) and strain rates (0.0003–10 s−1) has not been documented.
For this alloy, the operating slip systems and the mechanisms of deformation in ZK60 alloy loaded in two orthogonal directions in wide temperature and strain rate ranges have been identified earlier [24] using processing maps by the present authors. The aim of the present investigation is to establish a correlation between the dynamic recrystallization (DRX) mechanisms exhibited in the various domains of processing maps [24] for extruded ZK60A-T5 alloy plate specimens, with the evolution of texture and anisotropy of deformation. To serve as a ready reference for correlation, a brief summary of the results on processing maps published earlier [24] for ZK60 plate will be recalled first, which will be followed by the texture characterization of deformed specimens.

2. Experimental Details

The material used in the study was an extruded and T5 treated (artificially aged by heating to 150 °C for 24 h) commercial ZK60A magnesium alloy plate received from Magnesium Elektron, OH, USA. The composition of the alloy is 6.2 wt% Zn, 0.45 wt% Zr, and the remainder is Mg. For uniaxial compression testing, cylindrical specimens of 11 mm diameter and 14 mm height were machined from the as-extruded plate keeping the compression direction either along the extrusion direction (ED) and normal to the extruded plane (ND, normal direction) as shown schematically in Figure 1. The tests in the extrusion and normal directions are referred to as ZK60(T5)_ED and ZK60(T5)_ND, respectively, and conducted at constant true strain rates in the range of 0.0003 s−1 to 10 s−1 and temperature range of 200 °C to 500 °C (at an interval of 50 °C). The test details were provided in an earlier publication [24]. The specimens were deformed up to a true strain of about 0.8 and then quenched in water. Post-compressed specimens were sectioned in the center parallel to the compression axis, and the cut surface was cold-mounted for grinding and polishing. The sequential polishing was performed by 9 μm, 3 μm, and 1 μm size diamond paste followed by 0.05 μm colloidal silica slurry. Texture measurements were taken on the mirror-like smooth surfaces of the polished specimens. Based on the flow stress variation with temperature and true strain rate at a steady-state strain, processing maps were developed using a procedure given earlier [25]. With the help of processing maps, the hot working mechanisms occurring in extruded ZK60 alloy deformed in two orthogonal directions (ED and ND) were established [24].
X-ray diffraction (XRD) experiments were carried out using the Bruker D8 Discover diffractometer (Beerlika, MA, USA) equipped with a Vantec 500 area detector (Yokohama, Japan), cobalt-sealed tube source, Chi cradle, and parallel-focus Goebel mirror. The distance between the sample and the detector was 20 cm. The wavelength of the cobalt-sealed tube source was 1.79026 Å, voltage was 35 kV, and the current was 45 mA. No corrections were applied for the defocussing effect as the flat detector has minimal defocusing with the factor of about 1. The textures of the as-received plate and deformed specimens were obtained by plotting the pole figures. GADDS software was used to analyze and plot the output texture data in the form of pole figures. The compression axis has been chosen along the horizontal axis of the pole figures.

3. Microstructure and Texture of the As-Received ZK60A-T5 Alloy Plate

The microstructures as revealed by EBSD (Electron Backscatter Diffraction) inverse pole figure (IPF) maps obtained on the as-received material on ED-ND (longitudinal cross-section) and ED-TD (extruded plane), are given in Figure 2a,b, respectively. The microstructure on the ED-ND plane consists of a mixture of grain sizes ranging from larger (10–15 µm) to finer (2–3 µm) equiaxed grains along with stringers of MgZn particles aligned in the extrusion direction. On the other hand, on the ED-TD plane, the microstructure is more homogeneous and has an average grain size of 10–15 µm.
XRD pole figures measured on the three planes, ED-ND, ED-TD, and TD-ND orientations are shown in Figure 3a–c, respectively. Figure 3a shows that a strong basal texture is formed during the extrusion of ZK60-T5 alloy, which consists of the basal planes {0001} parallel to the ED-TD plane and <10 1 ¯ 0> direction along ED. The basal pole intensity is about 12.6 times the random, which may be termed as a strong texture. Figure 3b (ED-TD plane) presents a strong ellipsoidal basal texture, suggesting that the basal planes are parallel to ED-TD plane and are tilted with a spread around ND. Figure 3c (ND-TD plane) confirms the above observations on texture.

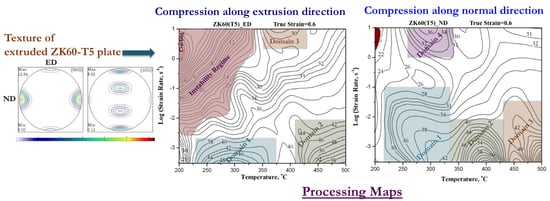
4. Processing Maps for Hot Deformation of Extruded ZK60 Plate by Present Authors: A Brief Summary of Earlier Results

Figure 4a,b show the reanalyzed processing maps at a true strain of 0.6 for ED and ND orientations, respectively. The details of the domain conditions in the processing maps are given in Table 1, which are very similar to the maps developed at a true strain of 0.5 [24]. The strain does not have a significant influence on the processing maps once the flow curves have attained a steady state. However, minor changes along the temperature axis and in maximum peak-efficiency values may be noticed. The domains appearing in the maps at a strain of 0.5 were interpreted earlier with the help of detailed microstructures, ductility variations, and kinetic analysis [24] and the operating slip systems and recovery mechanisms identified are given in Table 1. A comparison of the maps obtained for the two different loading directions reveals that Domain 1 in the map for ND loading has moved to a lower temperature. Similarly, Domain 4 occurring at higher strain rates (>1 s−1) is similar to Domain 3 in the map for ED loading but appears at lower temperatures. Furthermore, the processing map for ND orientation (Figure 4b) does not exhibit a regime of flow instability unlike that for in the map for ED orientation (Figure 4a) where a wide instability and cracking regime occurs at lower temperatures and higher strain rates. These differences are explained in term of the occurrence of {10 1 ¯ l} <11 2 ¯ 3> slip system in the ND orientation caused by the c-axis compression as observed in the Mg single crystals [26,27].

5. Results and Discussion: Texture Evolution and Anisotropy of Flow in Hot Compression

5.1. Shapes of Deformed Specimens

The shapes of the compression specimens after deformation for ED loading and ND loading are distinctly different. Typically, ED specimens deformed uniformly to a final nearly-circular cross-section, while ND specimens exhibited an elliptical shape after deformation due to the flow anisotropy caused by the initial texture, as seen in Figure 5. To quantify the level of flow anisotropy after compression, final minor and major diameters of the specimens were measured. The ratio of minor to the major radius (Rmin/Rmaj) represents the ‘degree of roundness’; the value of ‘unity’ is equivalent to a near-circular shape and isotropic deformation. The effect of deformation conditions, such as temperature and strain rate on the level of flow anisotropy for both ED and ND specimens is shown in Figure 6. For most of the ED samples (except the ones that were cracked at lower temperatures and at 10 s−1), Rmin/Rmaj ratio is higher than 0.85, indicating better isotropic deformation. On the other hand, ND specimens exhibited a pronounced sensitivity to the deformation temperature and strain rate. For deformation in ND, less flow anisotropy is observed during the deformation at higher temperatures and lower strain rates, whereas more elliptical shapes evolved for the compression tests performed at higher strain rates of 10 and 1 s−1. Although the flow is anisotropic in ND samples (i.e., lower values of Rmin/Rmaj) than those of the ED samples, at given processing conditions of temperature and strain rate, the yield stress and peak stress values for ND samples are less than those of the ED samples [24]. It indicates that the occurrence of slip is easier in ND samples with the activity of first-order pyramidal slip at lower temperatures and second-order pyramidal slip at higher temperatures. Due to this, the processing map of ND did not exhibit flow instability. In the case of ED orientation, plastic flow at lower temperatures (<300 °C) occurred by limited prismatic slip and twinning, and produced flow instability. The deformation mechanisms are discussed in detail in the following sections.

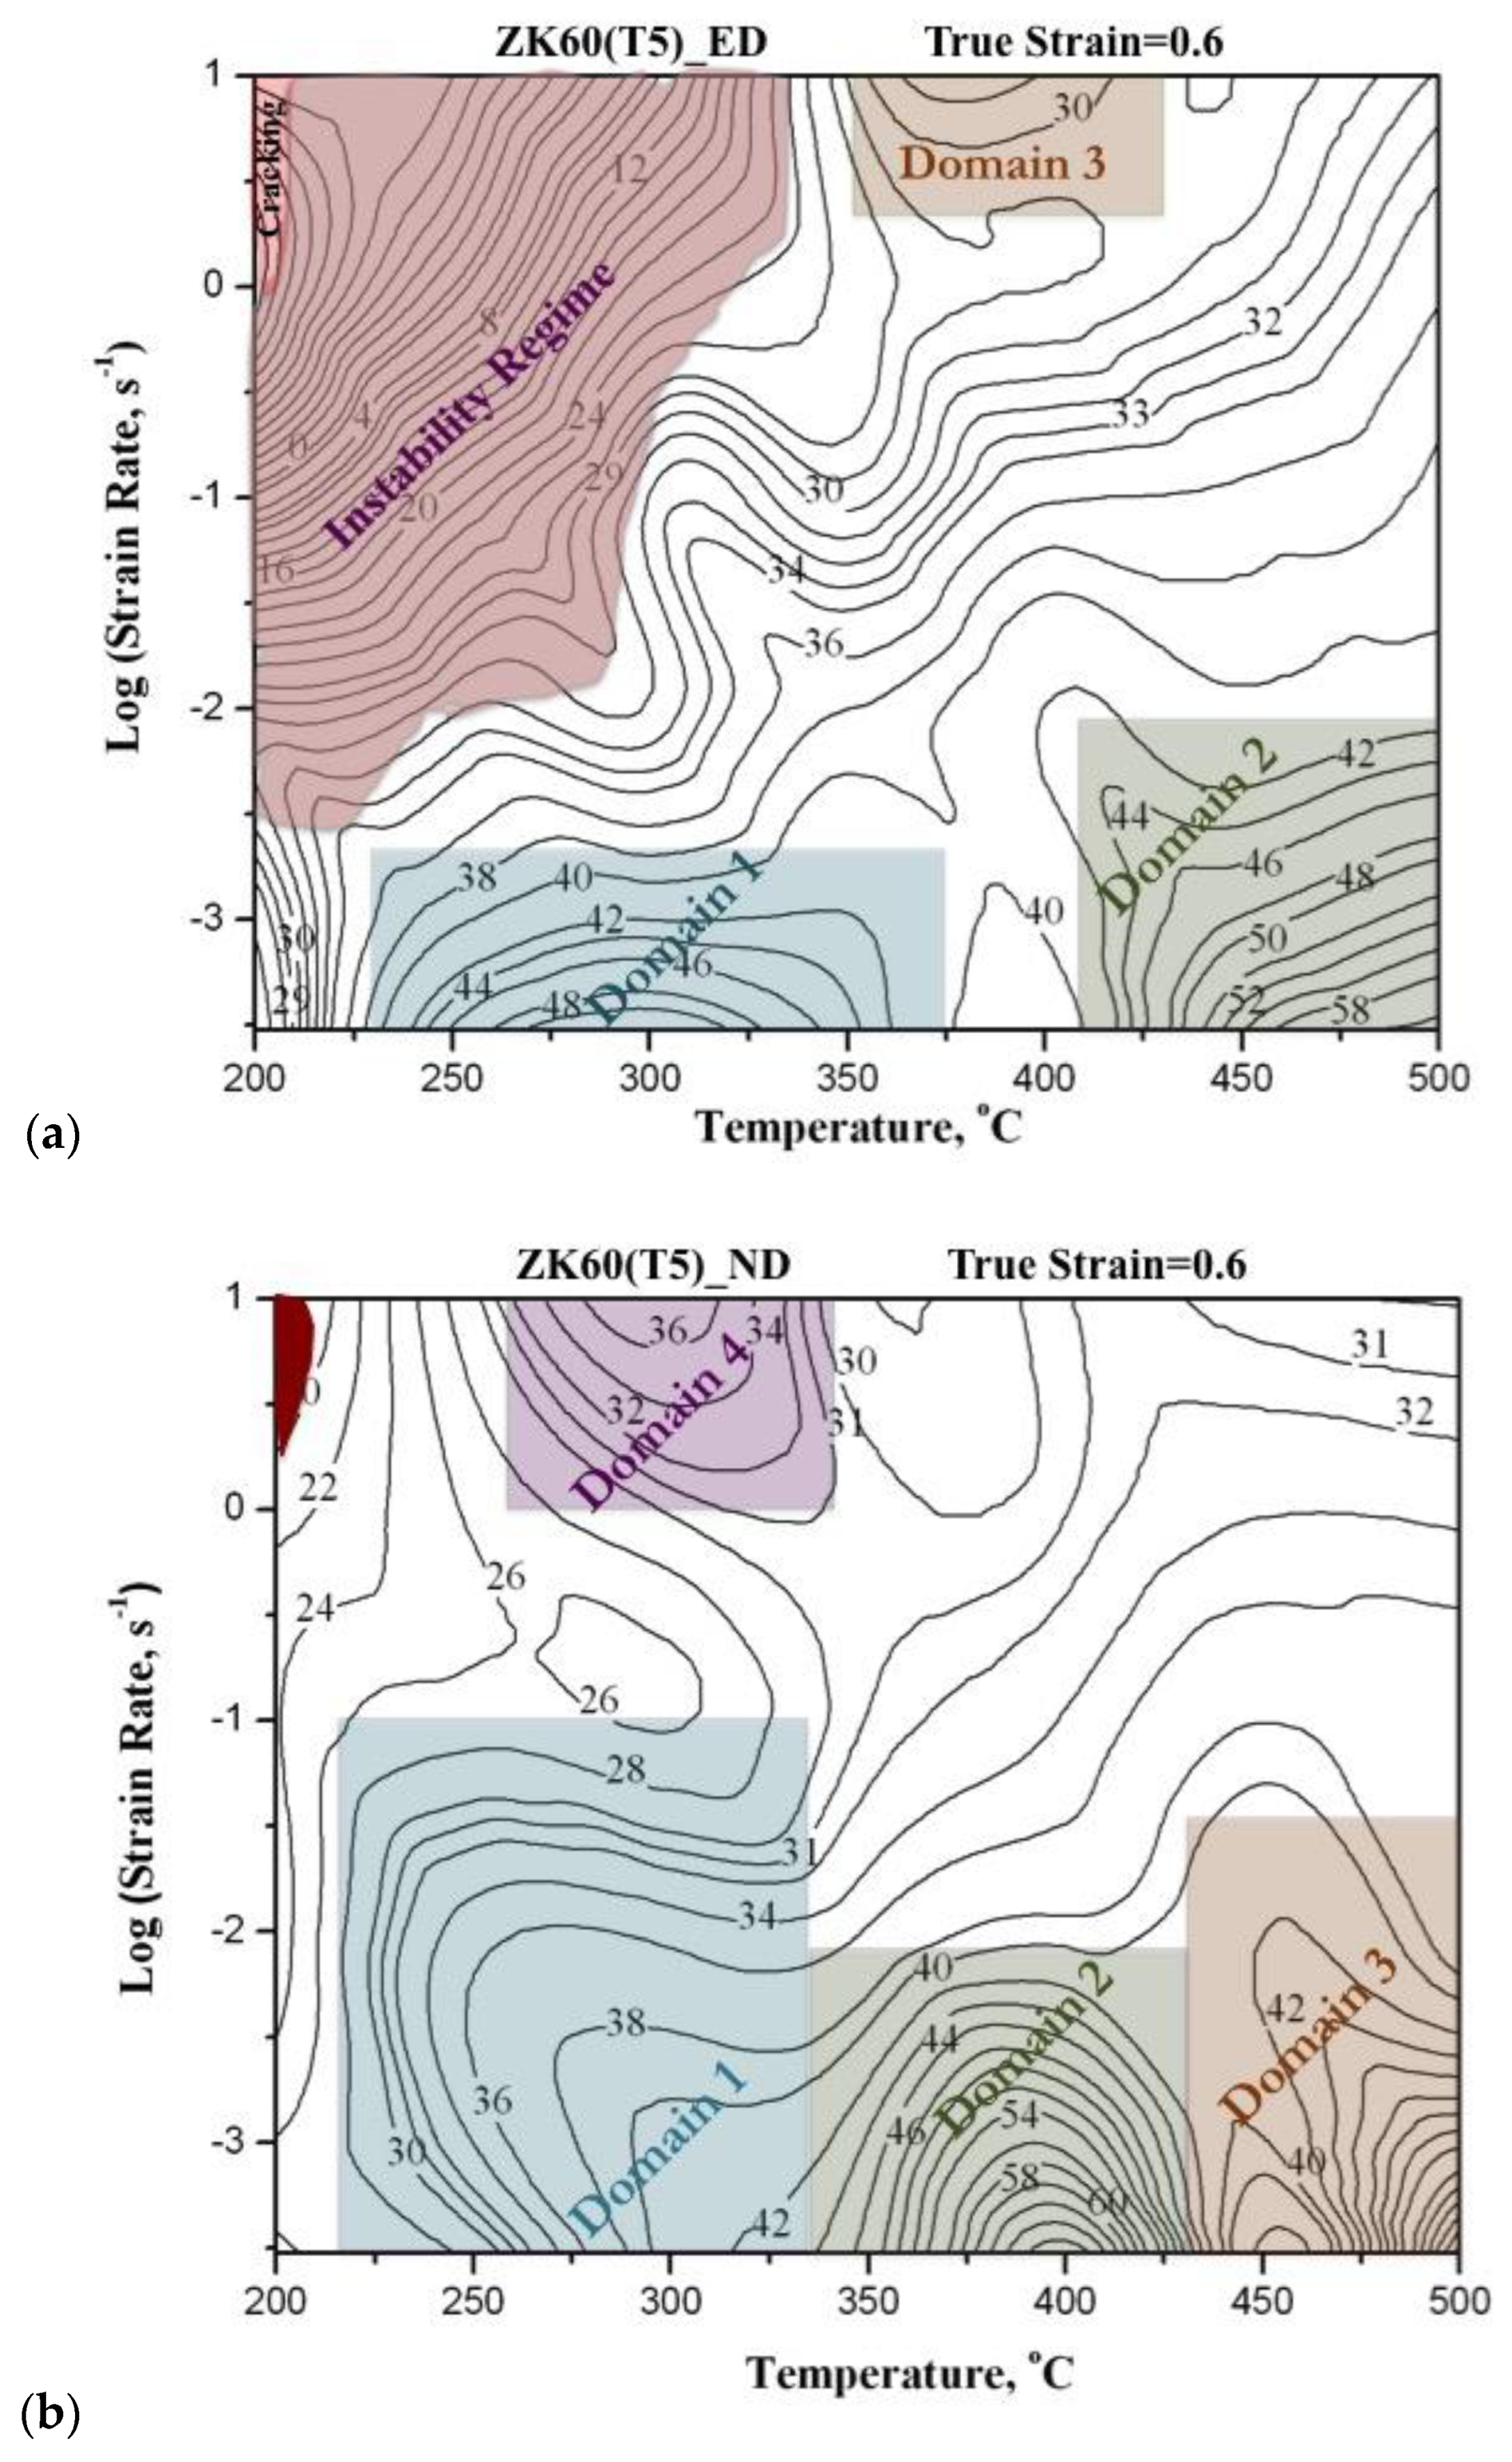
5.2. Microstructural Analysis

Optical microstructures of the specimens compressed along the extrusion direction (ED specimens) at conditions of peak-efficiency corresponding to the three domains of the ED processing map are shown in Figure 7a–c. All microstructures confirmed the occurrence of the dynamic recrystallization (DRX). The evolved grain size is smaller in Figure 7a,c due to the lower temperature deformation. Corrugated features of grain boundaries represent the characteristic feature of DRX. In Figure 7b, the grain size is larger as the deformation temperature (500 °C) is higher, which causes grain boundary migration. At this condition, grain boundaries are straight and formed a diamond-shape configuration.
The microstructures of ND specimens (i.e., compressed along the ND direction) deformed under peak-efficiency conditions of domains 1 to 4 from the ND processing map are shown in Figure 8a,d. All microstructures suggest the occurrence of DRX. The evolved grain size is finer in Domains 1,2, and 4 and is larger in Domain 3 that occurs at higher temperature.

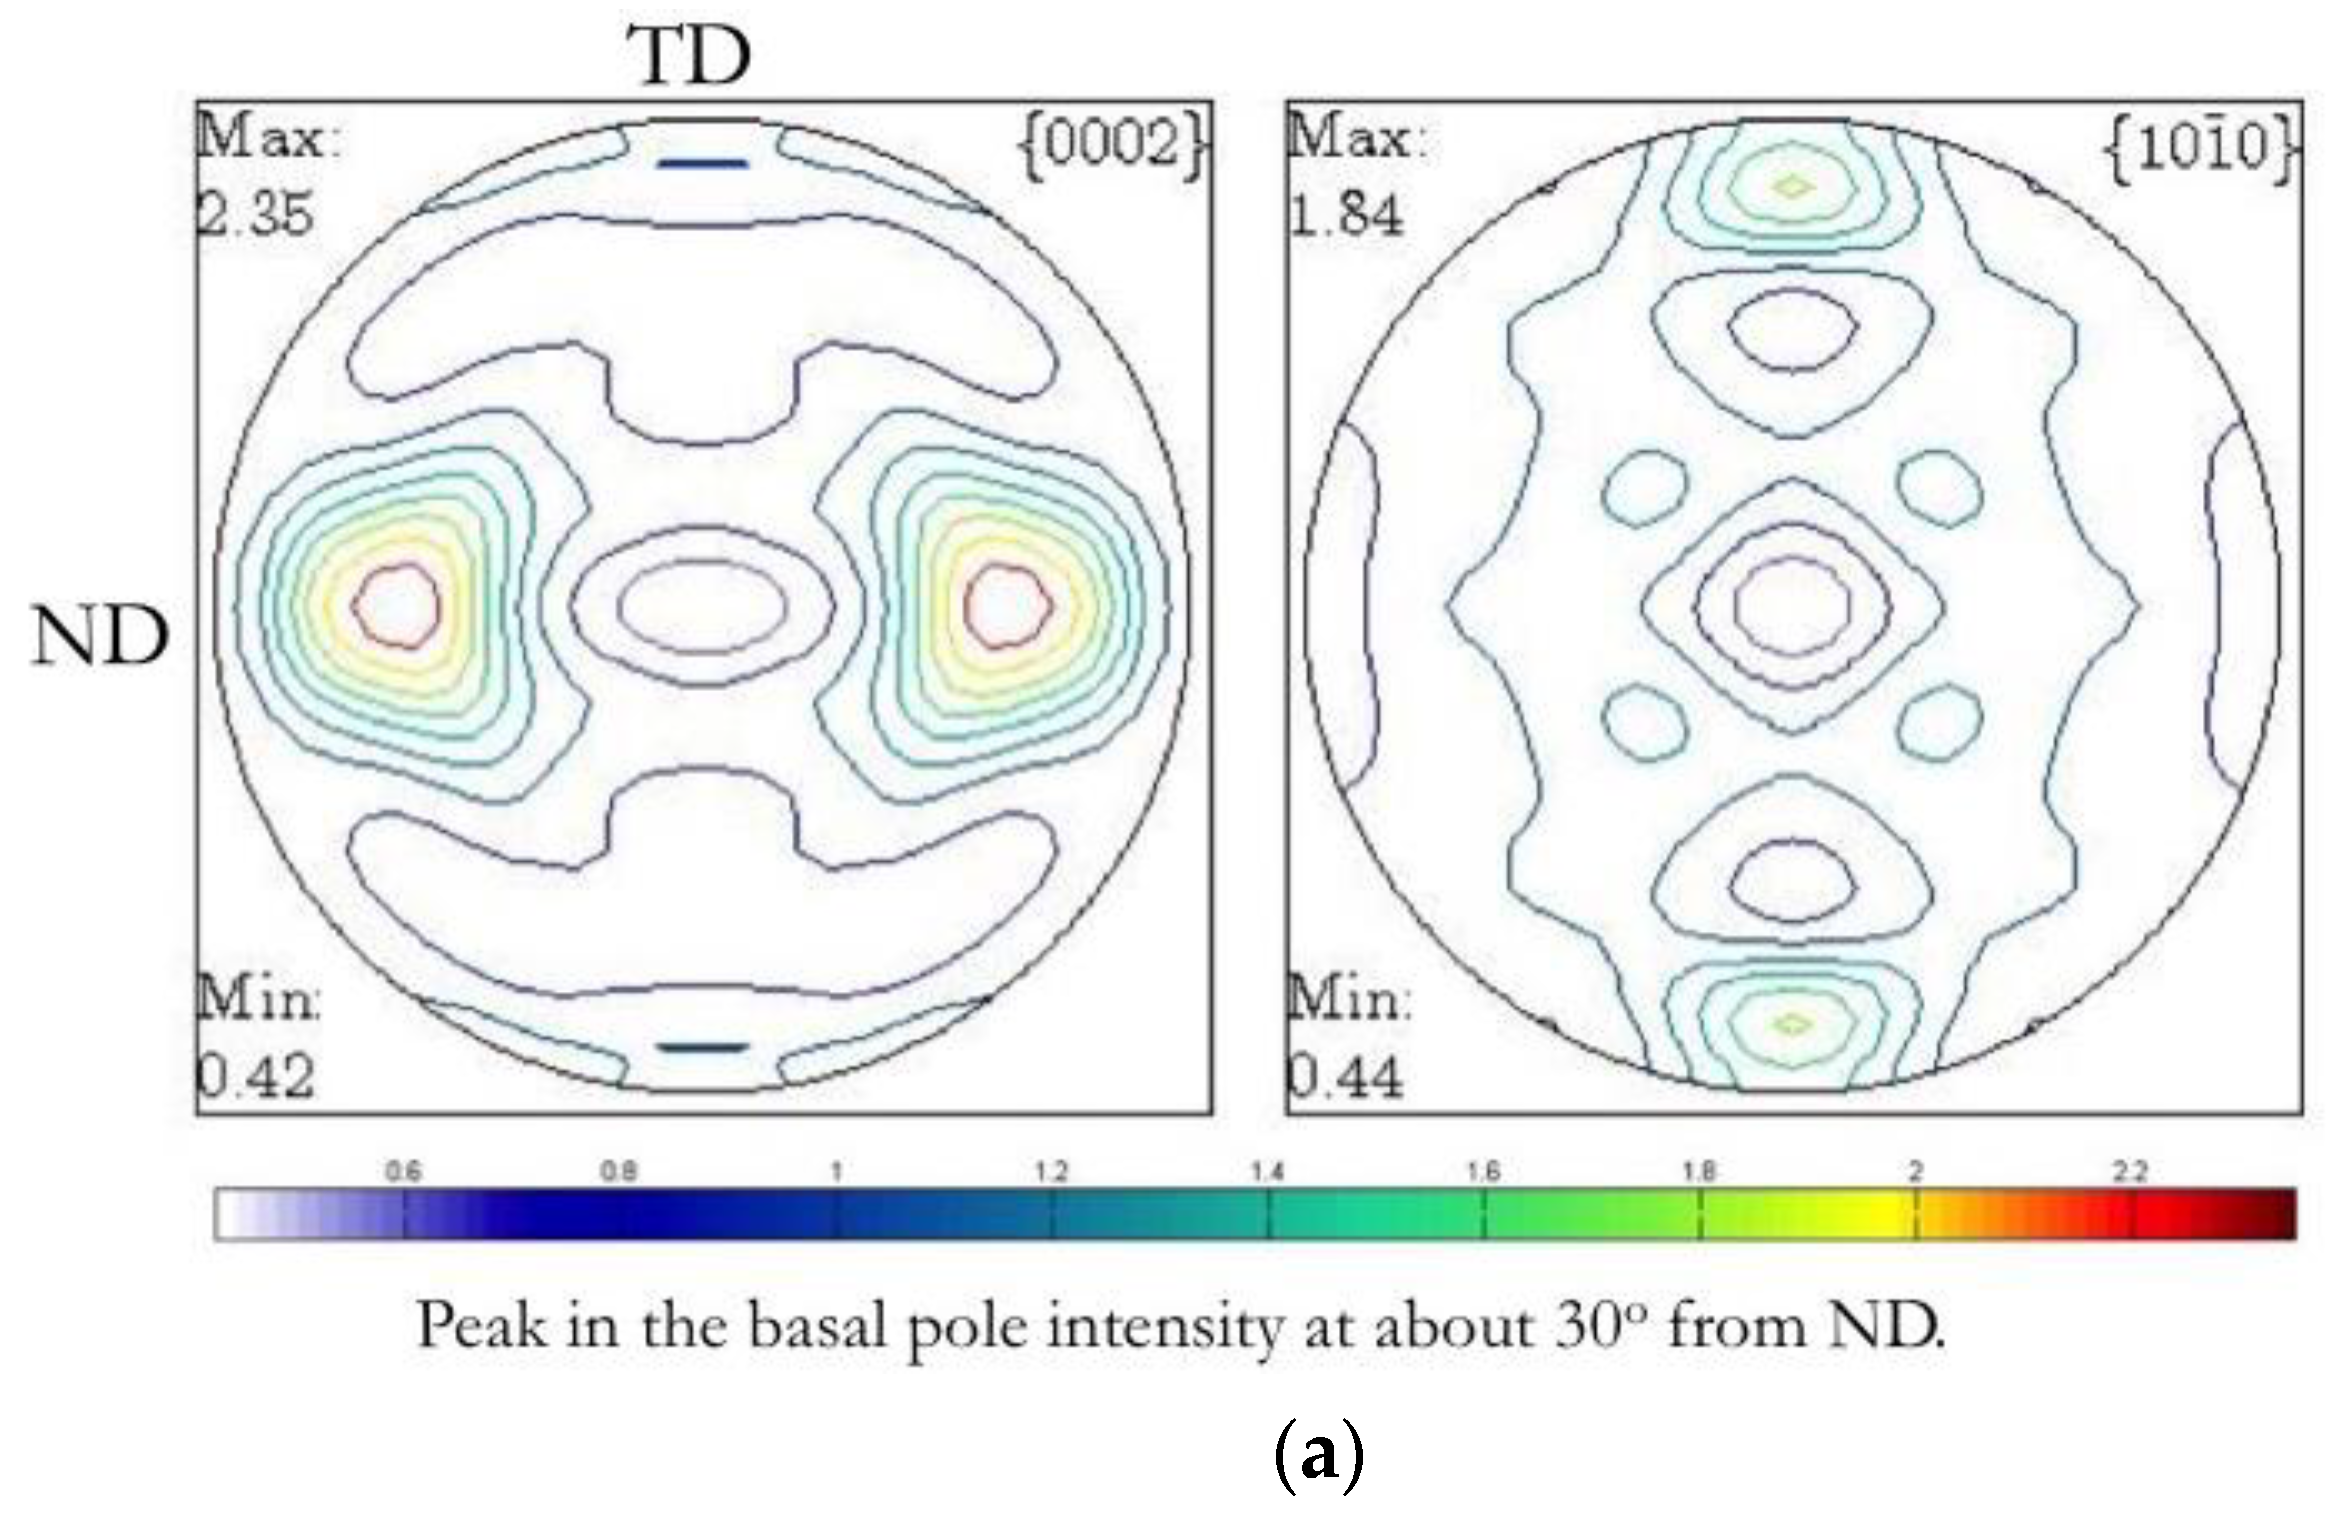
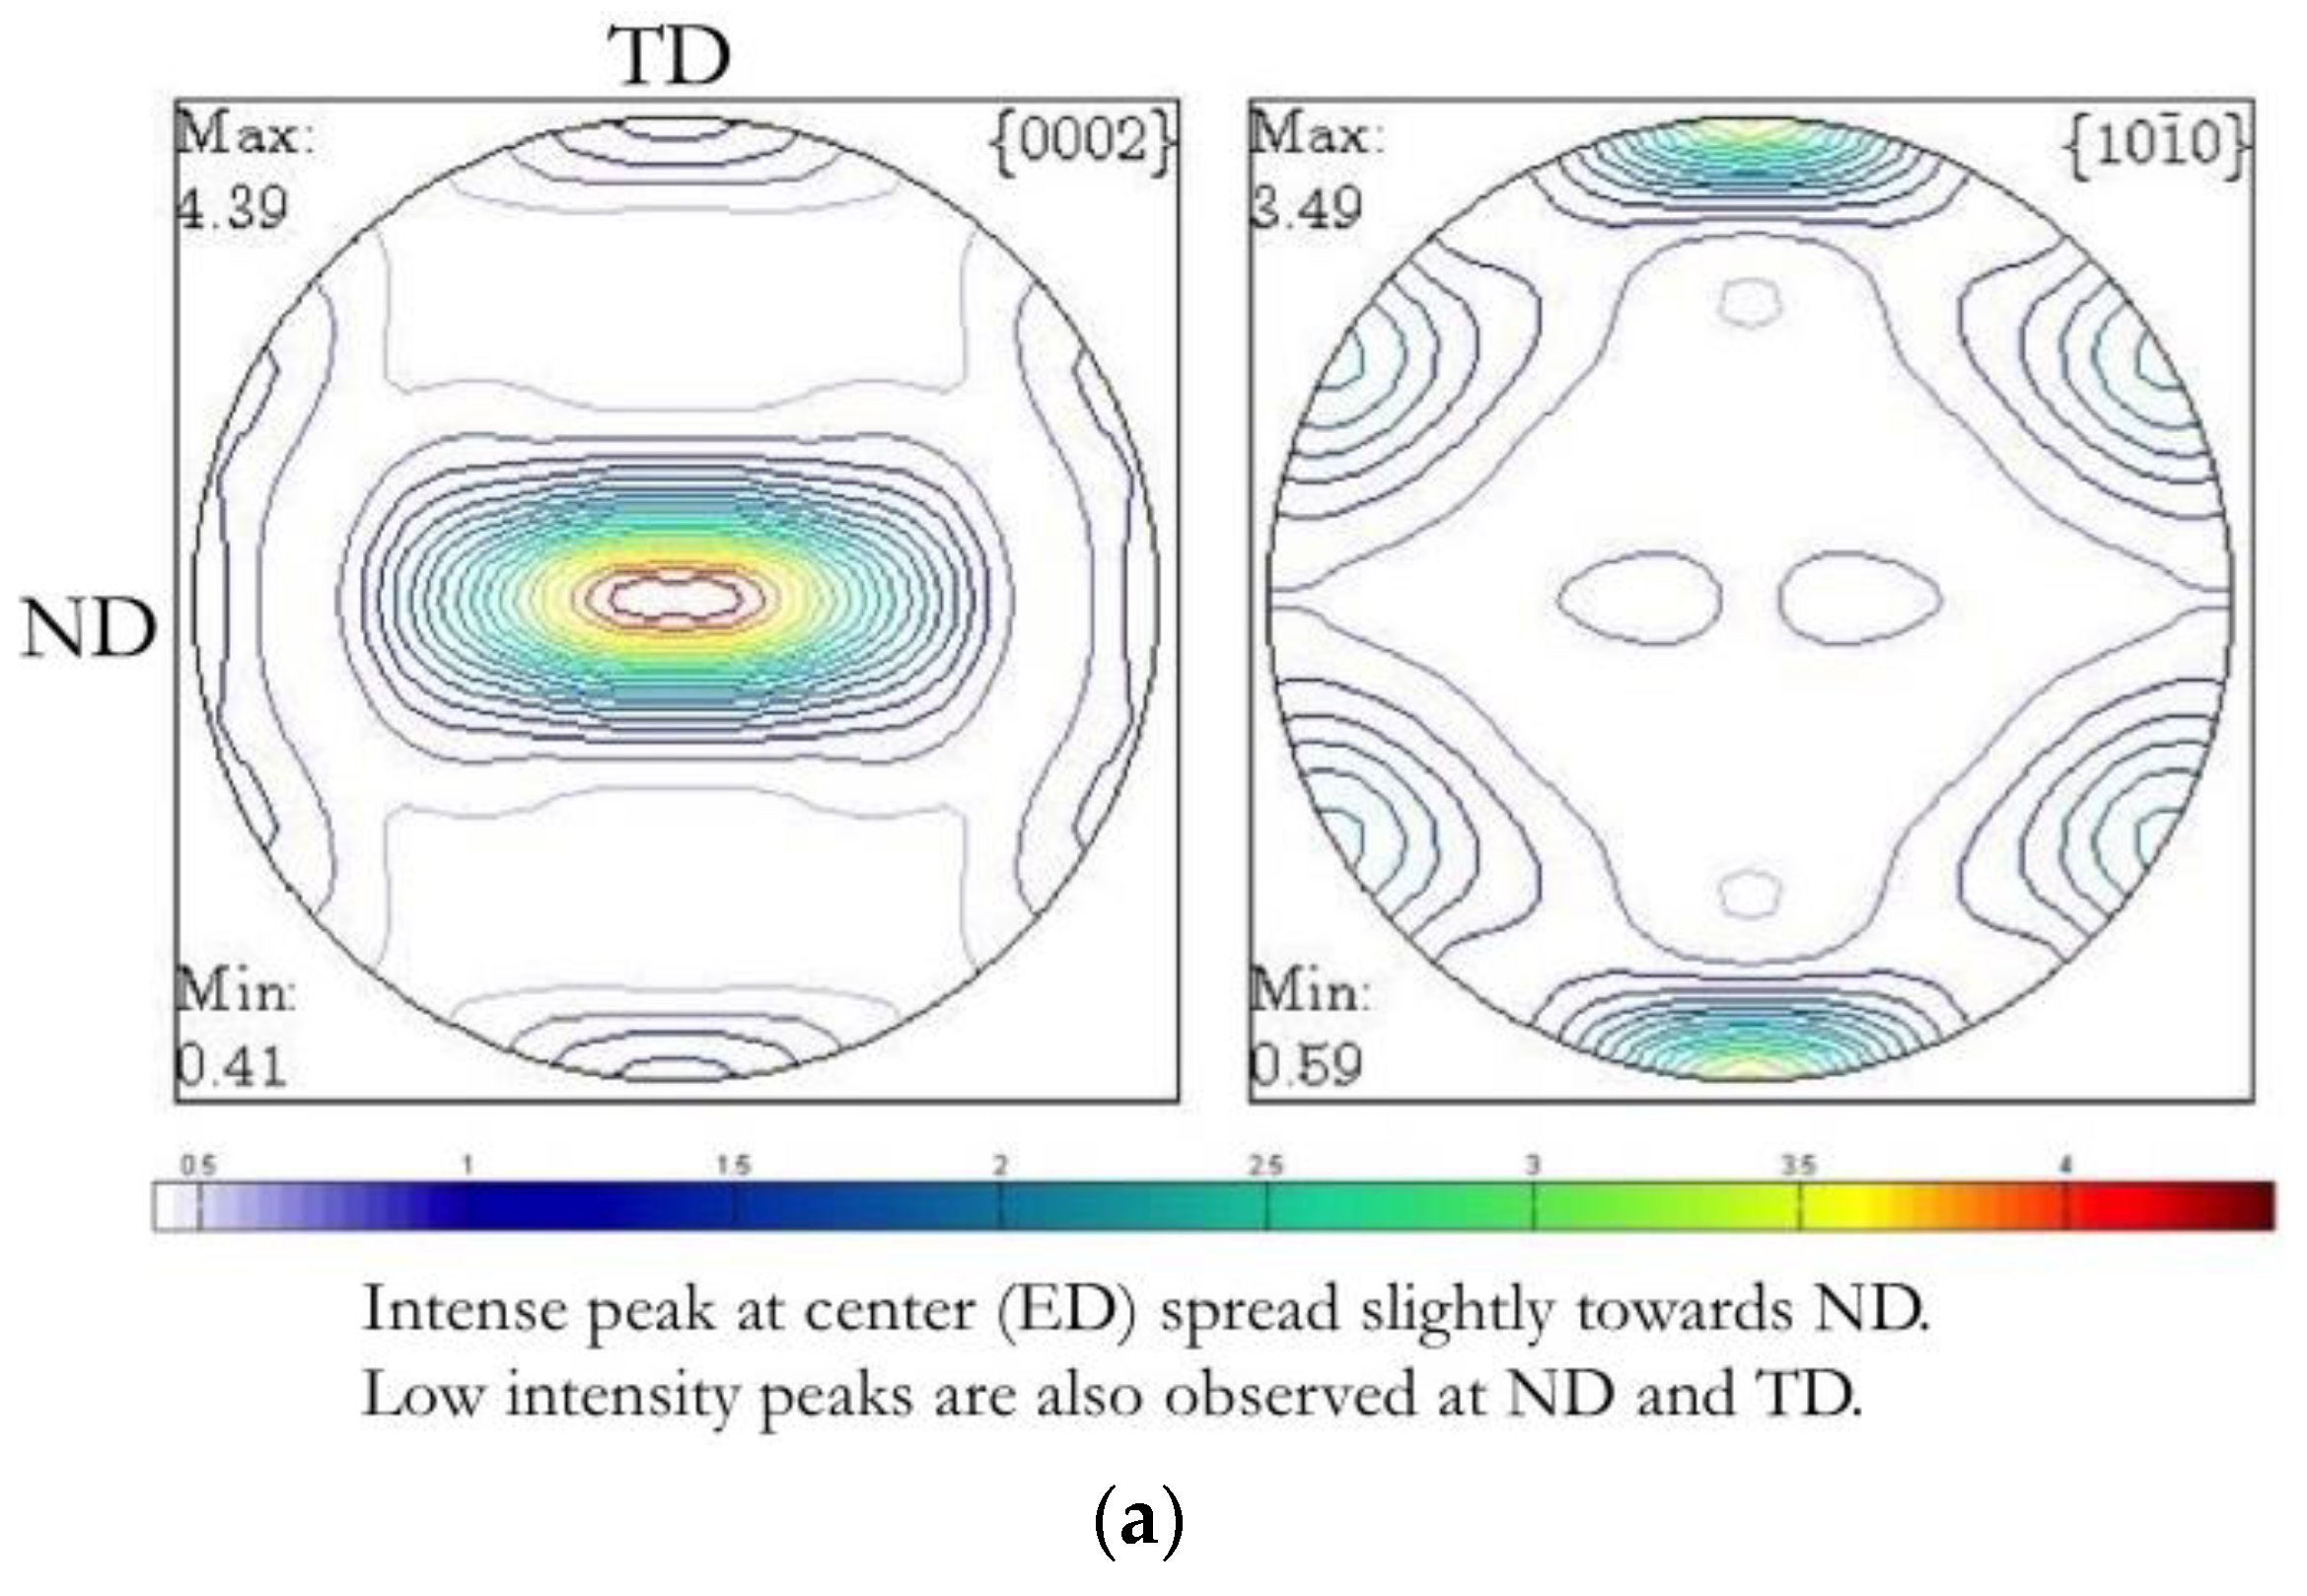
5.3. Texture Evolution

For a given initial texture in the specimen, the changes in the texture and microstructure that develop during hot deformation depend on the operating slip systems, which have been summarized in Table 1 for the two loading directions considered in this study. From the standard orientation corresponding to the normal to the planes {hkil} upon {0001} reflection, it may be seen that the angles between the basal and the other poles are complementary and hence, the basal planes move towards the positions of slip planes and directions when slip occurs. In summary, the initial texture present in the extruded ZK60 (Figure 3) was unfavorable for the activation of the basal and prismatic slip systems in both ED and ND orientations.
The occurrence of slip on a slip plane causes its rotation such that it moves closer to the normal to the applied force when it ceases to operate. The other crystallographic planes also rotate relatively and in a complementary manner by the same angle. Hence, it will suffice to follow the rotations of one or two planes, e.g., basal and prismatic, even when slip occurs on non-basal slip systems since the relative angular orientations are known from a standard stereographic projection of the poles for Mg [28]. The new orientations may be arrived at and correlated with the respective starting texture.

5.3.1. Specimens Compressed Parallel to ED

The basal (0002) and the prismatic (10 1 ¯ 0) pole figures of the as-received plate relevant to this orientation is shown in Figure 3b, which may again be stated in terms of basal planes {0001} parallel to the extrusion direction (i.e., the surface of the plate, ED-TD plane) and spread towards ND, and the extrusion direction is <10 1 ¯ 0>. For this texture, the specimens compressed along the extrusion direction will have the basal planes parallel with two sets of prismatic {10 1 ¯ 0} planes perpendicular to the compression axis. Slip cannot take place on these planes since the resolved shear stress will be zero. At temperatures lower than about 200 °C, where these slip systems are active, plasticity will be curtailed and twinning and cracking occurs at high strains. The processing map (Figure 4a) exhibits three domains under conditions described in Table 1. The slip systems and recovery mechanisms for each domain are also summarized in Table 1. The pole figures obtained on deformed specimens under peak-efficiency conditions (300 °C and 0.0003 s−1) in Domain 1 of the processing map (Figure 4a) are shown in Figure 9a. The features obtained on specimens deformed in the entire temperature range within the domain are essentially similar. The X-axis in the pole figures is the compression axis (i.e., ED) and the y-axis is ND. The maximum basal pole intensity (at 10° from ND towards ED) is 1.4 to 1.8 times random, which is much less than that in the initial texture (12.6) indicating that the strong basal texture in the initial specimen is nearly randomized by compression in this domain. However, low basal intensity peaks may be seen at (a) 20–25° from ED towards the center, (b) TD (normal to the plane of the paper), and (c) 20–30° from ND spread towards the center. The slip system that dominates deformation in this domain is the first-order pyramidal slip {10 1 ¯ l} <11 2 ¯ 0>. From the standard projection, it may be noted that the location of the pole (10 1 ¯ 1) is at 28°, (10 1 ¯ 2) is at 44° and (10 1 ¯ 3) is at 56° with respect to ED which is <10 1 ¯ 0>, while the slip direction <11 2 ¯ 0> is at 30°, 60° or 90°. Slip on this system will rotate the basal poles in all directions from their preferred position around the ND-TD plane and thereby randomize the initial texture. It is relevant to note that in the first-order pyramidal system, it is the {10 1 ¯ 1} <11 2 ¯ 0> slip that causes the basal plane intensity peaks in ED and also the spread around the slip direction <11 2 ¯ . 0>, while slip on higher-order systems {10 1 ¯ 2} <11 2 ¯ 0> and {10 1 ¯ 3} <11 2 ¯ 0> results in the basal intensity peak in the center of the pole figure. However, all the basal pole intensities are very low. Thus, the pole figure obtained on specimens loaded in ED and deformed under conditions of Domain 1 clearly reflect the role of the first-order pyramidal slip system for plastic flow. At the higher temperatures, recovery mechanisms also operate depending on the strain rate since they are thermally activated. The apparent activation energy of 90 kJ/mol in Domain 1 (Table 1) is less than that expected for self-diffusion controlled deformation processes in Mg (95 and 135 kJ/mol) [29]. Thus, recovery in Domain 1 occurs via dislocation climb controlled by the lattice self-diffusion. The specimens deformed in this domain exhibit homogeneous deformation since there are a large number of first-order pyramidal slip systems participating in the deformation and the roundness index is in the range of about 0.87–0.97 (Figure 6).
The (0002) and (10 1 ¯ 0) pole figures obtained on ED samples deformed under peak-efficiency conditions (500 °C and 0.0003 s−1) corresponding to Domain 2 of the processing map (Figure 4a) are shown in Figure 9b. The basal pole figure shows a strong basal pole intensity peak at about 45° from ND. The slip system that dominates flow in this domain is the second-order pyramidal slip {11 2 ¯ 2} <11 2 ¯ 3> [30]. The second-order pyramidal planes {11 2 ¯ 2} are oriented at 45o from ED as well as ND due to symmetry or 90° from ED, and the former orientation is highly favorable for the slip. The slip direction <11 2 ¯ 3> which is at about 50° from ED is also favorable. The occurrence of second-order pyramidal slip will, therefore, rotate the basal poles towards about 45° orientation as revealed by the pole figure in Figure 9b. The other set of {11 2 ¯ 2} planes that are at 90° from ED are not favorable for slip, and therefore, the pole figure shows strong basal pole distribution towards ND. Thus, the textural changes caused in Domain 2 of the map are due to highly favorable second-order pyramidal slip. The new texture developed with the basal planes at 45° with respect to ND is highly favorable for the basal slip in ND or TD loading. As the temperature of deformation is increased, the critical resolved shear stress for the non-basal slip systems may be reached in the order prismatic → first-order pyramidal → second-order pyramidal. For large deformations, the transition does not take place sharply at a given temperature but over a range, for example at 200–250 °C, 300–400 °C, and>400 °C for the three systems, respectively. Since the stacking fault energy on {11 2 ¯ 2} <11 2 ¯ 3> planes is high (173 mJ/m2) [31], the associated recovery process is cross-slip of the screw dislocations. The specimens deformed in this domain exhibit homogeneous deformation because of slip on a large number of slip systems and cross-slip mechanism, and the roundness index is about 0.9 (Figure 6).
The pole figures obtained on specimens deformed at efficiency conditions slightly away from the peak but within Domain 3 (450 °C and 10 s−1) are shown in Figure 9c, which has strikingly similar features as that obtained for specimens deformed in Domain 1 (Figure 9a). The initial basal texture is again nearly randomized by deformation in this domain also. The basal pole figure (Figure 9c) has shown a low-intensity peak at 35–40° from ND, at the center (TD normal to the plane of the paper) and ND. This is as expected since the operating slip system {10 1 ¯ l} <11 2 ¯ 0> is the same as in Domain 1 and causes similar rotations of basal planes. However, unlike in Domain 1, because of the higher strain rates for Domain 3, the recovery mechanism is by grain-boundary self-diffusion controlled climb. The specimens deformed in this domain exhibit homogeneous flow due to a large number of first-order pyramidal slip systems causing plastic flow, and the roundness index is around 0.88 (Figure 6).

5.3.2. Specimens Compressed Parallel to ND

The pole figures obtained on untested specimens relevant to ND loading are shown in Figure 3c where ND is horizontal, TD is vertical, and ED is normal to the plane of the paper. For the ND orientation, the (0002) basal planes will be perpendicular and correspondingly two sets of (10 1 ¯ 0) prismatic planes will be parallel (c-axis). Slip cannot take place on these planes since the resolved shear stress will be zero. The basal poles are spread towards TD and have a high intensity at ND. This may be considered as a “hard” texture for room temperature deformation since the basal and prismatic planes, as well as the slip direction <11 2 ¯ 0>, are unfavorably oriented for the slip to occur. However, at higher temperatures, the results on the processing map (Figure 4b) reveal that the workability is superior to that of specimens loaded in ED. The processing map obtained for specimens loaded in ND (Figure 4b) exhibited four domains, three of which represent DRX, and the related information is given in Table 1. The textures recorded on specimens deformed in these domains are analyzed in terms of the operating slip mechanisms, which are different from those occurring for ED orientation discussed earlier.
The (0002) and (10 1 ¯ 0) pole figures obtained on ND specimens deformed under conditions correspond to Domain 1 of the processing map (Figure 4b) are shown in Figure 10a,b. Figure 10a gives the pole distribution at 250 °C, which is on the lower side of the peak-efficiency temperature, while Figure 10b is the pole figure for specimens deformed under peak-efficiency conditions i.e., 300 °C and 0.0003 s−1. Figure 10 exhibits a peak in the basal pole intensity (1.9 to 2.3 times random) at about 30° from ND. As the temperature increases, the peaks merged into a single domain around the center of the pole figure (ED–normal to the plane of the paper) and spread in the ND-ED plane. In this domain, {10 1 ¯ l}<11 2 ¯ 3> slip occurs as observed in single crystals oriented for c-axis compression [26,27] since the basal and prismatic slip systems are unfavorably oriented to slip. At lower temperatures, {10 1 ¯ 1} <11 2 ¯ 3> slip occurs and rotates the basal planes towards ED by about 28°, which is the angle at which {10 1 ¯ 1} pole occurs with respect to ND. The slip direction <11 2 ¯ 3> is favorable for this slip since it is oriented at about 40° from ND. In view of the many combinations available in this slip system, the poles are widely spread around the peak. At higher temperatures, slip on {10 1 ¯ 2} and {10 1 ¯ 3} planes occurs, which are oriented at 44° and 56° with respect to ND. The added slip on these additional first-order slip systems at higher temperatures results in merging of the basal pole peaks to give a large area of basal poles around the center of the pole figure. The occurrence of slip on {10 1 ¯ l} <11 2 ¯ 3> system results in anisotropy of flow in the extrusion direction since the TD is along <11 2 ¯ 0>. This was further confirmed from the shapes of deformed specimens under Domain 1 conditions, which are oval [24] and the roundness index for the specimen shapes is in the range 0.7–0.85 as shown in Figure 6.
The (0002) and (10 1 ¯ 0) pole figures obtained on ND specimens deformed under conditions corresponding to peak-efficiency in Domain 2 (400 °C and 0.0003 s−1) are shown in Figure 11a. The basal pole figure exhibits an intense peak at the center (ED–normal to the plane of the paper) spread slightly towards ND. Low-intensity peaks are also observed at ND and TD. The slip system that operates in this domain is identified (Table 1) to be second-order pyramidal slip {11 2 ¯ 2} <11 2 ¯ 3>. The {11 2 ¯ 2} planes are oriented at about 60° with respect to ND and <11 2 ¯ 3> is 40°. Slip occurring on this system moves the basal poles to about 45° orientation from ND and extensive deformation will merge the peaks to give high basal intensity at the center. Because of the multiple slip systems available for the second-order pyramidal slip and the occurrence of cross-slip results in a homogenous deformation resulting in a round shape for the specimens deformed in this domain [24] and the roundness index is near 0.9 as shown in Figure 6.
The pole figures obtained on the deformed specimen under peak-efficiency conditions of Domain 3 (500 °C and 0.0003 s−1) are shown in Figure 11b. The basal pole figure has its features similar to that obtained in Domain 2, which is expected since the operating slip systems are the same, namely second-order pyramidal slip. After DRX refines the grain size, superplasticity occurs in this domain [24] due to the grain boundary sliding and diffusion accommodated flow at triple junctions. The shapes of specimens [24] confirmed the homogenous flow in this domain and the roundness index is near 0.9 as shown in Figure 6.
The pole figures obtained on ND loaded specimens deformed under peak-efficiency conditions in Domain 4 (300 °C and 10 s−1) are shown in Figure 11c. These are strikingly similar to those obtained on specimens deformed in Domain 1 (Figure 10a), and this may be attributed to the operation of the slip system {10 1 ¯ l} <11 2 ¯ 3> which is the same as in Domain 1. The shapes of the deformed specimens are also similar to both these domains since they are oval with ED as the major axis. The roundness index of specimens deformed in this domain is about 0.65. It may be concluded that for specimens loaded in ND, the textures developed by specimens compressed in Domain 1 and Domain 4 are similar and so are the operating slip systems. The same conclusion holds good for specimens deformed in Domains 2 and 3.

5.4. Comparison with the Hot Deformation Behavior of Wrought Mg and AZ31 Alloy

It is quite interesting to analyze the difference in the hot working behavior of the pure Mg and commercial Mg alloy AZ31 in the wrought (extruded and rolled) condition. Pure Mg (minimum of 99.8% Mg) was extruded at 475 °C and the processing map of it exhibited three domains [27]: (i) 400–525 °C and 0.001–10 s−1 representing DRX, (ii) 350 °C and 0.001 s−1 represents the process of dynamic recovery, and (iii) 550 °C and 0.001 s−1 representing wedge cracking. Extruded Mg exhibited flow instabilities at temperatures (a) below 325 °C and (b) between 400–500 °C and both above a strain rate of 10 s−1.
AZ31 alloy is commercially extruded at temperatures above 300 °C, which results in a fine-grained microstructure and a fiber texture with <10 1 ¯ 0> direction parallel to the extrusion direction (ED) [32]. The hot deformation behavior of AZ31 extruded at 300, 350, and 450 °C by direct method and extruded at 300 °C by indirect and hydrostatic methods is reported in the literature [33,34,35]. The processing maps for the AZ31 samples compressed along the extrusion direction are not much different for those extruded at 300 and 350 °C. At both conditions, the maps typically exhibited three domains (Domain 1 in the range of 300–450 °C and 0.001–0.01 s−1 manifested as DRX by lattice self-diffusion; Domain 2 in the range of 300–450 °C and 1–10 s−1 manifested as DRX by grain-boundary self-diffusion; Domain 3 in the range of 500–550 °C and 0.001–0.01 s−1 manifested as DRX by cross-slip). However, the processing map for direct extruded at 350 °C revealed small regimes of flow instability.
When compared with the observations on deformation behavior of extruded ZK60 alloy (in T5 condition) with that of direct-extruded AZ31 alloy for the samples compressed along the extrusion direction, the three DRX domains features are similar although the ranges in which they occurred and peak-efficiency values are slightly different. Recovery mechanisms corresponding to the three DRX domains are also the same as described above in both extruded AZ31 and ZK60-T5. Unlike for extruded AZ31, Domain 3 in the case of ZK60 represents superplasticity. This may be attributed to the sensitiveness of hot deformation behavior on its initial microstructure and the prior processing history (ageing in case of ZK60) that resulted in very fine-grain size.

6. Conclusions

The development of textures during hot compression of ZK60A-T5 magnesium alloy plate loaded along the extrusion direction (ED) and the direction normal to the extruded plane (ND) has been examined with the help of pole figures obtained on the deformed specimens. The results are correlated with the slip systems and operating mechanisms in the various temperature and strain rate ranges as depicted by the processing maps. The following conclusions are drawn from this investigation.
  • When loaded parallel to the extrusion direction (ED), the processing map exhibited three DRX domains in the temperature and strain rate ranges: (1) 230 °C to 375 °C and 0.0003 s−1 to 0.002 s−1, (2) 410 °C to 500 °C and 0.0003 s−1 to 0.008 s−1, (3) 350 °C to 430 °C and 2 s−1 to 10 s−1. ED samples exhibited a flow instability regime at low temperature and high strain rate conditions, whereas at other processing conditions, deformed uniformly to a near-circular cross-section.
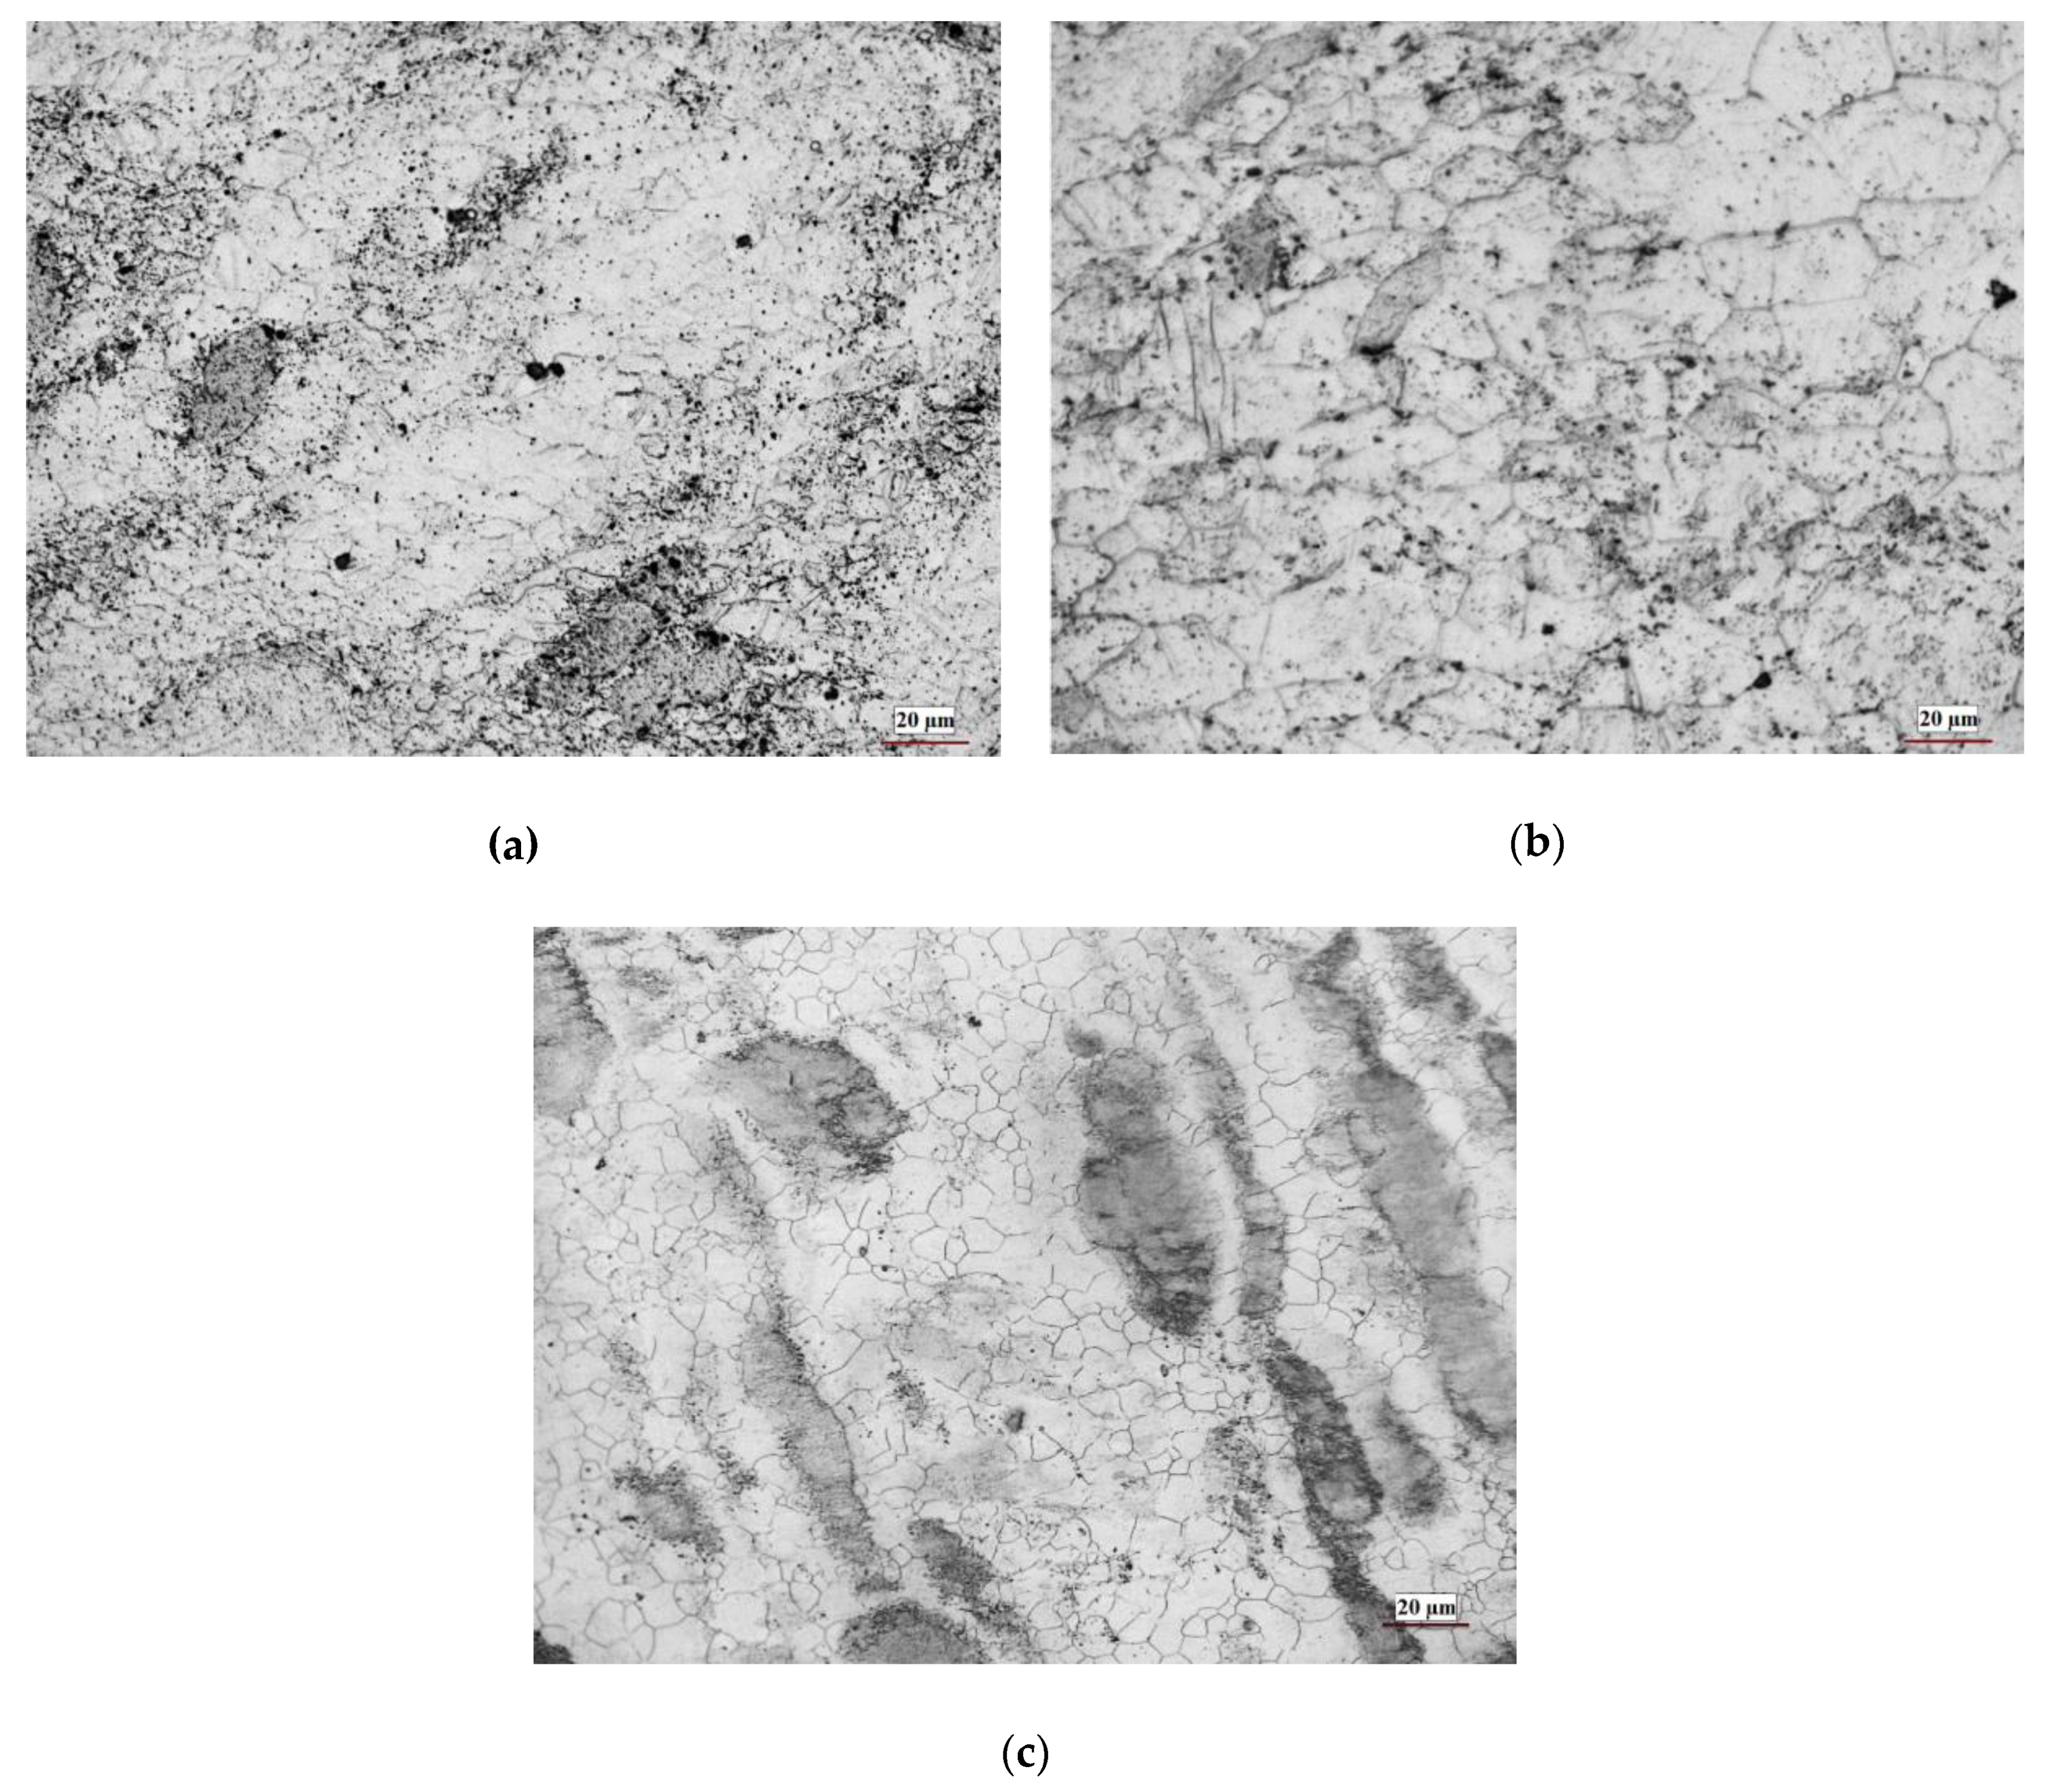
  • In the first and third domains of the ED map, first-order pyramidal slip {10 1 ¯ l} <11 2 ¯ 0> occurs, while second-order pyramidal slip {11 2 ¯ 2} <11 2 ¯ 3> occurs in the second domain. The pole figures obtained on specimens deformed in Domains 1 and 3 are strikingly similar and nearly randomized, while a new texture is generated in the second domain with basal poles at 45° with respect to ND or TD. This new texture will promote basal slip if loaded in the transverse direction.
  • When loaded in the normal direction (ND), the processing map exhibited four domains in the temperature and strain rate ranges: (1) 225 °C to 350 °C and 0.0003 s−1 to 0.1 s−1, (2) 350 °C to 430 °C and 0.0003 s−1 to 0.007 s−1, (3) 430 °C to 500 °C and 0.0003 s−1 to 0.03 s−1, and (4) 260 °C to 340 °C and 1 s−1 to 10 s−1. In Domains 1 and 4, {10 1 ¯ l} <11 2 ¯ 3> slip occurs, while {11 2 ¯ 2} <11 2 ¯ 3> slip occurs in Domains 2 and 3.
  • The pole figures obtained on specimens deformed in Domains 1 and 4 have similar features while those deformed in Domains 2 and 3 are similar, suggesting that the operating slip systems control the texture development since they are the same in each of the pairs.
  • The compression along ND produces strong basal textures with the basal planes normal to the ED, which gets intensified with increased temperature of deformation, which will cause strong anisotropy of mechanical properties.

Author Contributions

C.D. has performed the experimental work, microstructural and texture characterization, analysis of the data, and writing the manuscript; M.K.J. has contributed for the analysis of the results and preparation of the manuscript; Y.V.R.K.P. has participated on the aspects related to the processing map and texture, and writing the paper; K.P.R. has facilitated the compression tests experimental work, analysis of the data, generating processing map, and kinetic analysis.

Funding

This research received no external funding.

Acknowledgments

The authors are thankful to Ms. Vicky Jarvis of McMaster Analytical X-ray Diffraction facility for her assistance with the XRD work for texture measurements.

Conflicts of Interest

The authors declare no conflict of interest.

References

  1. Conrad, H.; Robertson, W.D. Effect of temperature on the flow stress and strain-hardening coefficient of magnesium single crystals. JOM 1957, 9, 503–512. [Google Scholar] [CrossRef]
  2. Emley, E.F. Principles of Magnesium Technology; Pergamon Press: Oxford, NY, USA, 1966. [Google Scholar]
  3. Kelley, E.W.; Hosford, W.F. Plane-strain compression of magnesium and magnesium alloy crystals. Trans. Metall. Soc. AIME 1968, 242, 5–13. [Google Scholar]
  4. Galiyev, A.; Kaibyshev, R. Superplasticity in a magnesium alloy subjected to isothermal rolling. Scr. Mater. 2004, 51, 89–93. [Google Scholar] [CrossRef]
  5. Watanabe, H.; Mukai, T.; Higashi, K. Superplasticity in a ZK60 magnesium alloy at low temperatures. Scr. Mater. 1999, 40, 477–484. [Google Scholar] [CrossRef]
  6. Lapovok, R.; Thomson, P.F.; Cotam, R.; Estrin, Y. Processing routes leading to superplastic behavior of magnesium alloy ZK60. Mater. Sci. Eng. A 2005, 4104–4111, 390–393. [Google Scholar] [CrossRef]
  7. Valiev, R.Z.; Langdon, T.G. Principles of equal-channel angular pressing as a processing tool for grain refinement. Prog. Mater. Sci. 2006, 51, 881–981. [Google Scholar] [CrossRef]
  8. Kleiner, S.; Uggowitzer, P.J. Mechanical anisotropy of extruded Mg-6% Al-1% Zn alloy. Mater. Sci. Eng. A 2004, 379, 258–263. [Google Scholar] [CrossRef]
  9. Liu, Q.; Zhou, X.; Zhou, H.; Fan, X.; Liu, K. The effect of extrusion conditions on the properties and textures of AZ31B alloy. J. Magnes. Alloy. 2017, 5, 202–209. [Google Scholar] [CrossRef]
  10. You, S.; Huang, Y.; Kainer, K.U.; Hort, N. Recent research and developments on wrought magnesium alloys. J. Magnes. Alloy. 2017, 5, 239–253. [Google Scholar]
  11. Koike, J. Enhanced deformation mechanisms by anisotropic plasticity in polycrystalline Mg alloys at room temperature. Metall. Mater. Trans. A 2005, 36, 1689–1696. [Google Scholar] [CrossRef]
  12. Yang, Q.; Jiang, B.; Pan, H.; Song, B.; Jiang, Z.; Dai, J.; Wang, L.; Pan, F. Influence of different extrusion processes on mechanical properties of magnesium alloy. J. Magnes. Alloy. 2014, 2, 220–224. [Google Scholar] [CrossRef] [Green Version]
  13. Gehrmann, R.; Frommert, M.M.; Gottstein, G. Texture effects on plastic deformation of magnesium. Mater. Sci. Eng. A 2005, 395, 338–349. [Google Scholar] [CrossRef]
  14. Agnew, S.R.; Yoo, M.H.; Tomé, C.N. Application of texture simulation to understanding mechanical behavior of Mg and solid solution alloys containing Li or Y. Acta Mater. 2001, 49, 4277–4289. [Google Scholar] [CrossRef]
  15. Prasad, Y.V.R.K.; Rao, K.P. Processing maps for hot deformation of rolled AZ31 magnesium alloy plate: Anisotropy of hot workability. Mater. Sci. Eng. A 2008, 487, 316–327. [Google Scholar] [CrossRef]
  16. Catorceno, L.L.C.; de Abreu, H.F.G.; Padilha, A.F. Effects of cold and warm cross-rolling on microstructure and texture evolution of AZ31B magnesium alloy sheet. J. Magnes. Alloy. 2018, 6, 121–133. [Google Scholar] [CrossRef]
  17. Tripathi, A.; Murthy, S.V.S.N.; Narayanan, P.R. Microstructure and texture evolution in AZ31 magnesium alloy during caliber rolling at different temperatures. J. Magnes. Alloy. 2017, 5, 340–347. [Google Scholar] [CrossRef]
  18. Nie, J.F. Effects of precipitate shape and orientation on dispersion strengthening in magnesium alloys. Scr. Mater. 2003, 48, 1009–1015. [Google Scholar] [CrossRef]
  19. Li, J.; Liu, J.; Cui, Z. Characterization of hot deformation behavior of extruded ZK60 magnesium alloy using 3D processing maps. Mater. Des. 2014, 56, 889–897. [Google Scholar] [CrossRef]
  20. Ai, W.-J.; Fang, G.; Zhou, J.; Leeflang, M.A.; Duszczyk, J. Effect of twinning on the deformation behavior of an extruded Mg-Zn-Zr alloy during hot compression testing. Mater. Sci. Eng. A 2012, 556, 373–381. [Google Scholar] [CrossRef]
  21. Spigarelli, S.; El Mehtedi, M.; Regev, M.; Gariboldi, E.; Lecis, N. High temperature creep and superplasticity in a Mg-Zn-Zr alloy. J. Mater. Sci. Technol. 2012, 28, 407–413. [Google Scholar]
  22. Hadadzadeh, A.; Wells, M.A.; Shaha, S.K.; Jahed, H.; Williams, B.W. Role of compression direction on recrystallization behavior and texture evolution during hot deformation of extruded ZK60 magnesium alloy. J. Alloy. Compd. 2017, 702, 274–289. [Google Scholar] [CrossRef]
  23. Wang, Y.; Xin, Y.; Chapuis, A.; Yu, H.; Liu, Q. Developing a basal texture with two peaks tilting towards the transverse direction in hot rolled Mg-5.7Zn-0.5Zr plates. Metall. Mater. Trans. A 2016, 47, 4275–4286. [Google Scholar] [CrossRef]
  24. Dharmendra, C.; Rao, K.P.; Jain, M.K.; Prasad, Y.V.R.K. Role of loading direction on compressive deformation behavior of extruded ZK60A-T5 alloy plate in a wide range of temperature. J. Alloy. Compd. 2018, 744, 289–300. [Google Scholar] [CrossRef]
  25. Prasad, Y.V.R.K.; Rao, K.P.; Sasidhara, S. Hot Working Guide: A Compendium of Processing Maps, 2nd ed.; ASM International: Materials Park, OH, USA, 2015; ISBN 978-1-62708-091-0. [Google Scholar]
  26. Reed-Hill, R.E.; Robertson, W.D. Deformation of magnesium single crystals by nonbasal slip. JOM 1957, 9, 496–502. [Google Scholar] [CrossRef]
  27. Xie, K.Y.; Alam, Z.; Caffee, A.; Hemker, K.J. Pyramidal I slip in c-axis compressed Mg single crystals. Scr. Mater. 2016, 112, 75–78. [Google Scholar] [CrossRef]
  28. Taylor, A. X-ray Metallography; John Wiley & Sons Inc.: Hoboken, NJ, USA, 1961; pp. 572–612. [Google Scholar]
  29. Frost, H.J.; Ashby, M.F. Deformation-Mechanism Maps; Pergamon Press: Oxford, UK, 1982; p. 44. [Google Scholar]
  30. Obara, T.; Yoshinaga, H.; Morozumi, S. {11 2 ¯ 2 } <11 2 ¯ 3> Slip system in magnesium. Acta Metall. 1973, 21, 845–853. [Google Scholar] [CrossRef]
  31. Morris, J.R.; Scharaff, J.; Ho, K.M.; Turner, D.E.; Ye, Y.Y.; Yoo, M.H. Prediction of a {1122} hcp stacking fault using a modified generalized stacking-fault calculation. Philos. Mag. 1997, 76, 1065–1077. [Google Scholar] [CrossRef]
  32. Beer, A.G.; Barnett, M.R. Influence of initial microstructure on the hot working flow stress of Mg-3Al-1Zn. Mater. Sci. Eng. A 2006, 423, 292–299. [Google Scholar] [CrossRef]
  33. Dzwonczyk, J. Influence of Different Extrusion Methods on Microstructure and Mechanical Properties of AZ31 Alloy. Ph.D. Thesis, Center for Magnesium Technology, GKSS Research Center, Geesthacht, Germany, 2004. [Google Scholar]
  34. Rao, K.P.; Prasad, Y.V.R.K.; Dzwonczyk, J.; Hort, N.; Kainer, K.U. Hot deformation mechanisms in AZ31 magnesium alloy extruded at different temperatures: Impact of texture. Metals 2012, 2, 292–312. [Google Scholar] [CrossRef]
  35. Prasad, Y.V.R.K.; Rao, K.P. Hot deformation mechanisms and microstructural control in high temperature extruded AZ31 magnesium alloy. Adv. Eng. Mater. 2007, 9, 558–565. [Google Scholar] [CrossRef]
Figure 1. Schematic of the as-received extruded ZK60A-T5 plate (dimensions not to scale are provided) with the specimen orientations for compression testing: (1) for loading along extrusion direction (ED) and (2) for loading along the normal direction (ND).
Metals 09 01170 g001
Figure 2. EBSD microstructures of the as-received ZK60A-T5 alloy plate on (a) ED-ND and (b) ED- transverse direction (TD) planes. The extrusion direction is horizontal.
Metals 09 01170 g002
Figure 3. X-ray diffraction (XRD) pole figures of basal and prismatic reflections obtained on (a) ED-ND plane, (b) ED-TD plane, and (c) TD-ND plane of the starting extruded ZK60A-T5 magnesium alloy plate.
Metals 09 01170 g003
Figure 4. Processing maps obtained for (a) ED and (b) ND specimens of extruded ZK60-T5 alloy at a true strain of 0.6. The numbers associated with the contours represent the efficiency of power dissipation in percent.
Metals 09 01170 g004
Figure 5. Typical shapes of the specimens (top view) compressed along ED and ND. The loading direction is normal to the plane of the paper.
Metals 09 01170 g005
Figure 6. Effect of temperature and strain rate on a ratio of the minor to major radius of the ZK60-T5 specimens deformed along the ED and ND directions.
Metals 09 01170 g006
Figure 7. Optical microstructures of the ED specimens deformed at conditions correspond to peak-efficiency conditions of the three domains in the ED processing map (Figure 4a), which reveals DRX features. The compression axis is vertical. (a) 300 °C and 0.0003 s−1 (Domain 1); (b) 500 °C and 0.0003 s−1 (Domain 2); (c) 400 °C and 10 s−1 (Domain 3).
Metals 09 01170 g007
Figure 8. Optical microstructures of the ND specimens deformed at conditions correspond to peak-efficiency conditions of the four domains in the ND processing map (Figure 4b), indicating the occurrence of DRX. The compression axis (ND direction) is vertical. (a) 300 °C and 0.0003 s−1 (Domain 1); (b) 400 °C and 0.0003 s−1 (Domain 2); (c) 500 °C and 0.0003 s−1 (Domain 3); (d) 300 °C and 10 s−1 (Domain 4).
Metals 09 01170 g008aMetals 09 01170 g008b
Figure 9. XRD pole figures of the ED specimens deformed at three peak-efficiency conditions of the three domains corresponding to the ED processing map. ED (the compression axis) is along the horizontal axis and ND is vertical. (a) 300 °C and 0.0003 s−1 (Domain 1); (b) 500 °C and 0.0003 s−1 (Domain 2); (c) 450 °C and 10 s−1 (Domain 3).
Metals 09 01170 g009
Figure 10. XRD pole figures of the specimens deformed under ND loading for the conditions corresponding to Domain 1 of the ND processing map. ND (the compression axis) is along the horizontal axis and the vertical axis is TD. (a) 250 °C and 0.0003 s−1 (Domain 1); (b) 300 °C and 0.0003 s−1 (Domain 1).
Metals 09 01170 g010aMetals 09 01170 g010b
Figure 11. XRD pole figures of the specimens deformed under ND loading at the peak efficiency conditions corresponding to the Domains 2, 3, and 4 of the ND processing map. ND (the compression axis) is along the horizontal axis, and the vertical axis is TD. (a) 400 °C and 0.0003 s−1 (Domain 2); (b) 500 °C and 0.0003 s−1 (Domain 3); (c) 300 °C and 10 s−1 (Domain 4).
Metals 09 01170 g011aMetals 09 01170 g011b
Table 1. The temperature and strain rate ranges, apparent activation energy (Qapp), operating slip systems and recovery mechanisms in the DRX domains exhibited in the processing maps of ZK60A-T5 alloy compressed along ED (Figure 4a) and ND (Figure 4b).
Loading DirectionDomain No.Temp. (°C)Strain Rate (s−1)Qapp, (kJ/mole)Slip SystemRecovery Mechanism
Extrusion Direction (ED)1230–3750.0003–0.00290{10 1 ¯ l} <11 2 ¯ 0>
First-order pyramidal
Climb by lattice self-diffusion
2410–5000.0003–0.008133{11 2 ¯ 2 } <11 2 ¯ 3>
Second-order pyramidal
Cross-slip
3350–4302–10100{10 1 ¯ l} <11 2 ¯ 0>
First-order pyramidal
Climb by grain boundary self-diffusion
Normal Direction (ND)1215–3350.0003–0.1128{10 1 ¯ l} <11 2 ¯ 3>
First-order pyramidal
Climb by lattice self-diffusion
2335–4300.0003–0.007130{11 2 ¯ 2} <11 2 ¯ 3>
Second-order pyramidal
Cross-slip
3430–5000.0003–0.03138{11 2 ¯ 2} <11 2 ¯ 3> + Grain boundary slidingSuper-plasticity
4260–3401–1095{10 1 ¯ l} <11 2 ¯ 3>
First-order pyramidal
Climb by grain boundary self-diffusion

