Article

Constitutive Equation of GH4169 Superalloy and Microstructure Evolution Simulation of Double-Open Multidirectional Forging

1
Education Ministry Key Laboratory of Advanced Forging & Stamping Technology and Science, Yanshan University, Qinhuangdao 066004, China
2
State Key Laboratory of Metastable Materials Science and Technology, Yanshan University, Qinhuangdao 066004, China
3
School of Art and Design, Yanshan University, Qinhuangdao 066004, China
*
Author to whom correspondence should be addressed.
Metals 2019, 9(11), 1146; https://doi.org/10.3390/met9111146
Submission received: 4 September 2019 / Revised: 21 October 2019 / Accepted: 24 October 2019 / Published: 25 October 2019

Abstract

:
This paper presented a double-open multidirectional forging with relatively few deformation passes and a uniform deformation. The constitutive equation and dynamic recrystallization model of the GH4169 superalloy were identified based on a thermal compression test and imported into Deform simulation software. The microstructure evolution law of GH4169 superalloy undergoing double-open multidirectional forging was simulated. The evolution of the recrystallization volume fraction and recrystallized grain size of the GH4169 superalloy during double-open multidirectional forging was obtained. Both higher temperatures and more passes were found to produce more complete recrystallization and smaller recrystallization grain size. At the maximum temperature studied, 1000 °C, with nine passes, the recrystallization volume fraction exceeded 95%, and the recrystallized grain size reached 3–5.5 µm.

1. Introduction

GH4169 alloy is a nickel-based superalloy that is extensively used in a steam turbine, aerospace, chemical, and nuclear industries [1,2,3]. However, the original blanks produced during casting are unsatisfactory due to increased performance requirements, and thus, must be improved to meet the performance standards [4,5,6]. Multidirectional forging is a plastic processing method for obtaining a fine grain structure by continuously changing the direction of axial external loads, thereby compressing the forgings in different directions [7]. Multidirectional forging is a plastic processing method to obtain fine grain structure by continuously changing the direction of axes of external loads and compressing forgings in different directions. The multi-directional forging process can improve the microstructure of the material and obtain fine-grained microstructure materials with excellent mechanical properties and uniform properties. This process is particularly suitable for the regulation of the structure and properties of GH4169 alloy materials.
In recent years, research on the multidirectional forging process in the process of thermal deformation has gradually increased at home and abroad. Mikhail et al. [8] mainly studied the influence of isothermal multi-directional forging on the microstructure evolution of conventional Al-Mg-based alloys in the strain range of 1.5–6.0 and the temperature range of 200–500 °C. Xia et al. [9] conducted a multi-directional forging of Mg-Gd-Y-Nd-Zr alloy at low temperatures to study grain refinement, microstructure, and uniformity of the mechanical properties. Aoba et al. [10] systematically studied the microstructure evolution and mechanical properties of 6000 series aluminum alloys subjected to multi-directional forging and artificial aging treatment. Lin et al. [11] derived a constitutive and microstructure evolution model for GH4169 superalloy based on equivalent dislocation density. However, relevant studies on the simulation of multi-directional forging microstructures are still rare.
In this study, a double-open multidirectional forging with relatively few deformation passes and uniform deformation was generated. The constitutive equation and dynamic recrystallization model were formulated based on a thermal compression experiment on the GH4169 superalloy. The model was then imported into the DEFORM simulation software. The design process of double-open multidirectional forging was explored, and specifically, the predictions of the recrystallization volume fraction and grain size as functions of temperature during the microstructure evolution simulation of GH4169 superalloy were discussed.

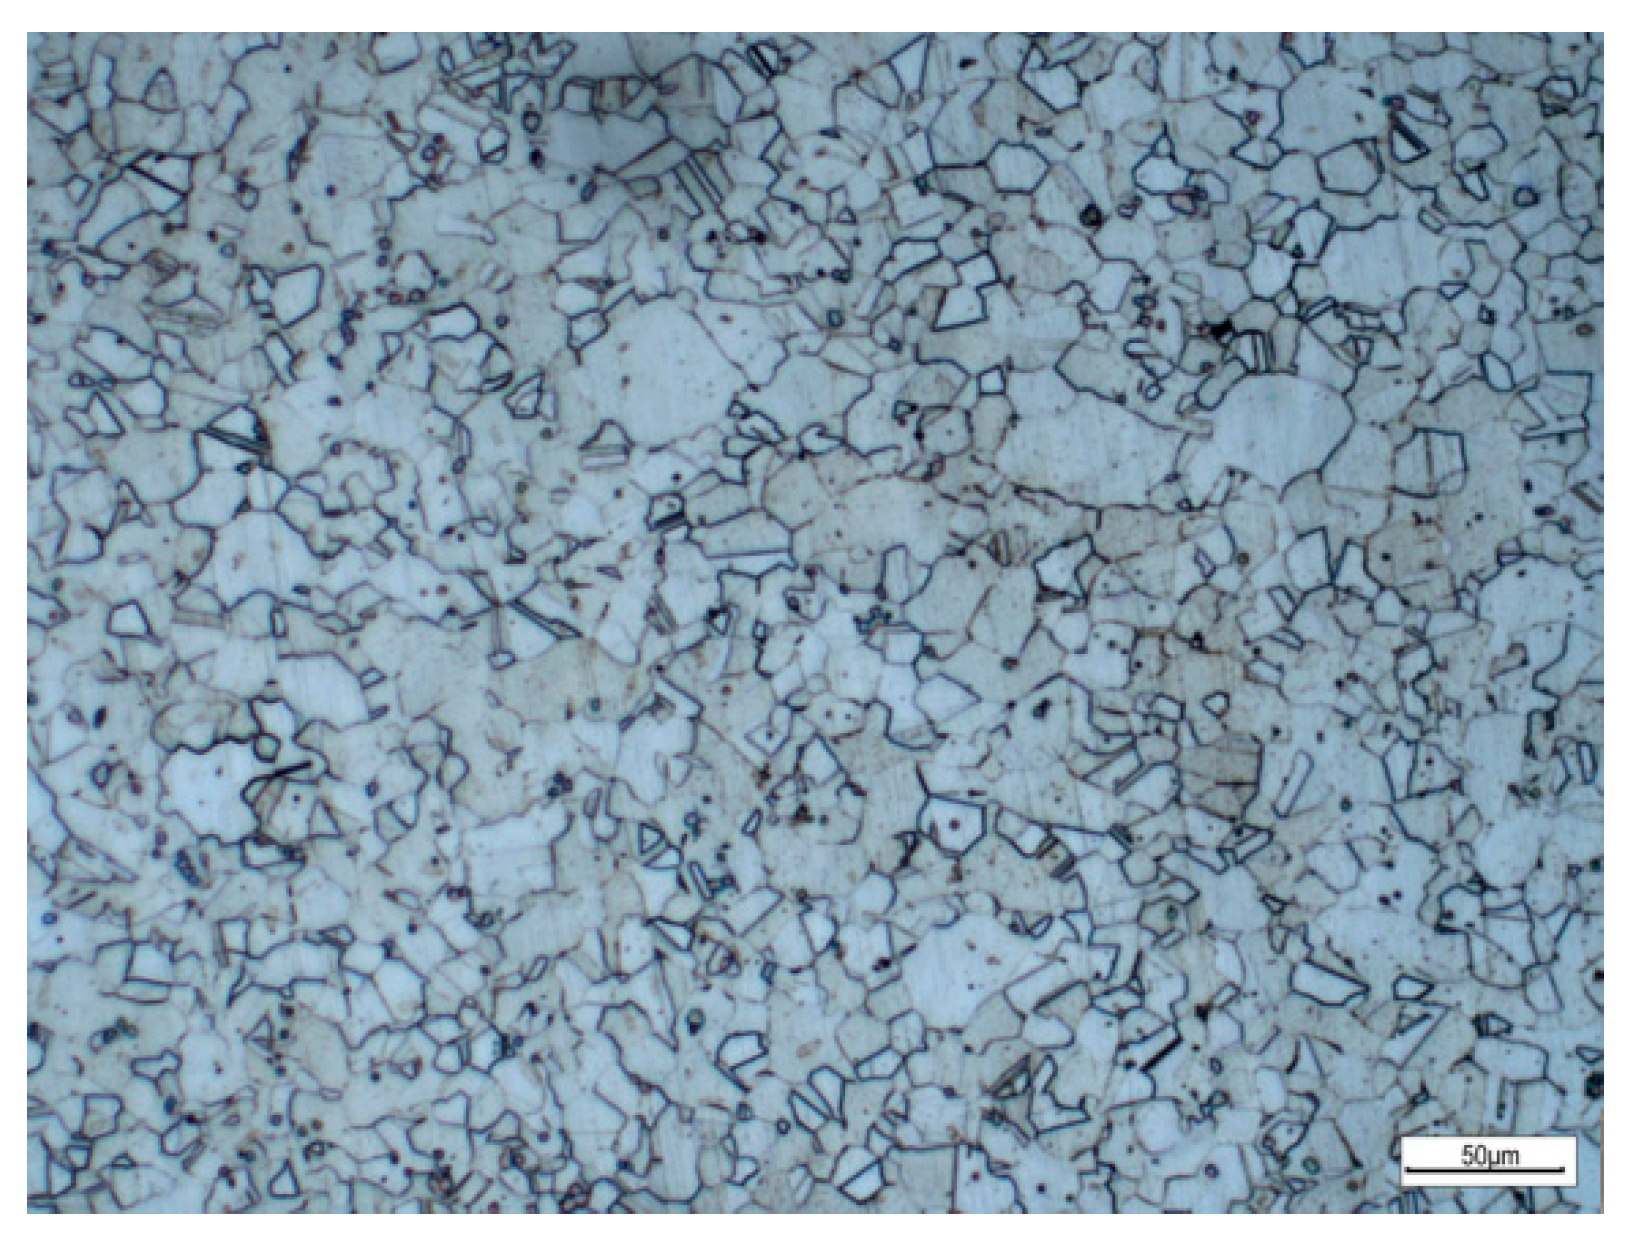
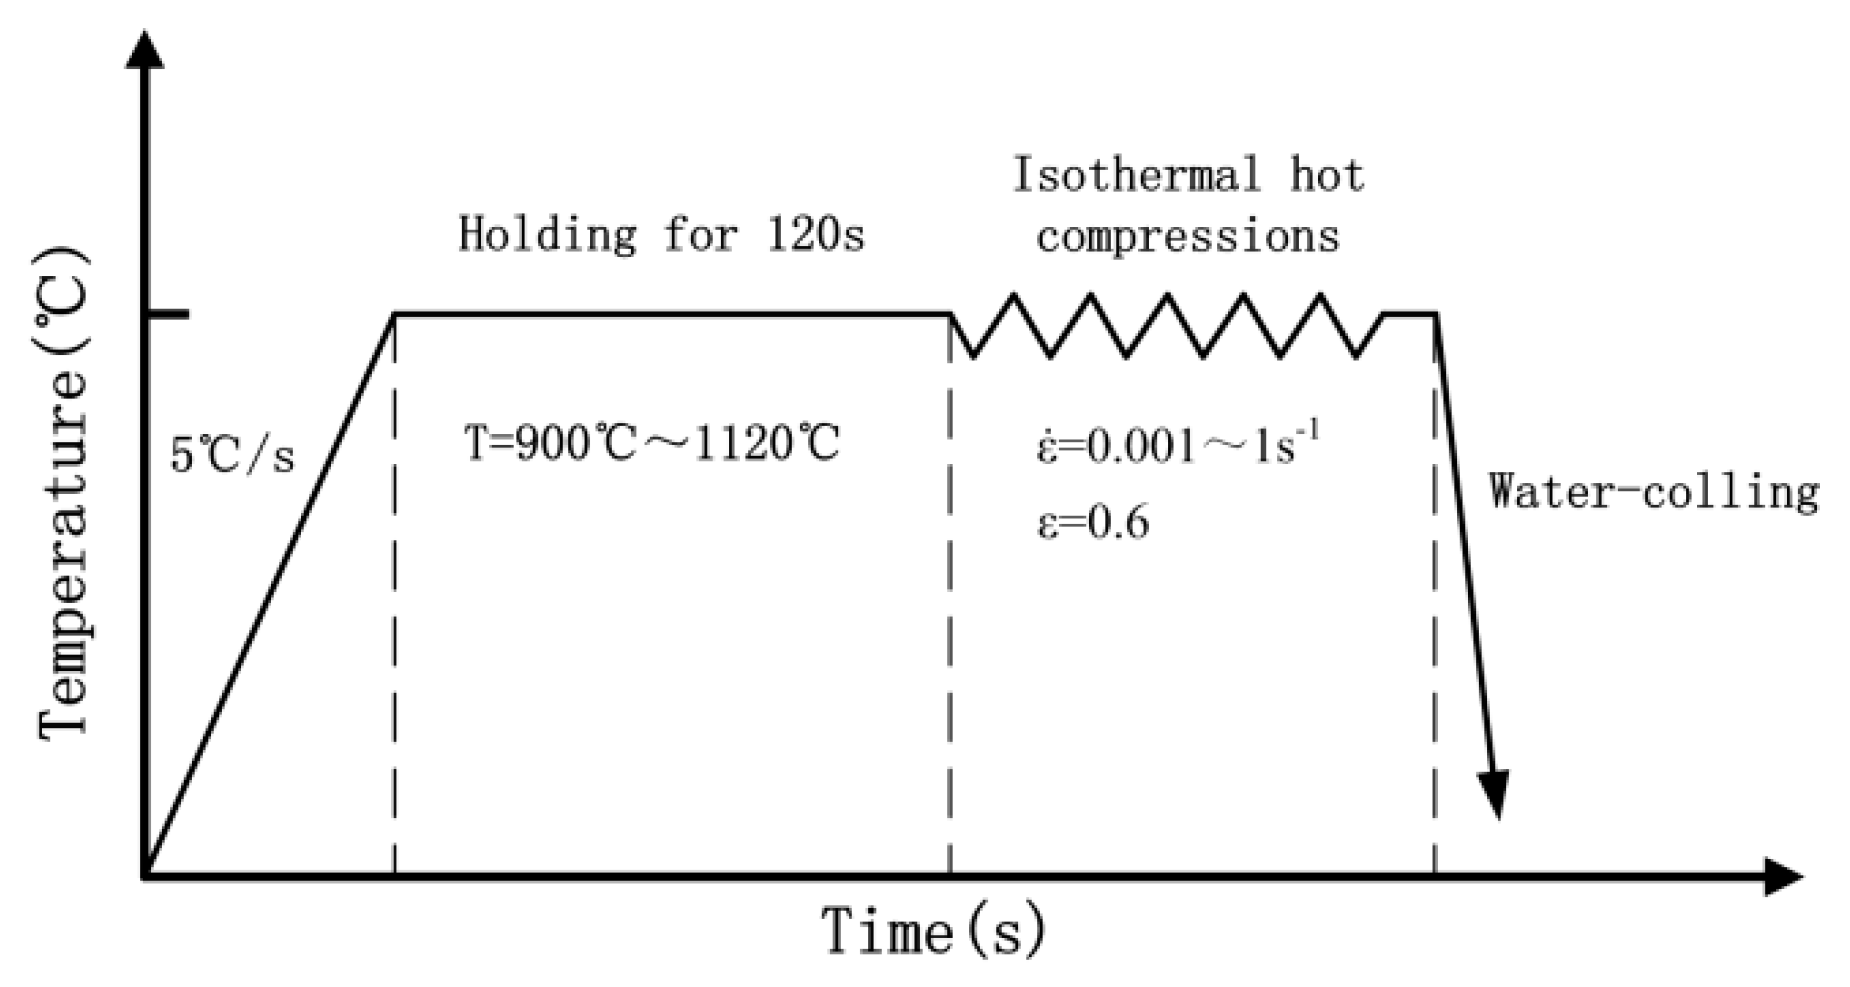
2. Experimental Materials and Methods

The material used in the experiment was a GH4169 alloy cylinder (φ 6 mm × 9 mm). The original microstructure of the sample was approximately uniform equiaxed, and the average grain size was approximately 25 µm, as shown in Figure 1. Heat treatment is necessary for the dynamic-recrystallization hot compression test of the samples. The equipment used in the experiment was the Gleeble-3800 Thermal Simulation Tester, and the specific process parameters are shown in Table 1. Figure 2 shows a flowchart of the GH4169 superalloy hot compression test. For the Gleeble-3800 thermal compression test, the alloy samples were initially heated at a rate of 5 °C/s to the required temperature (900 °C, 950 °C, 1000 °C, 1050 °C, or 1120 °C) for the experiment. Once the desired temperature was maintained for 2 min, the sample was subjected to a hot compression test at different strain rates (0.001, 0.01, 0.1, and 1 s−1). Each sample was immediately water-cooled at the end of the experiment [12,13,14].

3. Results and Discussion

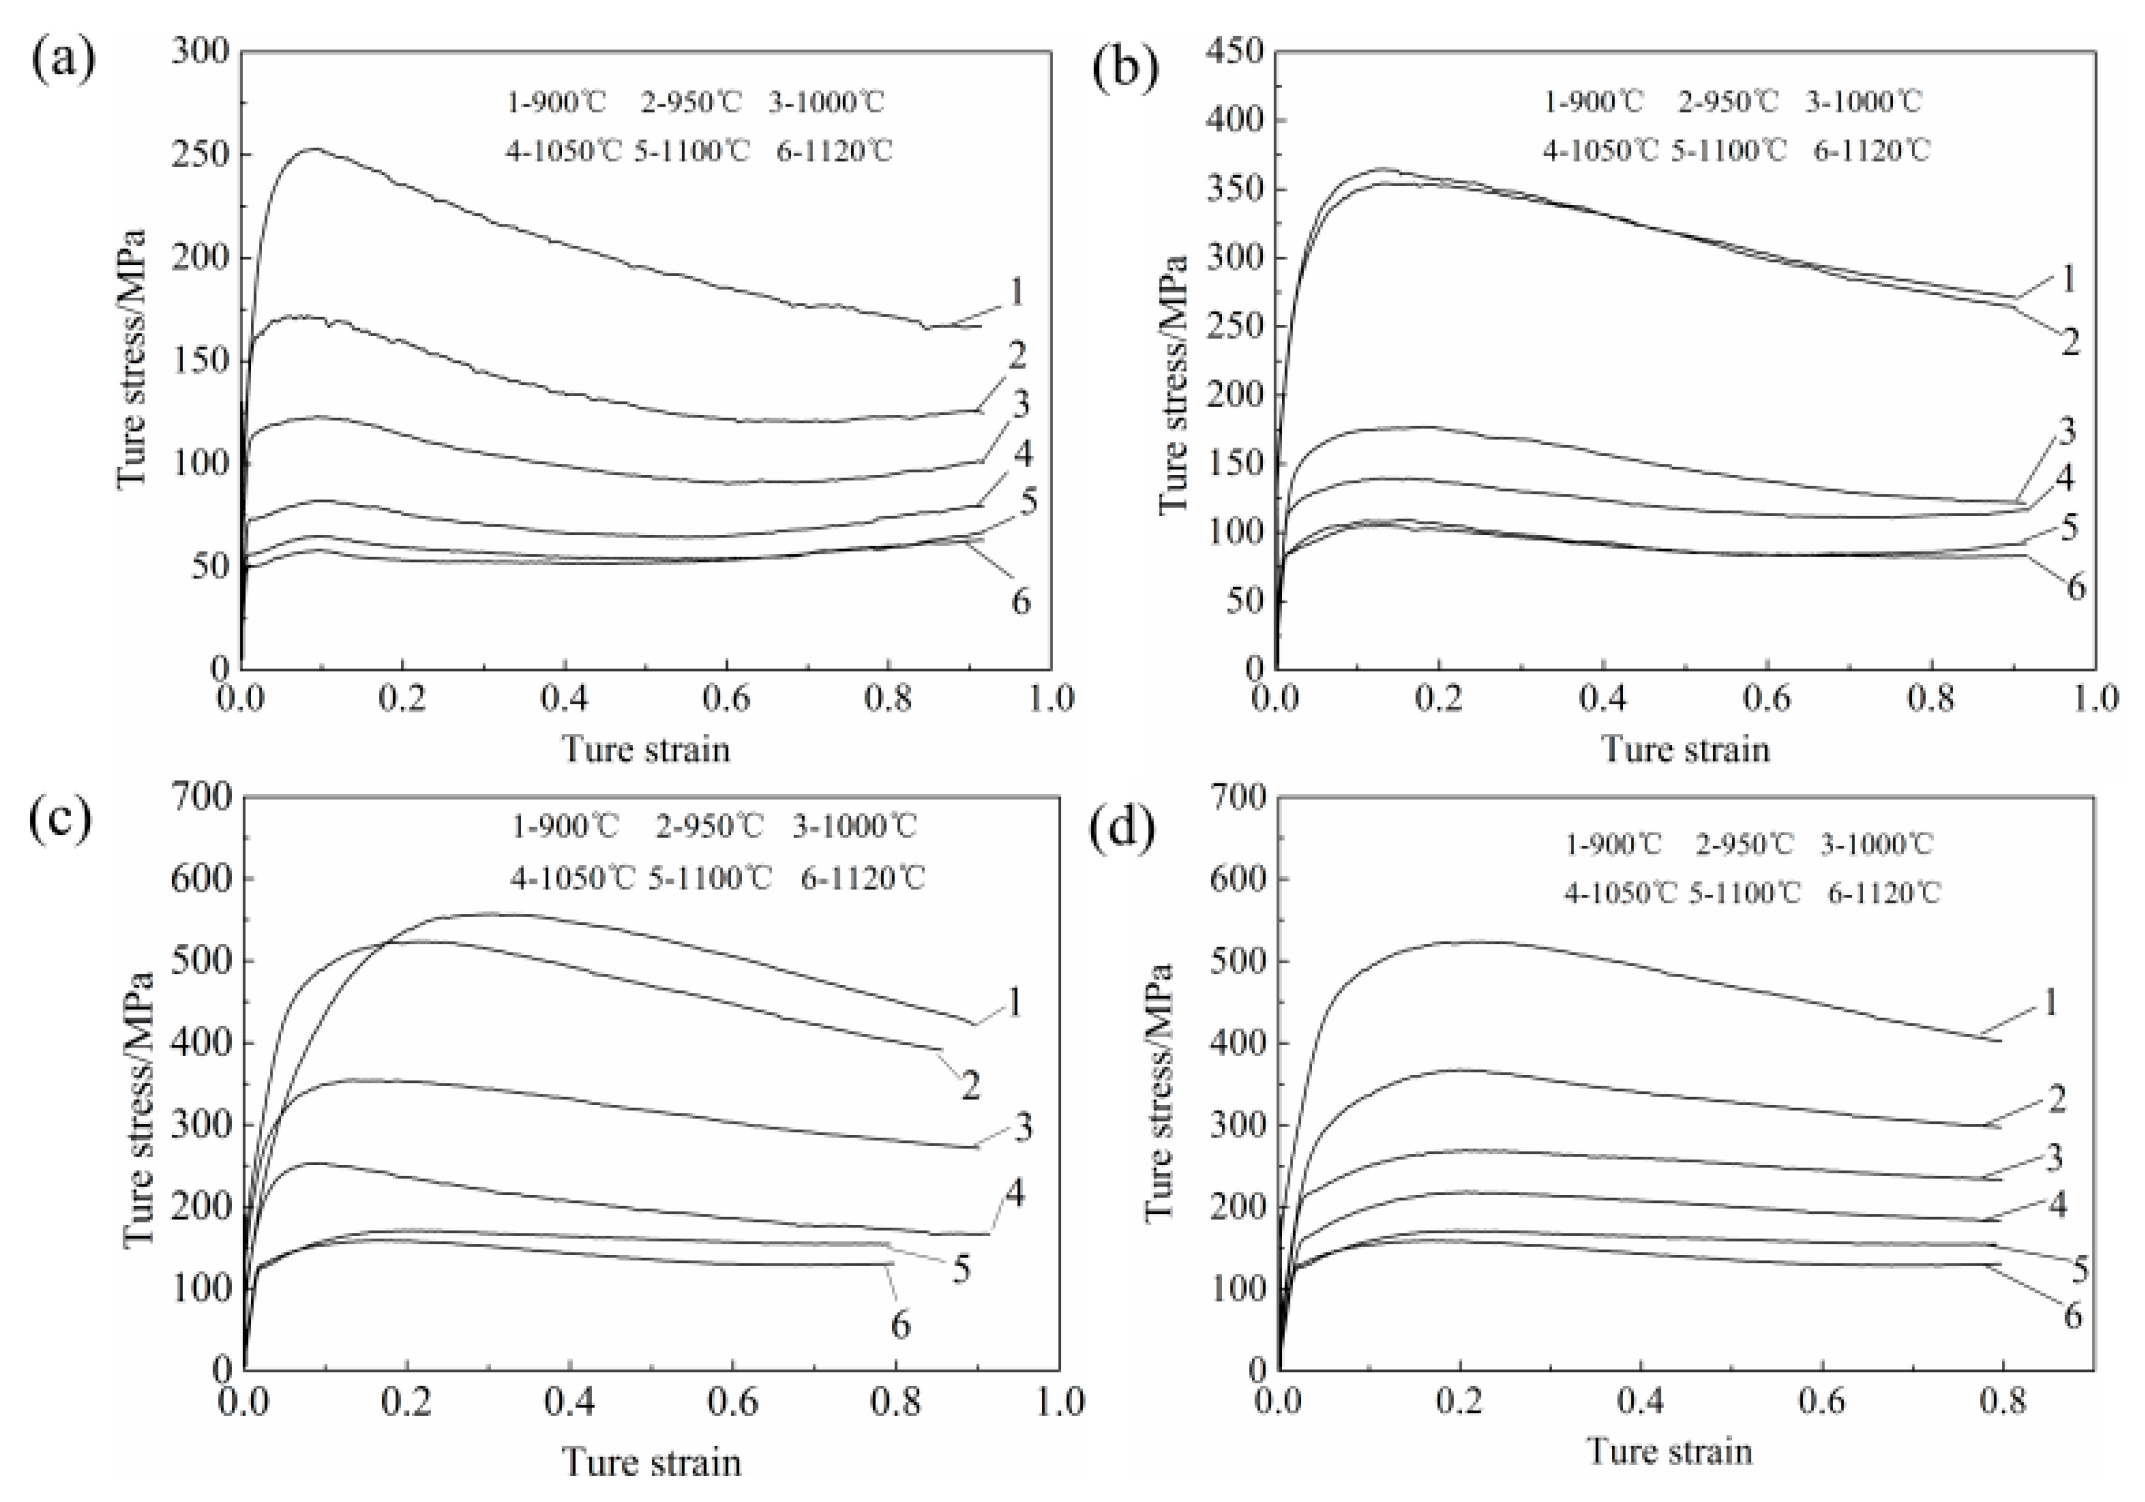
3.1. True Stress-Strain Curve at Different Strain Rates

Figure 3 shows the true stress-strain curve obtained for the GH4169 superalloy at different strain rates and temperatures. The stress gradually decreased with an increase in temperature at a given strain and strain rate. Both the peak stress and strain point corresponding to the peak stress gradually decreased with increasing temperature. The material had a similar response to thermal deformation at different strain rates; that is, the stress value increased with the deformation amount. Meanwhile, the stress value decreased with an increase in deformation when the stress value reached its maximum (peak stress). Furthermore, the stress of the material remained constant with the increase in strain when the stress value reached steady-state stress.
The sharp increase of stress in the initial stage of thermal compression deformation was due to work hardening. Although recovery and recrystallization might occur, work hardening played a leading role. Because of the slippage of grains in the process of plastic deformation and the tangling of dislocations, the grains were elongated or broken and fibrozed, which resulted in the formation of residual stress in the metal. As the deformation continued to increase, the stress was gradually reduced due to work softening. The subsequent stress reduction during deformation was mainly due to recovery and recrystallization, and work softening caused by recovery and recrystallization played a leading role in this. The stress gradually approached a stable value and remained constant with an increase in deformation. At this point, the work hardening and work softening of the material were balanced and entered a steady deformation stage [15,16].
The stress and peak stress gradually decreased with an increase in the strain rate under certain temperature conditions. The strain point corresponding to the peak stress increased with the temperature and amount of deformation. The deformation showed the same response at different temperatures; that is, the stress began to rapidly increase due to work hardening and reached a peak as the amount of deformation increased. Then, the stress gradually decreased and stabilized due to the influence of work softening [17,18].

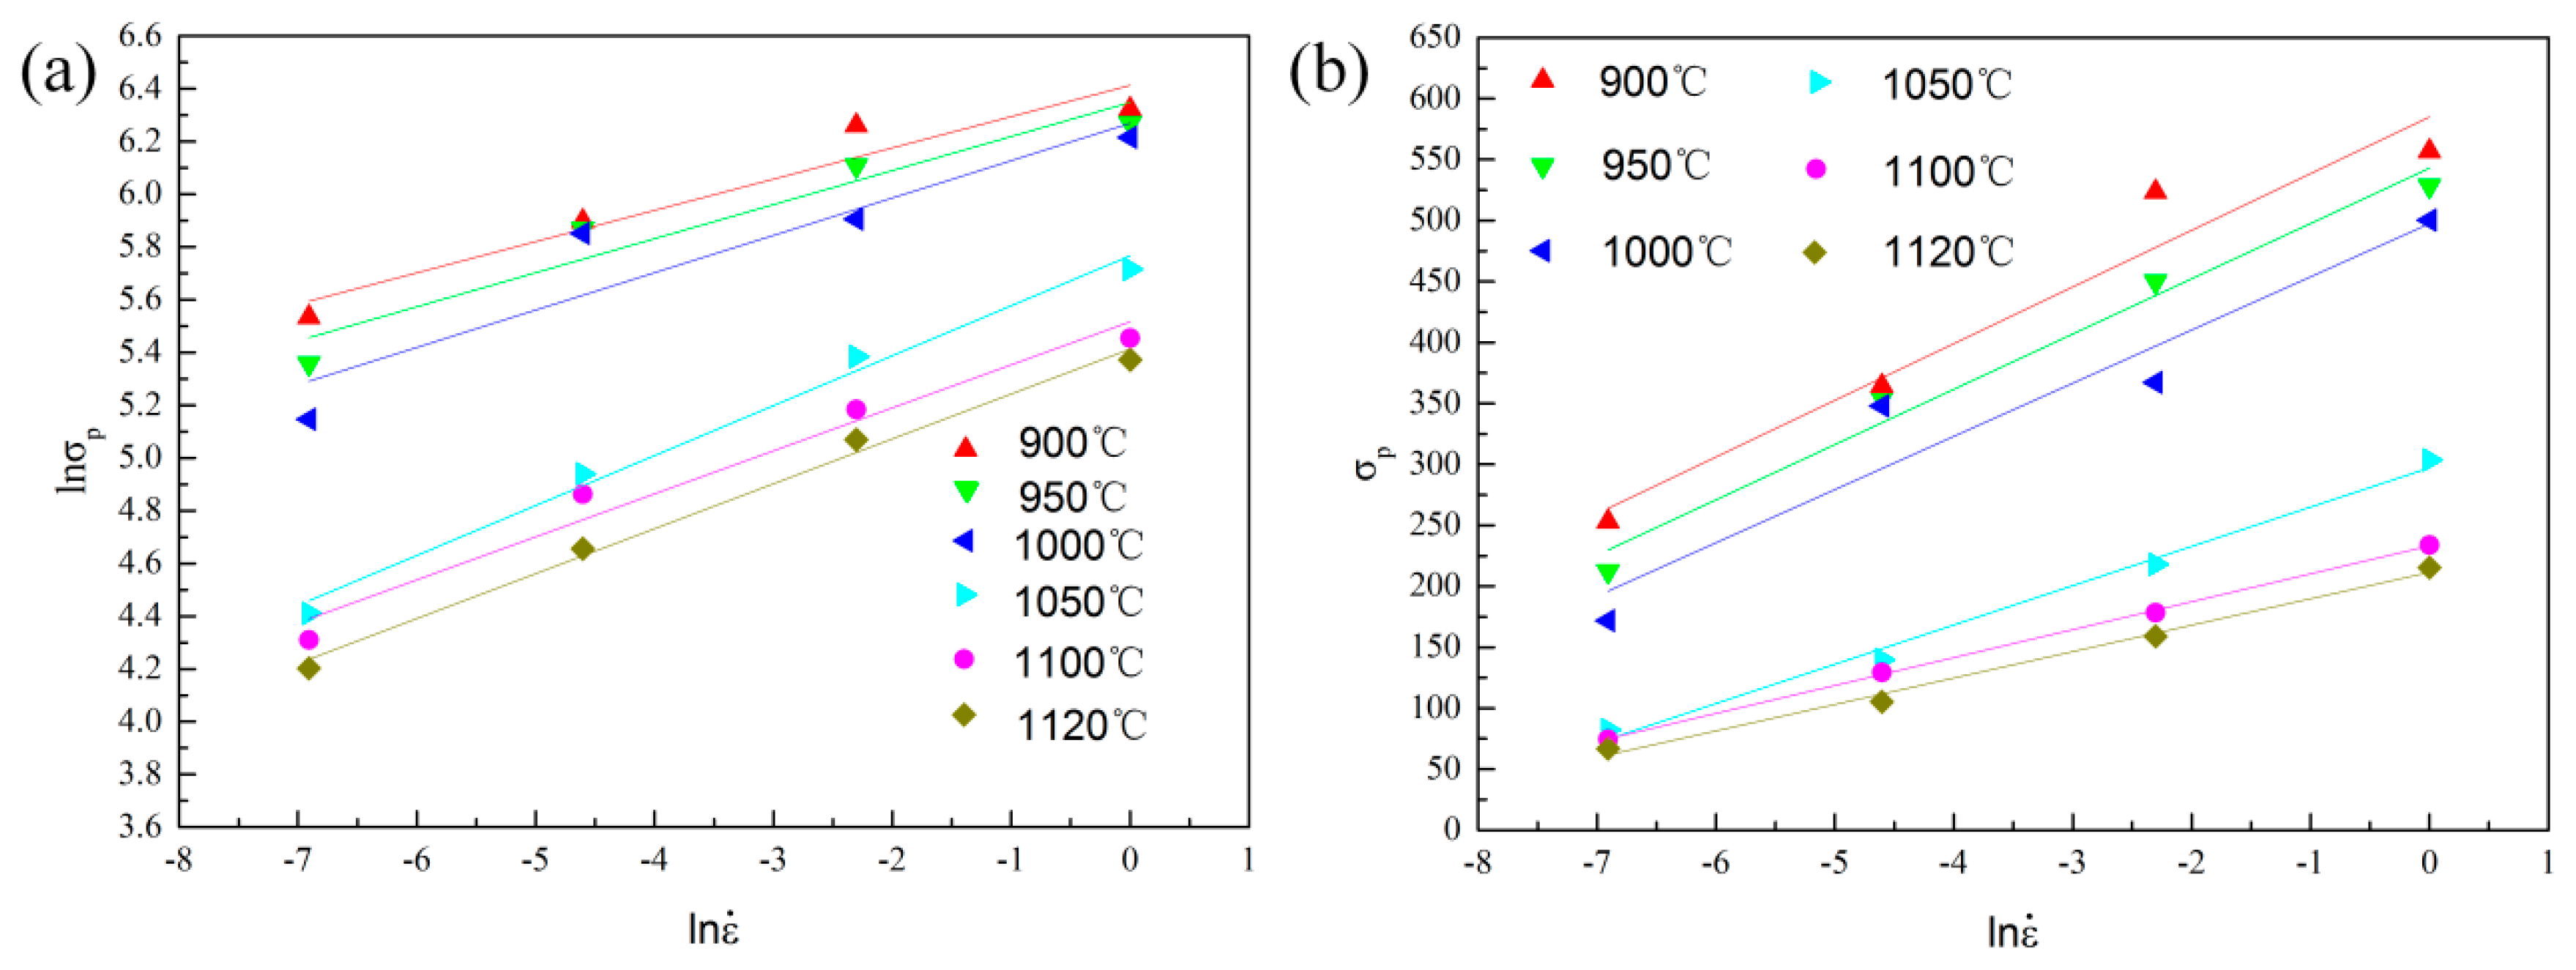
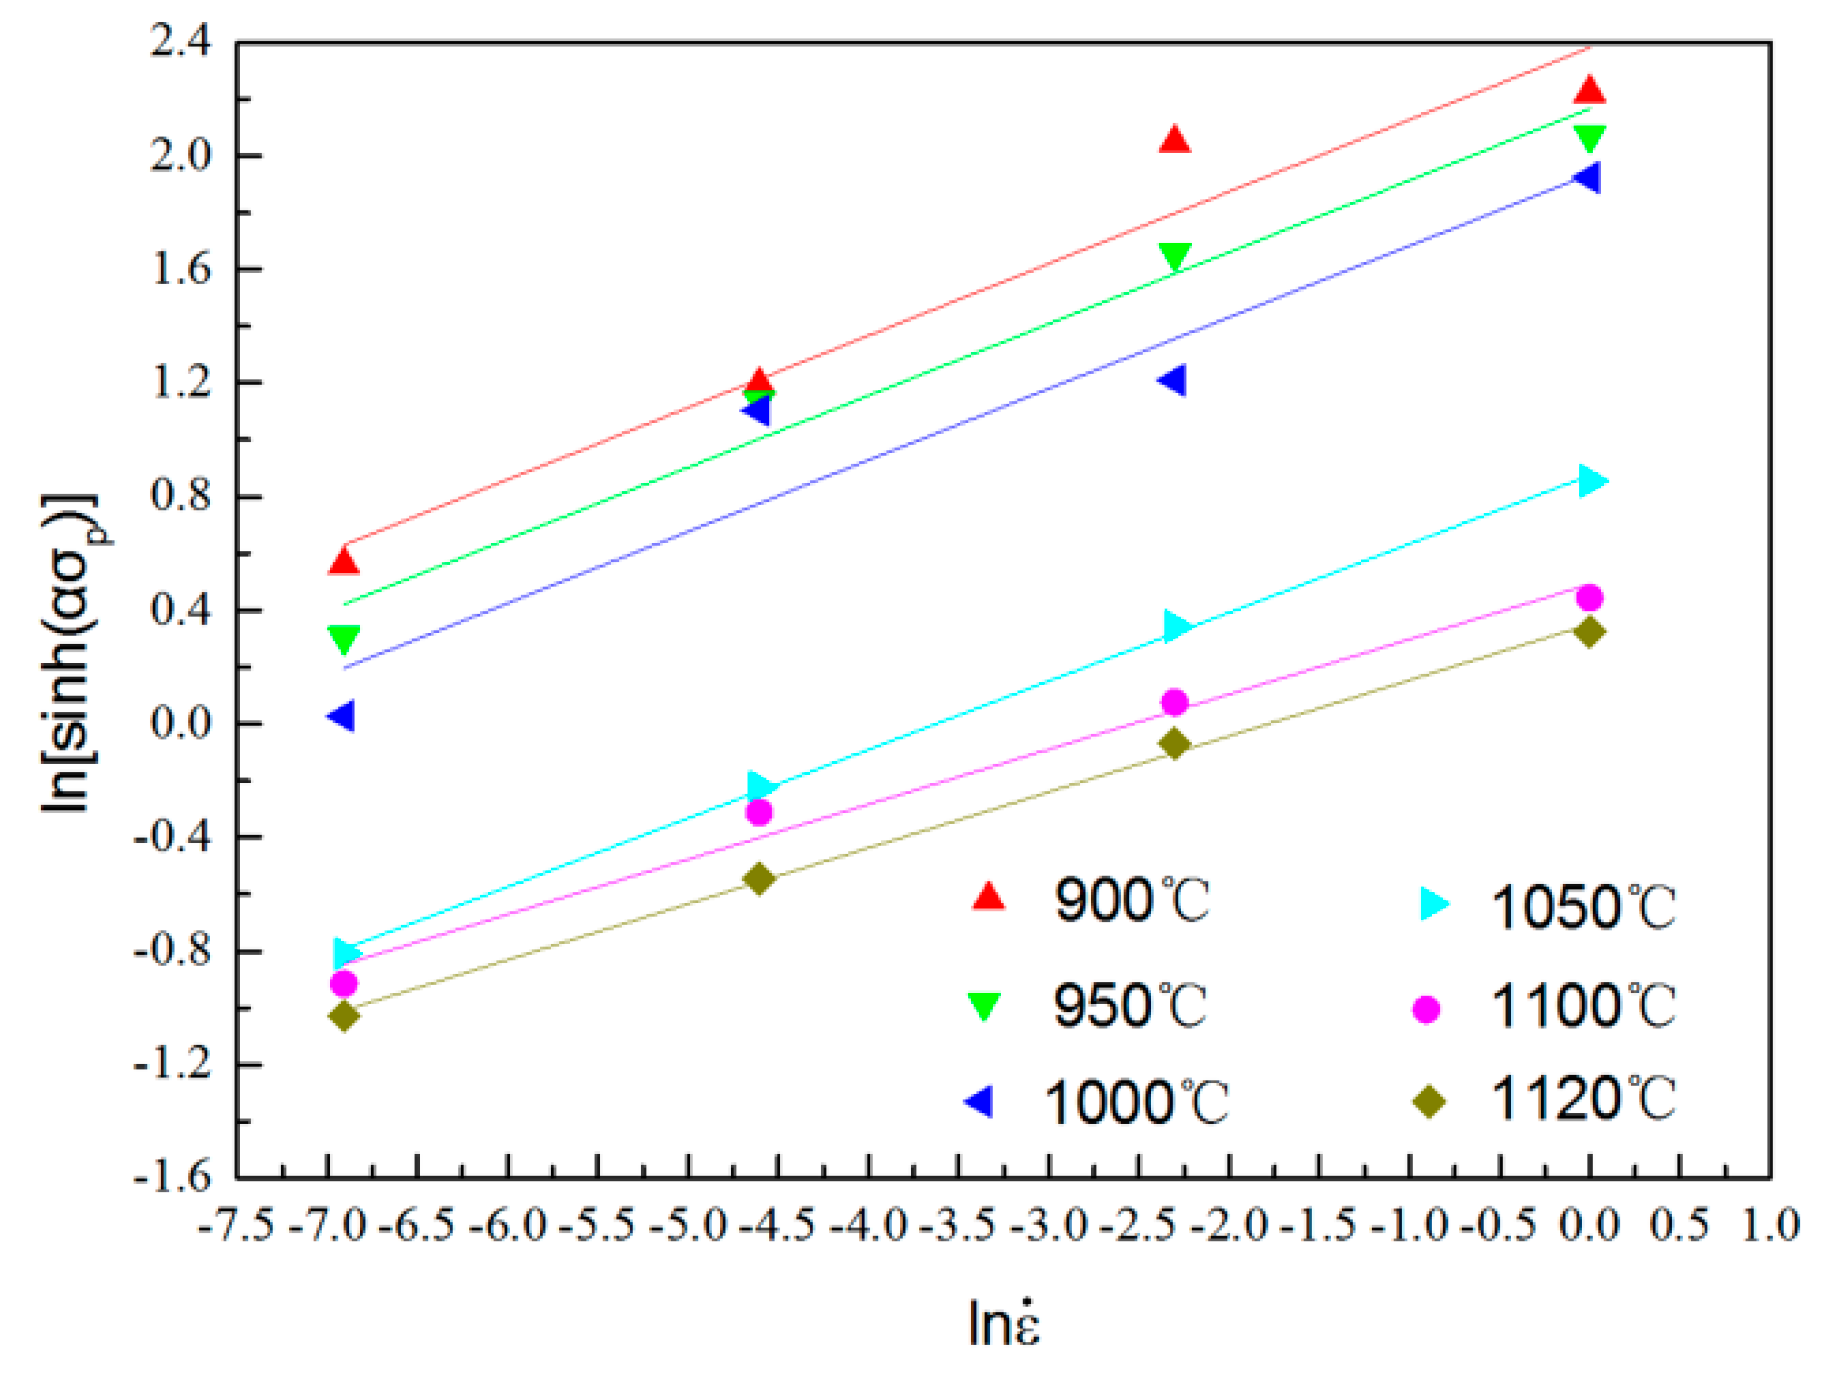
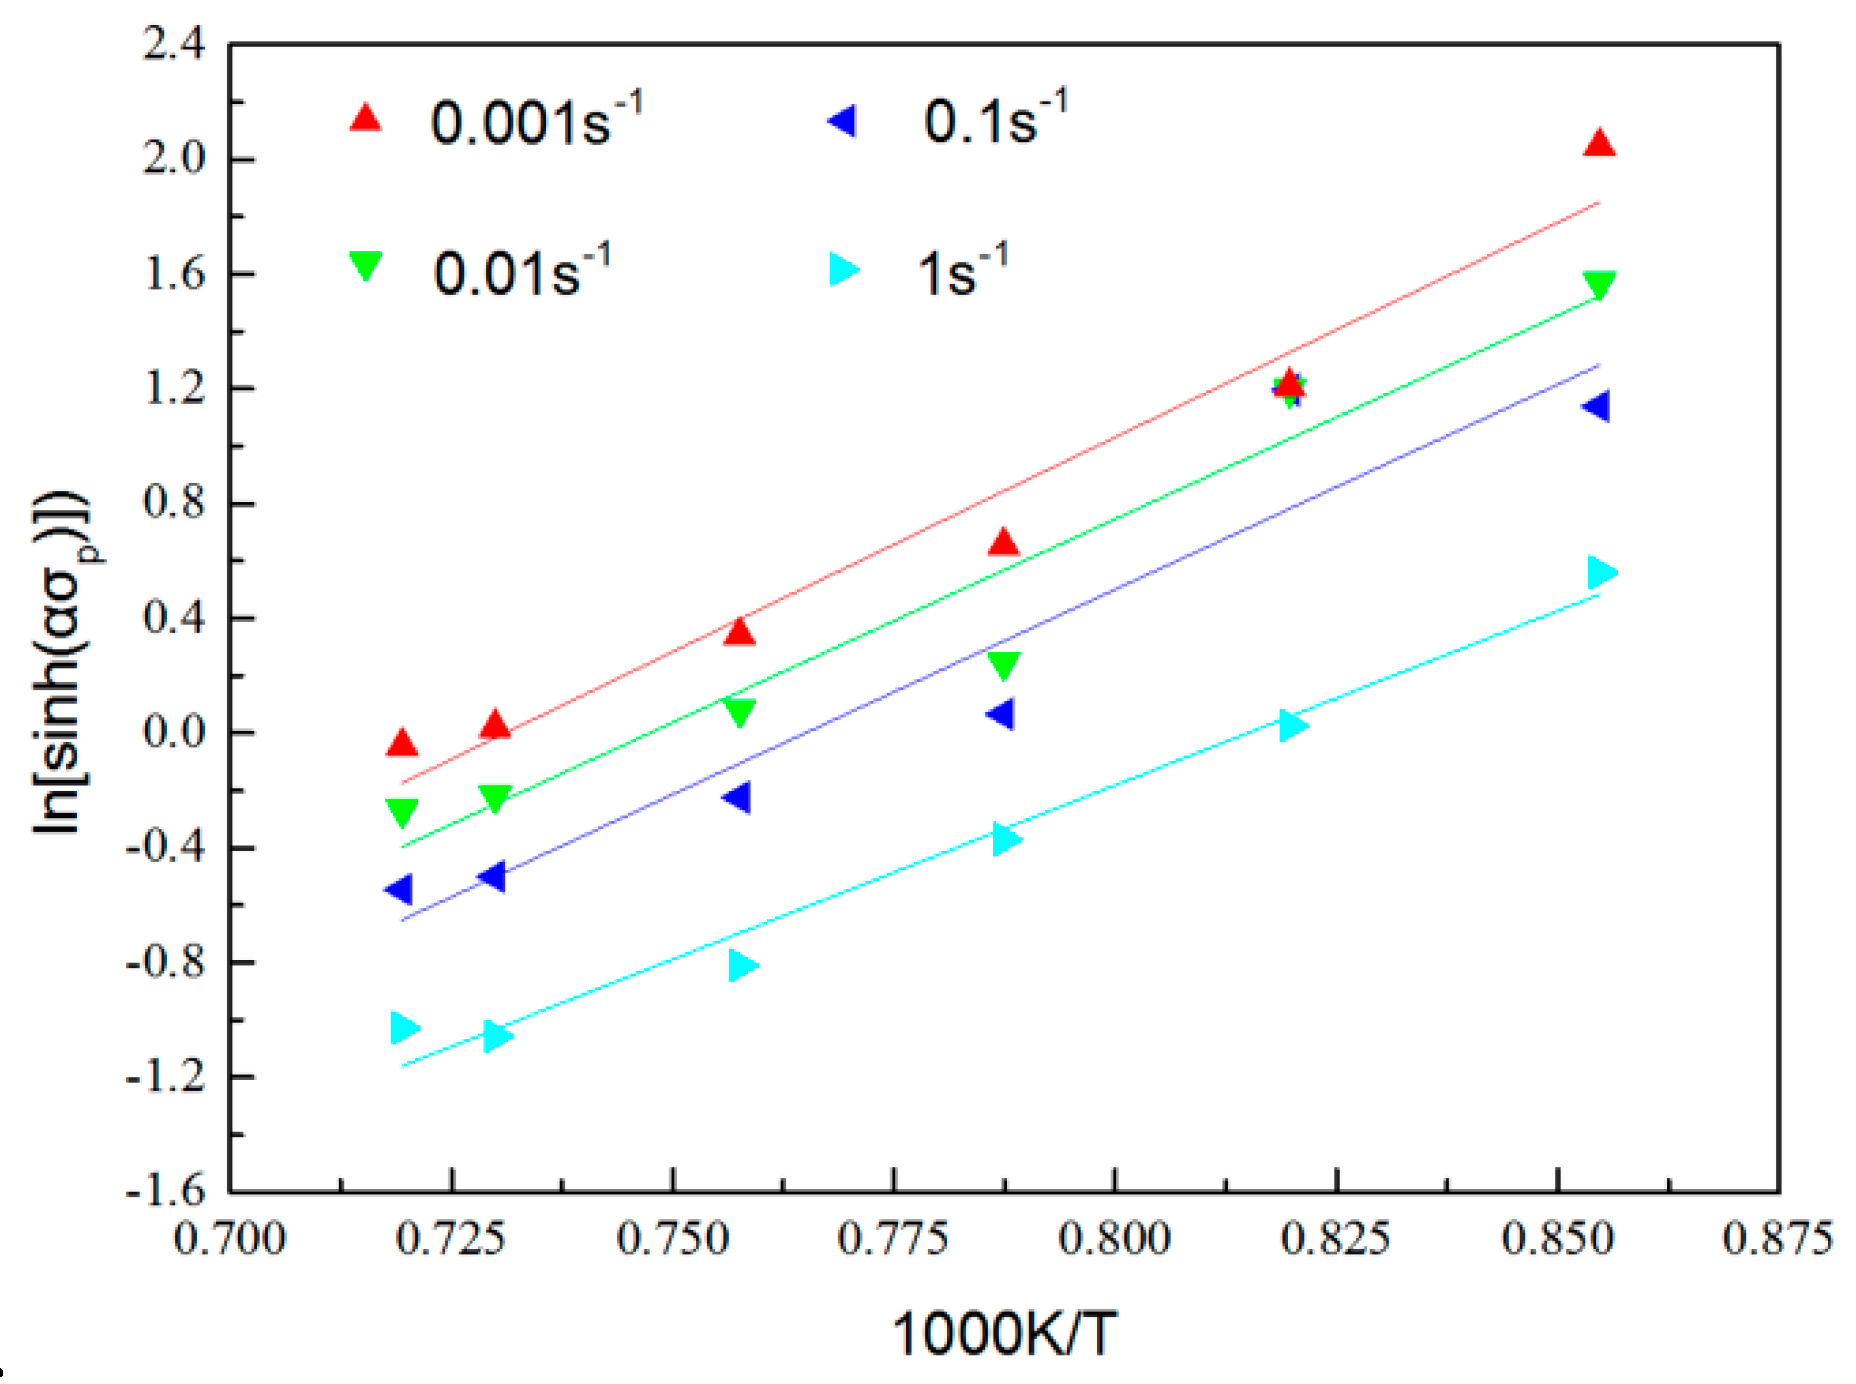
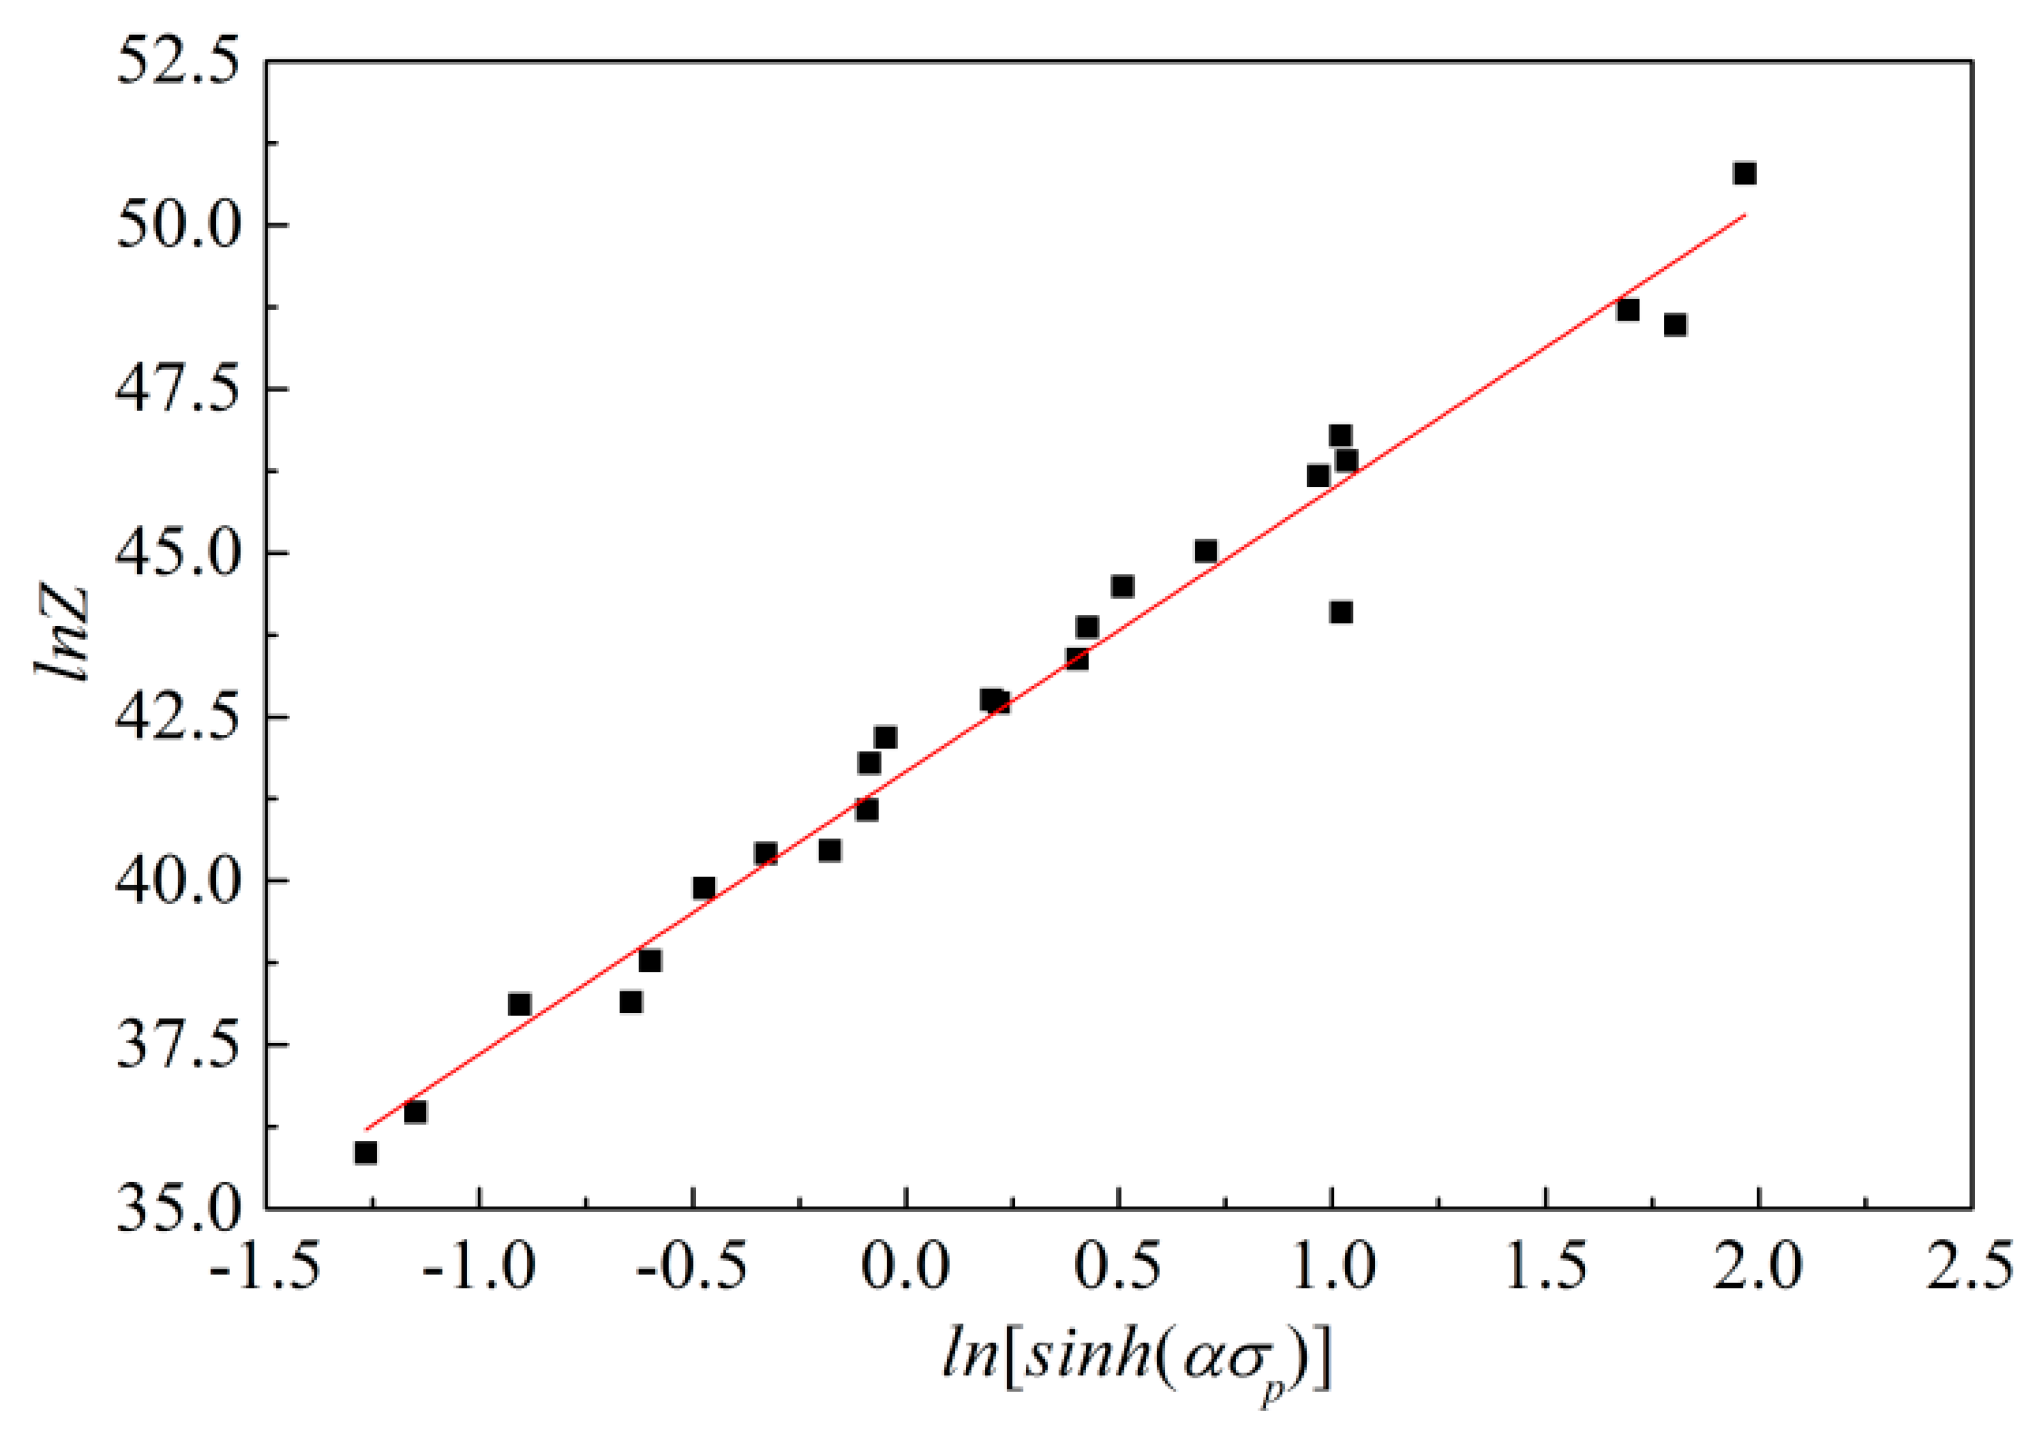
3.2. Construction of Constitutive Equations

The flow stress of the metal during hot deformation is related to the thermodynamic parameter Z and deformation rate ε ˙ of the material. The relation is expressed as follows [19,20]:
Z   =   ε ˙ e x p ( Q R T ) ,
where Q is the thermal deformation activation energy of the material, R is the gas constant, and T is the absolute temperature.
Materials have different stress function forms under different conditions, as follows:
F ( σ )   =   A 1 σ n ( α σ < 0.8 )
F ( σ )   =   A 2 e x p ( β σ ) ( α σ > 1.2 )
where A i (I = 1, 2, 3); α, β, and n are the material parameters.
The sinusoidal equation proposed by Sellars et al. is generally used to describe the relationship between various material parameters during plastic deformation and is expressed as follows:
ε ˙   =   A [ s i n h ( α σ ) ] n e x p [ Q R T ]
where α, n, A, and β are the material parameters. Q is the thermal deformation activation energy of the material. R is the gas constant, which is a fixed value (R = 8.31). ε ˙ is the deformation rate. Σ is the flow stress, and T denotes absolute temperature.
Substituting Equations (2) and (3) into Equation (6) and deriving on two sides of the equation, Equation (7) could be obtained.
l n ε ˙   =   l n A 1 + n l n σ Q R T
l n ε ˙   =   l n A 2 + β σ Q R T
For convenience, the logarithmic form of the equation is often employed. Then, the corresponding graphs are made with the coordinates of l n ε ˙ and lnσ and l n   ε ˙ and σ, respectively. As shown in Figure 4, the peak stress corresponding to different strain rates at different temperatures was calculated. The data are also shown in Table 2.
The diagram in Figure 4 could be fitted, where the average slope of each ln ε ˙ -lnσp line could be calculated based on Equation (6) and Figure 4a, and the ln ε ˙ -lnσp lines could be calculated based on Equation (7) and Figure 4b. The resulting average slopes were n = 5.954252 and β = 0.031217. Given α = β/n, α = 0.0052428 could also be obtained.
Deriving on both sides of Formula (6):
l n ε ˙   =   l n A + n l n [ s i n h ( α σ ) ] Q R T
Performing partial derivation of 1/T at a certain strain rate for Equation (8) yields:
Q   =   R [ l n ε ˙ l n [ s i n h ( α σ ) ] ] T [ l n [ s i n h ( α σ ) ] ( 1 / T ) ]
The activation energy of the material is constant when the strain rate is constant. The n values fitted in Figure 4 were substituted into Equation (9) to obtain l n ε ˙ and ln[sinh(ασ)] at different deformation temperatures and ln[sinh(ασ)] and 1000/T at different strain rates, where 1000 times 1/T was used for convenient calculation, as shown in Figure 5 and Figure 6.
The average slope k = 0.231755 of each straight line could be calculated based on the straight line fitted in Figure 5, and the average slope of each straight line t = 13.90354 could be calculated based on the straight line fitted in Figure 6. Based on Equation (9), the thermal deformation energy of the material could be calculated as follows:
Q   =   R T k = 498.54 k J m o l   =   498540   J / m o l
From Equations (1) and (6), Equation (11) was obtained:
Z   =   ε ˙ e x p ( Q R T )   =   A [ s i n h ( α σ ) ] n
Performing derivation on both sides of Equation (11):
l n Z   =   l n ε ˙ + Q R T
l n Z   =   l n A + n l n [ s i n h ( α σ ) ]
The corresponding value of lnZ could be calculated by comparing the peak stress values for different temperatures and strain rates, and the corresponding lnZ and ln[sinh(ασp)] maps were fitted using Equation (13), as shown in Figure 7. The slope of the line was n = 4.56568, and the intercept was lnA = 42.21596 (A = 2.1585 × 10¹⁸). Thus, Z   =   2.1585 × 10 18 × [ s i n h ( 0.0052428 σ ) ] 4.56568 was obtained.
Substituting all e values obtained into Equation (6) yielded the constitutive equation of the alloy, as shown in Equation (14).
ε ˙   =   2.1585 × 10 18 × [ s i n h ( 0.0052428 σ ) ] 4.56568 × e x p ( 498540 R T )

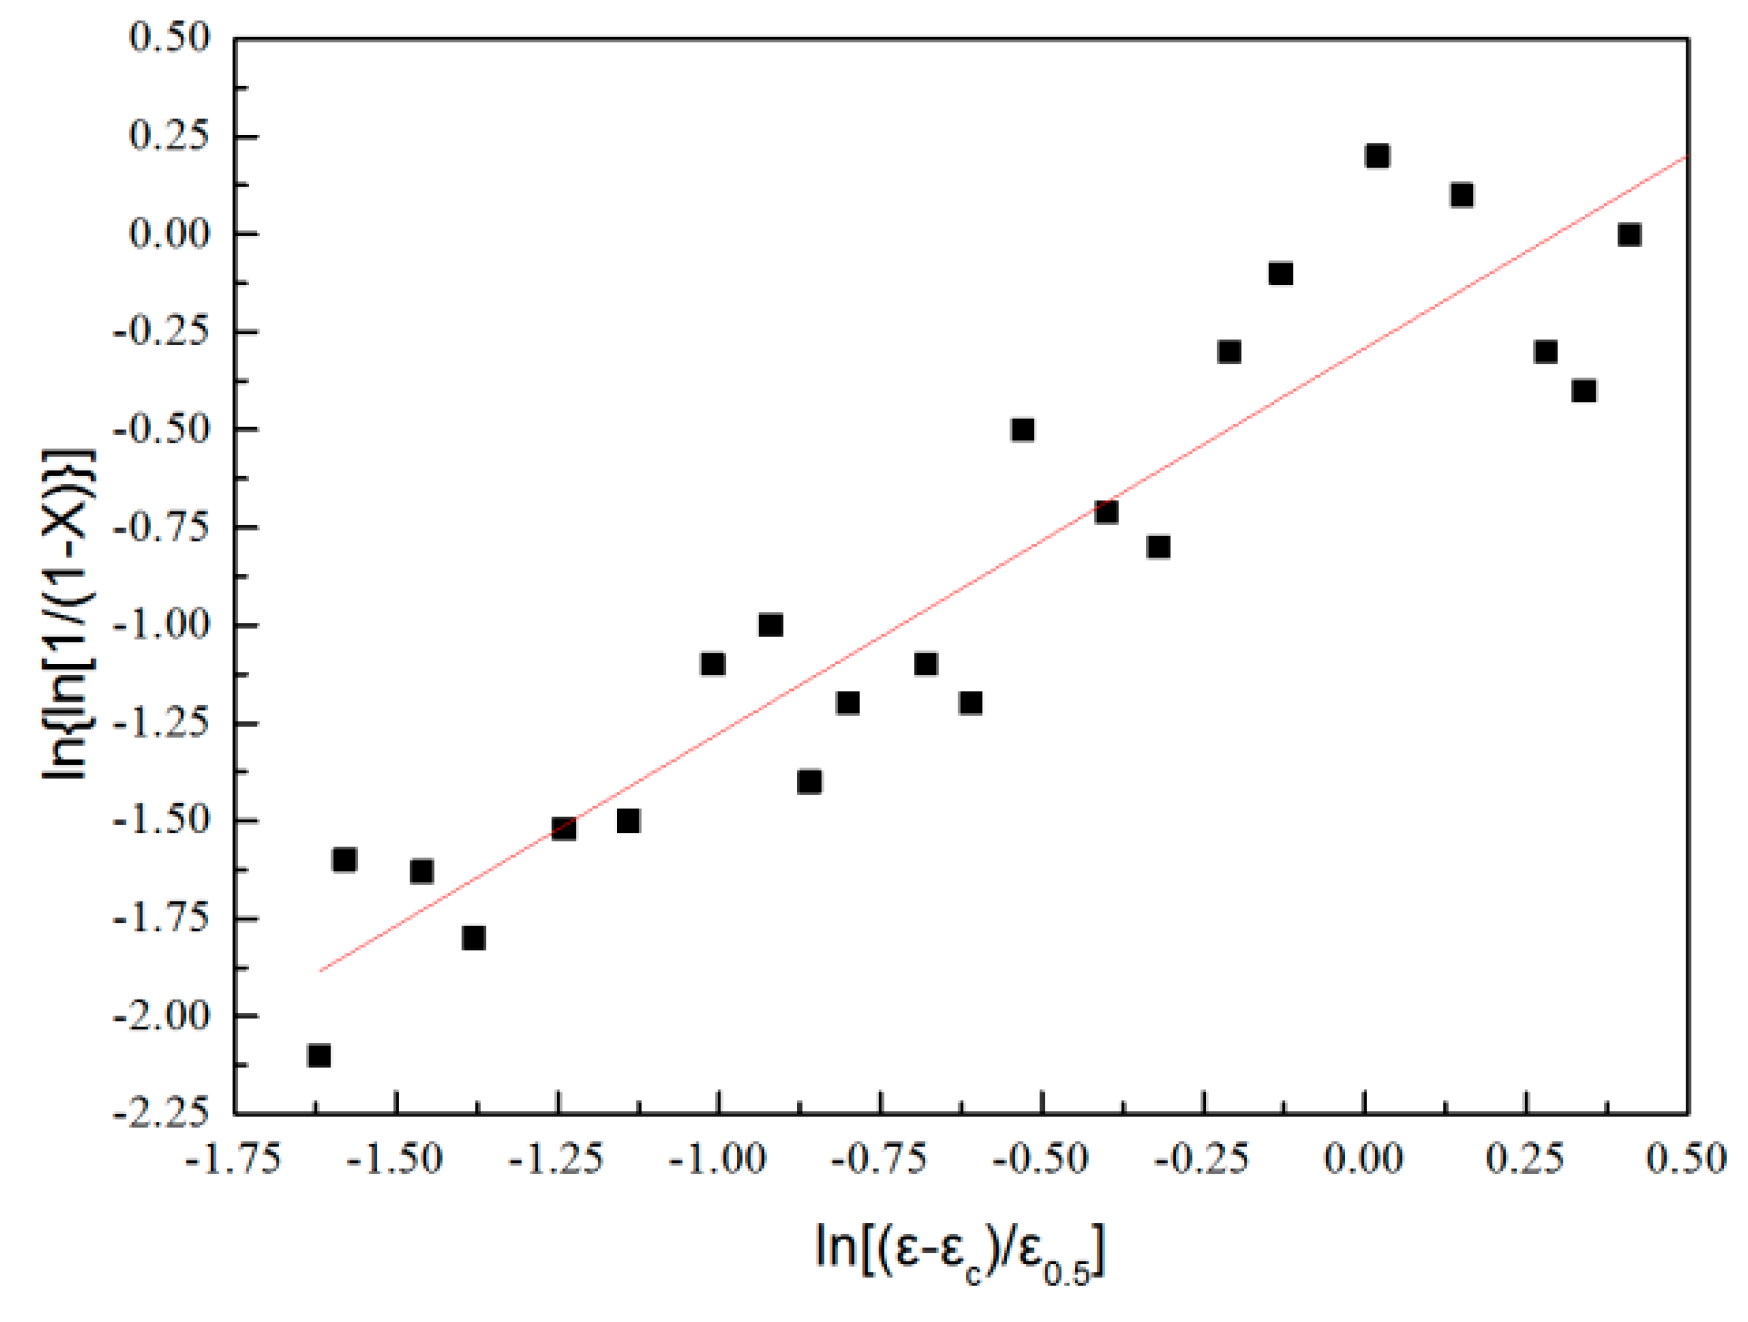
3.3. Dynamic Recrystallization Model

3.3.1. Proposed Model

Existing studies generally use the Avrami equation to describe the recrystallization degree quantitatively [21,22]:
X   =   1 e x p [ k ( ε ε c ε 0.5 ) n ]
where X is the dynamically recrystallized volume fraction of the material; k and n are the material parameters; ε is a dependent variable; εc is the critical strain; ε 0.5 is the recrystallized amount of the material when 50% strain is reached.
Peak strain model:
ε p   =   A Z m
where A and m are the material parameters; Z is the temperature compensation factor.
Critical strain model:
ε c   =   k ε p
where k ranges from 0.6 to 0.85, and a value of 0.8 was used in this study.
A quantitative description of the recrystallization quality is usually given by:
D 2 d r e x   =   A 1 Z A 2
where A1 and A2 are material-dependent constants.

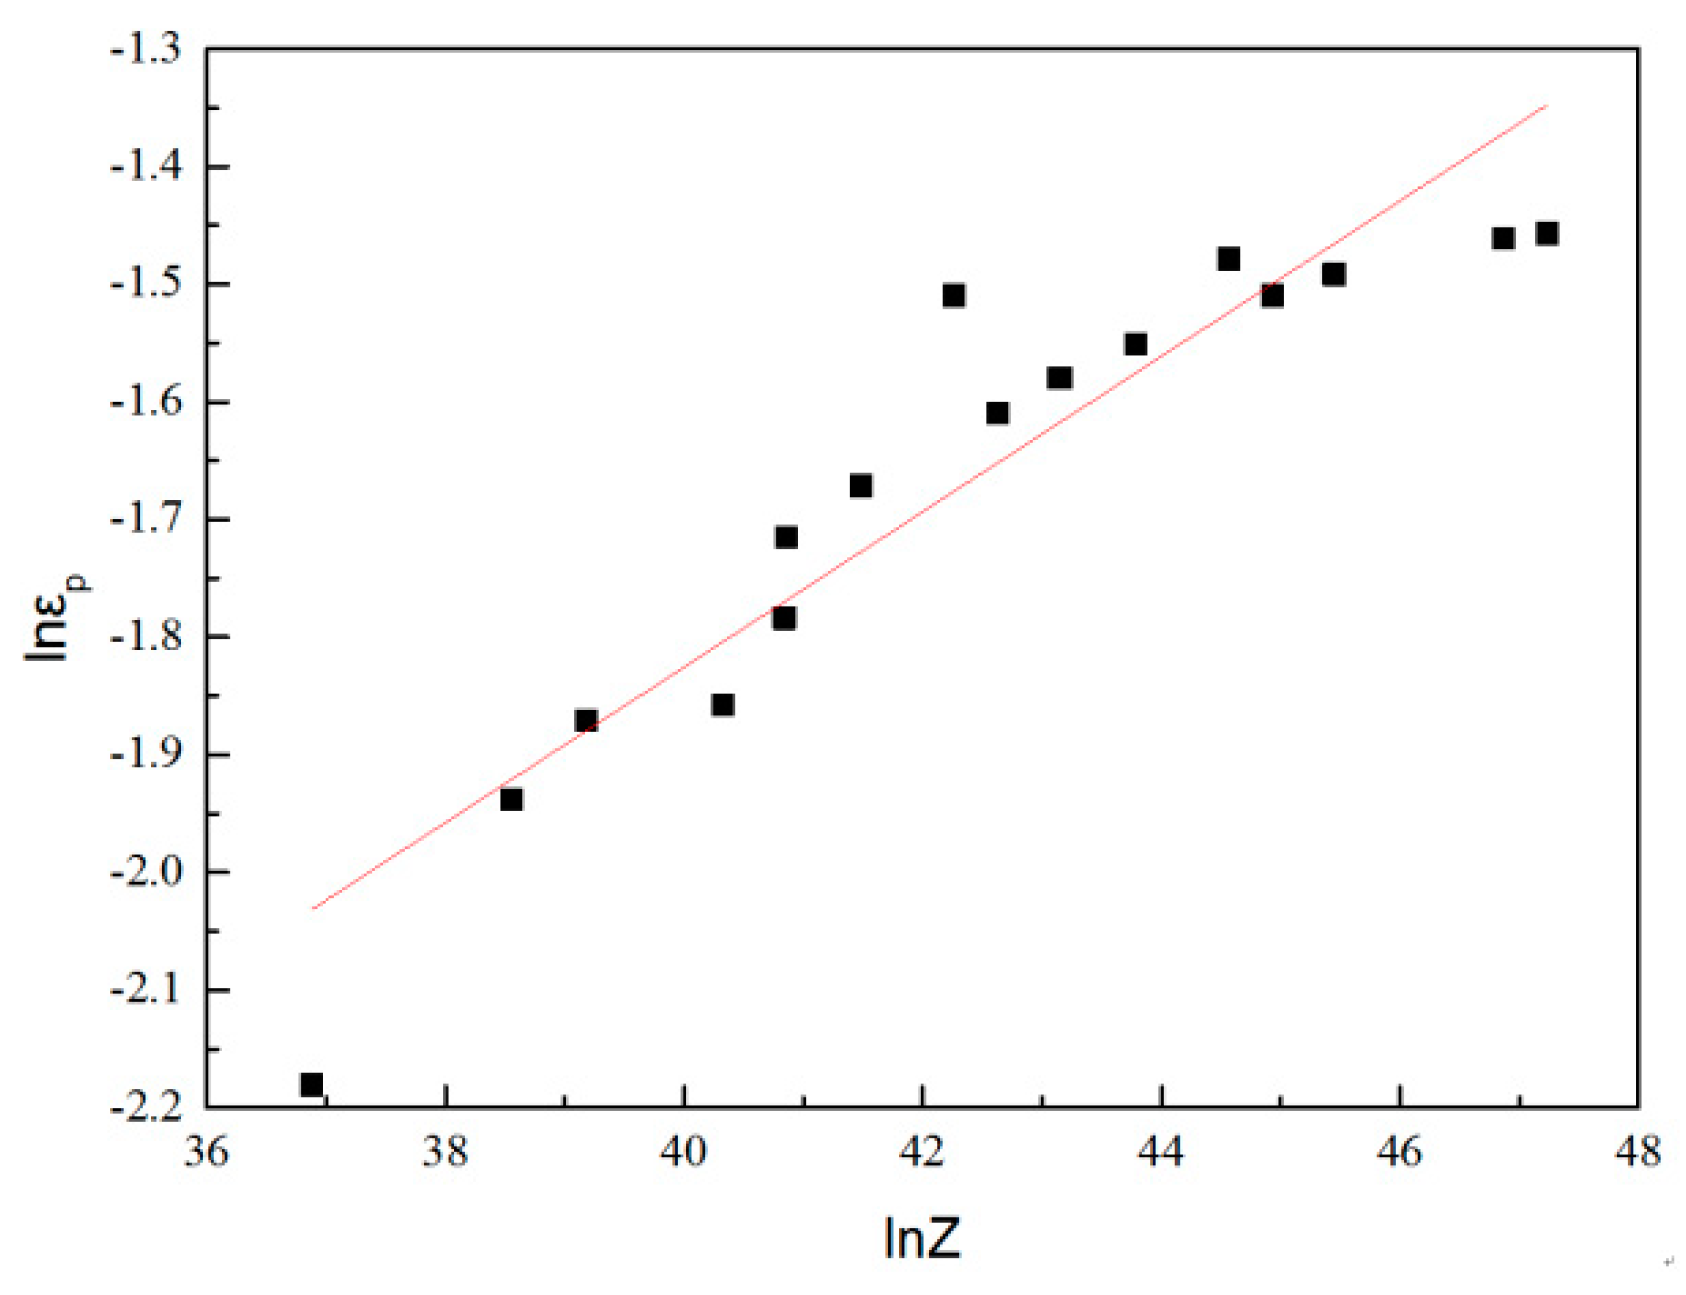
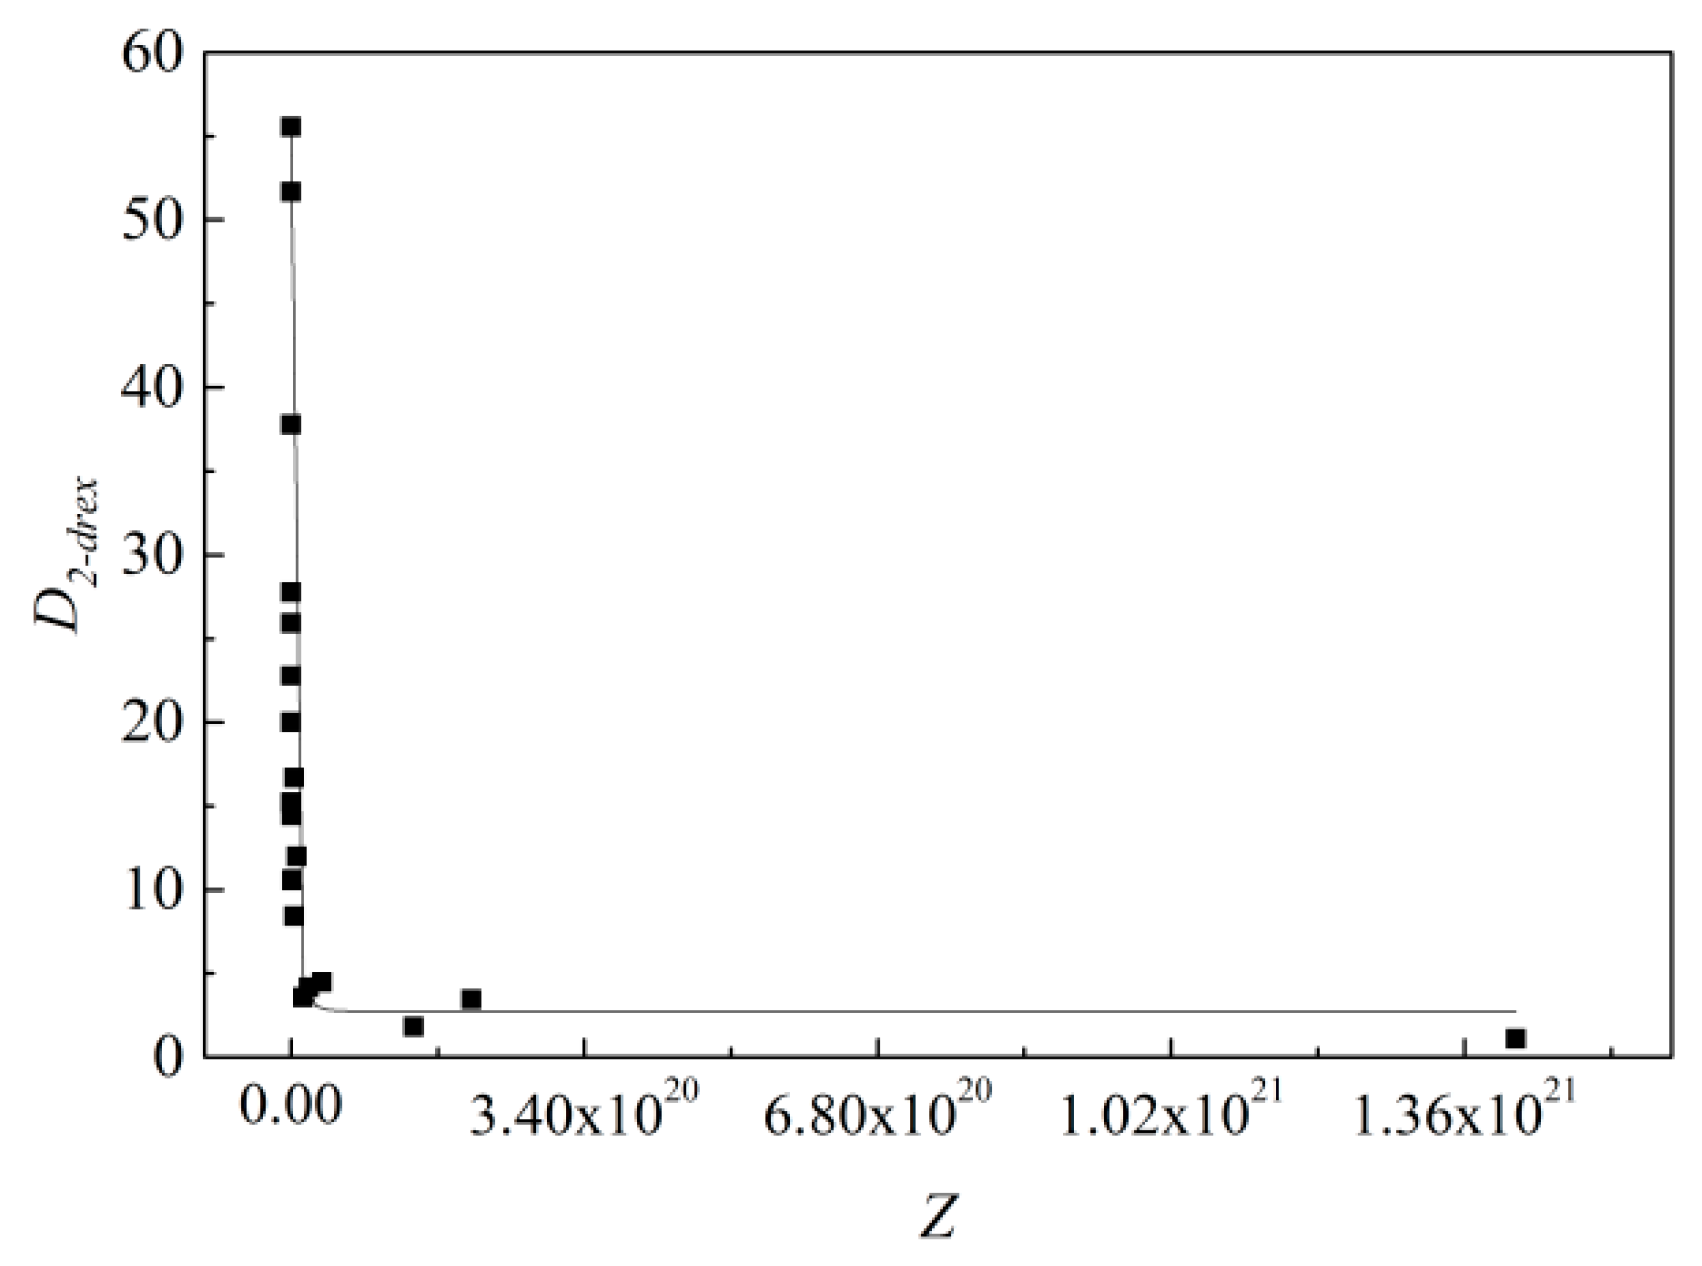
3.3.2. Model Establishment

The peak strain value of the material during hot deformation could be obtained through experiments, and the corresponding recrystallization volume fraction and lnZ value were calculated, as shown in Table 3.
Simplifying Equation (16) yielded:
l n ε p   =   l n A + m l n Z
As shown in Equation (18), the corresponding lnεp and lnZ maps could be constructed and fitted (Figure 8). The intercept of the line was lnA = −4.46775, that is, A = 1.15 × 10⁻², and the slope of the line was m = 0.067.
Substituting the obtained A and m values into Equation (16) yielded Equation (20).
ε p   =   1.15 × 10 2 Z 0.067
Then, by Equation (17):
ε c   =   9.2 × 10 3 Z 0.067
The strain value corresponding to material recrystallization of 50% could be obtained by performing Newton interpolation on the parameter values obtained from the experiment, as shown in Equation (22).
ε 0.5   =   0.29 Z 0.016
Simplifying Equation (15) yielded:
l n [ l n ( 1 1 X ) ]   =   l n k + n l n ( ε ε c ε 0.5 )
The corresponding ln{ln[1/(1 − X)]} and ln[(εεc)/ε0.5] maps could be constructed from Equation (23), and a linear fit could be performed, as shown in Figure 9. By fitting the data in Figure 9, one found k = 0.812 and n = 0.92.
Substituting the values of k and n into Equation (15) yielded:
X   =   1 e x p [ 0.812 ( ε ε c ε 0.5 ) 0.92 ]
The grain size of the microstructure calculated according to the GH4169 high-temperature dynamic recrystallization metallographic structure diagram is shown in Table 4. According to the data in the table, the logarithmic fitting of D2-drex and Z could be used to find the corresponding model parameters. The fitted image is shown in Figure 10. The obtained dynamic recrystallization crystal mass equation is shown in Equation (25).
D 2 d r e x   =   3 × 10 6 Z 0.3016

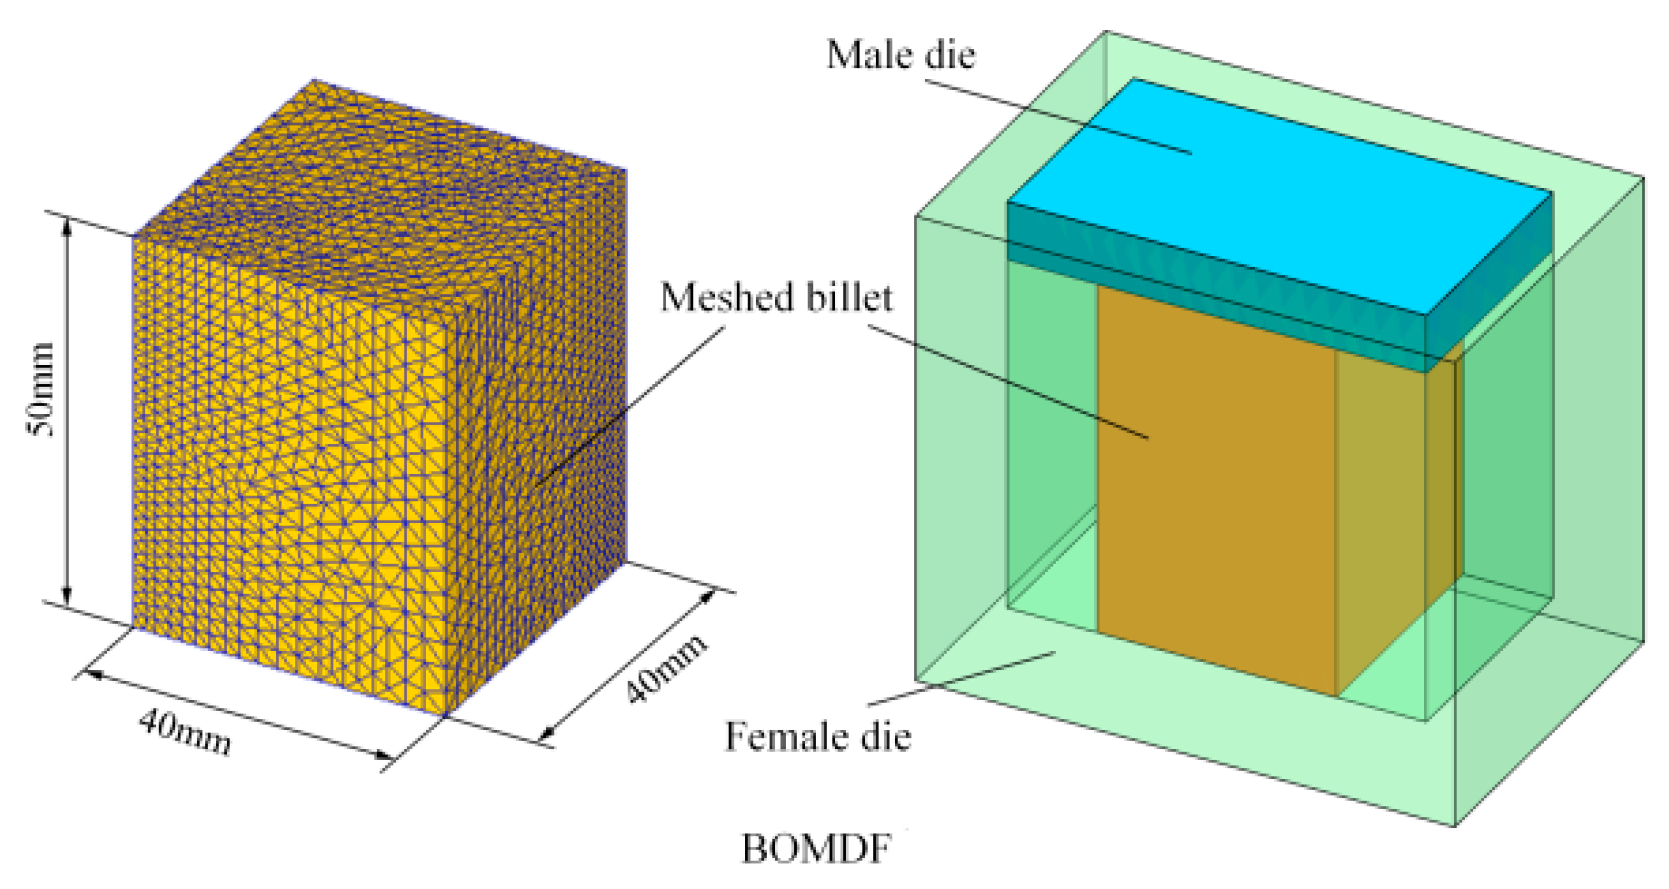
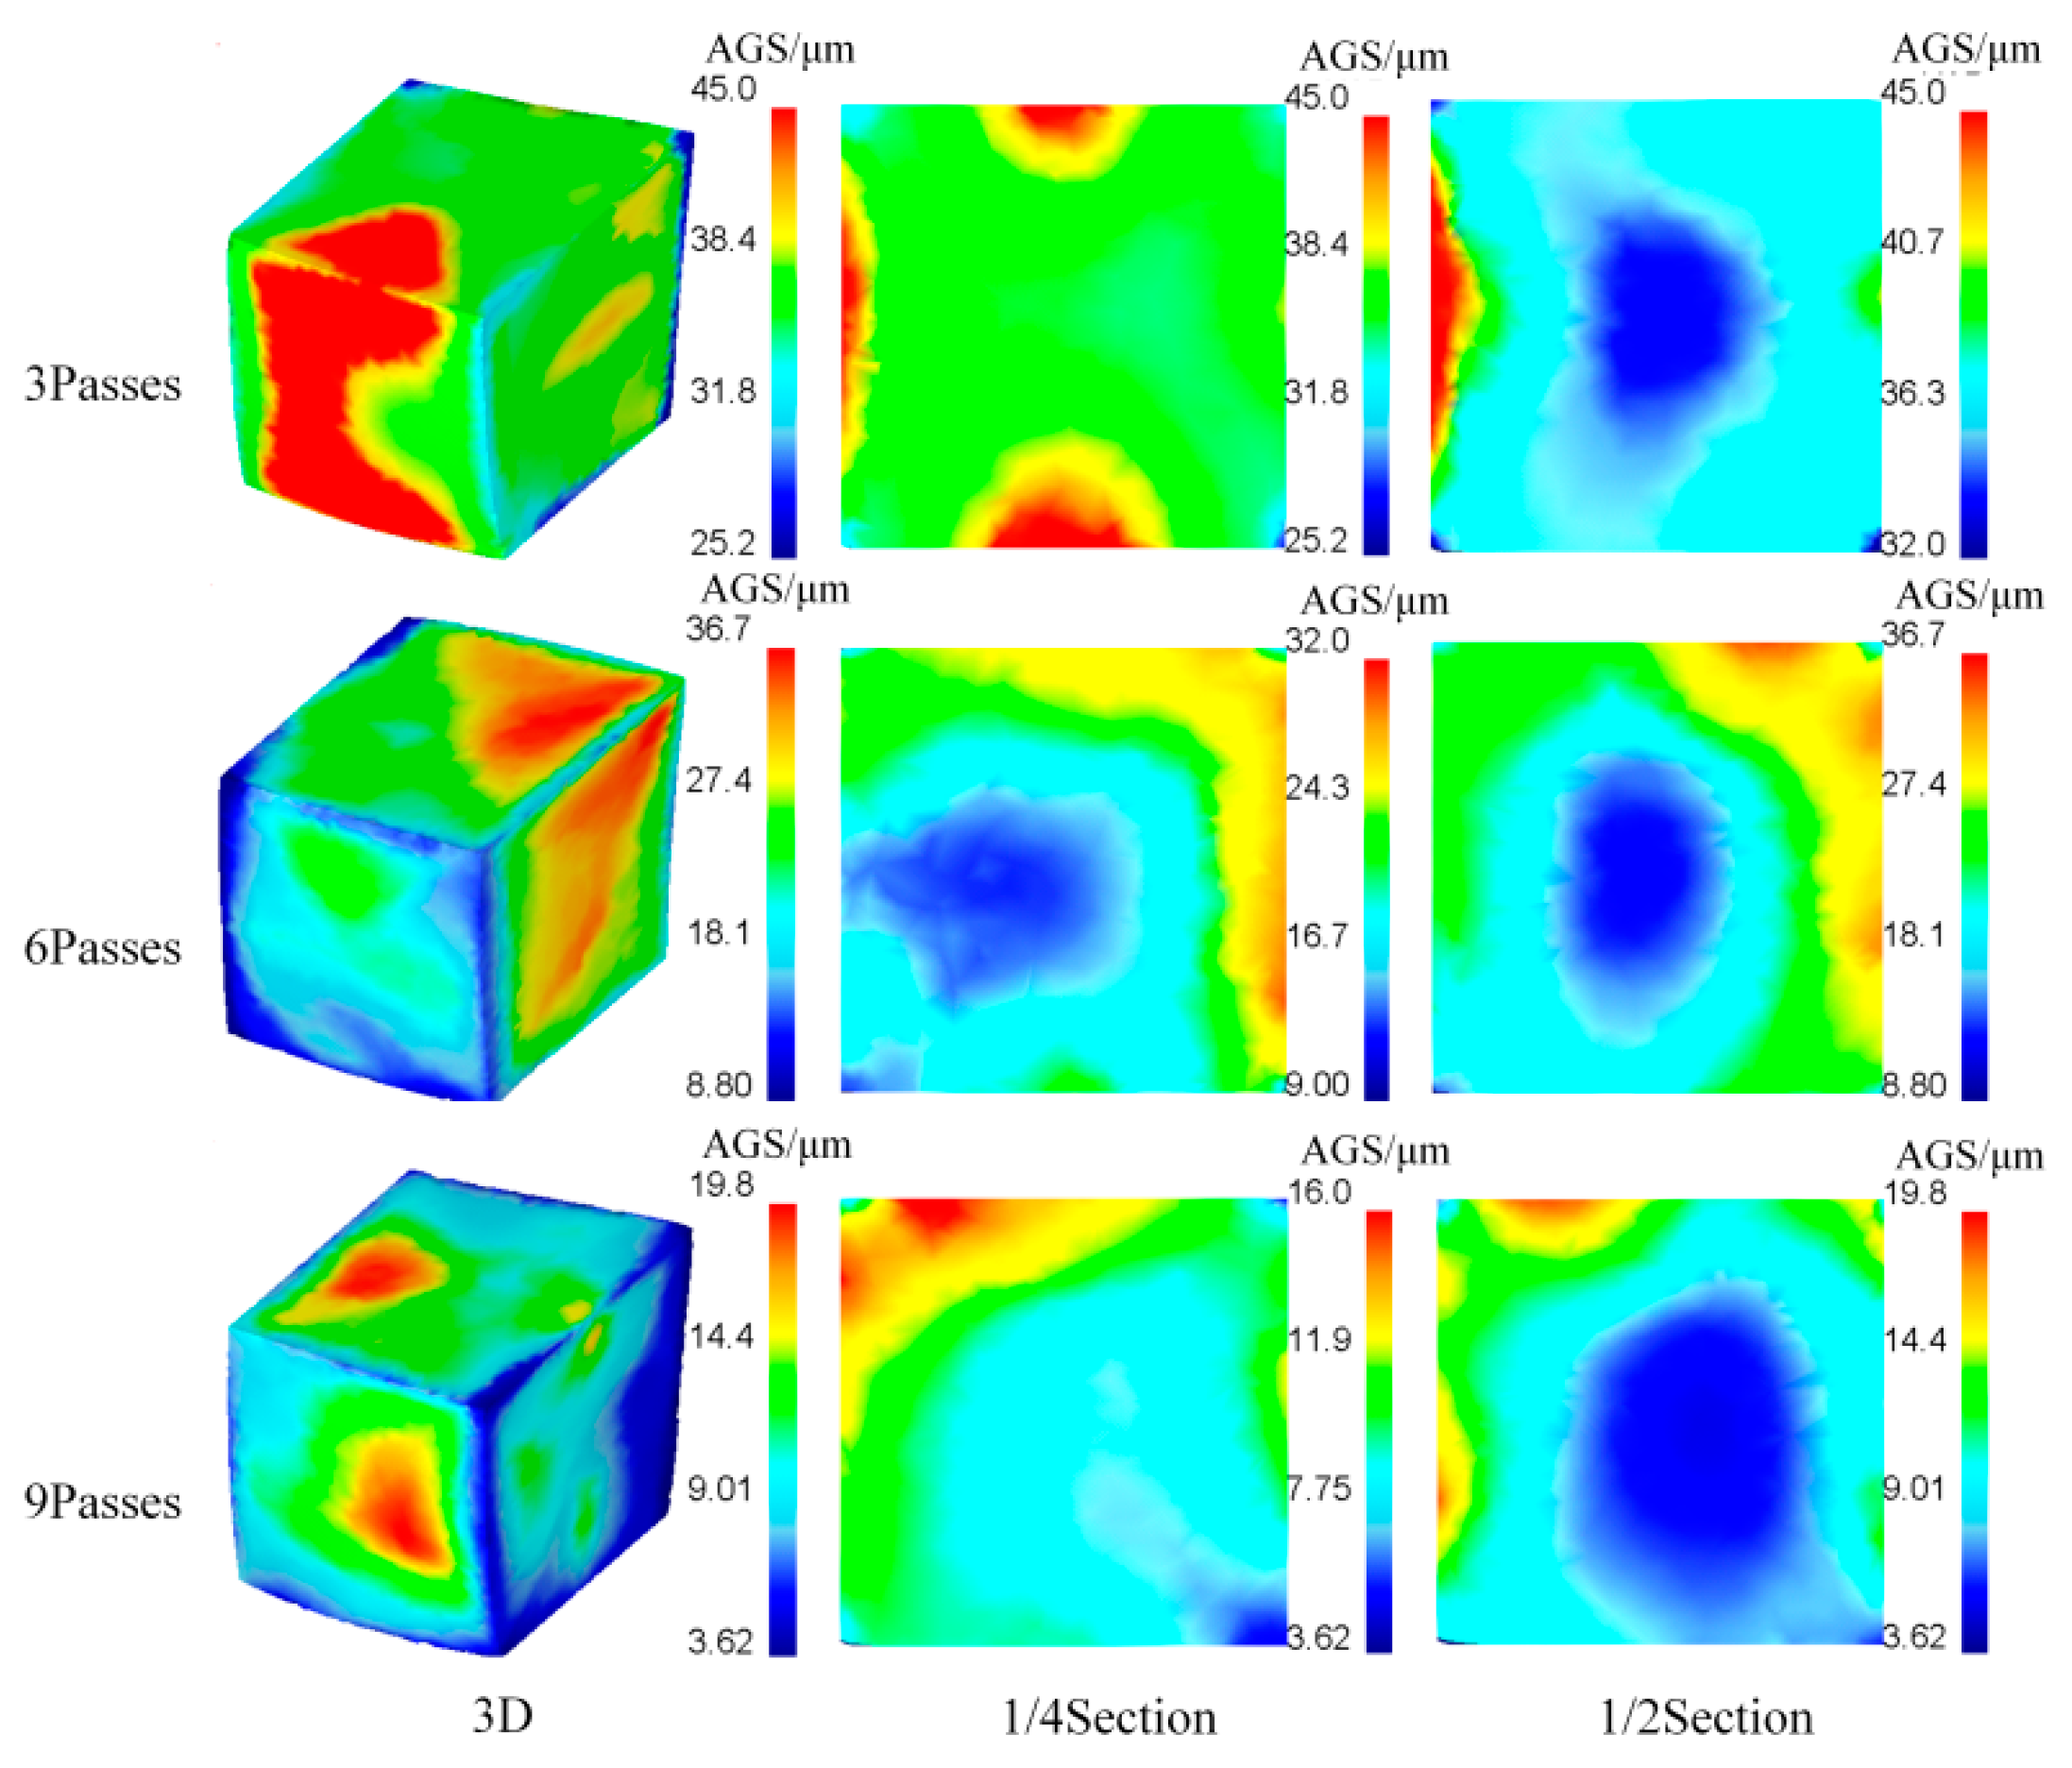
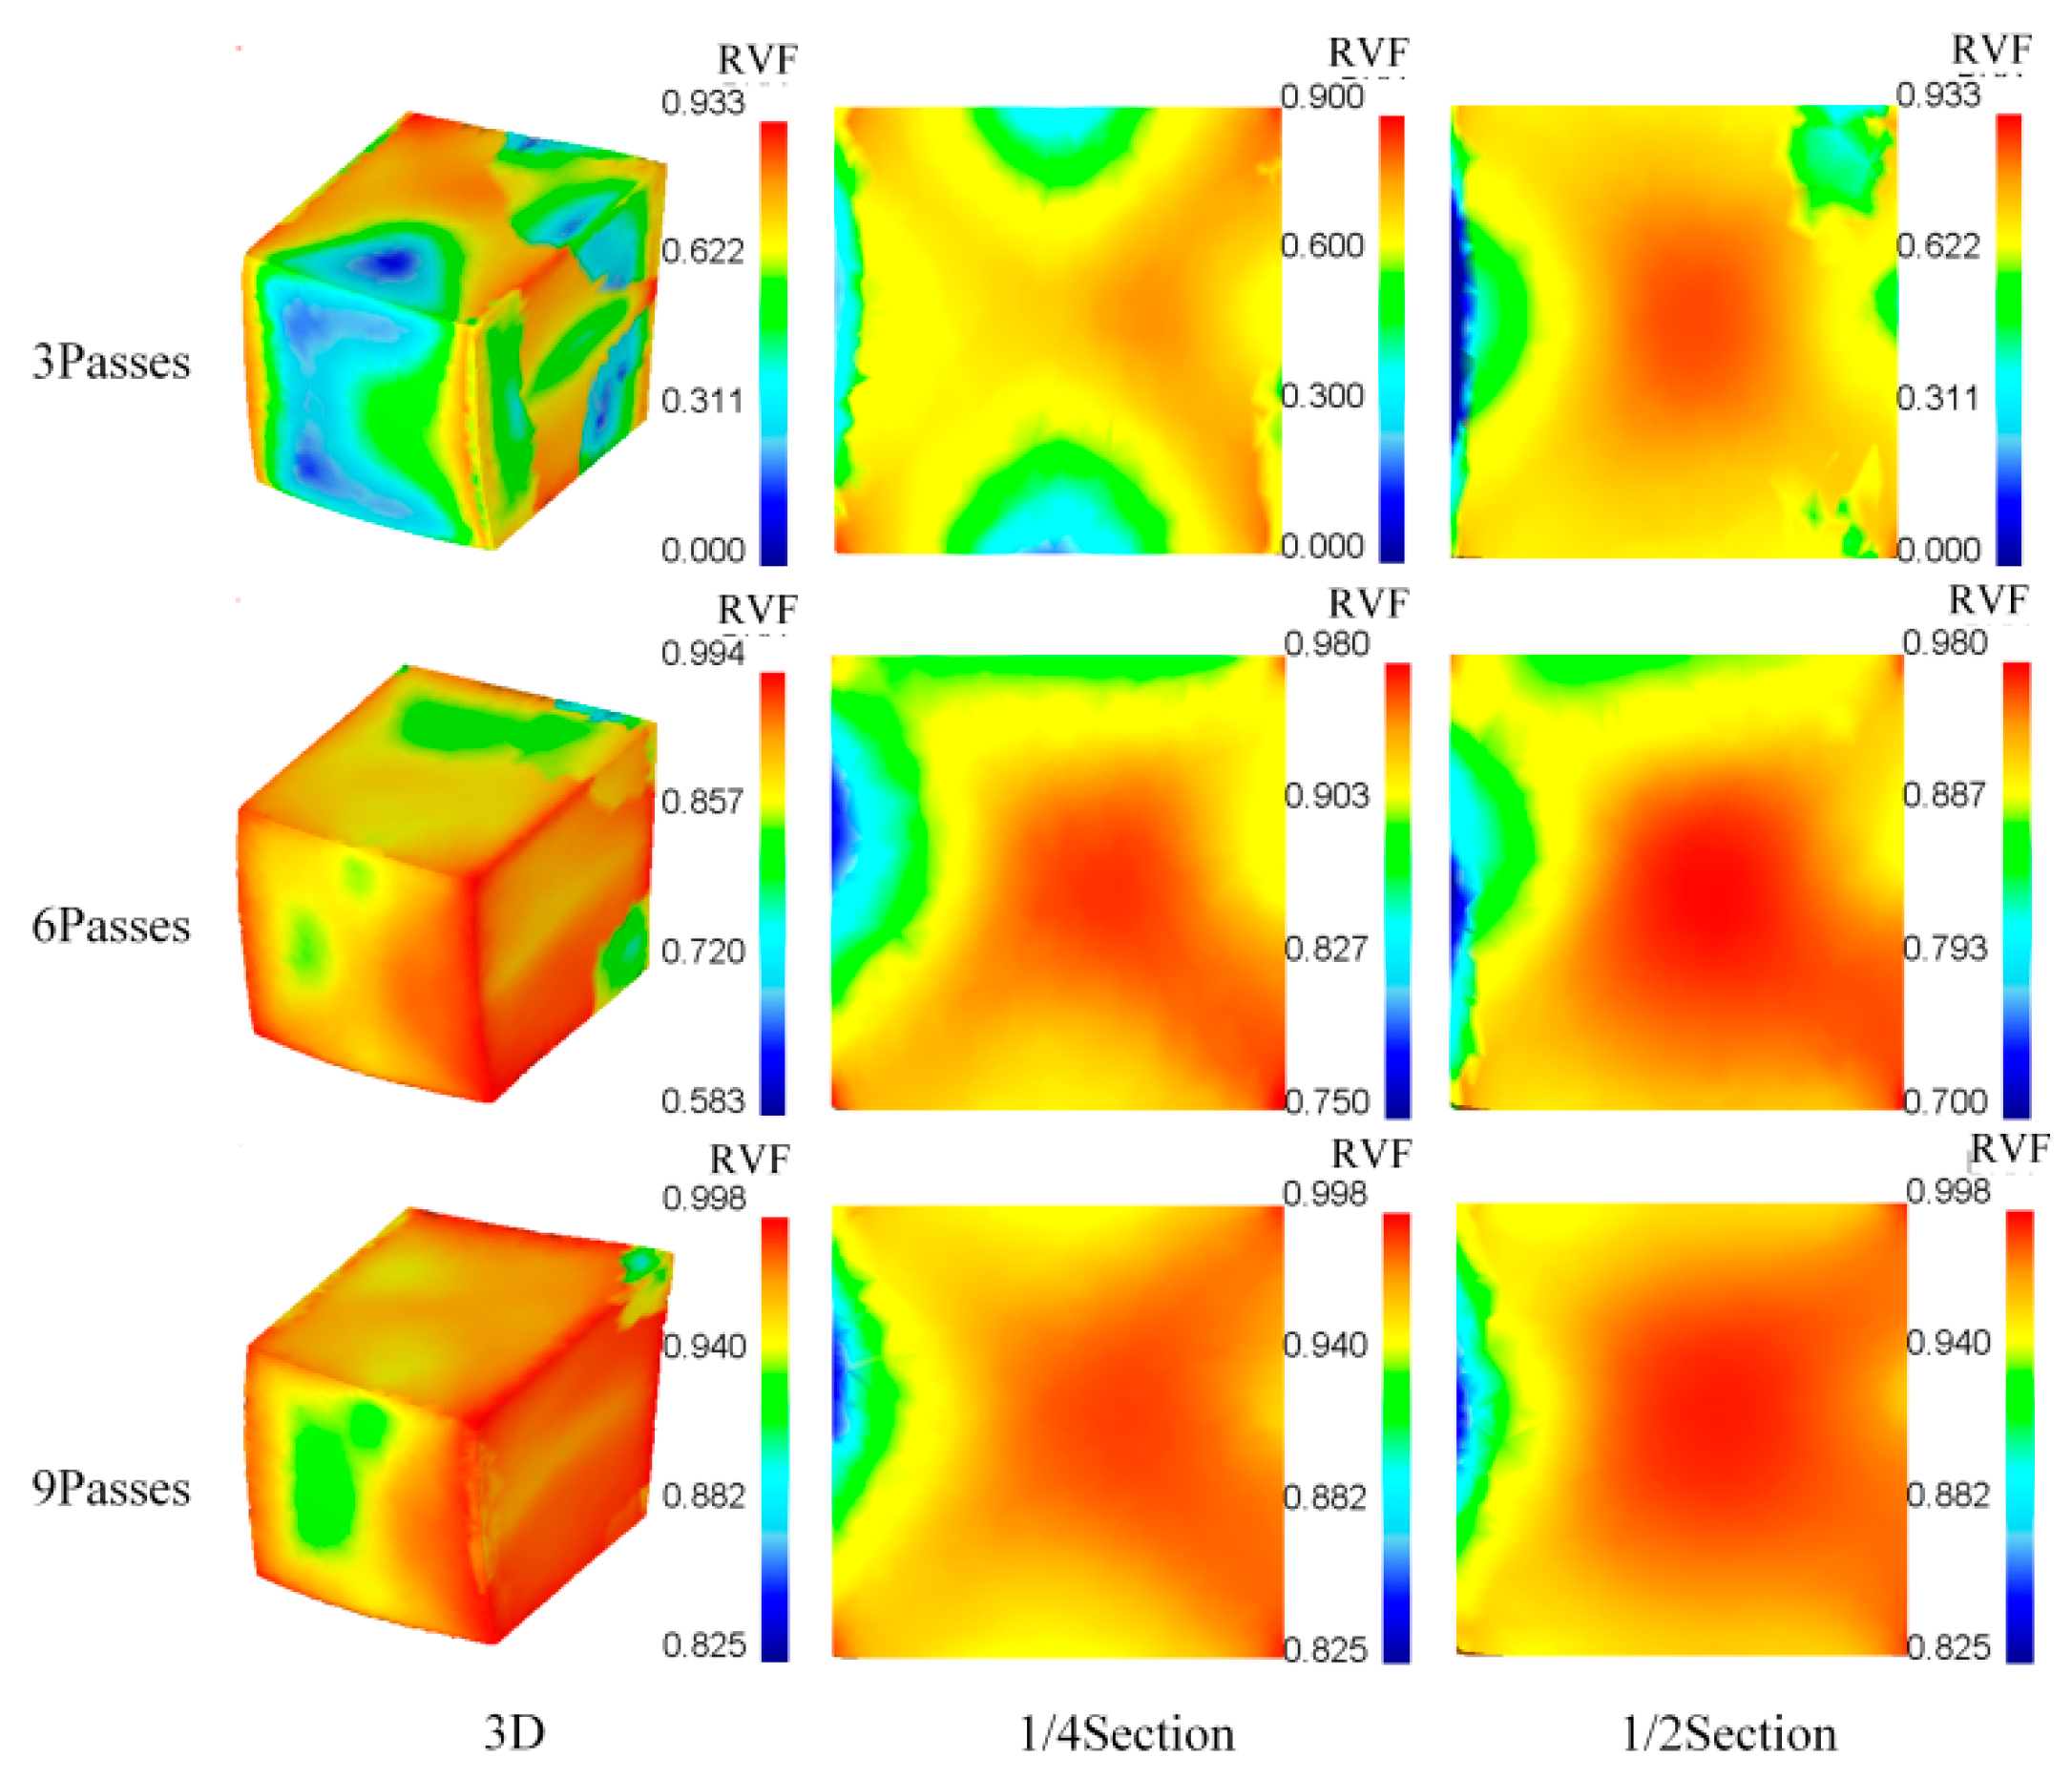
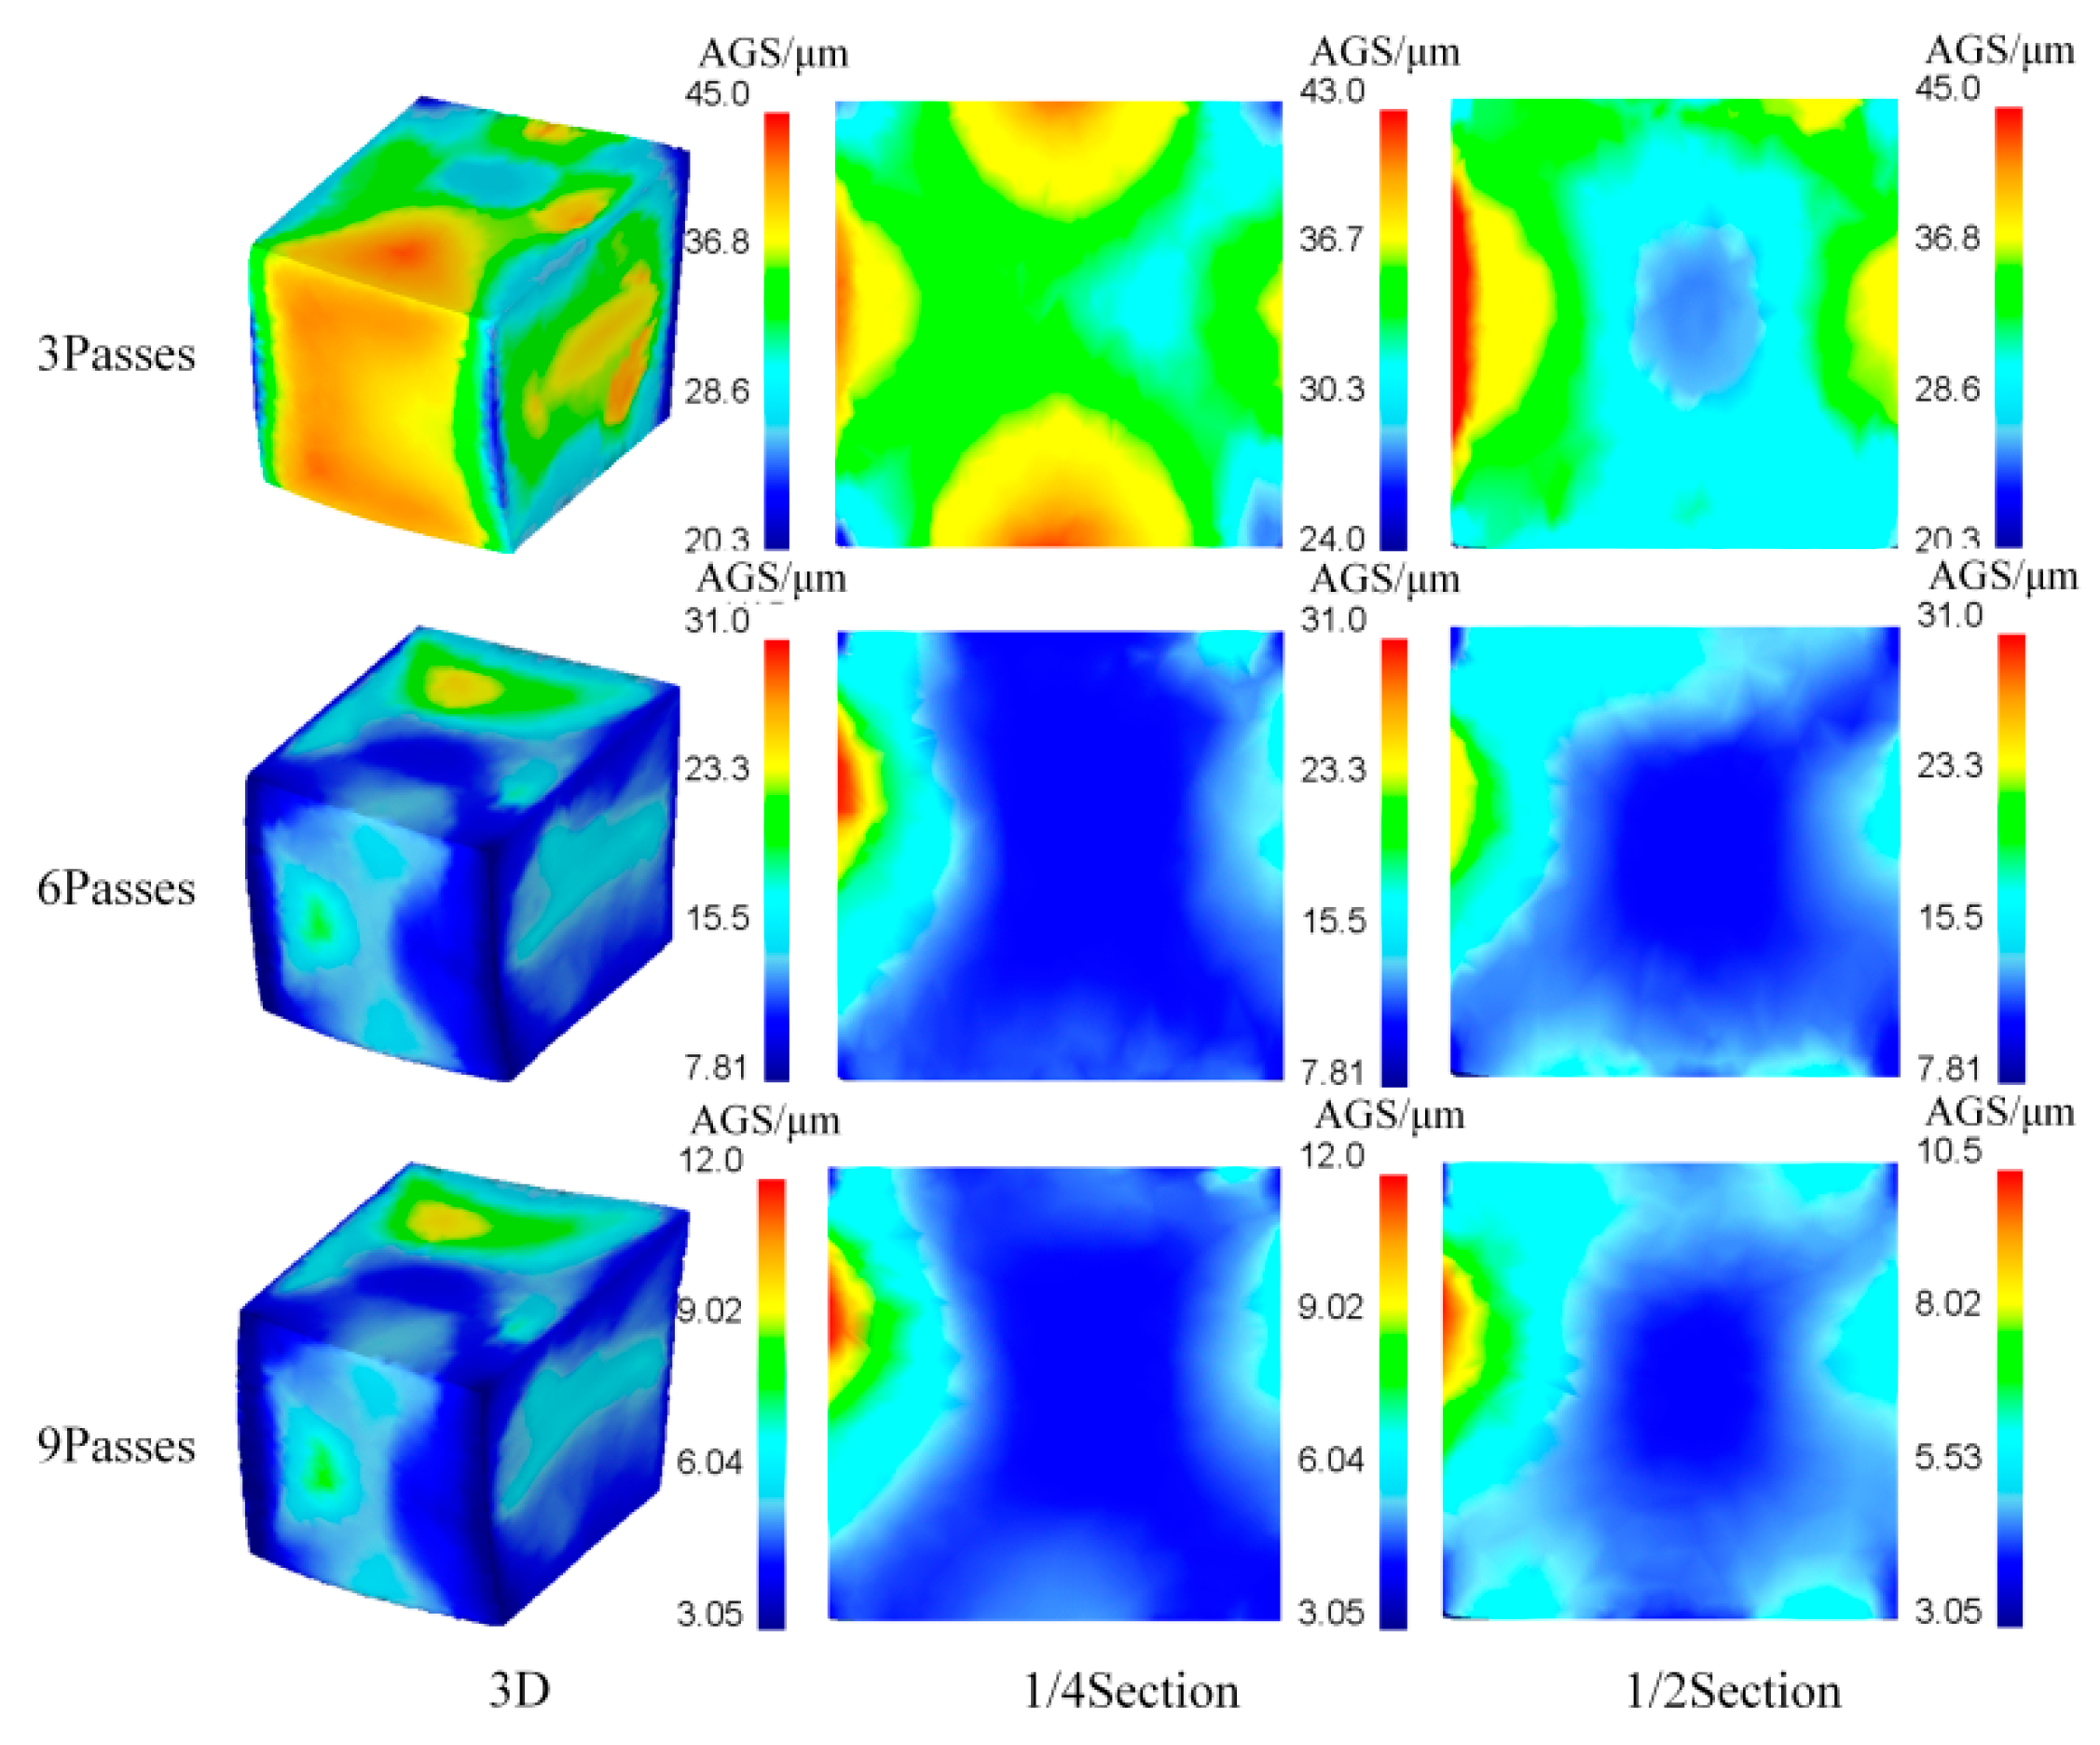
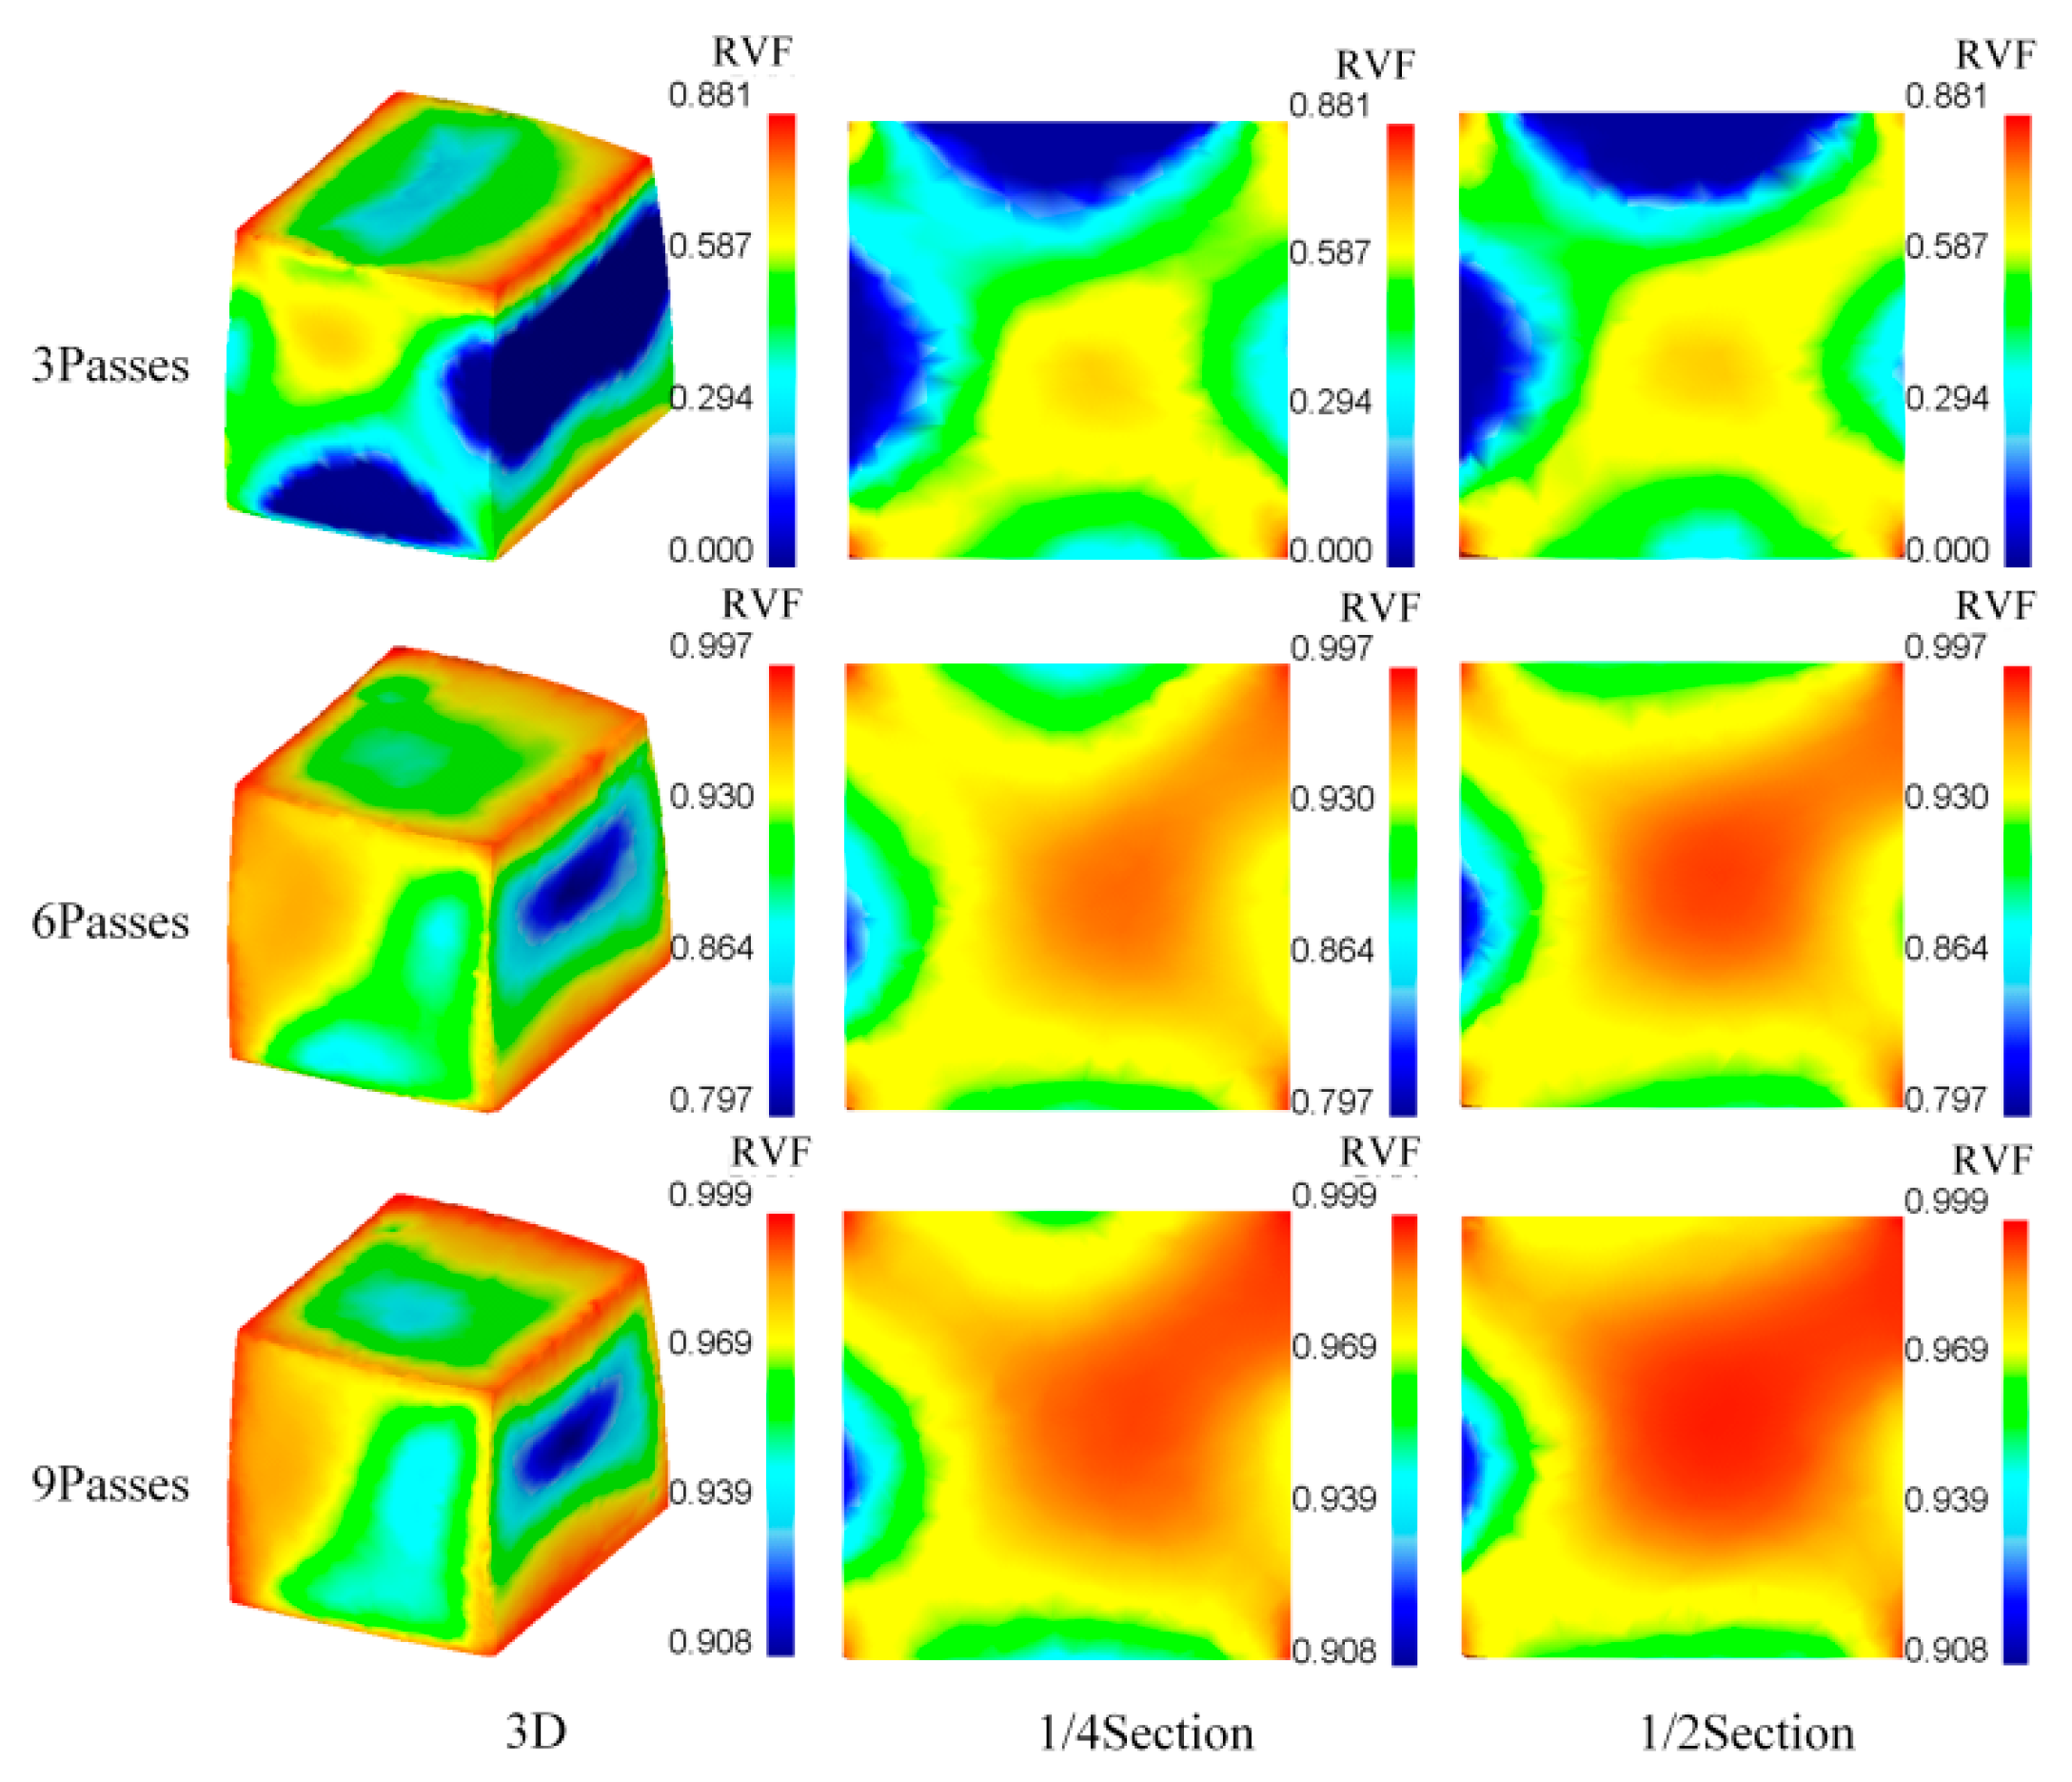
3.4. Double-Open Multidirectional Forging Simulation

3.4.1. Process and Finite Element Model

The finite element model used in the simulation is shown in Figure 11. During forging, the initial billet was compressed in the height direction, stretched in the longitudinal direction, and did not deform in the width direction, owing to the restraining effect of the mold. When the amount of deformation reached a certain level, the closed multidirectional forging occurred due to the restraining action of the lower die, the length of the forging was no longer increased in the longitudinal direction, and the groove of the lower die was gradually filled. Meanwhile, the single-open multidirectional forging side was full, the other side maintained a free surface, and the sides of the double-open multidirectional forging maintained a free surface. The forging was rotated by 90° every time it was swept, and the last forging was repeated. The simulation utilized a relative net partitioning method and a tetrahedral mesh with 20,000 cells. Table 5 shows the parameter settings used for the double-open multidirectional forging simulation.

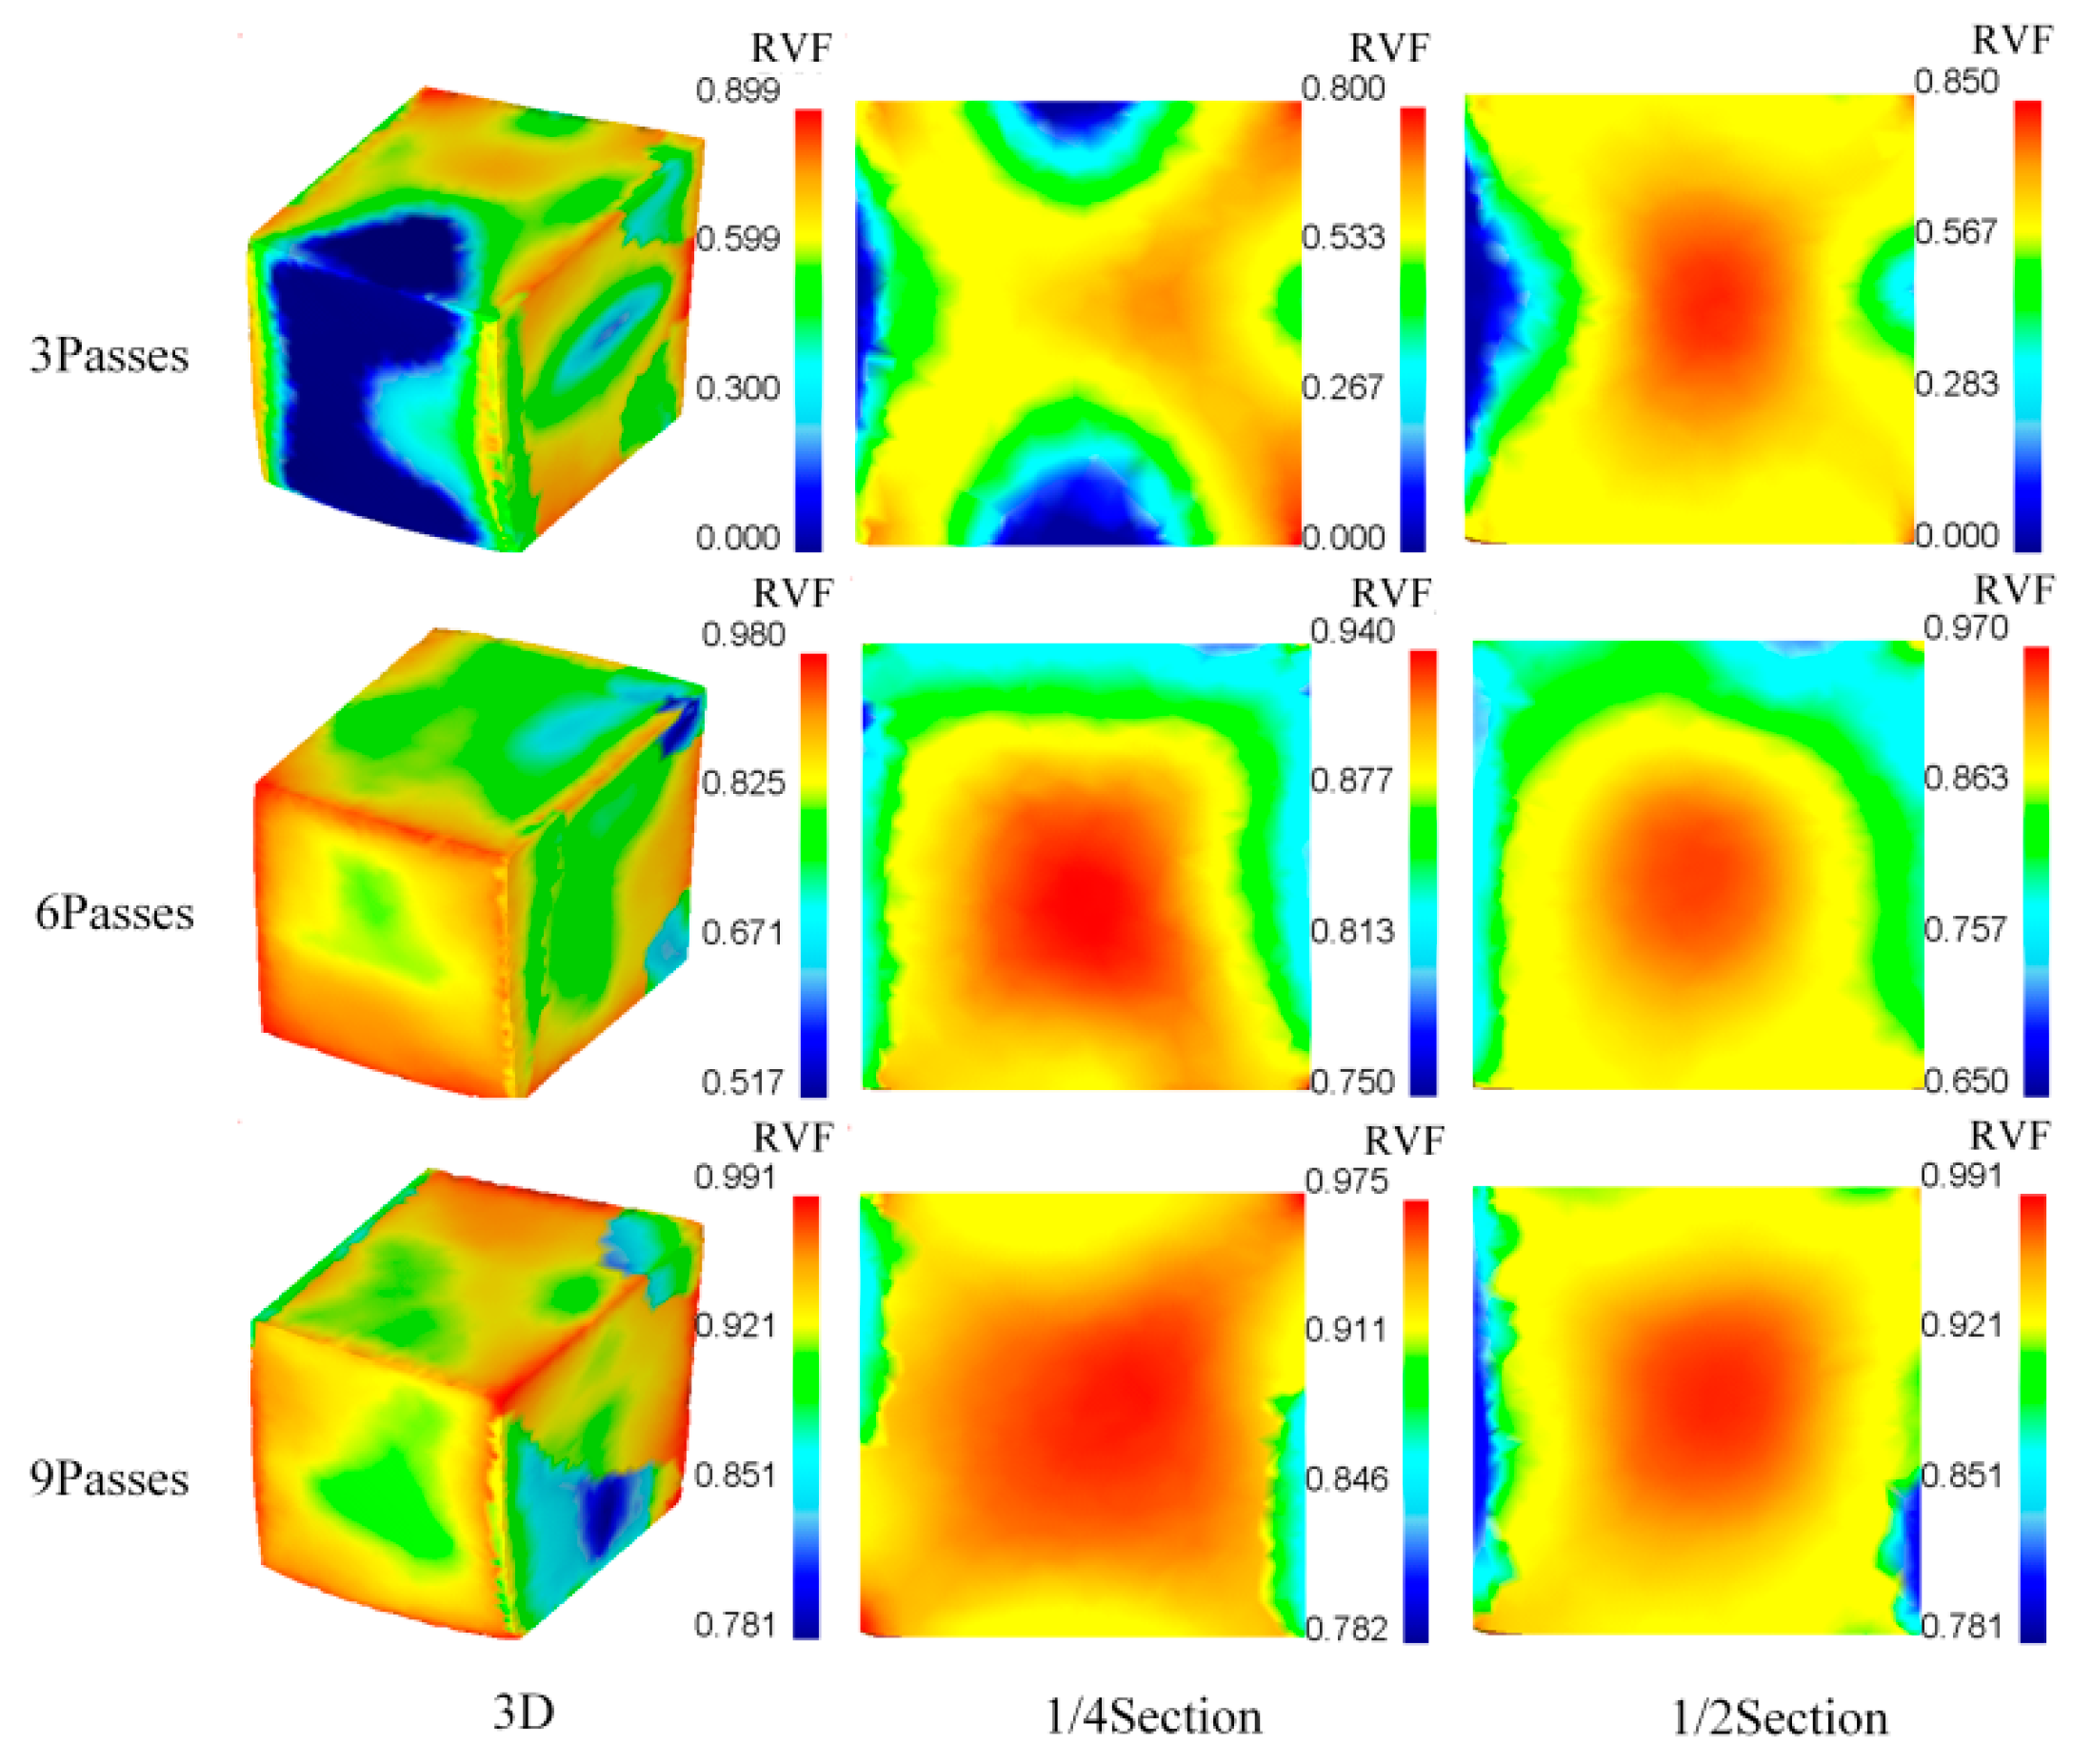
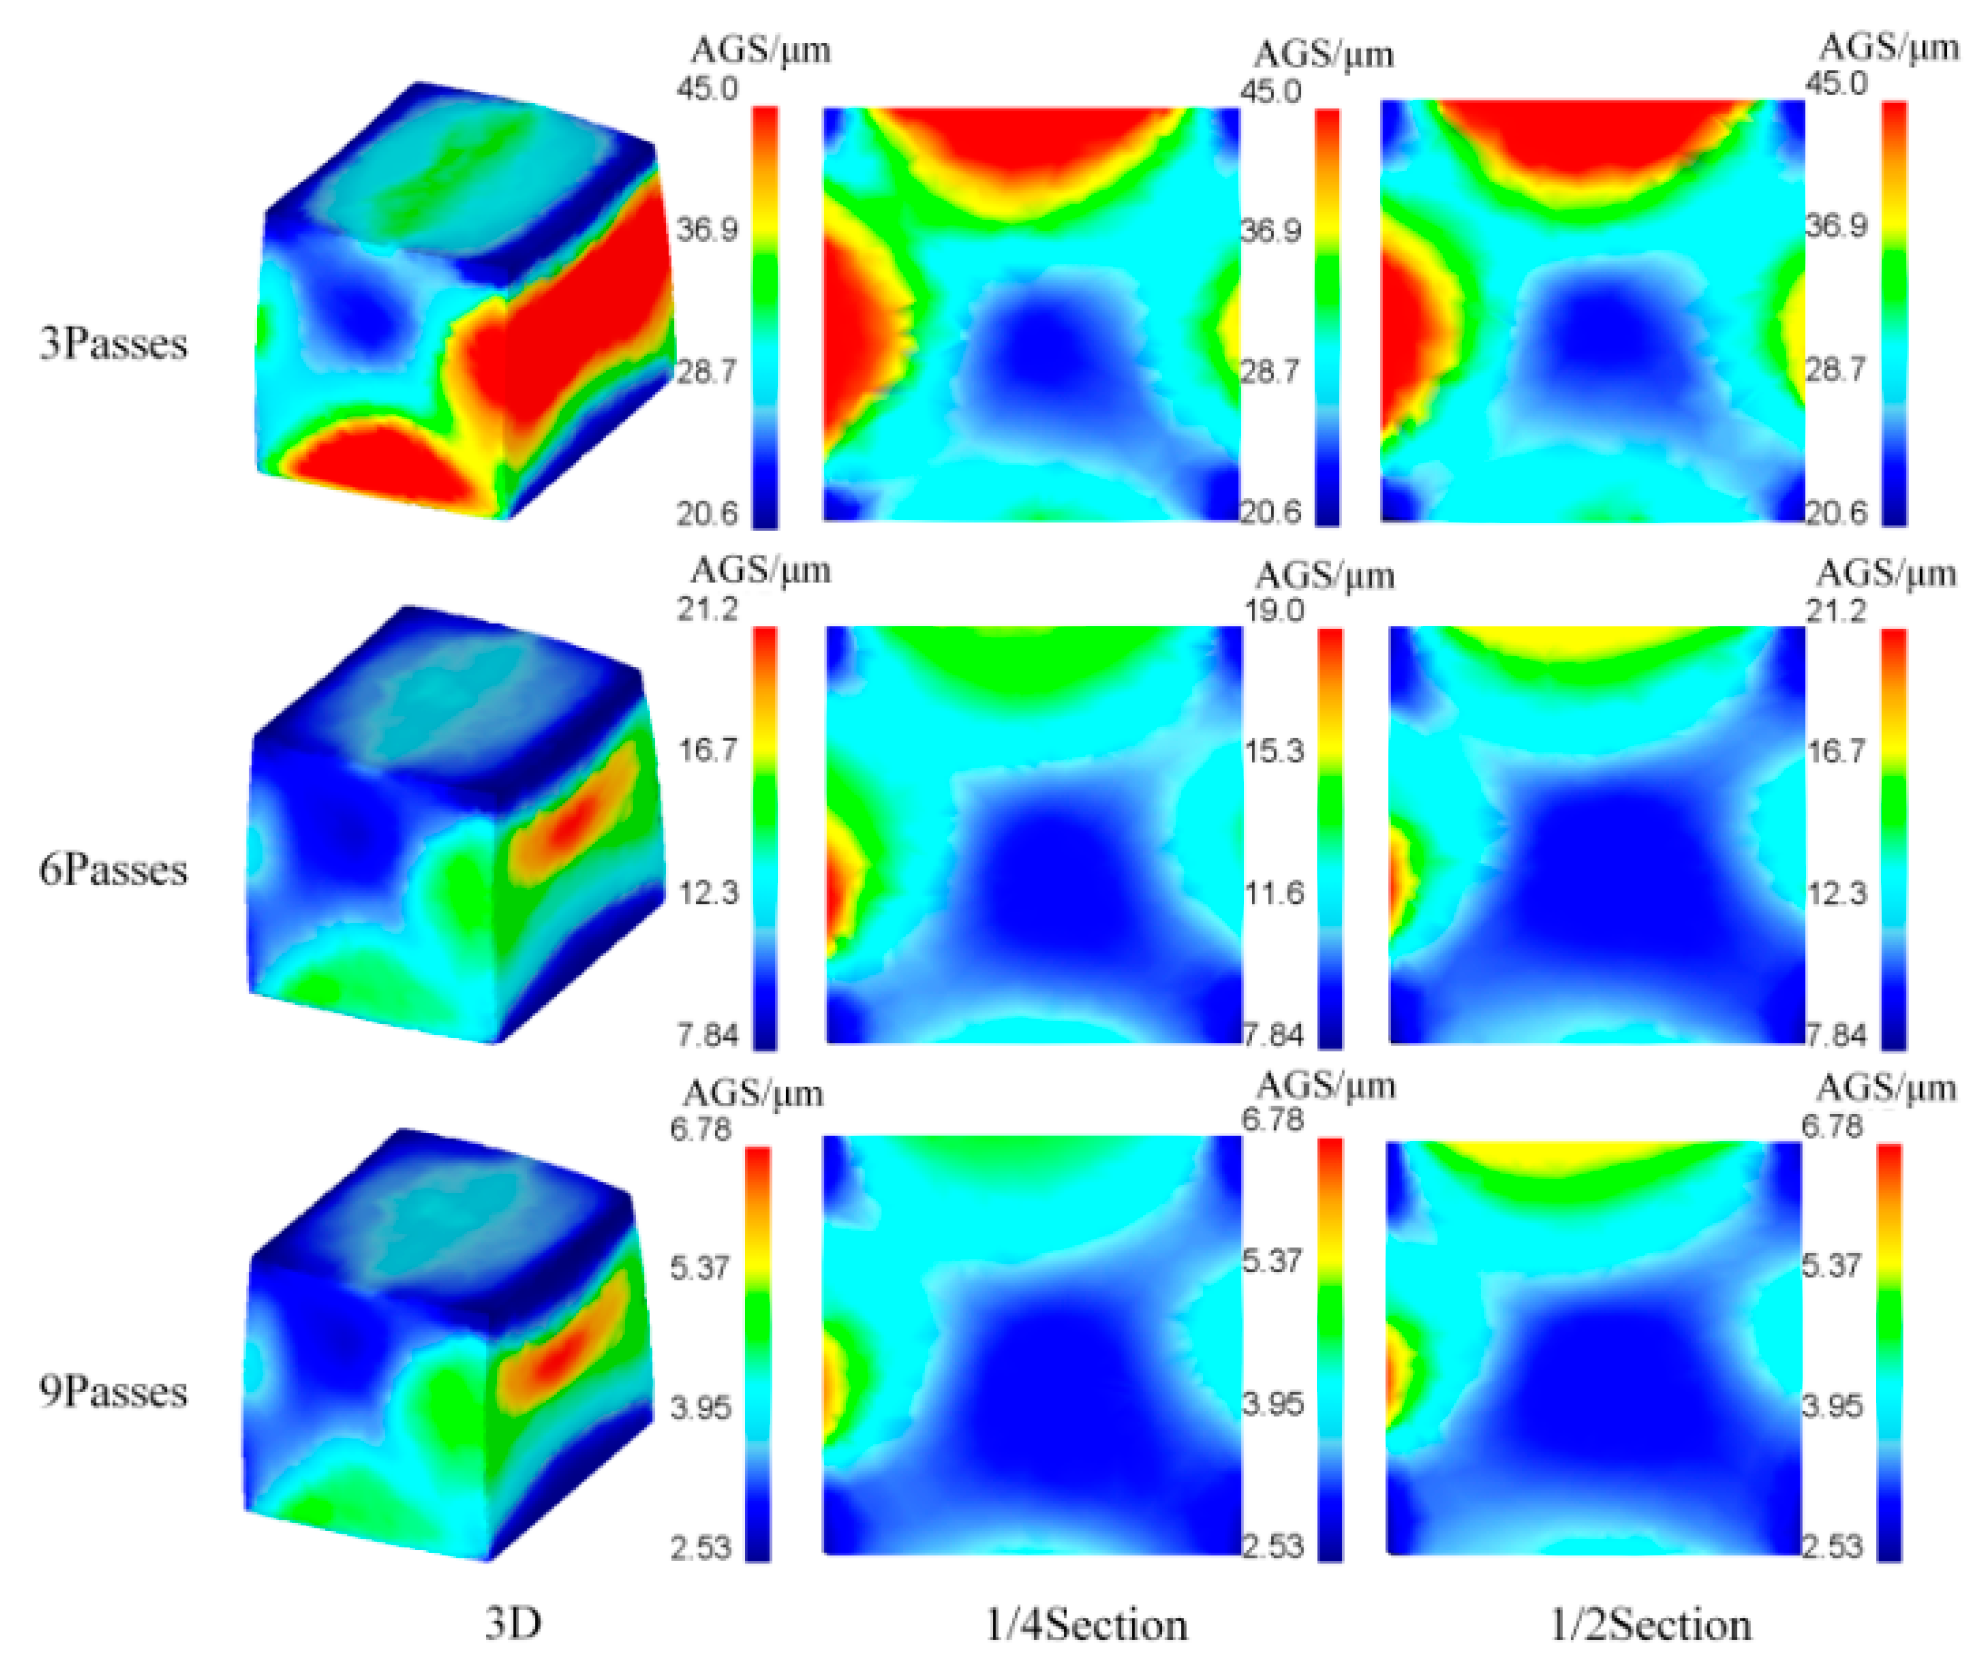
3.4.2. Numerical Simulation Results and Analysis

Figure 12 shows the dynamic recrystallization volume fraction cloud diagram of forgings from three to nine passes at 800 °C. The dynamic recrystallization volume fraction of the forging was symmetrically distributed and could be divided into three deformation zones, namely difficult, easy, and free. The equivalent strain was minimized on the outer surface of the forging due to the restraint of the mold. Therefore, the recrystallization degree in this area was relatively low, the area with the largest recrystallization was approximately 30%, and some areas were not recrystallized. In the interior of the forging, the equivalent strain was large, and the recrystallization degree was relatively high because it was not affected by the mold friction. The recrystallization degree near the inner forging was high, and the center portion reached approximately 82%.
Figure 13 shows the recrystallized grain size graph of forging from three to nine passes at 800 °C. The cloud diagram shows that the recrystallized grain size of the forging was symmetrically distributed. The closer it was to the forging center, the smaller was the grain size. The equivalent strain of the forging was also small on the outer surface of the forging due to the limitation of the die on the forging, thereby affecting the recrystallization. Thus, the average grain size of the forging in this area was large, and no recrystallization occurred. The equivalent strain in the interior of the forging was large because it was not affected by the mold friction. Thus, the average grain size was small, with a minimum value of approximately 33.5 µm.
The recrystallization degree of the forgings was remarkably improved when it reached six passes. The closer it was to the internal, the higher was the recrystallization degree, which resulted in the center portion to approximately reach 95.5%. Therefore, the recrystallization degree was high, and the average grain size was small. The minimum value was approximately 12.2 µm. When forging nine passes, the recrystallization degree of the forgings reached 98.5%, and the minimum average grain size was approximately 5.1 µm.
Figure 14 shows the dynamic recrystallization volume fraction cloud diagram of forging from three to nine passes at 900 °C. From the figure, the dynamic recrystallization volume fraction of the forging was symmetrically distributed and could be divided into three deformation zones: difficult, easy, and free deformation. The equivalent strain was minimized on the outer surface due to the mold constraint. Therefore, the recrystallization degree in this area was relatively low, the area with the largest recrystallization was approximately 50%, and some areas were not recrystallized. In the interior of the forging, because it was not affected by the mold friction, the equivalent strain was large; the recrystallization degree was relatively high, and the closer it was to the internal, the higher was the recrystallization degree, which resulted in the center portion achieving a value of approximately 87%.
Figure 15 shows the recrystallized grain size cloud diagram of forging from three to nine passes at 900 °C. From the figure, the recrystallized grain size of the forging was symmetrically distributed, and the closer it was to the inside of the forging, the smaller was the grain size, and the closer the outer grain size was, the larger was the grain size. The equivalent strain was small on the outer surface of the forging due to the limitation of the die on the forging, which affected its recrystallization. Thus, the average grain size of the forging in this area was large, and no recrystallization occurred. In the interior of the forging, because it was not affected by the mold friction, the equivalent strain was large. Thus, the recrystallization degree in this region was high, the average grain size was small, and the minimum value was approximately 26 µm.
The center portion reached approximately 97.5% under the forging of six passes. Therefore, the recrystallization degree was high in this region, the average grain size was small, and the minimum value was approximately 10 µm. When forging nine passes, the recrystallization degree of the forgings reached approximately 99.7%, and the average grain size minimum was approximately 4 µm.
Figure 16 shows the dynamic recrystallization volume fraction cloud diagram of forgings from three to nine passes at 1000 °C. From the figure, the dynamic recrystallization volume fraction of the forging was symmetrically distributed and could be divided into three deformation zones: difficult, easy, and free deformation zones. The equivalent strain was minimized on the outer surface of the forging due to the constraint of the mold. Thus, the recrystallization degree in this area was relatively low, and the area with the largest recrystallization was approximately 70%. In the interior of the forging, because it was not affected by the mold friction, the equivalent strain was large, and the recrystallization degree was relatively high. The closer it was to the internal, the higher was the recrystallization degree, which resulted in the highest value of approximately 74% at the center; moreover, the degree of internal recrystallization did not change considerably with the outside. No obvious increasing trend was observed.
Figure 17 shows the recrystallized grain size graph of forging from three to nine passes at 1000 °C. From the figure, the recrystallized grain size of the forging was symmetrically distributed; moreover, the closer it was to the inside of the forging, the smaller was the grain size, and the closer it was to the outer grain size, the larger was the grain size. The equivalent strain was small on the outer surface of the forging due to the restraining effect of the die on the forging, which affected the recrystallization of the forging. The average grain size of the forging in this area was relatively large. In the interior of the forging, because it was not affected by the mold friction, the equivalent strain was large. Thus, the recrystallization degree in this area was relatively high, the average grain size was small, the minimum value was approximately 24 µm, and the internal and external grain sizes of the forging did not change significantly. This situation occurred because the deformation temperature of the forging was relatively high, and the strain had no considerable effect on recrystallization.
The center portion approximately reached 99% with the forging of six passes. Therefore, the recrystallization degree was high in this region, the average grain size was small, and the minimum value was approximately 9.1 µm. When forging nine passes, all areas of recrystallization volume fraction exceeded 95%, the grain size was 3–5.5 µm, the recrystallization degree of forgings reached 99.7%, and the average grain size minimum was approximately 3 µm.

4. Conclusions

(1) Based on the thermal compression experiment, the constitutive model of the material and the mathematical model of recrystallization evolution were derived by analyzing the stress-strain curve of GH4169 and applied to the secondary development of software. A simulation of the microstructure evolution law in the double-open multi-directional forging process was conducted.
(2) The evolution rule of the recrystallization volume fraction and the recrystallized grain size of the GH4169 superalloy double-open multidirectional forging was obtained. Increasing the forging temperature increased the recrystallization volume fraction and reduced the recrystallization grain size. Performing more passes had the same effect and led to more complete recrystallization and a smaller recrystallized grain size. At 1000 °C and nine passes, the recrystallization volume fraction exceeded 95%, and the recrystallized grain size reached the minimum size of 3–5.5 µm.

Author Contributions

J.L. and Y.J. conceived and designed the experiments; H.X., S.W., and Z.Y. performed the experiments; L.Z. and C.Z. analyzed the data; J.L. and Y.J. wrote the paper.

Funding

This project is supported by Natural Science Foundation of Hebei Province, China (Grant No. E2019203005).

Conflicts of Interest

The authors declare no conflict of interest.

References

  1. Zhou, L.X.; Baker, T.N. Eeffct of strain rate and temperuatre on deofrmation behvaior of IN718 during high temperuatre deformation. Mater. Sci. Eng. 1994, 177, 1–9. [Google Scholar] [CrossRef]
  2. Du, J.H.; Lu, X.D.; Deng, Q.; Bi, Z.B. Progress in the Research and Manufacture of GH4169 alloy. J. Iron Steel Res. Int. 2015, 22, 657–663. [Google Scholar] [CrossRef]
  3. Li, H.Y.; Kong, Y.H.; Chen, G.S.; Xie, L.X.; Zhu, S.G.; Sheng, X. Effect of different processing technologies and heat treatments on the microstructure and creep behavior of GH4169 superalloy. Mater. Sci. Eng. 2013, 582, 368–373. [Google Scholar] [CrossRef]
  4. Zhou, X.; Zhang, J.; Chen, X.; Zhang, X.; Li, M. Fabrication of high-strength AZ80 alloys via multidirectional forging in air with no need of ageing treatment. J. Alloys Compd. 2019, 787, 551–559. [Google Scholar] [CrossRef] [Green Version]
  5. Na, Y.S.; Yeom, J.T.; Park, N.K.; Lee, J.Y. Simulation of microstructures for Alloy 718 blade forging using 3D FEM simulator. J. Mater. Process. Technol. 2003, 141, 337–342. [Google Scholar] [CrossRef]
  6. Salevati, M.A.; Akbaripanah, F.; Mahmudi, R. Microstructure, Texture, and Mechanical Properties of AM60 Magnesium Alloy Processed by Extrusion and Multidirectional Forging. J. Mater. Eng. Perform. 2019, 28, 3021–3030. [Google Scholar] [CrossRef]
  7. Miura, H.; Maruoka, T.; Yang, X.; Jonas, J.J. Microstructure and mechanical properties of multi-directionally forged Mg–Al–Zn alloy. Scr. Mater. 2012, 66, 49–51. [Google Scholar] [CrossRef]
  8. Kishchik, M.S.; Mikhaylovskaya, A.V.; Kotov, A.D.; Mosleh, A.O.; AbuShanab, W.S.; Portnoy, V.K. Effect of multidirectional forging on the grain structure and mechanical properties of the Al–Mg–Mn alloy. Materials 2018, 11, 2166. [Google Scholar] [CrossRef]
  9. Xia, X.S.; Wang, C.P.; Wu, Y.; Zhang, K.; Ma, M.L.; Yuan, B.G. Grain refinement, microstructure and mechanical properties homogeneity of Mg-Gd-Y-Nd-Zr alloy during multidirectional forging. J. Mater. Eng. Perform. 2018, 27, 5689–5699. [Google Scholar] [CrossRef]
  10. Aoba, T.; Kobayashi, M.; Miura, H. Microstructural evolution and enhanced mechanical properties by multi-directional forging and aging of 6000 series aluminum alloy. Mater. Trans. 2018, 59, 373–379. [Google Scholar] [CrossRef]
  11. Lin, J.; Liu, Y. A set of unified constitutive equations for modellling microstructure evolution in hot deformation. J. Mater. Process. Technol. 2003, 143, 281–285. [Google Scholar] [CrossRef]
  12. Kermanpur, A.; Lee, P.D.; Mclean, M.; Tin, S. Integrated modeling for the manufacture of aerospace discs: Grain structure evolution. JOM 2004, 56, 72–78. [Google Scholar] [CrossRef] [Green Version]
  13. Tin, S.; Lee, P.D.; Kermanpur, A.; Mclean, M.; Rist, M. Integrated modeling for the manufacture of Ni-based superalloy discs from solidification to final heat treatment. Metall. Mater. Trans. A 2005, 36, 2493–2504. [Google Scholar] [CrossRef]
  14. Park, N.K.; Kim, I.S.; Na, Y.S.; Yeom, J.T. Hot forging of a nickel-base superalloy. J. Mater. Process. Technol. 2001, 111, 98–102. [Google Scholar] [CrossRef]
  15. Murty, S.V.S.N.; Rao, B.N. On the development of instability criteria during hotworking with reference to IN 718. Mater. Sci. Eng. 1998, 254, 76–82. [Google Scholar] [CrossRef]
  16. Cao, F.R.; Zhang, J.; Ding, X.; Xue, G.Q.; Liu, S.Y.; Sun, C.F. Mechanical properties and microstructural evolution in a superlight Mg-6.4Li-3.6Zn-0.37Al-0.36Y alloy processed by multidirectional forging and rolling. Mater. Sci. Eng. 2019, 760, 377–393. [Google Scholar] [CrossRef]
  17. Marty, B.; Guedou, J.; Gergaud, P.; Lebrun, J.L. Recrystallization and work-hardening prediction during forging process of inconel 718. Superalloys 1997, 718, 625–706. [Google Scholar]
  18. Zhang, Z.X.; Qu, S.J.; Feng, A.H.; Hu, X.; Shen, J. Microstructural mechanisms during multidirectional isothermal forging of as-cast Ti-6Al-4V alloy with an initial lamellar microstructure. J. Alloys Compd. 2019, 773, 277–287. [Google Scholar] [CrossRef]
  19. Zhang, J.M.; Gao, Z.Y.; Zhuang, J.Y.; Zhong, Z.Y. Mathematical modeling of the hot deformation behavior of superally IN718. Metall. Mater. Trans. A 1999, 30, 2701–2713. [Google Scholar] [CrossRef]
  20. Thomas, A.; El-Wahabi, M.; Cabrera, J.M.; Prado, J.M. High temperature deformation of Inconel 718. J. Mater. Process. Technol. 2006, 177, 469–472. [Google Scholar] [CrossRef]
  21. Hu, J.P.; Zhuang, J.Y.; Du, J.H.; Deng, Q.; Feng, D. Constitutive equation of superalloy In718 in hammer forging process. J. Iron Steel Res. Int. 2001, 8, 50–54. [Google Scholar]
  22. Dandre, C.A.; Roberts, S.M.; Evans, R.W.; Reed, R.C. Microstructural evolution of Inconel* 718 during ingot breakdown: Process modelling and validation. Mater. Sci. Technol. 2000, 16, 14–25. [Google Scholar] [CrossRef]
Figure 1. The original microstructure of the GH4169 forge piece.
Metals 09 01146 g001
Figure 2. Flowchart of the GH4169 superalloy hot compression experiment.
Metals 09 01146 g002
Figure 3. Thermal compression strain curve of GH4169 alloy under different strain rates and temperatures. (a) ε ˙ = 0.001 s 1 ; (b) ε ˙ = 0.01 s 1 ; (c) ε ˙ = 0.1 s 1 ; (d) ε ˙ = 1 s 1 .
Metals 09 01146 g003
Figure 4. Relation among l n σ p , σ p , and l n ε ˙ curves at different temperatures. (a) l n σ p and l n ε ˙ curves at different temperatures; (b) σ p and l n ε ˙ curves at different temperatures.
Metals 09 01146 g004
Figure 5. The relation between ln[sinh(ασp)] and l n ε ˙ at various deformation temperatures.
Metals 09 01146 g005
Figure 6. The relation between ln[sinh(ασp)] and 1000 K/T at various strain rates.
Metals 09 01146 g006
Figure 7. Relation between lnZ and ln[sinh(ασp)] at various strain rates and deformation temperatures.
Metals 09 01146 g007
Figure 8. The relation between lnZ and lnεp at various deformation temperatures.
Metals 09 01146 g008
Figure 9. Relation between ln{ln[1/(1 − X)]} and ln[(εεc)/ε0.5] at various deformation temperatures.
Metals 09 01146 g009
Figure 10. D2-drex and Z fitted image.
Metals 09 01146 g010
Figure 11. Finite element model.
Metals 09 01146 g011
Figure 12. Dynamic recrystallization volume fraction cloud diagram for three to nine passes forging at 800 °C.
Metals 09 01146 g012
Figure 13. Forging of three to nine passes for recrystallized grain size cloud map at 800 °C.
Metals 09 01146 g013
Figure 14. Forging from three to nine passes for dynamic recrystallization volume fraction cloud image at 900 °C.
Metals 09 01146 g014
Figure 15. Forging from three to nine passes for recrystallized grain size cloud image at 900 °C.
Metals 09 01146 g015
Figure 16. Dynamic recrystallization volume fraction cloud image of forging from three to nine passes at 1000 °C.
Metals 09 01146 g016
Figure 17. Recrystallization grain size cloud image of forging from three to nine passes at 1000 °C.
Metals 09 01146 g017
Table 1. Deformation parameters for the GH4169 superalloy hot compression experiment.
Temperature/°C900950100010501120
Strain rate/s−10.001, 0.01, 0.1, 1
Heating rate/°C·s−15
Compression ratio0.6
Table 2. Strain rate ( ε ˙ ), peak stress (σp), and corresponding logarithmic value of the GH4169 superalloy at various temperatures.
Temperature T/°C Strain   Rate   ( ε ˙ )/s−1Peak Stress (σp)/Mpa ln ε ˙ lnσpln[sinh(ασp)]
9000.001253.1−6.9085.5337850.5608306
0.01364.32−4.6055.8980331.1947405
0.1523.39−2.3036.2603272.0467375
1556.8506.3222962.2233897
9500.001212.46−6.9085.3587540.3067085
0.01354.28−4.6055.8700881.139611
0.1450.13−2.3036.1095361.6578382
1528.4706.2699862.0735863
10000.001171.81−6.9085.1463890.0272396
0.01347.85−4.6055.8517711.1041569
0.1367.16−2.3035.9057981.2102875
1500.306.2152081.9245429
10500.00182.3−6.9084.410371−0.809689
0.01139.68−4.6054.939354−0.22371
0.1218.02−2.3035.3845870.3426757
1303.5205.7154480.8557846
11000.00174.45−6.9084.310128−0.915507
0.01129.43−4.6054.86314−0.31216
0.1178.39−2.3035.1839720.0748297
1233.8905.4548510.443079
11200.00166.847−6.9084.202406−1.028105
0.01105.18−4.6054.655673−0.54505
0.1158.97−2.3035.068716−0.06898
1215.3105.3720790.3252004
Table 3. Strain rate ε ˙ , peak strain εp, dynamic recrystallization volume fraction X, and lnZ at different temperatures.
Temperature/°C Srain   Rate   ε ˙ /s−1Peak Strain εp/MPalnZX
9500.0010.22142.266020.724
0.010.15640.330040.658
0.10.10538.540730.543
10.11336.882030.287
10000.0010.136.251960.927
0.010.22844.56860.843
0.10.242.632630.706
10.16840.843310.504
10500.0010.15439.184610.895
0.010.14438.554540.919
0.10.23246.871190.817
10.22144.935210.665
11000.0010.20643.14590.905
0.010.18841.48720.928
0.10.1840.857130.886
10.23749.173770.780
11200.0010.23347.23780.887
0.010.22545.448480.928
0.10.21243.789780.904
10.20643.159710.815
Table 4. Strain rate ε ˙ , dynamic recrystallization grain size, and Z of the GH4169 superalloy at various temperatures.
Temperature/°CStrain Rate/s−1ZD2-drex/μm
9500.0011.42 × 101810.556
0.011.42 × 10193.578
0.11.42 × 10201.818
11.42 × 10211.111
10000.0012.09 × 101722.78
0.012.09 × 101810.603
0.12.09 × 10194.167
12.09 × 10203.442
10500.0013.57 × 101637.78
0.013.57 × 101715.2
0.13.57 × 10188.425
13.57 × 10194.487
11000.0016.93 × 101551.67
0.016.93 × 101625.92
0.16.93 × 101714.444
16.93 × 101812
11200.0013.72 × 101555.56
0.013.72 × 101627.78
0.13.72 × 101720
13.72 × 101816.667
Table 5. Parameter list.
Process ParametersSymbolUnitValue
Forging size-mm40 × 40 × 50
Mold material--H13
Forging temperatureT800–1000
Coefficient of frictionf-0.3
Thermal conductivityλW/(m·K)20–40
Specific heat CN/(mm2·K)3–5
Initial grain sizedμm45
Upper die size-mm50 × 40 × 10
Lower die size-mm70 × 60 × 60
Reduction rate-%20

