Abstract
The Finite-element method (FEM) and experiments were used to investigate the geometric factors and material parameter on the strain distribution during tube high-pressure shearing (t-HPS). The results show that t-HPS could be realized successfully either by pressurizing on both ends of the tube, or by pressurizing using the wedge effect; and in both cases, the “dead metal zone” could be found at both ends of the tube. The grain size distribution from the experiment confirmed this strain distribution feature. In the case of t-HPS pressurized using the wedge effect, the half cone angle has little effect on the strain distribution. Decreasing the strain-hardening exponent leads to increased deformation inhomogeneity in both the ideal t-HPS described by theoretical equations and the close to practical t-HPS described by FEM. This feature of t-HPS stands out from other SPD processes like HPT, and makes practical t-HPS behavior more predictable using the analytical formation than any other SPD processes, and places it an advantageous position in understanding the basics of deformation physics through the coupling between practical experiments and theoretical approaches.
1. Introduction
High Pressure Torsion (HPT) [1] is recognized as an effective way to produce ultra-fine grained (UFG) materials [2]. In recent years, tube high-pressure shearing (t-HPS) [3] and similar processes [4] were introduced as new methods for severe plastic deformation (SPD). These processes are same as HPT in the sense that a simple shearing process is driven by the stick friction between the dies and sample under high hydrostatic pressure. They are different to HPT in that the normal location of the shearing plane is parallel to radius of the tubular sample during t-HPS [3,5], whereas the normal location of the shearing plane is parallel to the axial of the disk sample for HPT.
The principle [3] of t-HPS (pressurized on both ends of the tube, as shown in Figure 1c) is that the tubular sample is confined between the mandrel and the cylinder, and a sufficiently high hydrostatic pressure is introduced in the tube wall so that the frictional forces at the interfaces between the sample-mandrel or cylinder are high enough to prevent any localized slip. By fixing the mandrel and rotating the cylinder, or vice versa, a simple shear is then produced in the sample. An alternation was later introduced [6] in which t-HPS is realized through pressurizing with the principle of the wedge effect, as shown in Figure 1a). The mandrel is subjected to an axial load, which is transformed into the normal force on the contact surfaces between the sample-mandrel or cylinder and magnified by the principle of the wedge effect, so that a high hydrostatic pressure is introduced in the sample.
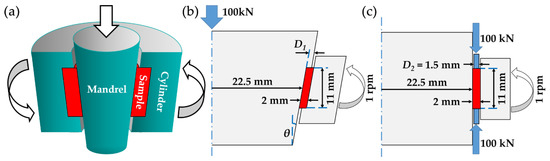
Figure 1.
The principles and the geometry of tube high-pressure shearing (t-HPS): (a) schematic illustration of t-HPS pressurizing by the wedge effect (adapted from [6], with permission from the patent holder, Nanjing University of Science and Technology); (b) the geometry of the t-HPS pressurizing by the wedge effect, with half cone angle θ and the depth of the concave on the cylinder D1; (c) the geometry of the t-HPS pressurizing on both ends of the tube, with the wall thickness of the pressurizing ring D2. The parameters with a numerical value given in the figures remain constant in the investigation of the present work, and the other symbolized parameters are variables.
For the example of the power-law constitutional relationship of the form σ of the processing materials, an analytical solution of equivalent strain distribution in the tube wall was given as follows [3]:
where is a dimensionless parameter, n is the strain-hardening exponent of the deforming material, β is the ratio of the inner radius over the outer radius of the tube, α is the rotation angle during t-HPS, Ri is the inner radius of the tube, and r is the radius variable in the tube wall.
For HPT, the equivalent strain was given by the following Equation [7]:
where r is the radius variable of the disk sample, N is the number of rotations in HPT, and t is the thickness of the sample. It is worth mentioning that compared to Equation (2), Equation (1) contains not only geometric parameters of the process, which is similar to the case of HPT in Equation (2), but also material parameter n, which is absent in the strain equation Equation (2) for HPT. Therefore, the material model is one of the most important factors for t-HPS, which influences the strain distribution. Equation (2) shows that there is a linear strain gradient along the radial direction for HPT, while along the axial direction, the strain distribution is homogeneous. However, several researchers [8,9,10,11,12] reported that along the axis direction inhomogeneity of strain, hardness and microstructure also appeared, and the “dead metal zone” (DMZ) [13] at the corner of the sample was found for HPT. The strain inhomogeneity during the HPT is closely related to the die and sample geometries [9,14]. This axial strain inhomogeneity and the “dead metal zone” is disadvantageous to the HPT processing. Equation (1) and several studies [3,5,15] also indicated that there is a strain gradient along the radial direction after t-HPS, and Equation (1) also show a homogeneous strain distribution in the axial direction as for HPT. Whether the die geometries will also affect the strain distribution of t-HPS, as is observed with HPT, is critical to the development of t-HPS. In order to understand the strain distribution features during t-HPS that are used to optimize this deformation process, it is necessary to quantitatively analyze the influence of the aforementioned geometric and material factors on the strain distribution.
In the present study, the distribution of strain in t-HPS, under the influence of the die design geometries (the pressurizing method, the half cone angle and the concave depth of t-HPS pressurized using the wedge effect, etc.) and the material parameter (strain-hardening exponent of the material), are investigated through FEM simulation, with the confirmation of experimental observation.
2. Materials and Methods
The isothermal FEM simulations were employed in this work using commercial software DEFORM-2D. And t-HPS is clearly a rotationally symmetric problem, so the calculations were simplified using a 2D axisymmetric model. Figure 1b,c shows the illustrations of the geometries for the two alternations of t-HPS: pressurized by wedge effect, or pressurized on both ends of the tube, respectively. As shown in Figure 1, the inner radius of the middle cross-section, the wall thickness, and the height of the tube sample in both cases are fixed in the present investigation as 22.5 mm, 2 mm, and 11 mm, respectively. A pressure of 100 kN (used in both the simulation and the experiment) was applied to the mandrel or the pressure ring. The cylinder was set to rotate at 0.2 rpm, and this parameter remained constant in the simulation. The material model used in this work was a fitting equation of the power law hardening model based on the quasi-static tensile test of 5-Nine (5N) Aluminum (99.999%), as is plotted in Figure 2. Considering the high strain level that could be reached in the process of t-HPS, no existing materials model or constitutional equation could cover the whole strain rang of t-HPS, regardless of whether it was experimental [16,17,18,19,20] or theoretical [19,20]. This is same as in the simulation of HPT. The power law hardening model [14,21] as is used in the present work, or the rigid-plastic model [22,23] were used for HPT. Although this can introduce errors to some extent, the simulation could still reflect metal flow during the process.
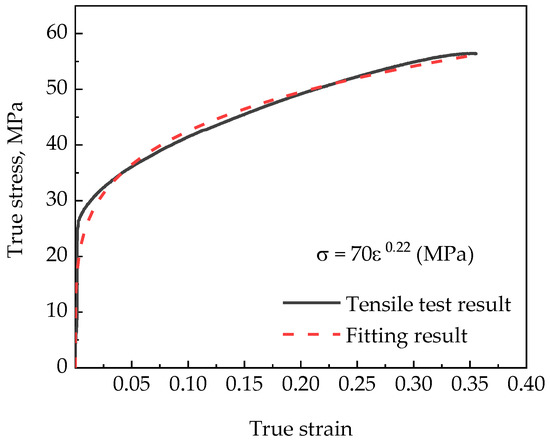
Figure 2.
The true stress-true strain curve of 5N Aluminum obtained by quasi-static tension test and fitting by the power law hardening model: .
In order to avoid slipping between the sample and the dies, the friction was set to satisfy the sticking condition in simulation [9,13]. D1 and θ are the depth of the concave on the cylinder and the half cone angle of the die in t-HPS pressurized by wedge effect, and D2 is the wall thickness of the pressurizing ring in t-HPS pressurized on both ends of the tube, these parameters are variables, as shown in Figure 1b,c. Meshes were generated with ~3000 elements in the sample. The rotation angle is set to α = 45° in comparison of strain distribution between the two pressurizing alternations of t-HPS, and set to α = 360° for other simulations. The themes and variables investigated in this paper and the corresponding simulation parameters are listed in Table 1.

Table 1.
Simulation variables and parameters; each line in the table indicates the simulation conditions to investigate the effect of one variable on strain distribution (with underlined alternations of the variable values), with the other variables are set to constant for the simulation.
According to previous works [24,25,26] on microstructure changes during the deformation of aluminum, the grains were refined monotonously with the increase of strain for high purity aluminum processed by SPD. Therefore, the grain structure after deformation processing could be used as a qualitative indication of the plastic strain that it underwent. In this investigation, 5N aluminum (99.999%) was used to verify some of the simulation results qualitatively, and EBSD (Electron Backscattered Diffraction) was used to characterize the grain structure.
3. Results
3.1. Comparison between the Two Pressurizing Alternations for t-HPS
The distribution of equivalent strain across the vertical section of samples for t-HPS of the two different pressurizing alternations are shown in Figure 3. There is a significant gradient in the strain distribution along the radius direction in both alternations at the middle cross-section, which coincides well with Equation (1), as shown in Figure 4. However, unlike the ideal case described by Equation (1), as is also apparent from Figure 3, the strain distribution is inhomogeneous along the axial direction. For the t-HPS pressurized on both ends of the tube, the equivalent strain on the inner surface decreased gradually along the axial direction from the middle to zero at the tube ends; while the distribution of the strain on the outer surface showed the opposite trend. A high and a low strain region can be observed around the edge corner of the tube sample, as shown in Figure 3a. The variation of the strain at the inner and outer surface of t-HPS pressurized using the wedge effect is opposite to that pressurized on both ends of the tube, as shown in Figure 3b. During t-HPS, hydrostatic pressure is high enough to prevent any localized slip, which makes it difficult for the material to flow around the corner region, making this region a “dead metal zone”. A similar case has been reported for HPT [13].
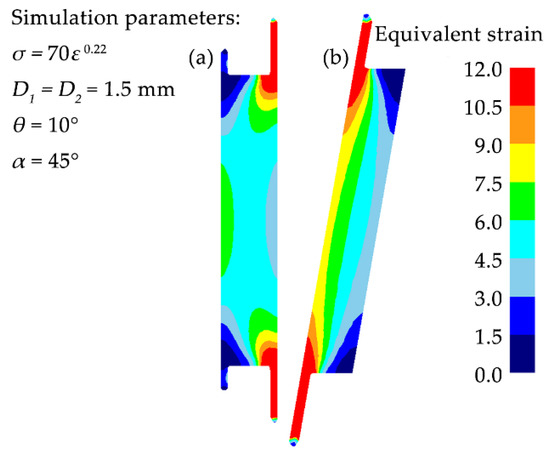
Figure 3.
Distribution of equivalent strain across the vertical section of samples during t-HPS: (a) pressurized on both ends of the tube, (b) pressurized using the wedge effect.
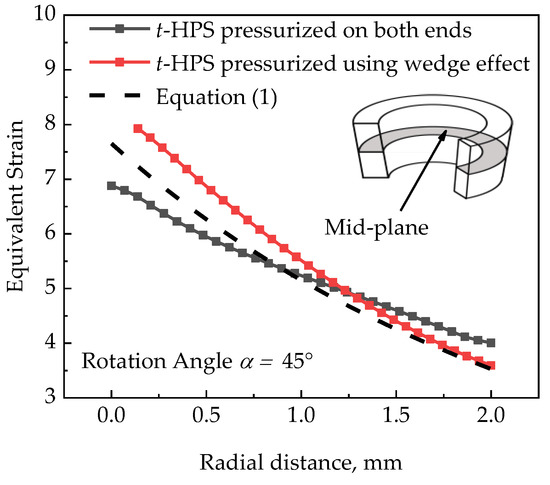
Figure 4.
Equivalent strain plotted as a function of the radius position on the mid-plane for the two pressurizing alternations of t-HPS, in comparison with analytical solution Equation (1).
3.2. Effect of the Half Cone Angle for t-HPS Pressurizing Using Wedge Effect
Figure 5 shows the equivalent strain distributions across the vertical section of samples after one rotation of t-HPS at various half cone angles (5°, 7.5°, 10°, and 20°); the equivalent strain distribution is relatively similar for the four cases of different half cone angles. When the half cone angle increases, the “dead metal zone” decreases slightly, but the strain asymmetry between the upper and lower ends is aggravated. In addition, the strain at the outer surface is more sensitive to the half cone angle, and a larger half cone angle causes relatively larger strain at the outer surface. Overall, the half cone angle has little effect on the equivalent strain for t-HPS. This gives a convenient condition to optimize the hydrostatic pressure by alternating the half cone angle.
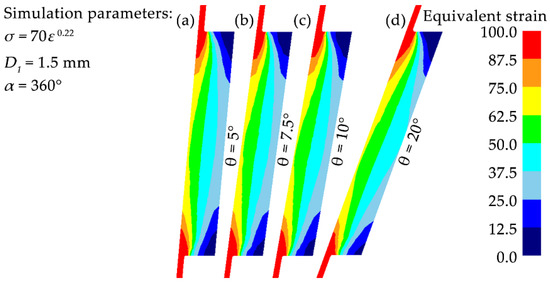
Figure 5.
Distribution of equivalent strain across the vertical section of samples with various half cone angles during t-HPS: (a) θ = 5°, (b) θ = 7.5°, (c) θ = 10°, (d) θ = 20°.
3.3. Effect of the Concave Depth in t-HPS Pressurizing Using Wedge Effect
Figure 6 shows the equivalent strain distributions across the vertical section of samples after one rotation of t-HPS at various concave depth D1 (1.75, 1.5, 1, and 0 mm). Due to the existence of die clearance, flash was formed in all four cases of different concave depths. The flash length increases with the decrease of concave depth, and the sample thinning during t-HPS increases gradually. Especially at D1 = 0 mm, there were no restrictions on the upper and lower ends of the tube sample, and the thinning of sample reached about 1.1 mm, on the other hand the strain distribution along the axis direction was more homogeneous. When D1 > 0, the radial and axial strain of the sample are very inhomogeneous, due to the end edge constraint under high pressure, “dead metal zone” and “strain concentration zone” were formed at the surface corner to a different extent. As can be seen from Figure 6, with the increase of D1, the equivalent strain decreases on the outer surface and increases on the inner surface, and the “dead metal zone” at the both ends of the tube sample extends. This means that the strain inhomogeneity intensifies upon increasing the concave depth of the cylinder.
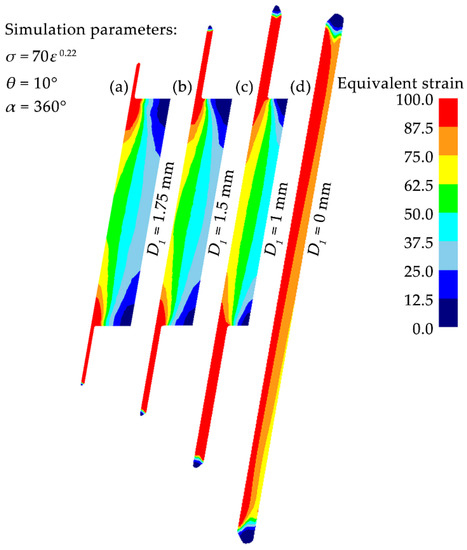
Figure 6.
Distribution of equivalent strain across the vertical section of samples at various concave depth during t-HPS: (a) D1 = 1.75 mm, (b) D1 = 1.5 mm, (c) D1 = 1 mm, (d) D1 = 0 mm.
3.4. Effect of the Strain-Hardening Exponent in t-HPS Pressurizing Using Wedge Effect
The strain-hardening exponent of material affects strain distribution according to the analytical solution Equation (1). This work investigates the deviation from theoretical solution in strain, which is defined as: , Where is the equivalent strain obtained by FEM and is calculated by Equation (1). Its significance lies in indicating the degree of strain deviating from the ideal, and the closer to zero this value is, the closer the deformation is to the ideal.
It can be seen in Figure 7 that, for work-hardening material, the radial strain gradient increases with the decrease of the hardening exponent, which can also be reflected in the Equation (1), and a larger “dead metal zone” is formed. Figure 8 shows the strain deviation at the inner and outer surface along the axial direction of the tubular sample with different strain-hardening exponents after one rotation of t-HPS. There is no significant difference of on the inner surface of the three n values, except for the tube ends. However, on the outer surface is very different, and the lower the strain-hardening exponent of the material is, the greater the deviation from the theoretical becomes, that is, the axial strain inhomogeneity increases with the decrease of n. Especially when n = 0.1, the whole height range of the sample is affected by tube ends friction.
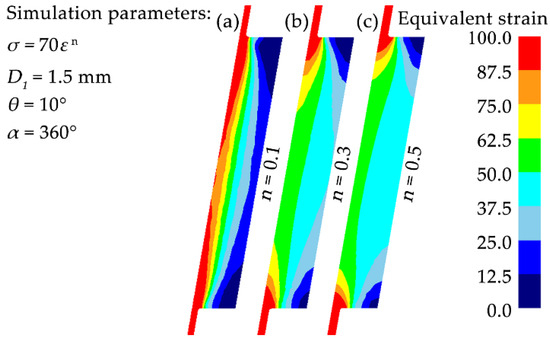
Figure 7.
Distribution of equivalent strain across the vertical section of samples with various strain-hardening exponents during t-HPS: (a) n = 0.1; (b) n = 0.3; (c) n = 0.5.
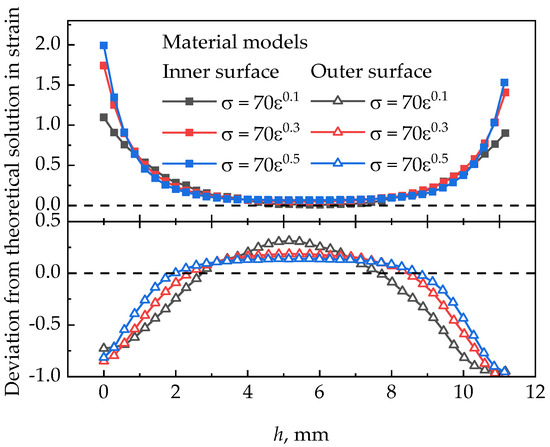
Figure 8.
Deviation from theoretical solution in strain () at the inner and the outer surfaces with different strain-hardening exponents after one rotation of t-HPS.
3.5. Grain Structure after t-HPS Pressurizing Using Wedge Effect
Figure 9 shows the microstructure of the lower half of vertical section of 5N Aluminum after 1/8 rotation (α = 45°) of t-HPS pressurizing using wedge effect. The upper half of the same vertical section is almost exactly symmetric to this lower half and is thus omitted here to save space. The grain size distribution in Figure 9, well matches with the strain distribution in Figure 3b. There is a significant gradient grain size distribution along the radius direction in the mid-plane, the grain size at the inner surface was refined to about 10 µm, and at the outer surface was larger than 100 µm (the initial grain size is larger than 500 µm). There are coarse grains equivalent to the initial grain size at the corner edge of the bottom of the sample, and a large number of low angle grain boundaries (indistinct at this magnification) within these grains, this region belongs to the “dead metal zone”. Therefore, it can be considered that the simulation results can objectively and accurately reflect the deformation of 5 N aluminum during t-HPS.
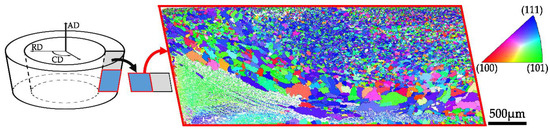
Figure 9.
Orientation maps obtained by Electron Backscattered Diffraction (EBSD) after 1/8 rotation (45°) t-HPS (half cone angel 10°) across the lower half of vertical section of the 5N aluminum sample (AD: the axial direction, CD: the circumferential direction, RD: the radial direction).
4. Discussion
4.1. The Effect of the Concave Depth
Figure 10 replots the equivalent strain distribution along the radius at mid-plane from Figure 6, at different concave depths. In all cases, the figure shows that the equivalent strain along the radial obtain by FEM is higher than the analytical solution, the equivalent strain general increases with decreasing the concave depth, and reaches extreme at D1 = 0, where no any concave exists at all. An earlier report [21] showed that the FEM prediction for HPT falls between the two theoretical predictions for the starting and final sample thicknesses because the thickness varies during processing. It is also reported [27] that the compressive strain during HPT needs to be considered for the analytical solution of the equivalent strain of HPT. Analogous to the case of HPT, there are two possible reasons why the t-HPS strain calculated by FEM is higher than the analytical solution. First, with the flash forms gradually as the t-HPS progress, the t-HPS process is no longer just a simple shear, but a combination of extrusion and shear deformation. Second, the tube wall is gradually thinned during the t-HPS, that is, the inner radius Ri increases gradually; and according to Equation (1), the increase of Ri leads to the general increase of the equivalent strain.
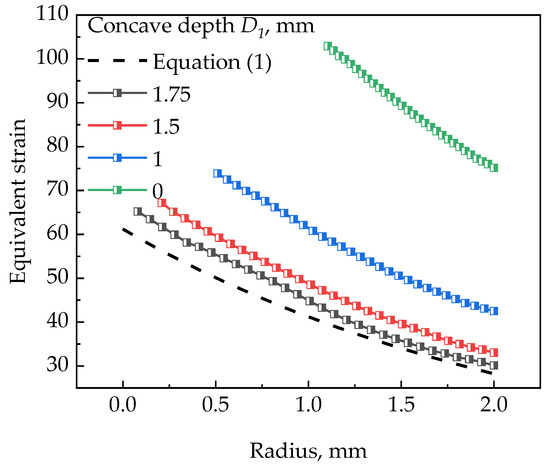
Figure 10.
Equivalent plastic strain distributions along the radial direction in the mid-plane at the concave depth of 1.75, 1.5, 1 and 0 mm, in comparison with theoretical results.
When the concave depth in the HPT anvil increases, the effect of the friction force on the lateral surface of the sample is intensified and then the strain inhomogeneity increases during the HPT process [8,9]. Therefore, the concave depth has great influence on HPT, which is also the case for t-HPS, as mentioned above. Thus, the increases of concave depth will aggravate strain inhomogeneity and a larger “dead metal zone” will be formed. On the contrary, if the D1 is reduced, the strain along the axial direction is more homogeneous, but the thinning of the sample is more serious, resulting in a large quantity of material loss, which will at least limit the maximum rotations and the maximum strain that could be achieved in t-HPS. In the geometric condition used in this paper, the suitable concave depth is 1–1.5 mm.
4.2. The Effect of Strain-Hardening Exponent: t-HPS Vs HPT
Both t-HPS and HPT are simple shearing process driven by friction, in ideal case as mentioned above, the only difference between them is geometrical and lies in the different normals of the shearing plane, respectively. However, their analytical solutions for strain distribution, even in the ideal case, are fundamentally different. Like Equal Channel Angular Pressure (ECAP) [28,29], Accumulative Roll-Bonding (ARB) [30], etc., the analytical strain equation in HPT is related only to the geometric parameters of the die and the sample. While for t-HPS, in addition to the geometric parameters of the die and the sample, the strain equation is also strongly related to the constitutive relationship of the sample material, e.g., the strain-hardening exponent as shown above in Equation (1). This means, for an ideal HPT, if the geometry of the die and the sample are the same, after HPT processing with the same rotations, the strain distribution in the sample is completely identical, with no any relation to the materials property. Thus, the strain-hardening exponent has no effect on the strain distribution (e.g., radial strain gradient) in the ideal case. However, for the ideal t-HPS, the strain field obtained in the materials with different hardening exponents are completely different after the same rotations. In a word, the radial strain gradient is strongly related to the strain-hardening exponent in the ideal t-HPS.
However, for the actual quasi-constrained HPT and t-HPS, due to inevitable flash, the strain-hardening exponent has an effect on the strain distribution for both of them. For t-HPS, the lower the strain-hardening exponent of the material, the greater the deviation between the simulation and analytical results of strain distribution, and the larger the “dead metal zone” formed. This is also observed in HPT, where the lower the strain-hardening exponent is, the greater the “dead metal zone“ formed. The deformation inhomogeneity also increased at the edge of the disk, which corresponds well with the report of literature [8,31]. In a word, for the two processing methods, the decrease of the hardening exponent will increase the deviation of simulated strain distribution from that of theoretical results, form a larger “dead metal zone”, and aggravate the strain inhomogeneity.
Figure 11 gives a comparison of the average radial strain gradient as a function of the strain-hardening exponent between simulation close to practical situations and theoretical results in the processed sample without including the edge part, for both t-HPS and HPT. For t-HPS, the strain-hardening exponent unveils its effect on strain distribution in both an ideal analytical equation and simulation close to practical situations; the average radius strain gradient increases (note the negative sign of this gradient) with the decrease of strain-hardening exponent in analytical formulation, the simulation with close to practical situations has the same tendency, but just intensifies this effect of strain-hardening exponent, as shown in Figure 11a. For HPT, however, the strain-hardening exponent unveils its effect only in the simulation close to practical situation, but not in the analytical equation, as shown in Figure 11b.
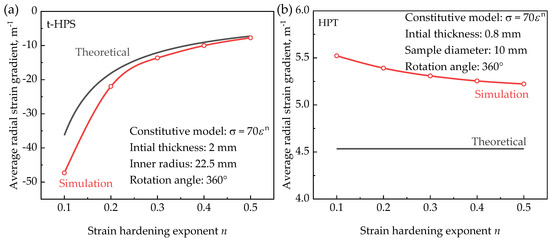
Figure 11.
Comparison of the average radial strain gradient as a function of the strain-hardening exponent between simulation close to practical situations and theoretical results in the processed sample without including the edge part, for both t-HPS: (a) and HPT (b) where the die dimension similar to the reference [8].
This feature of t-HPS stands out from other SPD processes like HPT. This makes practical t-HPS behavior more predictable, as indicated by Figure 11a, in its analytical formation than any other SPD processes, and places it in an advantageous position in understanding the basics of deformation physics through the coupling between practical experiments and theoretical approaches.
5. Summary and Conclusions
In this study, the effects of die geometries (the concave depth and the half cone angle), the pressurizing method, and the material model (e.g., strain-hardening exponent) on the strain distribution during the t-HPS were investigated using FEM with a close to practical situation and experiments, in comparison with HPT. Following conclusion could be reached,
- (1)
- Both alternations of pressurizing method for t-HPS: pressurizing on both ends of the tube and pressurizing using the wedge effect could be successfully used to realize the t-HPS process. Due to the friction effect on the ends of the tube samples, the axial strain distribution is inhomogeneous, and a “dead metal zone” forms at the end edge corner of the tube samples. This was confirmed by the experimental EBSD observations of the grain distributions on the vertical sections of the 5N aluminum after t-HPS processing.
- (2)
- For t-HPS pressurizing using wedge effect, the half cone angle has little effect on the strain inhomogeneity of the t-HPS, therefore, there is no strong limitation on the selection of the half cone angle from the view point of strain distribution.
- (3)
- Although the axial strain inhomogeneity of the sample can be reduced by decreasing the concave depth of the cylinder, this may cause excessive thinning of the sample in the meantime when the concave depth is too low. Therefore, this strategy should be used with care to avoid such negative effects.
- (4)
- The radial strain gradient is related to strain-hardening exponent in both ideal t-HPS described by theoretical equation and practical t-HPS described by FEM. This feature of t-HPS stands out from other SPD processes like HPT, where although materials parameters like the strain hardening exponent have an obvious effect of strain distribution, although it does not have any influence on ideal corresponding processes. This makes practical t-HPS behavior more predictable in its analytical formation than any other SPD processes, and places it in an advantageous position in understanding the basics of deformation physics through the coupling between practical experiments and theoretical approaches.
Author Contributions
J.J.M. conceived and designed the experiments, curated the data, analyzed the formal and wrote the paper; Z.L. and Y.L. reviewed and edited the paper; Y.B.Z. collected resources; S.W. investigated; K.L. and J.Q.T. supervised; J.T.W. conceived and designed the experiments and reviewed and edited the paper.
Funding
This research was funded by the National Key R & D Program of China grant number 2017YFA0204400 and the Natural Science Foundation of China grant number 51520105001.
Conflicts of Interest
The authors declare no conflict of interest.
References
- Bridgman, P.W. Effects of High Shearing Stress Combined with High Hydrostatic Pressure. Phys. Rev. 1935, 48, 825. [Google Scholar] [CrossRef]
- Valiev, R.Z.; Islamgaliev, R.K.; Alexandrov, I.V. Bulk nanostructured materials from severe plastic deformation. Prog. Mater. Sci. 2000, 45, 103. [Google Scholar] [CrossRef]
- Wang, J.T.; Li, Z.; Wang, J.; Langdon, T.G. Principles of severe plastic deformation using tube high-pressure shearing. Scr. Mater. 2012, 67, 810. [Google Scholar] [CrossRef]
- Toth, L.; Arzaghi, M.; Fundenberger, J.; Beausir, B.; Bouaziz, O.; Arruffatmassion, R. Severe plastic deformation of metals by high-pressure tube twisting. Scr. Mater. 2009, 60, 175. [Google Scholar] [CrossRef]
- Li, Z.; Zhang, P.F.; Yuan, H.; Lin, K.; Liu, Y.; Yin, D.L.; Wang, J.T.; Langdon, T.G. Principle of one-step synthesis for multilayered structures using tube high-pressure shearing. Mat. Sci. Eng. A. 2016, 658, 367. [Google Scholar] [CrossRef]
- Wang, J.T.; Li, Z.; Wang, J.; An, Y.K. Method and device for realizing tube high-pressure shearing pressurized using wedge effect. China patent CN 102500632 A, 30 September 2011. [Google Scholar]
- Valiev, R.Z.; Ivanisenko, Y.V.; Rauch, E.F.; Baudelet, B. Structure and deformaton behaviour of Armco iron subjected to severe plastic deformation. Acta Mater. 1996, 44, 4705. [Google Scholar] [CrossRef]
- Figueiredo, R.B.; Aguilar, M.T.P.; Cetlin, P.R.; Langdon, T.G. Analysis of plastic flow during high-pressure torsion. J. Mater. Sci. 2012, 47, 7807. [Google Scholar] [CrossRef]
- Lee, D.J.; Kim, H.S. Finite element analysis for the geometry effect on strain inhomogeneity during high-pressure torsion. J. Mater. Sci. 2014, 49, 6620. [Google Scholar] [CrossRef]
- Hohenwarter, A.; Bachmaier, A.; Gludovatz, B.; Scheriau, S.; Reinhard Pippana, B. Technical parameters affecting grain refinement by high pressure torsion. Int. J. Mater. Res. 2009, 100, 1653. [Google Scholar] [CrossRef]
- Halloumi, A.; Busquet, M.; Descartes, S. Parametric study of unconstrained high-pressure torsion- Finite element analysis. IOP Conf. Ser. Mater. Sci. Eng. 2014, 63, 12036. [Google Scholar] [CrossRef]
- Kamrani, M.; Levitas, V.I.; Feng, B. FEM simulation of large deformation of copper in the quasi-constrain high-pressure-torsion setup. Mat. Sci. Eng. A. 2017, 705, 219. [Google Scholar] [CrossRef]
- Lee, D.J.; Yoon, E.Y.; Park, L.J.; Kim, H.S. The dead metal zone in high-pressure torsion. Scr. Mater. 2012, 67, 384. [Google Scholar] [CrossRef]
- Figueiredo, R.B.; de Faria, G.C.V.; Cetlin, P.R.; Langdon, T.G. Three-dimensional analysis of plastic flow during high-pressure torsion. J. Mater. Sci. 2013, 48, 4524. [Google Scholar] [CrossRef]
- Zhou, C.P.; Li, Z.; Liu, F.; Wang, J.T. Influence of Strain Rate on Recrystallization Behavior of High Purity Aluminum by Tube High-Pressure Shearing. Mater. Sci. Forum. 2015, 817, 516. [Google Scholar] [CrossRef]
- Yang, L.; He, Y.; Qu, J. Investigation on large deformation constitutive model based on solid cylinder torsion test. In Proceedings of the 5th International Conference on Nonlinear Mechanics, Shanghai, China, 11–14 June 2007; Civil Engineering College and Haibin Engineering University: Harbin, China, 2007; pp. 309–312. [Google Scholar]
- Dienes, J.K. On the analysis of rotation and stress rate in deforming bodies. Acta Mech. 1979, 32, 217. [Google Scholar] [CrossRef]
- Wu, P.D.; Van der Giessen, E. Analysis of elastic-plastic torsion of circular bars at large strains. Arch. Appl. Mech. 1991, 61, 89. [Google Scholar]
- Estrin, Y.; Tóth, L.S.; Molinari, A.; Bréchet, Y. A dislocation-based model for all hardening stages in large strain deformation. Acta Mater. 1998, 46, 5509. [Google Scholar] [CrossRef]
- Baik, S.C.; Estrin, Y.; Kim, H.S.; Hellmig, R.J. Dislocation density-based modeling of deformation behavior of aluminium under equal channel angular pressing. Mat. Sci. Eng. A. 2003, 351, 86. [Google Scholar] [CrossRef]
- Figueiredo, R.B.; Cetlin, P.R.; Langdon, T.G. Using finite element modeling to examine the flow processes in quasi-constrained high-pressure torsion. Mat. Sci. Eng. A. 2011, 528, 8198. [Google Scholar] [CrossRef]
- Edalati, K.; Miresmaeili, R.; Horita, Z.; Kanayama, H.; Pippan, R. Significance of temperature increase in processing by high-pressure torsion. Mat. Sci. Eng. A. 2011, 528, 7301. [Google Scholar] [CrossRef]
- Figueiredo, R.B.; Pereira, P.H.R.; Aguilar, M.T.P.; Cetlin, P.R.; Langdon, T.G. Using finite element modeling to examine the temperature distribution in quasi-constrained high-pressure torsion. Acta Mater. 2012, 60, 3190. [Google Scholar] [CrossRef]
- Ito, Y.; Horita, Z. Microstructural evolution in pure aluminum processed by high-pressure torsion. Mat. Sci. Eng. A. 2009, 503, 32. [Google Scholar] [CrossRef]
- Salem, A.A.; Langdon, T.G.; Mcnelley, T.R.; Kalidindi, S.R.; Semiatin, S.L. Strain-path effects on the evolution of microstructure and texture during the severe-plastic deformation of aluminum. Metall. Mater. Trans. A 2006, 37, 2879. [Google Scholar] [CrossRef]
- Skrotzki, W.; Scheerbaum, N.; Oertel, C.G.; Brokmeier, H.G.; Suwas, S.; Tóth, L.S. Recrystallization of high-purity aluminium during equal channel angular pressing. Acta Mater. 2007, 55, 2211. [Google Scholar] [CrossRef]
- Degtyarev, M.V.; Chashchukhina, T.I.; Voronova, L.M.; Patselov, A.M.; Pilyugin, V.P. Influence of the relaxation processes on the structure formation in pure metals and alloys under high-pressure torsion. Acta Mater. 2007, 55, 6039. [Google Scholar] [CrossRef]
- Iwahashi, Y.; Wang, J.; Horita, Z.; Nemoto, M.; Langdon, A.T.G. Principle of equal-channel angular pressing for the processing of ultra-fine grained materials. Scr. Mater. 1996, 35, 143. [Google Scholar] [CrossRef]
- Segal, V.M. Materials processing by simple shear. Mat. Sci. Eng. A 1995, 197, 157. [Google Scholar] [CrossRef]
- Saito, Y.; Tsuj, N.; Utsunomiya, H.; Sakai, T.; Hong, R.G. Ultra-fine grained bulk aluminum produced by accumulative roll-bonding (ARB) process. Scr. Mater. 1998, 39, 1221. [Google Scholar] [CrossRef]
- Kawasaki, M.; Figueiredo, R.B.; Langdon, T.G. An investigation of hardness homogeneity throughout disks processed by high-pressure torsion. Acta Mater. 2011, 59, 308. [Google Scholar] [CrossRef]
© 2019 by the authors. Licensee MDPI, Basel, Switzerland. This article is an open access article distributed under the terms and conditions of the Creative Commons Attribution (CC BY) license (http://creativecommons.org/licenses/by/4.0/).