Article

Effects of Zr, Y on the Microstructure and Properties of As-Cast Cu-0.5Y-xZr (wt.%) Alloys

1
State Key laboratory of Nonferrous Metals and Processes, GRINM Group Co., Ltd, Beijing 100088, China
2
GRIMAT Engineering Institute Co., Ltd., Beijing 101407, China
3
School of Materials Science and Engineering, Northeastern University, Shenyang 110819, China
4
College of Engineering, Bohai University, Jinzhou 121000, China
*
Author to whom correspondence should be addressed.
Metals 2019, 9(10), 1084; https://doi.org/10.3390/met9101084
Submission received: 21 September 2019 / Revised: 5 October 2019 / Accepted: 7 October 2019 / Published: 9 October 2019

Abstract

:
In this paper, the microstructure and properties of as-cast Cu-Y-Zr alloys with different Zr content were studied in order to investigate whether the precipitates in copper alloys would interact with each other by adding Y and Zr simultaneously. As-cast Cu-0.5Y-xZr (wt.%, x = 0.05 and 0.1, nominal composition) alloys were prepared by vacuum melting in this study. Scanning electron microscopy (SEM), energy dispersive spectroscopy (EDS), X-ray diffraction (XRD), and transmission electron microscopy (TEM) were used to observe the microstructure of the alloys. The mechanical properties of the alloys were tested by universal material testing machine at room temperature. The effects of Zr content on the microstructure and mechanical properties of the alloys were explored. As shown by the research results, in the as-cast Cu-0.5Y-xZr (wt.%) alloys, the precipitated phase was the Cu5Y/Cu5Zr phase and ranged from 10 nm to 70 nm in size; when the Zr content increased from 0.05 wt.% to 0.1 wt.%, both the tensile strength and elongation rate of the alloys increased; when the Zr content was 0.1 wt.%, the tensile strength was 225 MPa and the elongation rate was 22.5%.

1. Introduction

Cast copper and copper alloys have excellent heat and electrical conductivity, corrosion resistance, good casting performance, mechanical processing performance, and appropriate strength [1]. They are easy to form complex parts with high efficiency and low cost. Hence, cast copper and copper alloys are widely used in integrated circuits, rail transit, and motor manufacturing [2]. However, with the development of industry, higher requirements have been put forward for the properties of cast copper and copper alloys. Alloying is an important method to improve the mechanical properties of cast copper alloys, which has attracted extensive attention of researchers.
Y is a rare earth element which is almost insoluble in a copper matrix at room temperature. It can form compounds with other alloy elements and refine the grain size of copper alloys [3]. Lu studied the effect of Y on the microstructure and properties of Cu and Cu-Si alloys. It was found that the addition of Y can form a Cu6Y phase and a Cum(Y, Si)n phase, which acted as dispersion strengthening phases and improved the mechanical properties of the alloys. However, excessive Y will led to excessive precipitation at the grain boundary, which destroyed the toughness of the alloys [4]. Pan et al. found that adding 0.05% Y + 0.05% La to Cu-0.81Cr-0.12Zr (wt.%) alloy can significantly improve its microhardness [5]. Xie et al. prepared Cu-0.6Cr-0.3Y (wt.%) alloy through rapid solidification/powder metallurgy and studied the electrical conductivity and mechanical properties of the alloy [6]. Yin et al. studied the effect of Y content on the hardness of Cu-Cr-Y alloys. It was found that the hardness of the alloy increased with the Y content [7]. Carro et al. studied the thermal conductivity of Cu-Y alloys. It was found the thermal conductivity of Cu-Y alloys was similar to that of Cu-Cr-Zr alloys [8].
The solubility of Zr in a copper matrix is very small. At the eutectic temperature of 965 °C, the ultimate solid solubility of Zr in copper is 0.15 wt.%; while at a temperature below 500 °C, it is only 0.01 wt.%. Therefore, at room temperature, Zr exists mainly in the form of a CumZrn phase in copper alloys [9]. The CumZrn phase can effectively hinder the slip of dislocations and the migration of grain boundaries, and thus significantly improve the mechanical properties of the alloys. Therefore, copper alloys with Zr have been extensively studied [10,11]. Chen et al. found that adding 0.2 wt.% of Zr to the Cu-15Cr (wt.%) alloy can significantly increase the strength of the alloy [12]. Watanabe et al. studied the effect of Zr on the microstructure and properties of Cu–Cr alloys. The results showed that Zr formed the Cu5Zr phase in the alloy and refined the Cr-rich phase, improving the strength of the alloy [13]. Ye et al. drew a similar conclusion based on their study of the Cu-Zr-B alloy. There are many forms of CumZrn phase in cast Cu-Zr alloys [14]. Peng et al. studied the phase transition in the Cu-0.12Zr (wt.%) alloy and its effect on the mechanical properties, finding that there was a discotic Cu5Zr phase in the alloy [15]. Huang et al. thought that the CumZrn phase formed in the Cu-0.31Cr-0.21Zr (wt.%) alloy was a Cu51Zr14 phase [16].
As mentioned above, Y and Zr are two effective alloying elements in copper alloys. However, there are few studies about Cu-Y-Zr alloys. The effect of Zr and Y on the microstructure and mechanical properties of copper, and whether the phases in Cu-Y-Zr alloys would interact with each other by adding Y and Zr simultaneously, are still unclear. In this paper, we prepared as-cast Cu-0.5Y-xZr (wt.%) alloys with different Zr contents. The microstructure of the as-cast Cu-0.5Y-xZr (wt.%) alloys were analyzed and the mechanical properties were investigated at room temperature. An X-ray diffractometer (XRD) and energy dispersive X-ray spectroscopy (EDS) were used to identify the precipitates in the alloys. Based on the results, the effect of adding Y and Zr simultaneously on the microstructure and properties of as-cast Cu-Y-Zr alloys, was determined.

2. Materials and Methods

2.1. Alloy Preparation

Cu-0.5Y-xZr (wt.%, x = 0.05 and 0.1, nominal composition) alloys were prepared using purity Cu (99.9 wt.%; Boyu, Shenyang, China), Cu-30 wt.% Y master alloy (Boyu, Shenyang, China), and Cu-70 wt.% Zr master alloy (Boyu, Shenyang, China). For the Cu-0.5Y-0.05Zr (wt.%) alloy, 15 kg pure Cu, 254.4 g Cu-30 wt.% Y master alloy, and 10.9 g Cu-70 wt.% Zr master alloy was melted in a vacuum melting furnace. For the Cu-0.5Y-0.1Zr (wt.%) alloy, 15 kg pure Cu, 254.6 g Cu-30 wt.% Y master alloy, and 21.8 g Cu-70 wt.% Zr master alloy was melted in a vacuum melting furnace. The melts were cast into a cast iron mold without preheating at 1100 °C and solidified in air. The ingots had dimensions of Φ 100 × 200 mm3.

2.2. Compositional Analysis and Microstructural Characterization

The chemical compositions of the alloys were analyzed using an inductively coupled plasma-optical emission spectrometer (ICP-OES; Optima 8330DV, Waltham, Massachusetts, MA, USA), according to the standard of ASTM B954-15.
The specimens intended for microstructural characterization were ground with emery papers up to 3000 grits, and then finely polished. The polished specimens were corroded using a corrosion solution consisting of 5 g of FeCl3, 10 mL of HCl, and 100 mL of C2H5OH. To determine the average grain sizes, an optical microscope (DSX500, Olympus, Tokyo, Japan) was used to observe the optical microstructure. The average grain sizes were measured using the line-intercept method, according to the standard of ASTM E112-13. To determine the distribution of the phases, a scanning electron microscope (Ultra Plus, Zeiss, Oberkochen, Germany) equipped with an energy dispersive X-ray spectroscopy (EDS) instrument was used to observe the scanning electron microscopy (SEM) image and analyze the surface elemental composition.
The transmission electron microscopy (TEM) specimens were ground to 70–80 μm and made into a small Ф 3 mm wafer by punching, and then double-jet thinning with methanol nitrate solution (HNO3:CH3OH = 3:7) as double-jet electrolyte. Ion thinning was carried out for 15 min before the specimens were observed. To further observe the microscopic morphology of precipitated phase, the TEM examinations were performed using a TEM instrument equipped with an EDS instrument (Tecnai G20, FEI, Hillsboro, Oregon, OR, USA), which was operated at 200 kV, for the phase identification.
A polycrystalline X-ray diffractometer (XRD; X’ Pert Pro, PANalytical, Almelo, The Netherlands) was used for the phase analysis, with an angle measuring range 2θ of 20–80°, a scanning step length of 0.02°, and a scanning speed of 4°/min.

2.3. Mechanical Tests

Tension tests were executed at room temperature using a universal testing machine (CMT5305, MST, Shanghai, China), according to the standard of ASTM E8/E8M. Tensile specimens with a gauge length of 25 mm and gauge width of 6 mm were used. The tension tests were performed at a strain rate of 1 × 10⁻³/s. For each test condition, five specimens were examined.

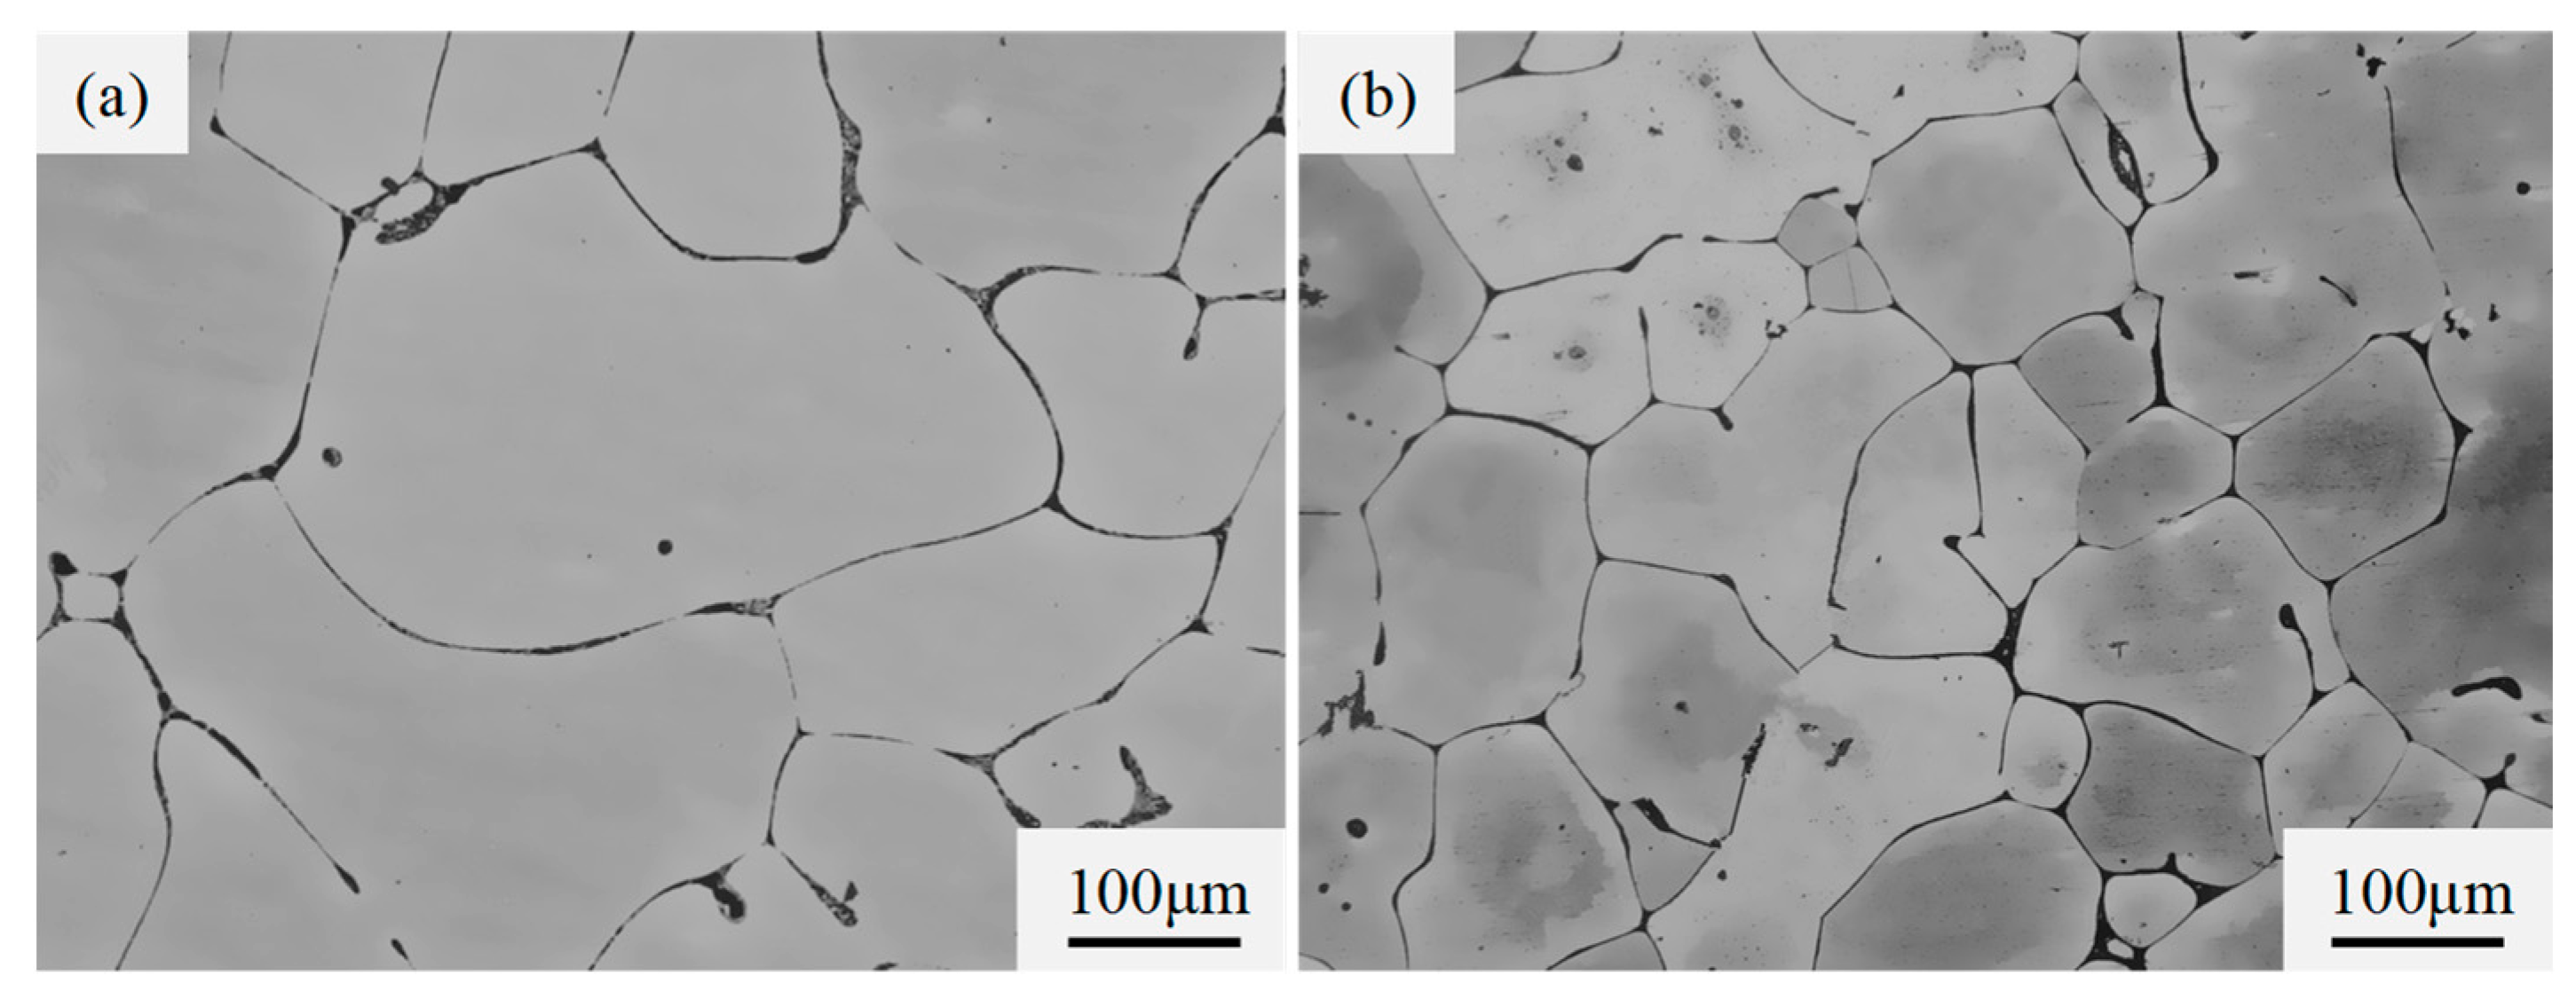
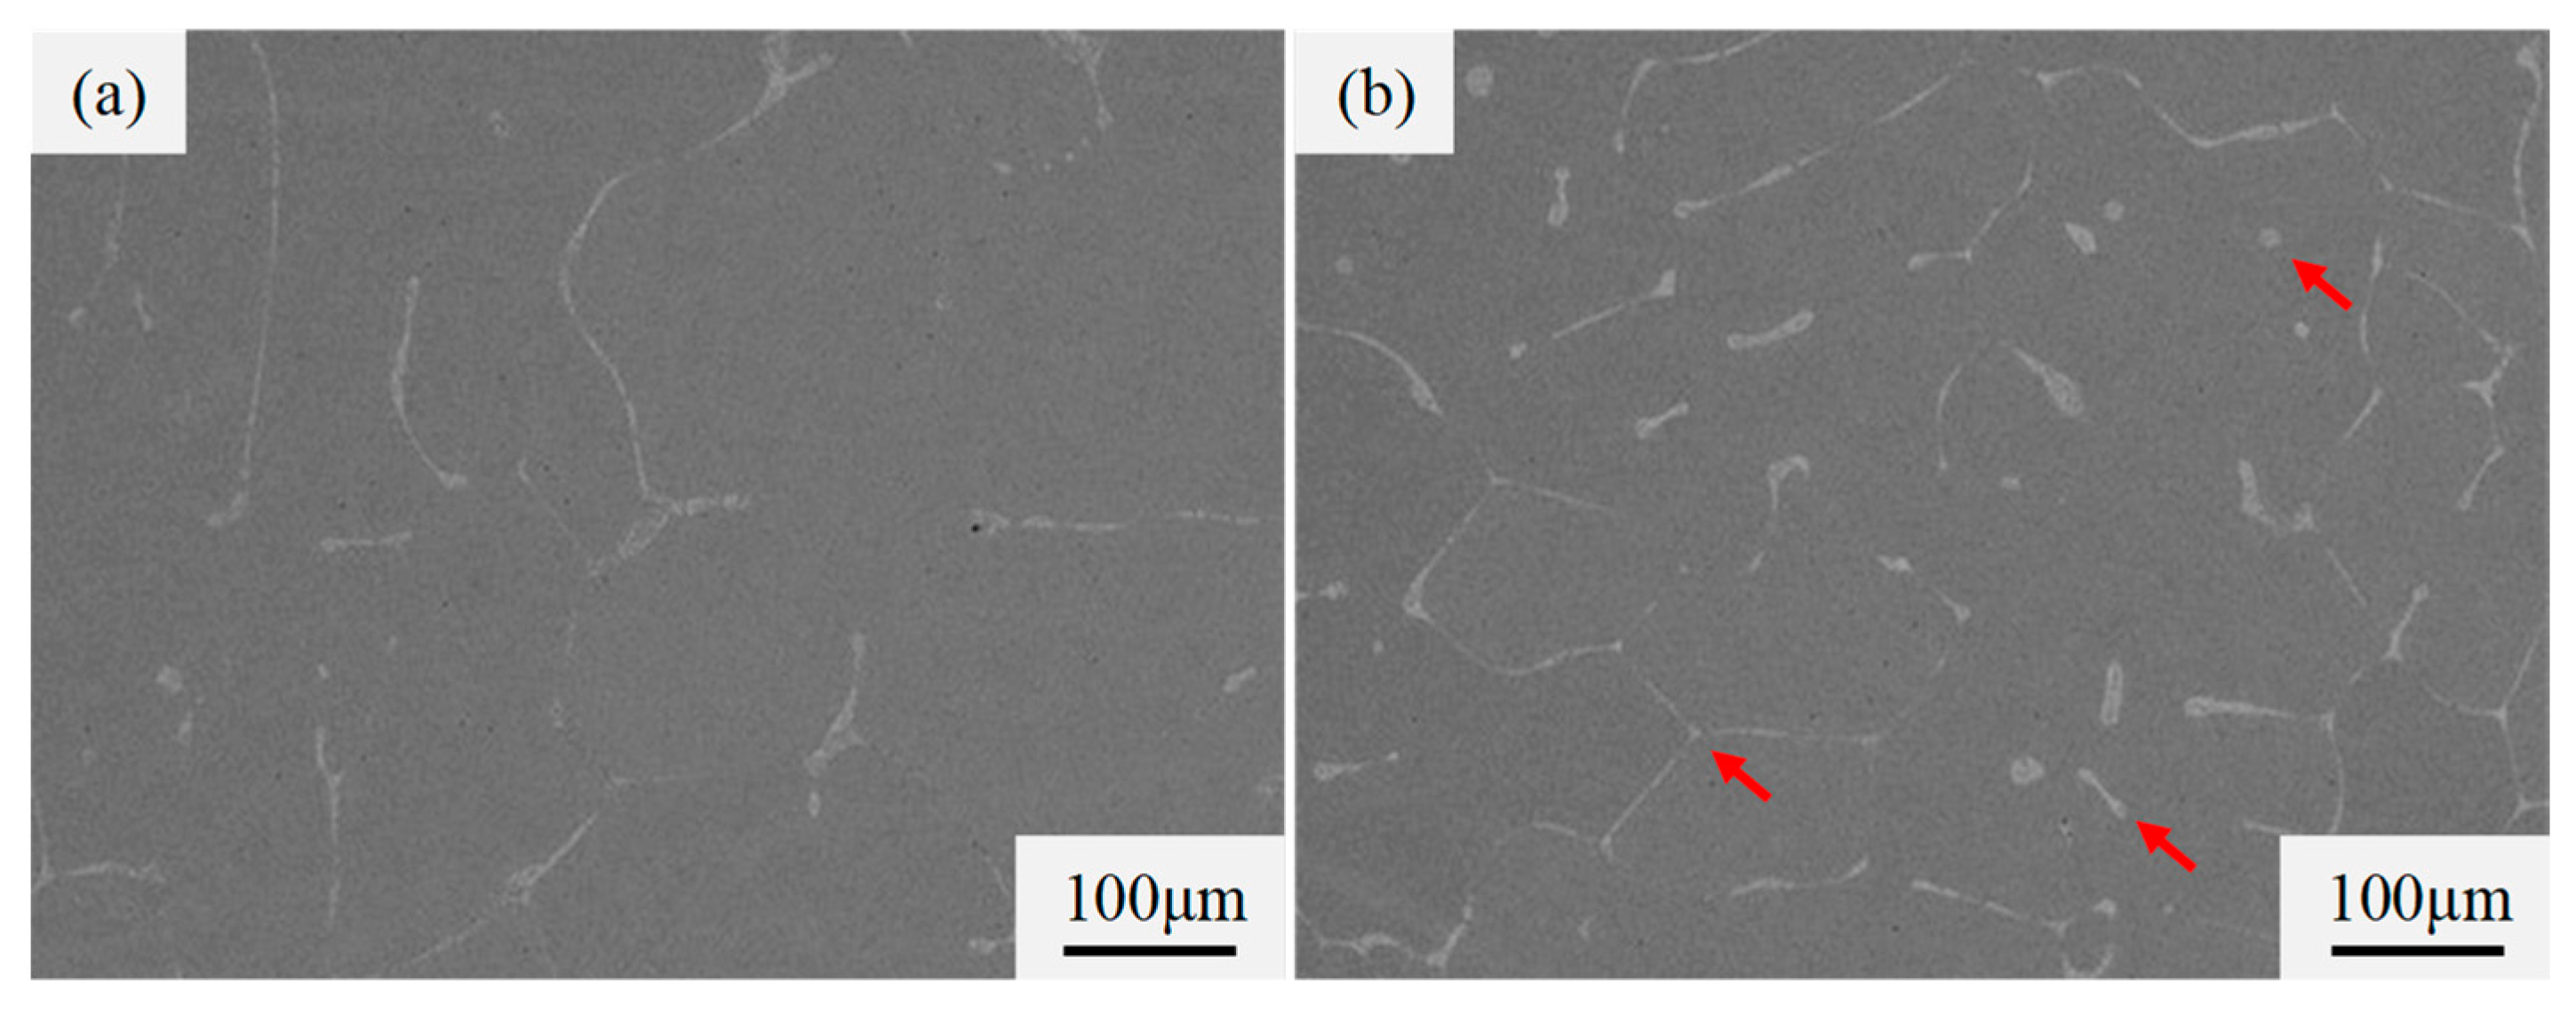
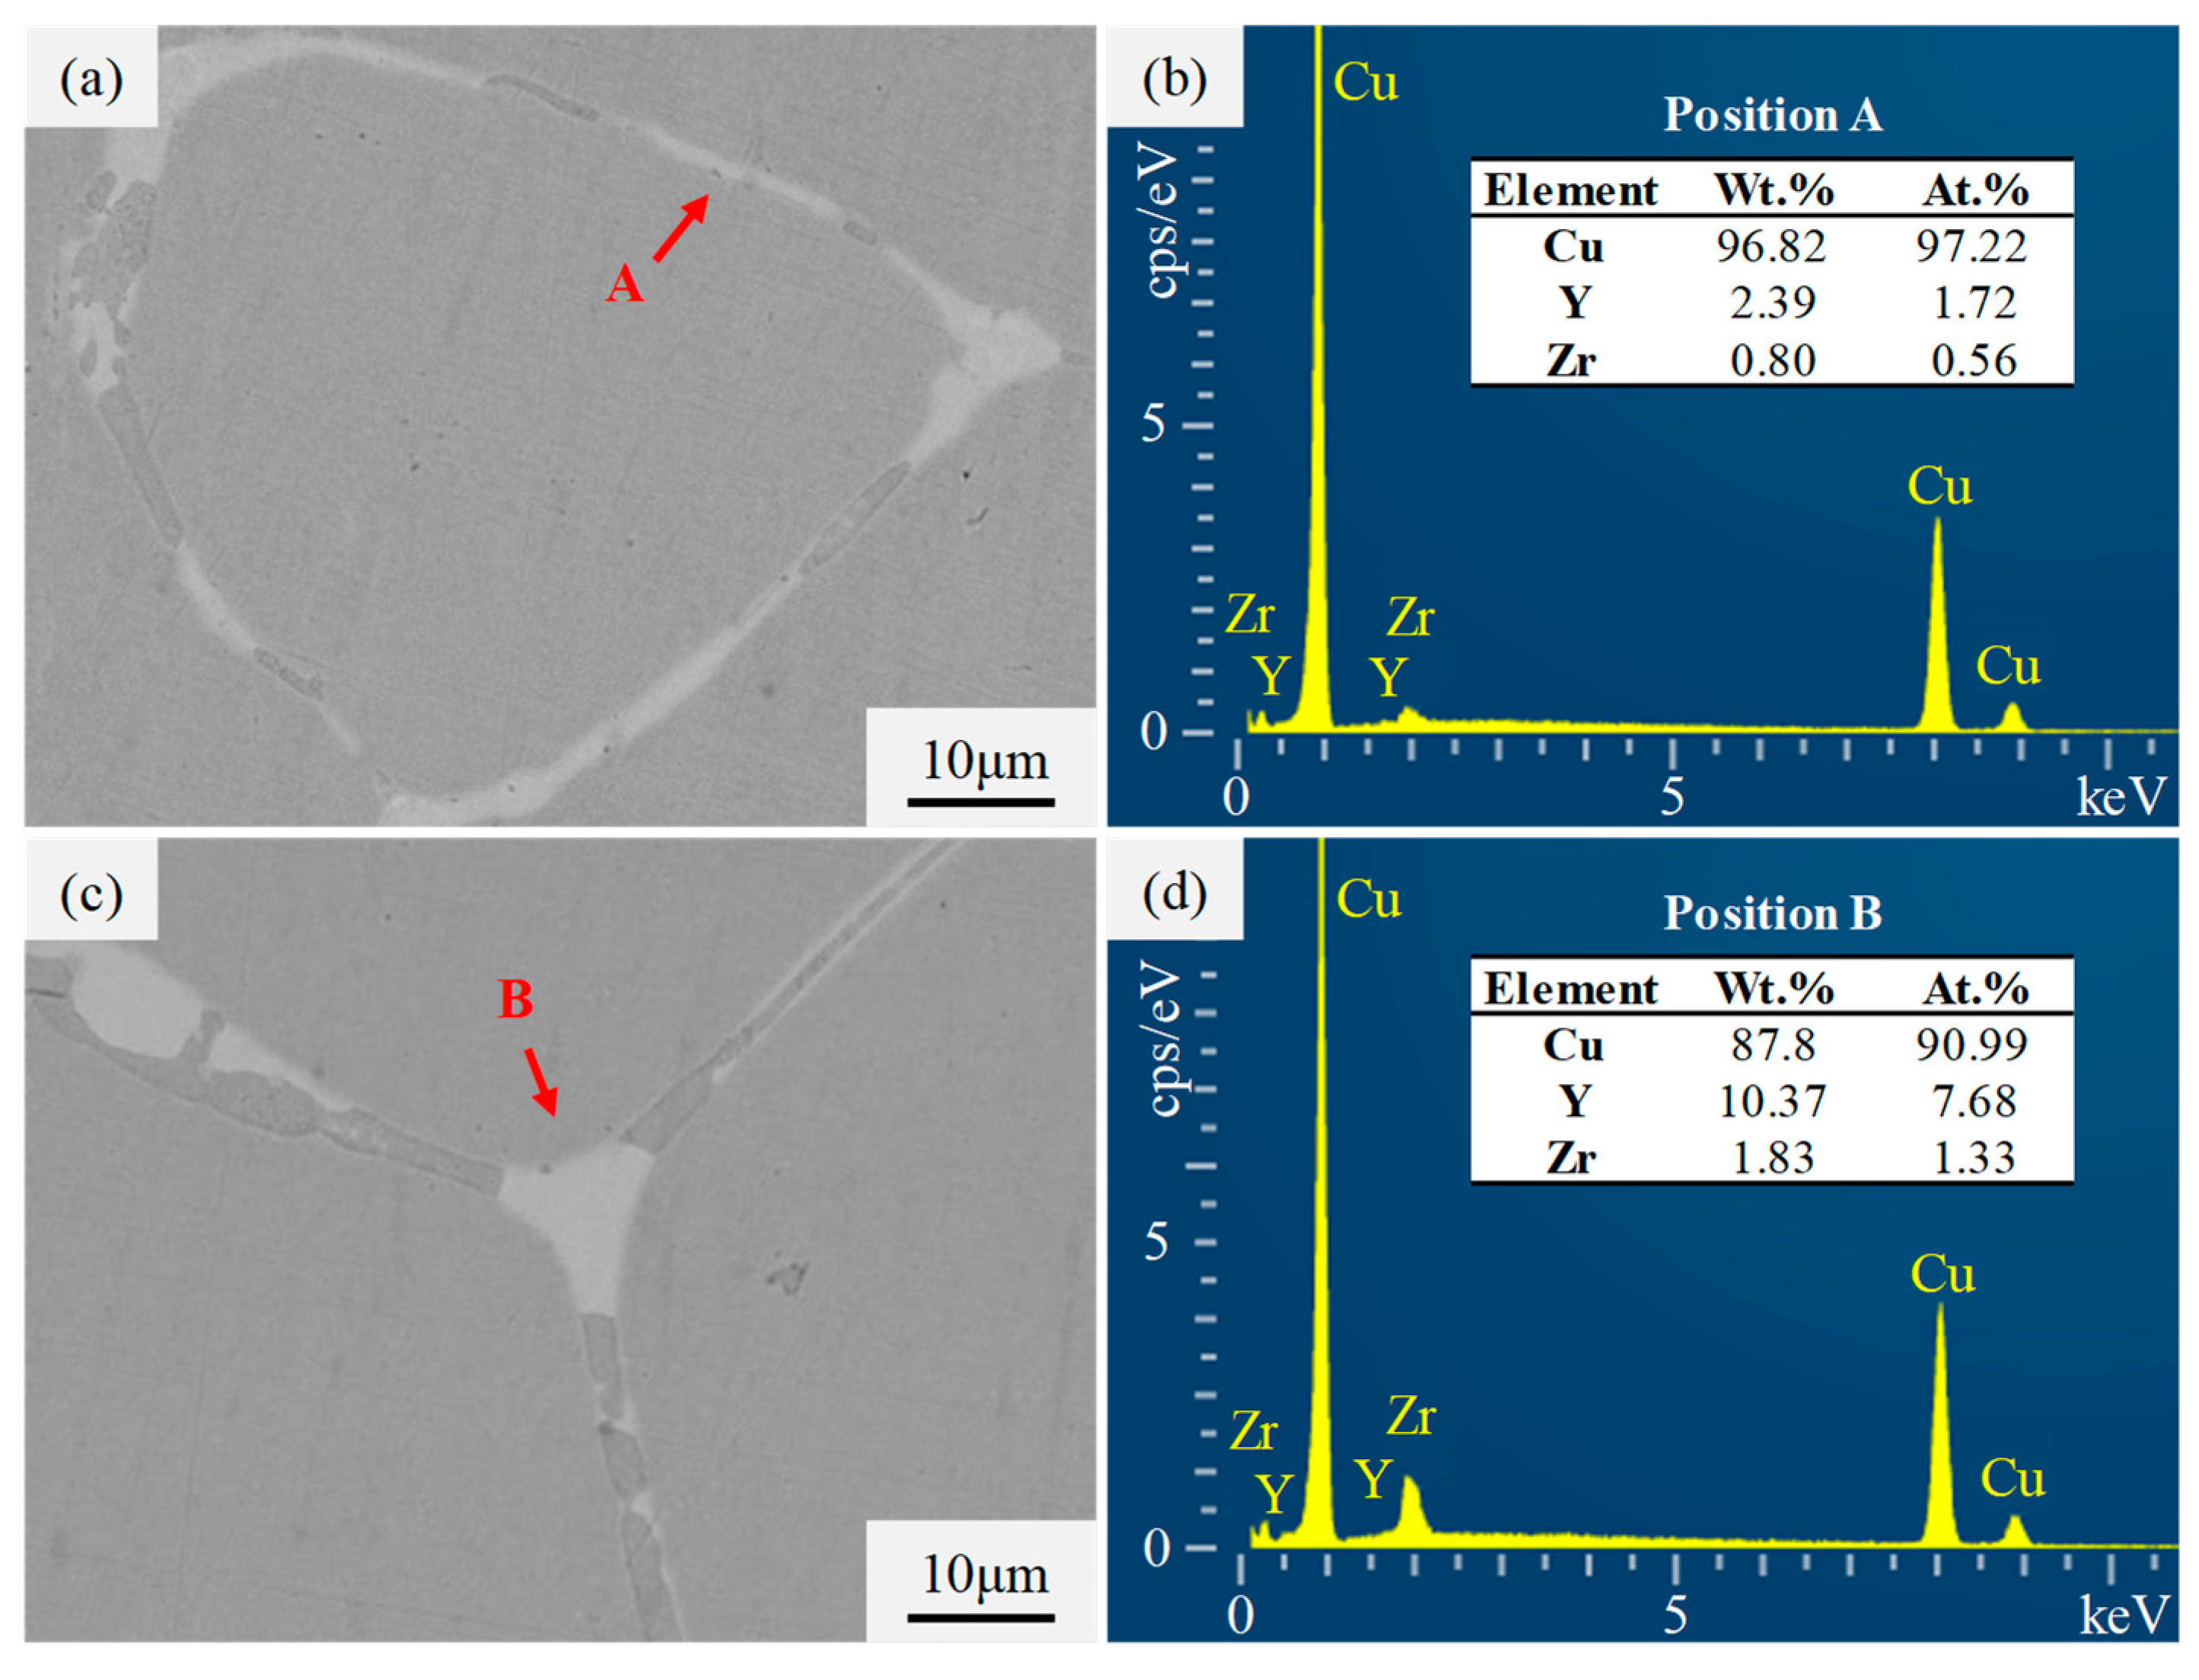
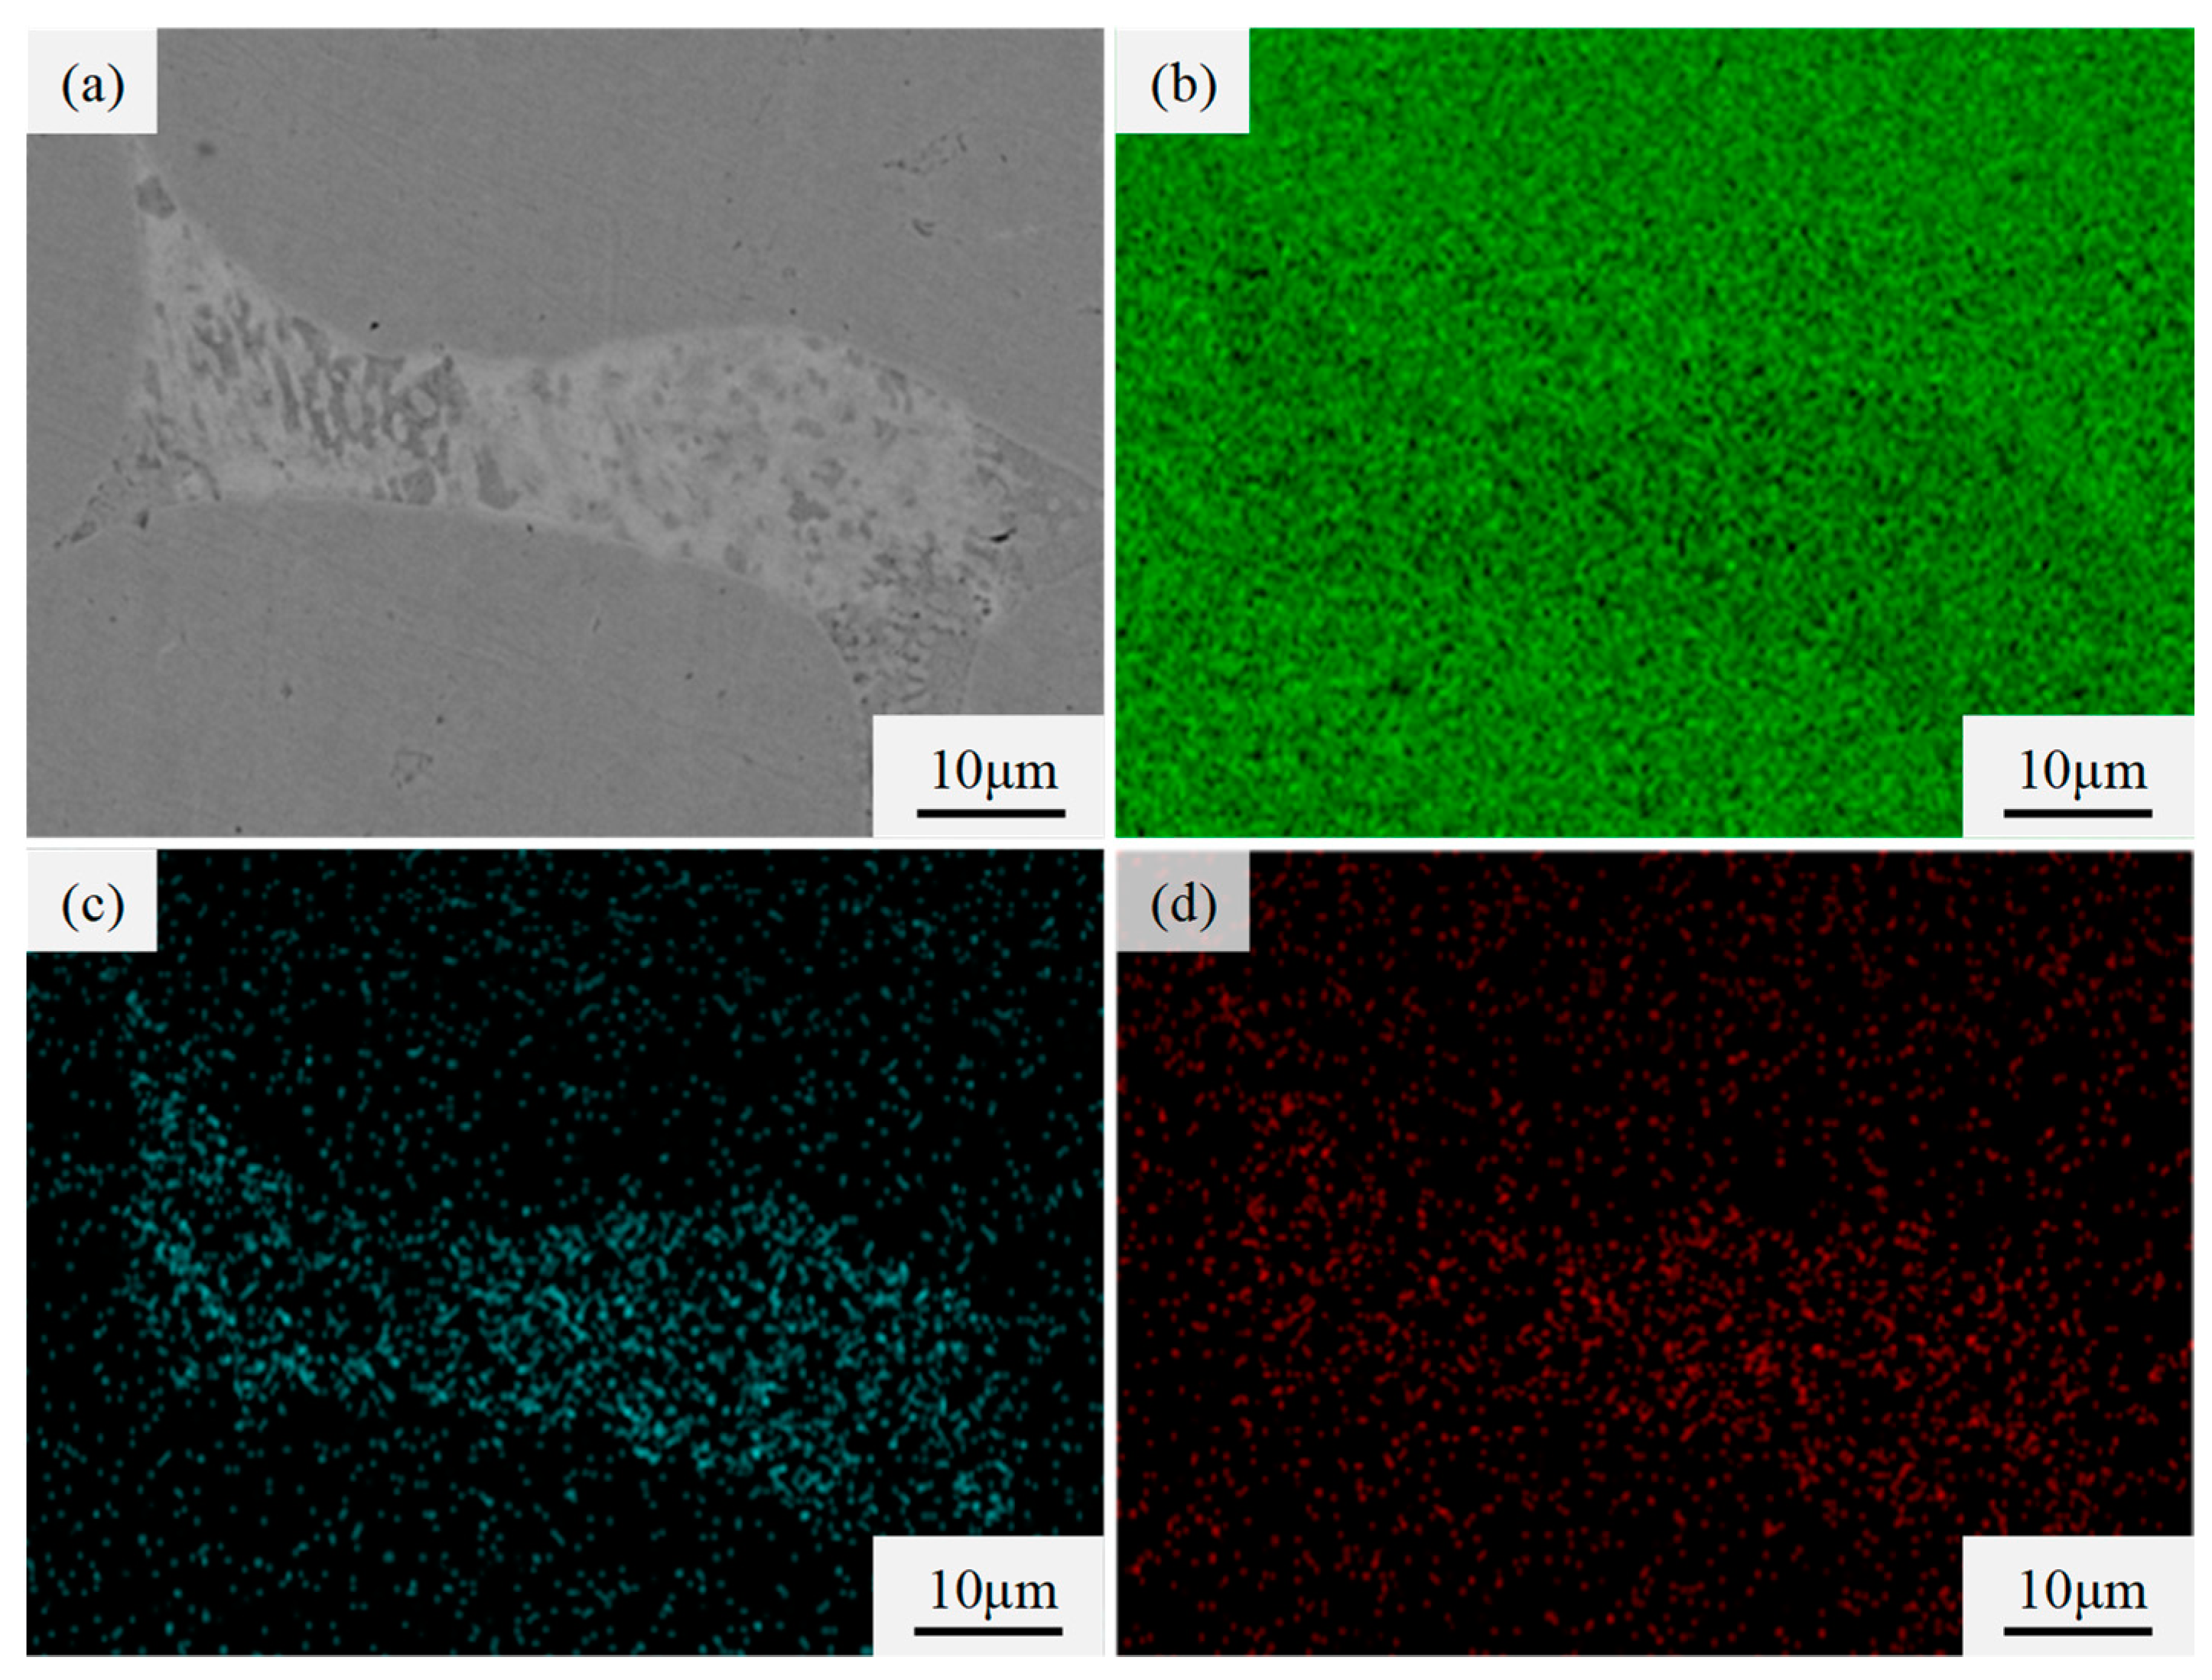
3. Results and Discussion

Table 1 shows the experimentally measured compositions of the as-cast Cu-0.5Y-xZr (wt.%) alloys. It can be seen that the contents of Y and Zr in the alloys were close to the nominal contents.
Figure 1 shows the optical images of the as-cast Cu-0.5Y-xZr (wt.%) alloys. As shown in Figure 1, the microstructure in the as-cast Cu-0.5Y-xZr (wt.%) alloys was an equiaxed structure. When the Zr content was 0.05 wt.%, there was a great difference in the grain size and the amount of coarse grains were much more than that of fine grains. The average grain size of the as-cast Cu-0.5Y-0.05Zr (wt.%) alloy was 163.5 μm. When the Zr content increased to 0.1 wt.%, the grain size of the alloy decreased and the grains became more uniform. The average grain size of the as-cast Cu-0.5Y-0.1Zr (wt.%) alloy was 95.5 μm.
Figure 2 shows the SEM images of the as-cast Cu-0.5Y-xZr (wt.%) alloys. As shown in Figure 2a, when the Zr content was 0.05 wt.%, the amount of the precipitated phases in the alloy was small. The phases mainly distributed at grain boundaries, and almost no phase can be observed inside the grains. As shown in Figure 2b, when the Zr content was 0.1 wt.%, the amount of the precipitated phases in the alloy increased obviously. There were two types of phase in the alloys. One was an elongated precipitated phase which was located at the grain boundaries, and the other was a blocky and short-rod-like phase (as indicated by the arrows in Figure 2b). The size of the blocky phase was below 10 μm, while that of the short-rod-like phase was slightly larger and differed greatly, with the largest size appearing at the grain boundaries.
Figure 3 shows the SEM images of the precipitated phases in the as-cast Cu-0.5Y-xZr (wt.%) alloys, and the EDS results of corresponding points. The results of EDS analysis indicated that the precipitated phases in both the Cu-0.5Y-0.05Zr (wt.%) alloy and Cu-0.5Y-0.1Zr (wt.%) alloy were composed of Cu, Zr, and Y elements. Figure 4 shows the elements’ distribution of the precipitated phase in the Cu-0.5Y-0.1Zr (wt.%) alloy, it can be seen that Y and Zr elements were relatively concentrated in the precipitated phase and their distribution in the precipitated phase was overlapped to a large extent.
XRD was used to further identify the types of the precipitated phases in the as-cast Cu-0.5Y-xZr (wt.%) alloys. The results of XRD are shown in Figure 5. As can be seen from Figure 5, both the alloys contained a Y-rich phase and a Zr-rich phase. The Y-rich phase of the alloys was the Cu5Y phase. With the addition of Zr, the Cu5Zr phase precipitated in both the alloys. In summary, there were two kinds of precipitation phases in the as-cast Cu-0.5Y-xZr (wt.%) alloys, namely the Cu5Y phase and Cu5Zr phase.
To further observe the microscopic morphology of a precipitated phase, the as-cast Cu-0.5Y-0.1Zr (wt.%) alloy was examined via TEM. Figure 6a,c is the TEM image of the Cu-0.5Y-0.1Zr (wt.%) alloy. It can be observed that many small-sized blocky phases were distributed at the edge of grain boundaries and inside the grain boundaries. The elongated precipitated phases at the grain boundaries in the SEM images were formed by the aggregation of the small-sized phases (Figure 2). The sizes of the phases differed greatly, ranging from about 10 nm to about 70 nm. It can also be found from Figure 6a that the small-sized phases were distributed densely at the grain boundaries but sparsely inside the boundaries. The EDS results of the blocky phases at the grain boundaries and inside the grain boundaries showed that all the small-sized phases were composed of Cu, Zr, and Y elements (Figure 6b,d). Combining the results of XRD, the precipitated phase in the as-cast Cu-0.5Y-0.1Zr (wt.%) alloys was actually the Cu5Y/Cu5Zr phase (Figure 5). However, the precipitated phase in the as-cast Cu-1Y (wt.%) alloy is the Cu6Y phase [4]. It can be concluded that the addition of Zr formed the Cu5Zr phase and influenced the precipitation of Y-rich phases.
In previous research, Nagorka et al. indicated that the Cu5Y phase is a metastable phase in the process when Cu7Y/Cu6Y phases extend to the Y-rich region in Cu-Y alloys, which is hard to form [17]. Zhuo et al. studied the phase transition process of Cu-Y alloys during the annealing treatment and found that the heterogeneous nucleus can facilitate the formation of the Cu5Y phase [18]. Peng et al. studied the formation process of the Cu5Zr phase, drawing a conclusion that the Cu5Zr phase was formed by the accumulation of Zr atomic layers, i.e., the Cu5Zr phase precipitated in the nucleation of Zr-rich atomic clusters [15]. In the research on Cu-Cr-Zr alloys containing Y and La, Pan et al. found Cu, Zr, Y, and La in the precipitated phase at the grain boundaries of the alloy. Through analysis and calculation, he concluded that the Y-rich phase and La-rich phase were doped with the Cu5Zr phase at the grain boundaries [5]. To sum up, the Zr-rich phase is easy to become a nucleation core during phase precipitation. Therefore, in the present study, the Cu5Zr phase precipitated first during the solidification of the as-cast Cu-0.5Y-0.1Zr (wt.%) alloy and acted as a heterogeneous nucleus, which facilitated the formation of the Cu5Y phase, and finally formed the Cu5Y/Cu5Zr phase.
Figure 7 shows the engineering stress-engineering strain cures of the as-cast Cu-0.5Y-xZr (wt.%) alloys. Table 2 shows the ultimate tensile strength (UTS) and elongation of the as-cast Cu-0.5Y-xZr (wt.%) alloys. The results showed that the tensile strength increased from 145 to 200 MPa and the elongation decreased from 41.3% to 17.0% after adding 0.5 wt.% Y and 0.05 wt.% Zr to as-cast pure copper [19]. When the Zr content increased to 0.1 wt.%, the UTS and elongation of the as-cast Cu-0.5Y-xZr (wt.%) alloys increased to 225 MPa and 22.5%, respectively.
As shown in Table 2, with the Zr content increased, the UTS of the as-cast Cu-0.5Y-xZr alloys increased. In the as-cast Cu-Y-Zr alloys, Hall-Petch strengthening, solid solution strengthening, and precipitation strengthening all contribute to the total strength [20,21,22]. Since the solid solubility of Y and Zr in Cu is very low, the solid solution strengthening degrees of the as-cast Cu-0.5Y-xZr (wt.%) alloys were similar. Consequently, the main factors that led to the differences in strength of the as-cast Cu-0.5Y-xZr (wt.%) alloys were Hall-Petch strengthening and precipitation strengthening. The grains were refined by adding Zr, and the quantity of the Cu5Y/Cu5Zr phases increased (Figure 1 and Figure 2). Hence, the UTS of the as-cast Cu-0.5Y-0.1Zr (wt.%) alloy was higher than that of the as-cast Cu-0.5Y-0.05Zr (wt.%) alloy.
With the Zr content increased, the elongation of the as-cast Cu-0.5Y-xZr (wt.%) alloys increased. The elongation of the as-cast Cu-Y-Zr alloys depends on the average grain size, solid solubility of Y and Zr, and the precipitates in the alloys [20,21,22]. The as-cast Cu-0.5Y-xZr (wt.%) alloys underwent similar degrees of solid solution strengthening, therefore the average grain size and the precipitates dominated the ductility of the alloys. Although more Cu5Y/Cu5Zr phases will cause deterioration of the ductility, the elongation of the as-cast Cu-0.5Y-0.1Zr (wt.%) alloy was still higher than that of the as-cast Cu-0.5Y-0.05Zr (wt.%) alloy, which resulted from the finer grains of the as-cast Cu-0.5Y-0.1Zr (wt.%) alloy. The existence of fine grains improved the compatible deformation capability of the Cu–Y–Zr alloys, and thus increased the ductility [23]. This indicates that the beneficial effect of the grain refinement was more obvious than the negative effect of the Cu5Y/Cu5Zr phases on the ductility.

4. Conclusions

(1)
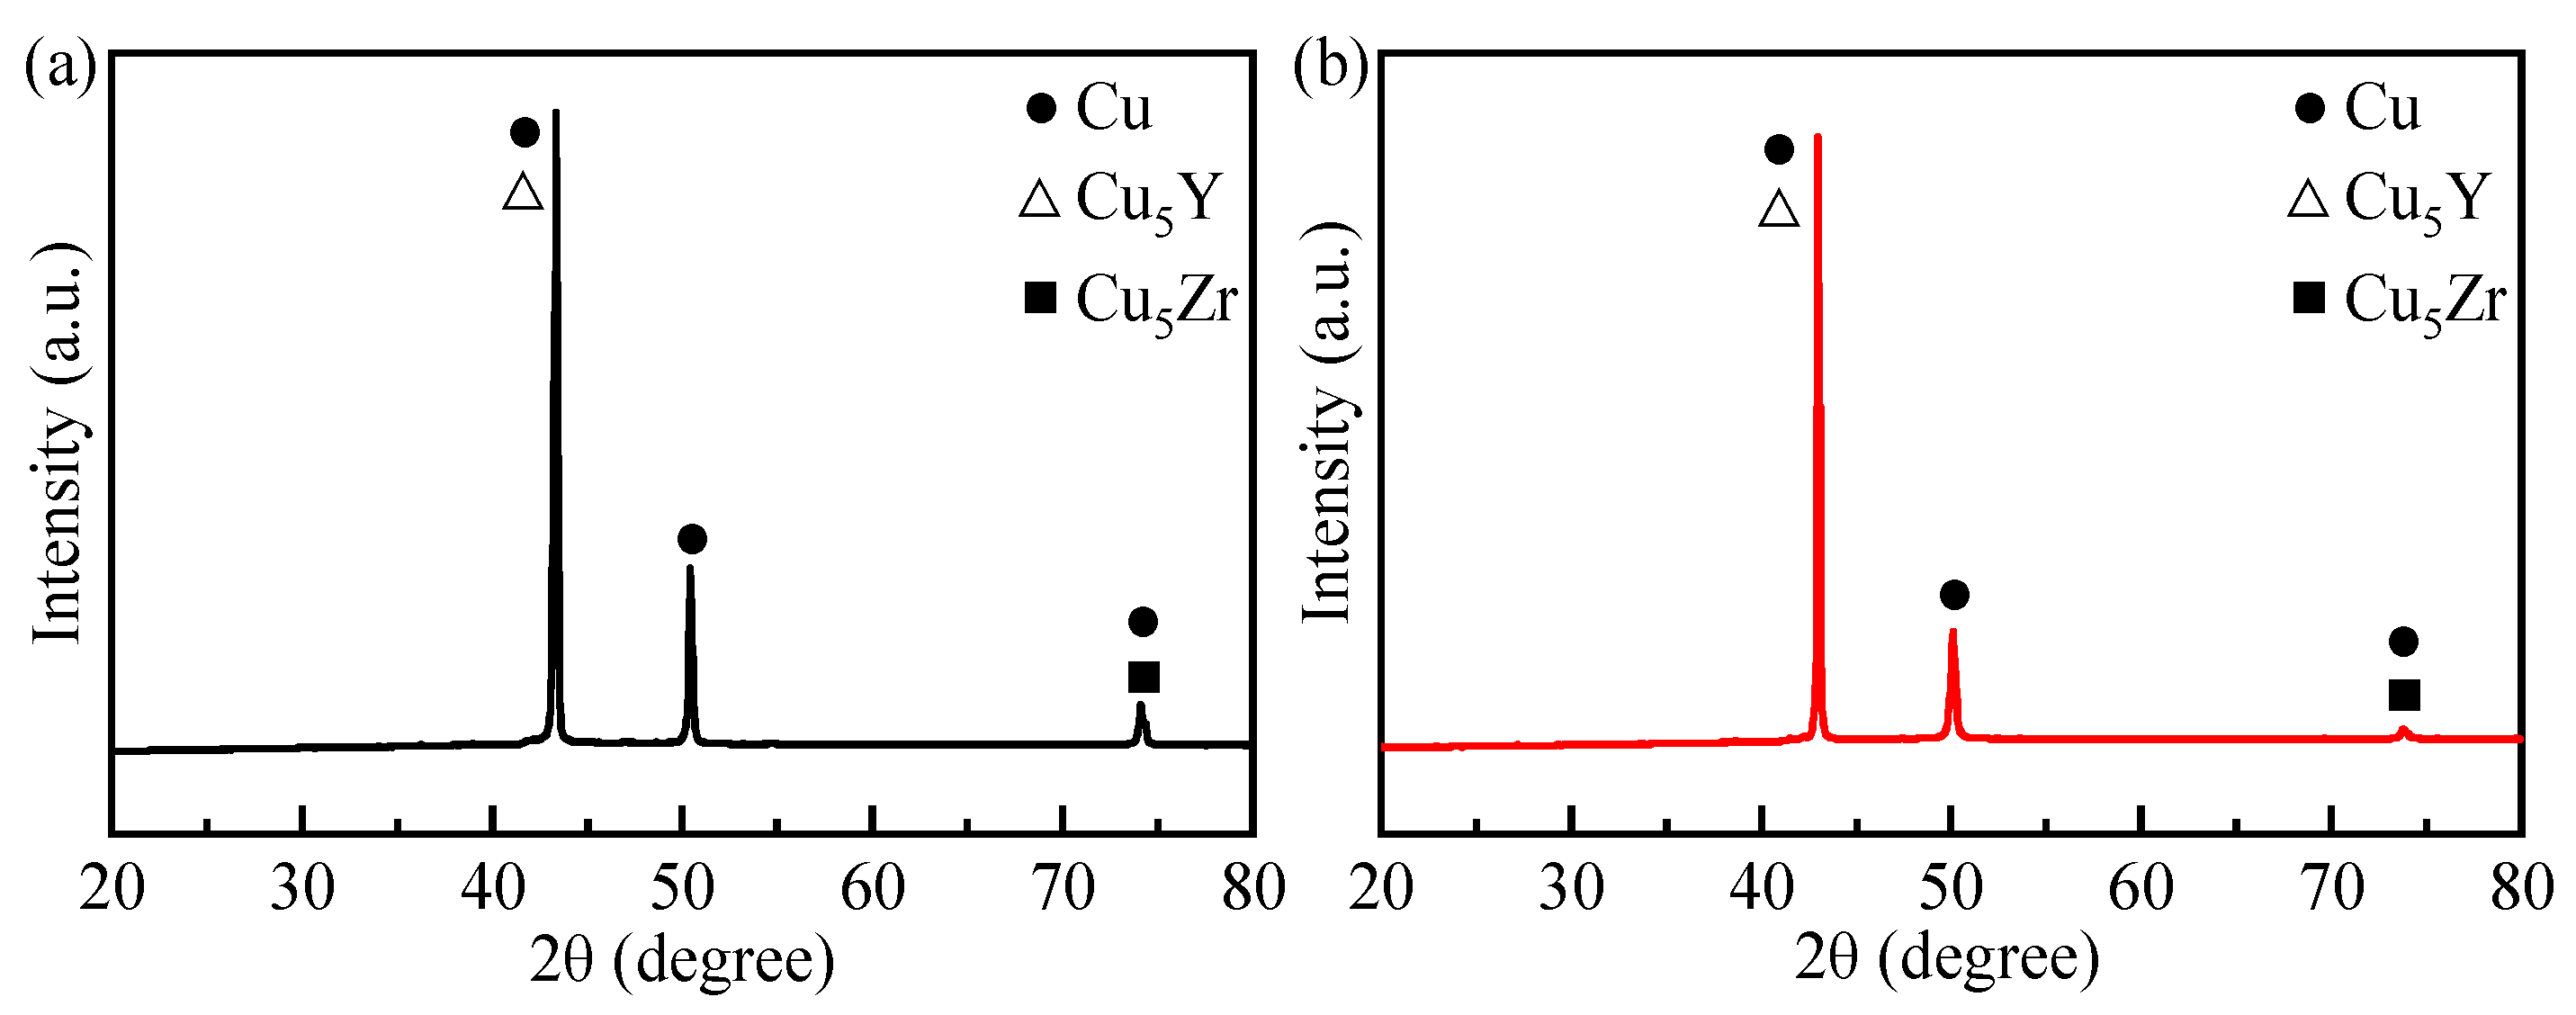
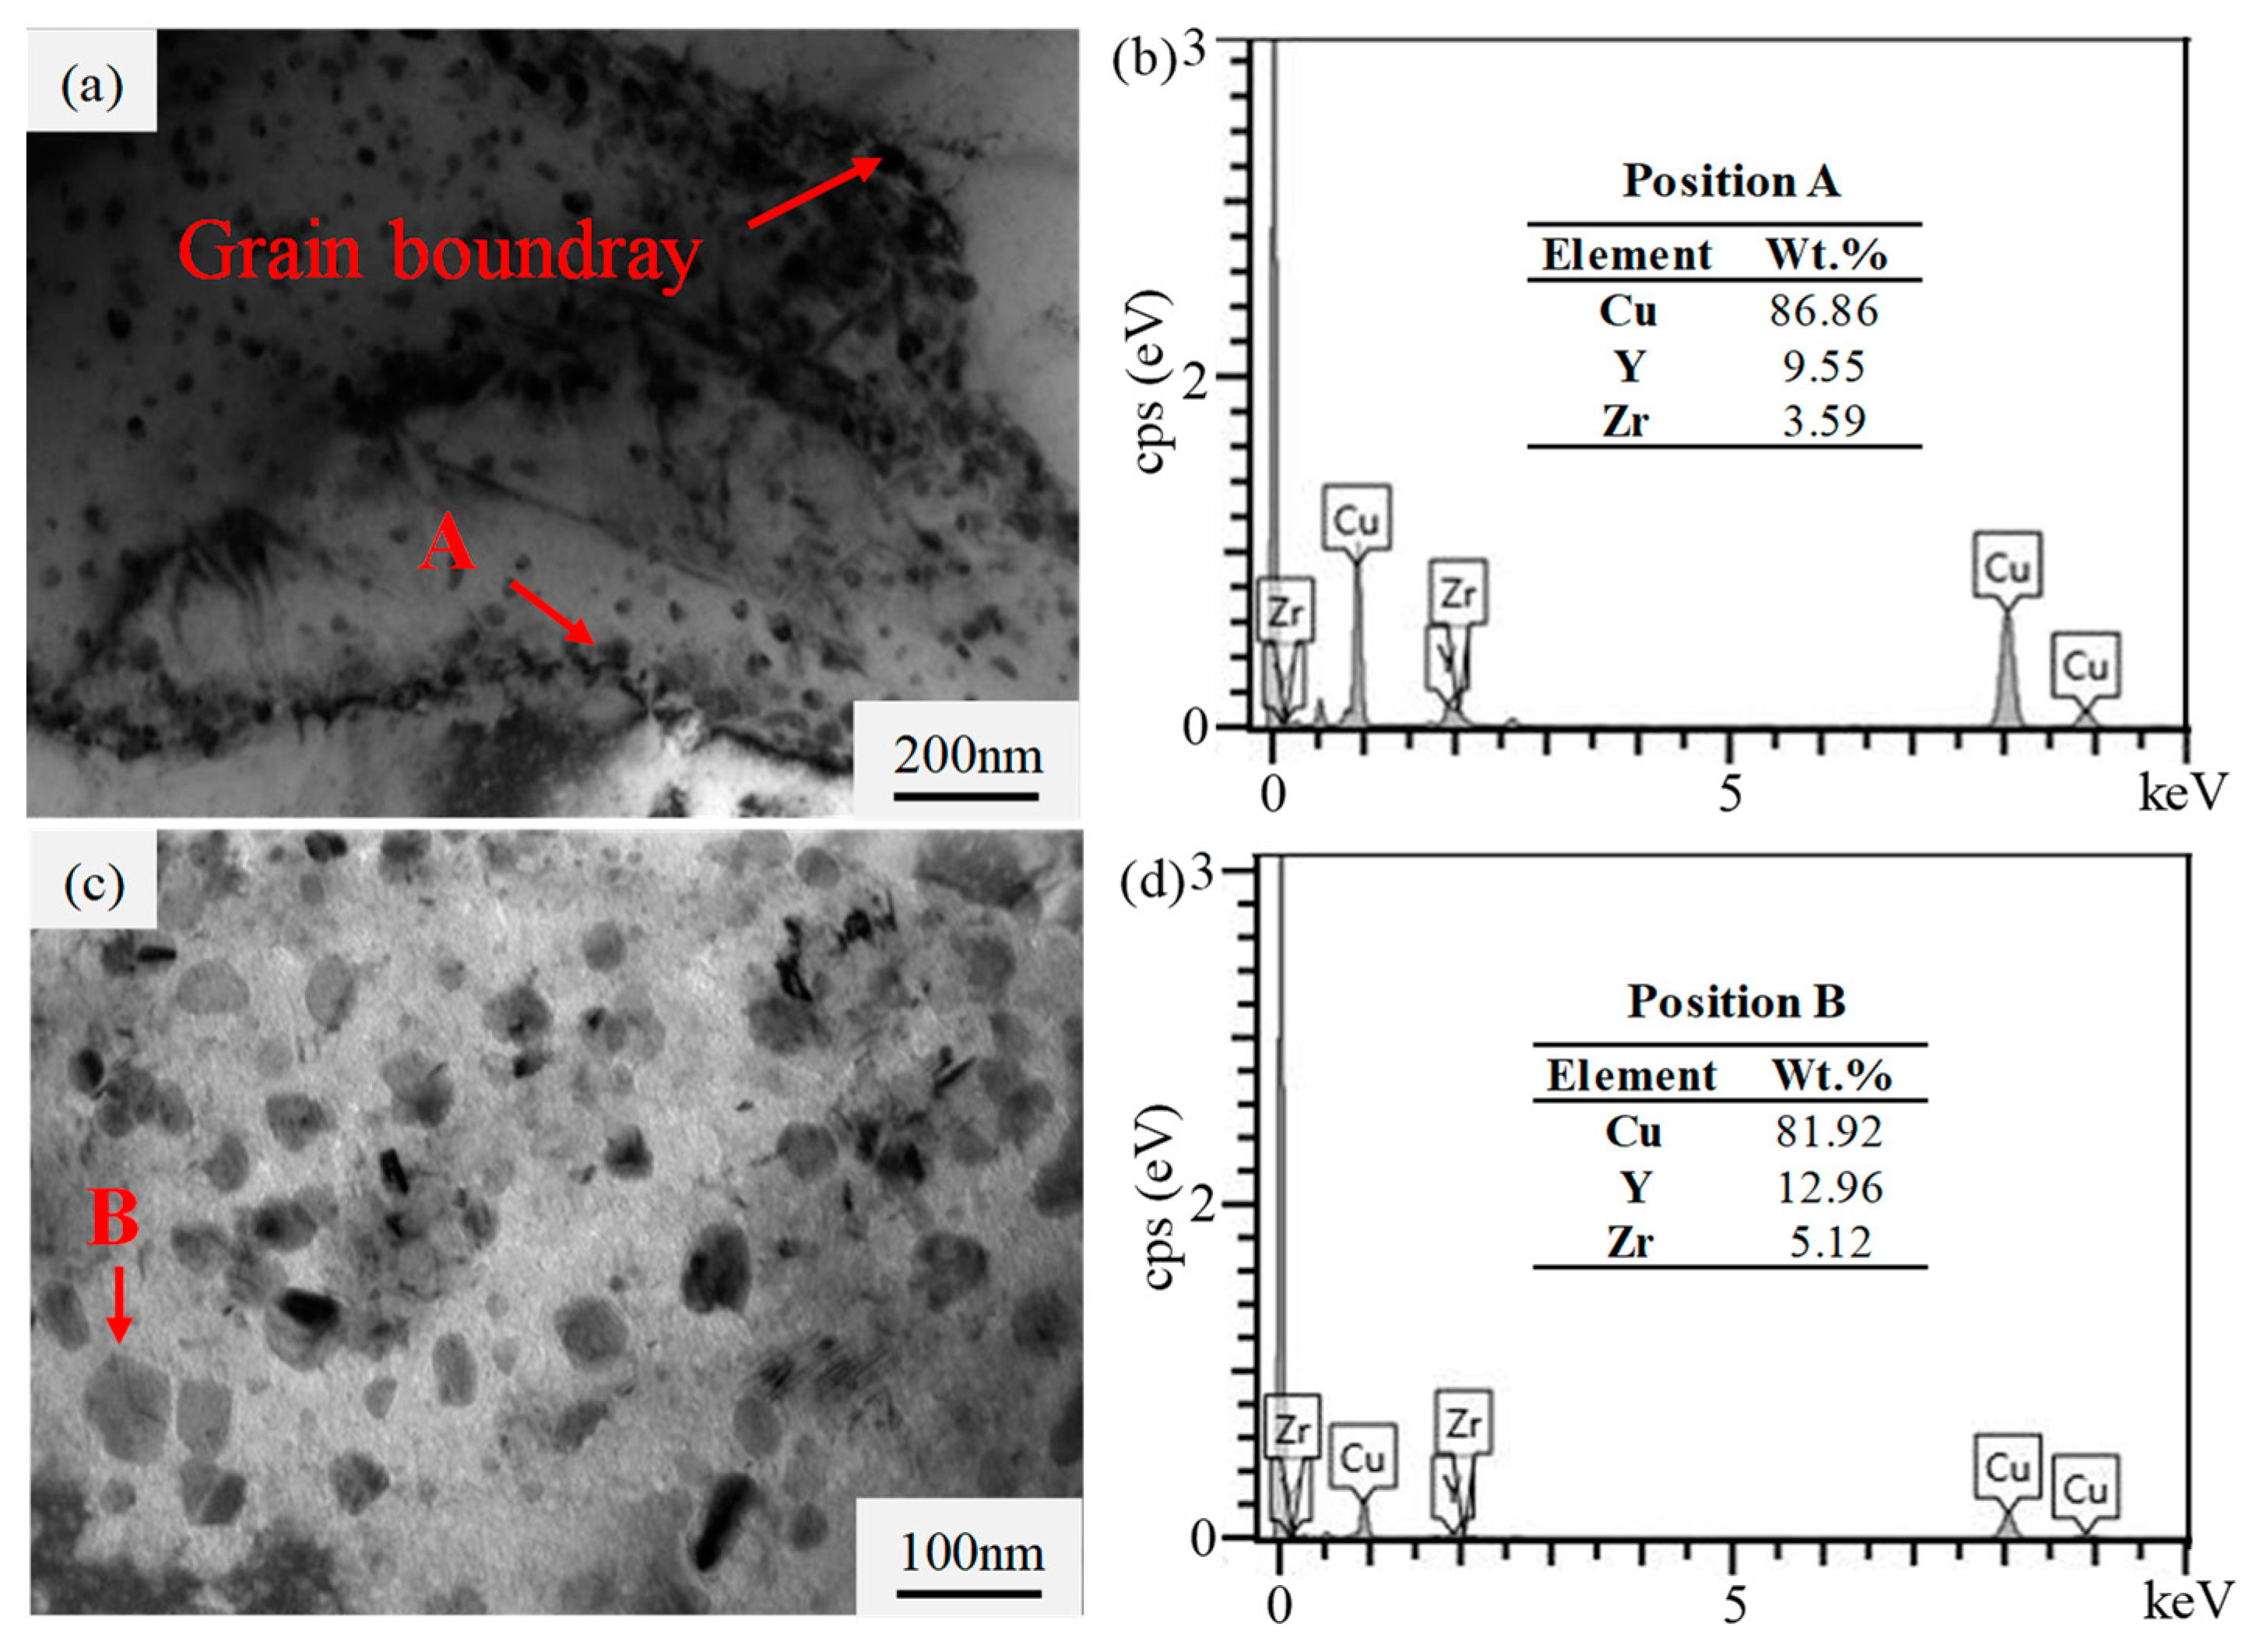
In the as-cast Cu-0.5Y-0.1Zr (wt.%) alloy, the precipitated phases were the Cu5Y/Cu5Zr phase. The precipitated phases ranged from 10 to 70 nm in size, mainly distributed at the grain boundaries;
(2)
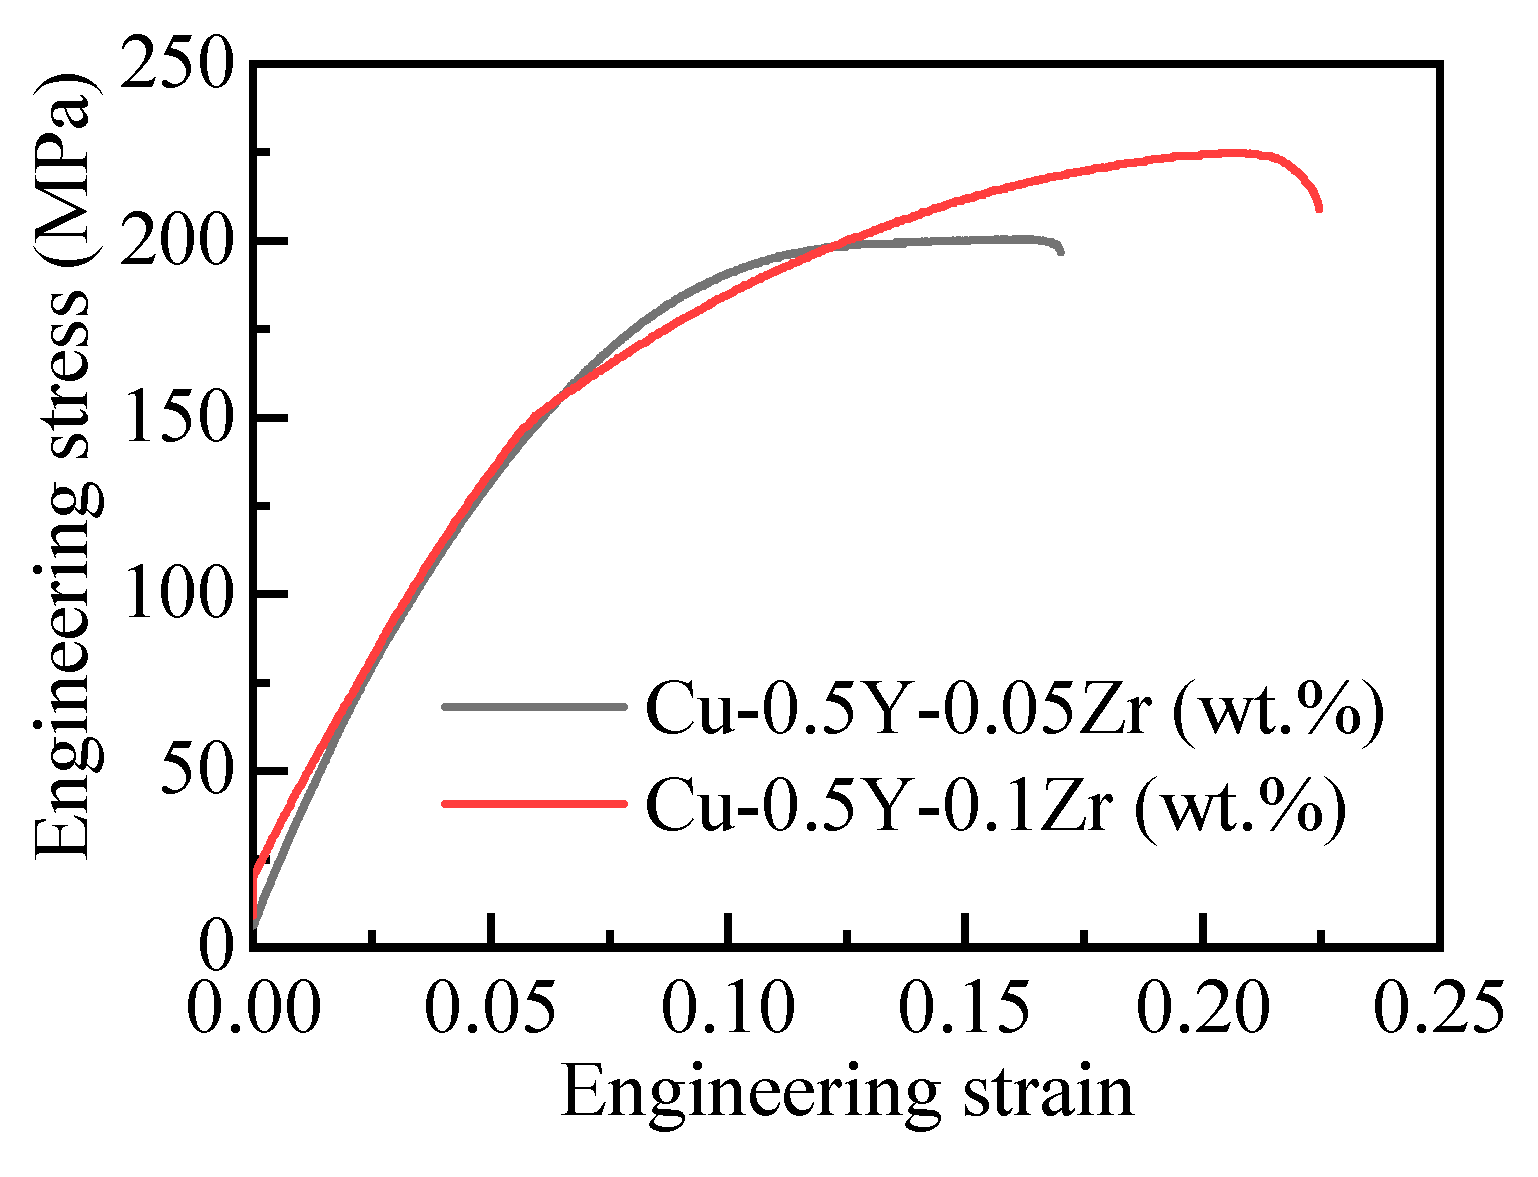
Both the tensile strength and elongation of the as-cast Cu-0.5Y-xZr (wt.%) alloys increased when Zr content increased from 0.05 to 0.1 wt.%;
(3)
Due to Hall–Petch strengthening and precipitation strengthening of the Cu5Y/Cu5Zr phases, the addition of Y and Zr can significantly improve the mechanical properties of as-cast pure copper. The UTS and elongation of the as-cast Cu-0.5Y-0.1Zr (wt.%) alloys were 225 MPa and 22.5%, respectively.

Author Contributions

Conceptualization, D.L. and Y.W.; formal analysis, D.L.; investigation, N.W., Z.L. and Y.F.; data curation, D.L. and Y.W.; writing—original draft preparation, D.L. and N.W.; writing—review and editing, Y.W.

Funding

This research was funded by Shenyang Science and Technology Bureau (grant number RC170456), Department of Science and Technology of Liaoning Province (grant number XLYC1802128), and National Natural Science Foundation of China (grant number 51871184).

Acknowledgments

The authors are grateful to Yu Wang, Bowei Yang and Keliang Wang for their help in the experimental process.

Conflicts of Interest

The authors declare no conflict of interest.

References

  1. Borodianskiy, K. Effect of carbon nanotubes’ addition on mechanical properties and thermal conductivity of copper. J. Mater. Sci. 2019, 54, 13767–13774. [Google Scholar] [CrossRef]
  2. Davis, J.R. Copper and Copper Alloys, 1st ed.; ASM International: Cleveland, OH, USA, 2001; pp. 3–8. [Google Scholar]
  3. Xie, M.; Liu, J.; Lu, X.; Den, Z.; Jang, H.; Lu, F. Study of rapidly solidified Cu-Cr-RE alloys. Sci. Technol. Adv. Mater. 2001, 2, 79–82. [Google Scholar] [CrossRef]
  4. Lu, H. Effect of yttrium on the microstructure and mechanical properties of copper and Cu-Si Alloys. Chin. Rare Earths 1996, 17, 12–15. [Google Scholar]
  5. Pan, Z.Y.; Chen, J.B.; Li, J.F. Microstructure and properties of rare earth-containing Cu-Cr-Zr alloy. Trans. Nonferrous Met. Soc. China 2015, 25, 1206–1214. [Google Scholar] [CrossRef]
  6. Xie, M.; Liu, J.L.; Lu, X.Y.; Shi, A.; Den, Z.M.; Jang, H.; Zheng, F.Q. Investigation on the Cu-Cr-RE alloys by rapid solidification. Mater. Sci. Eng. A 2001, 304–306, 529–533. [Google Scholar] [CrossRef]
  7. Yin, J.Y.; Zhang, M.; Chen, X.F. Effect of Y on the hardness and electrical conductivity of Cu-Cr alloy. Heat Treat. Met. 2004, 4, 32–35. [Google Scholar]
  8. Carro, G.; Muñoz, A.; Monge, M.A.; Savoini, B.; Galatanu, A.; Galatanu, M.; Pareja, R. Thermal conductivity and diffusivity of Cu-Y alloys produced by different powder metallurgy routes. Fusion Eng. Des. 2017, 124, 1156–1160. [Google Scholar] [CrossRef]
  9. Okamoto, H. Cu-Zr (copper-zirconium). J. Phase Equilib. Diffus. 2008, 29, 204. [Google Scholar] [CrossRef]
  10. Dong, Z.L.; Tang, X.Y.; Hori, S. Aging precipitation of Cu-Zr and Cu-Zr-Si alloys and affected by cold working. Acta Metall. Sin. 1989, 25, 78–81. [Google Scholar]
  11. Wang, Q.J.; Liu, D.; Tong, L.B.; Zhou, Y.; Wang, W.; Zhou, H.X.; Fan, R.X. Enhanced stress corrosion cracking resistance of ultrafine-grained Cu-Cr-Zr Alloy Fabricated via equal-channel angular pressing. Metals 2019, 9, 824. [Google Scholar] [CrossRef]
  12. Chen, X.H.; Liu, P.; Tian, B.H.; Zhang, Y.; Jia, S.G.; Ren, F.Z.; Jing, X.T. Thermal stability of Cr filaments in Cu-Cr in situ composites. Trans. Nonferrous Met. Soc. China 2009, 19, 328–333. [Google Scholar]
  13. Watanabe, C.; Monzen, R.; Tazaki, K. Mechanical properties of Cu-Cr system alloys with and without Zr and Ag. J. Mater. Sci. 2008, 43, 813–819. [Google Scholar] [CrossRef]
  14. Ye, Y.X.; Yang, X.Y.; Wang, J.; Zhang, X.K.; Zhang, Z.L.; Sakai, T. Enhanced strength and electrical conductivity of Cu-Zr-B alloy by double deformation-aging process. J. Alloy. Compd. 2014, 615, 249–254. [Google Scholar] [CrossRef]
  15. Peng, L.J.; Xie, H.F.; Huang, G.J.; Li, Y.F.; Yin, X.Q.; Feng, X.; Mi, X.J.; Yang, Z. The phase transformation and its effects on properties of a Cu-0.12wt% Zr alloy. Mater. Sci. Eng. A 2015, 633, 28–34. [Google Scholar] [CrossRef]
  16. Huang, F.X.; Ma, J.S.; Ning, H.L.; Geng, Z.T.; Lu, C.; Guo, S.M.; Yu, X.T.; Wang, T.; Li, H.; Lou, H.F. Analysis of phases in a Cu-Cr-Zr alloy. Scr. Mater. 2003, 48, 97–102. [Google Scholar]
  17. Nagorka, M.S.; Levi, C.G.; Lucas, G.E.; Ridder, S.D. The potential of rapid solidification in oxide-dispersion-strengthened copper alloy development. Mater. Sci. Eng. A 1991, 142, 277–289. [Google Scholar] [CrossRef]
  18. Zhuo, H.O.; Ye, N.; Liu, W.S.; Tang, J.C.; Zhang, J.X. The effect of Y on the microstructure and properties of Cu alloys. Chin. Rare Earths 2018, 39, 40–47. [Google Scholar]
  19. Chen, Y.; Cheng, M.; Song, H.W.; Zhang, S.H.; Liu, J.S.; Zhu, Y. Effects of lanthanum addition on microstructure and mechanical properties of as-cast pure copper. J. Rare Earths 2014, 32, 1056–1063. [Google Scholar] [CrossRef]
  20. Hansen, N. Hall–Petch relation and boundary strengthening. Scr. Mater. 2004, 51, 801–806. [Google Scholar] [CrossRef]
  21. Correia, J.; Davies, H.; Sellars, C. Strengthening in rapidly solidified age hardened Cu-Cr and Cu-Cr-Zr alloys. Acta Mater. 1997, 45, 177–190. [Google Scholar] [CrossRef]
  22. Liu, J.B.; Zhang, L.; Dong, A.P.; Wang, L.T.; Zeng, Y.W.; Meng, L. Effects of Cr and Zr additions on the microstructure and properties of Cu-6 wt.% Ag alloys. Mater. Sci. Eng. A 2012, 532, 331–338. [Google Scholar] [CrossRef]
  23. Xu, C.Z.; Wang, Q.J.; Zheng, M.S.; Zhu, J.W.; Li, J.D.; Huang, M.Q.; Jia, Q.M.; Du, Z.Z. Microstructure and properties of ultra-fine grain Cu-Cr alloy prepared by equal-channel angular pressing. Mater. Sci. Eng. A 2007, 459, 303–308. [Google Scholar] [CrossRef]
Figure 1. Optical images of the as-cast Cu-0.5Y-xZr (wt.%) alloys: (a) Cu-0.5Y-0.05Zr (wt.%) alloy; (b) Cu-0.5Y-0.1Zr (wt.%) alloy.
Metals 09 01084 g001
Figure 2. Scanning electron microscopy (SEM) images of the as-cast Cu-0.5Y-xZr (wt.%) alloys: (a) Cu-0.5Y-0.05Zr (wt.%) alloy; (b) Cu-0.5Y-0.1Zr (wt.%) alloy.
Metals 09 01084 g002
Figure 3. SEM images of the precipitated phases in the as-cast Cu-0.5Y-xZr (wt.%) alloys and energy dispersive X-ray spectroscopy (EDS) results of the positions indicated by arrows: (a) Cu-0.5Y-0.05Zr (wt.%) alloy; (b) EDS results obtained for position A; (c) Cu-0.5Y-0.1Zr (wt.%) alloy; (d) EDS results obtained for position B.
Metals 09 01084 g003
Figure 4. Elements’ distribution of the precipitated phase in Cu-0.5Y-0.1Zr (wt.%) alloy: (a) SEM image of the precipitated phase; (b) distribution of Cu; (c) distribution of Y; (d) distribution of Zr.
Metals 09 01084 g004
Figure 5. X-ray diffraction (XRD) pattern of the as-cast Cu-0.5Y-xZr (wt.%) alloys: (a) Cu-0.5Y-0.05Zr (wt.%) alloy; (b) Cu-0.5Y-0.1Zr (wt.%) alloy.
Metals 09 01084 g005
Figure 6. Transmission electron microscopy (TEM) images of the as-cast Cu-0.5Y-0.1Zr (wt.%) alloy and EDS analysis of the precipitated phases: (a) TEM image of the phases located at the grain boundaries; (b) EDS analysis of point A; (c) TEM image of the phases inside the grain boundaries; (d) EDS analysis of point B.
Metals 09 01084 g006
Figure 7. Engineering stress-engineering strain cures of the as-cast Cu-0.5Y-xZr (wt.%) alloys.
Metals 09 01084 g007
Table 1. Experimentally measured chemical compositions of the as-cast Cu-0.5Y-xZr (wt.%) alloys.
AlloysY (wt.%)Zr (wt.%)Cu (wt.%)
Cu-0.5Y-0.05Zr0.4800.048Balanced
Cu-0.5Y-0.1Zr0.5110.099Balanced
Table 2. Mechanical properties of as-cast copper and the as-cast Cu-0.5Y-xZr (wt.%) alloys.
AlloyUltimate Tensile Strength (MPa)Elongation (%)Reference
Cu145 ± 841.3 ± 5.0[19]
Cu-0.5Y-0.05Zr200 ± 1017.0 ± 0.9Present study
Cu-0.5Y-0.1Zr225 ± 1122.5 ± 1.1Present study

