Article

Effect of Stress Triaxiality on Plastic Damage Evolution and Failure Mode for 316L Notched Specimen

1
School of Mechanical Engineering, Changzhou University, Changzhou 213164, China
2
Jiangsu Key Laboratory of Green Process Equipment, Changzhou University, Changzhou 213164, China
3
School of Mechanical Engineering, Jiangsu University of Technology, Changzhou 213001, China
*
Author to whom correspondence should be addressed.
Metals 2019, 9(10), 1067; https://doi.org/10.3390/met9101067
Submission received: 4 September 2019 / Revised: 22 September 2019 / Accepted: 27 September 2019 / Published: 30 September 2019

Abstract

:
To reveal the effect of stress triaxiality on plastic damage evolution and failure mode, 316L notched specimens with different notch sizes are systematically investigated by digital image correlation (DIC) observation, plastic damage analysis by finite element simulation, and void mesoscopic observation. It was found that the plastic damage evolution and failure mode are closely related with notch radius and stress triaxiality. The greater the stress triaxiality at the root is, the greater the damage value at the root is and the earlier the fracture occurs. Moreover, void distribution by mesoscopic observation agrees well with damage distribution observed by finite element simulation with the Gurson-Tvergaard-Needleman (GTN) damage model. It is worth noting that, with the increase in stress triaxiality, the failure mode of notched specimen changes from ductility fracture with void coalescence at the center position to crack initiation at the notch root, from both mesoscopic observation and damage simulation.

Graphical Abstract

1. Introduction

The stress constraint caused by initial defect, dimensional unevenness, welding process, etc. influences the damage process of mechanical structure. Stress triaxiality is a quantitative parameter to evaluate the stress constraint, which is an important factor to the plastic damage evolution and failure mode [1,2]. Kato et al. [3] applied three kinds of miniature tensile specimen shapes to the investigation of plastic deformability, and found that the ductility and the plastic strain at the fracture position decreased with stress triaxiality increasing. As discussed by Ma et al. [4], stress triaxiality and the Lode parameter greatly affected the development of void volume fraction. Wen et al. [5] found that the failure strain was closely related with stress triaxiality, and the effect of Lode parameter was significant at low stress triaxiality. Chandan et al. [6] discussed the effects of notch types containing V-notch and U-notch and notch size on strength and fracture toughness, and found that the effect of plastic constraint caused by the notch depth on strength and fracture toughness was greater than notch type and notch angle. Erice et al. [7] took different specimen types of punch, notch, central hole and smiling face type into account, and the results of notched tension confirmed that the ductility increased with the loading velocity increasing. Keshavarz et al. [8] extracted the correlation for the failure strain of the pipeline material as a function of triaxiality and Lode angle. Yu et al. [9] found that the constitutive equation is insensitive to the change of stress triaxiality for the pressure-insensitive metal under axisymmetric tensile loading. For anisotropic sheet metal under various stress states, Zhang et al. [10] found that the failure strain was correlated with stress state and rolling direction and a novel damage model was proposed to predict the fracture behavior. Besides plasticity damage, the effect of notch on creep was also focused by researchers. Moreover, the multi-axial creep ductility is related with the multi-axial stress state [11]. With the increase of notch radius, the creep fracture life decreases [12], and the position of the maximum creep damage changes from the notch root to the center [13].
From mesoscopic mechanics, the ductile damage process of metal can be described by porous plasticity model containing void nucleation, void growth and void coalescence [14,15]. Besson et al. [16,17] investigated the effect of specimen size and geometry on ductile fracture of cast duplex stainless steels based on the Gurson model [18] and continuum damage mechanics. Rice et al. [19] paid attention to the enlargement of microscopic voids in triaxial stress fields by the continuum plasticity. Chen et al. [20] discussed the effects of void size on the void evolution. Among continuum models of ductile fracture as reviewed by Besson [21], the Gurson-Tvergaard-Needleman (GTN) damage model modified and refined by Tvergaard and Needleman [22,23,24] has an idea predictive ability for fracture position and fracture parameters. Ten et al. [25] studied different uniaxial tension tests with different specimen types by damage models, and found that the GTN fracture criterion could give a reliable prediction under high stress triaxiality. Giang et al. [26] found that the GTN model was suitable for the studies about ductile brittle transition. The shear modified GTN damage model proposed by Sun et al. [27] predicted the edge notch behavior of multi-pass cold rolling steel well, and the crack length decreased as notch width increased. The GTN model was also applied to estimate mechanical properties and plastic damage evolution in small punch test [28].
It is important to observe void growth and void coalescence to capture the ductile fracture in metal materials [29,30]. Gerstein et al. [31] studied the creation and development of voids in dual-phase steel at micro-scale and nano-scale. As discussed by Wen et al. [32], cavity growth rate increased with the increase in stress triaxiality. Void coalescence will cause the ductile failure, and plastic deformation localizes at the inter-void ligament between adjacent voids [33,34]. Saeidi et al. [35] found that plastic deformation was concentrated within the notched region, and voids linkage mechanism changed from void coalescence in the uniform specimen to void sheeting in the notched specimen.
Austenitic stainless steel is widely used in petrochemical piping, heat exchanger and nuclear generator with different structures under different load conditions [36]. It is necessary to understand the plastic damage evolution under complex stress states for austenitic stainless steel. In this work, the plastic damage evolution of notched specimen was studied by experimental methods of digital image correlation (DIC) observation, mesoscopic observation, and finite element simulation (FES) with GTN damage model. The purpose of this paper is to reveal the effect of stress triaxiality on the plastic damage evolution and failure mode of notched specimen for 316L austenitic stainless steel.

2. Experiments and FES

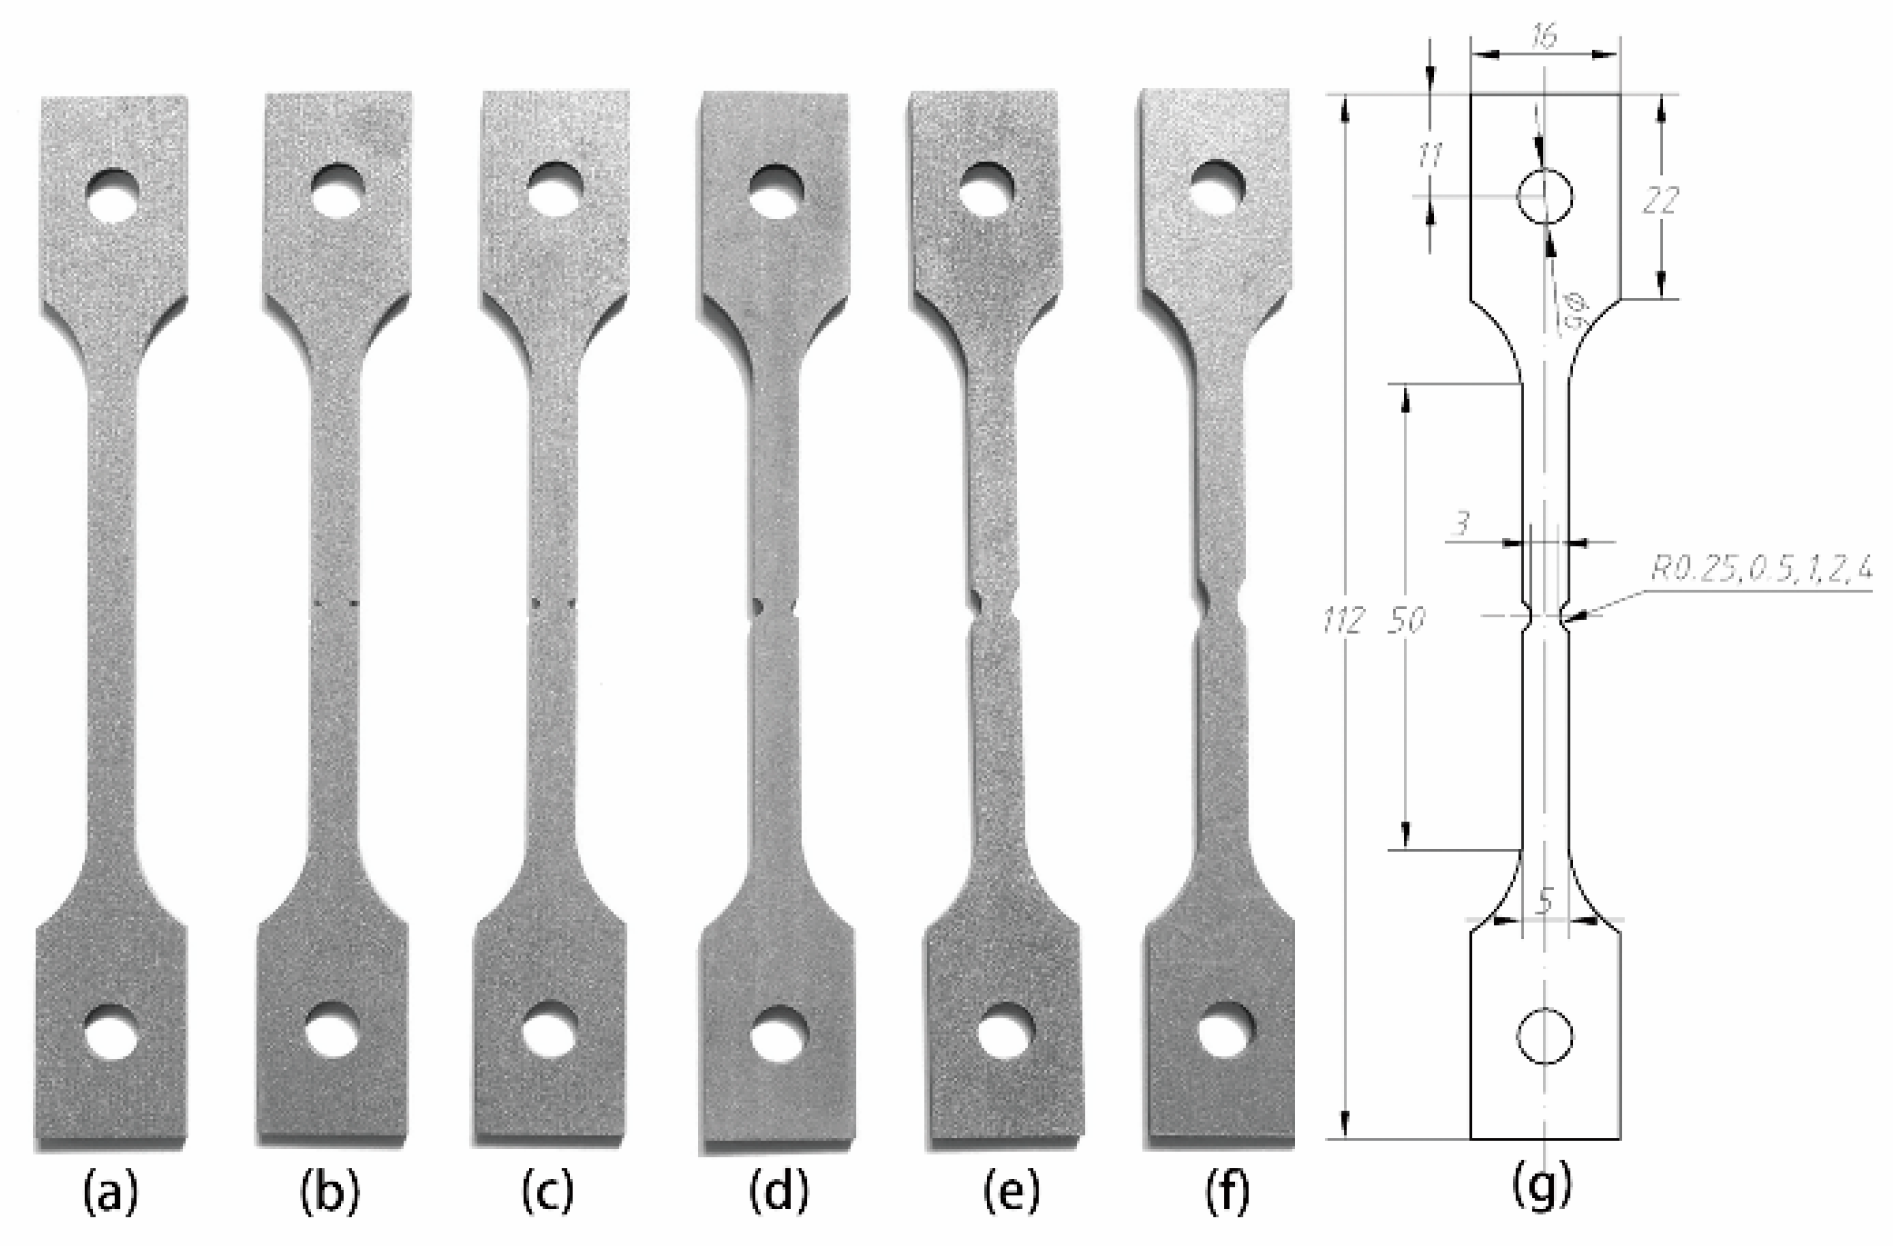
2.1. Tensile Test and DIC Observation

316L hot-rolled austenitic stainless steel was employed, and the un-notched specimen is given in Figure 1a. In order to study the influence of stress triaxiality generated by notch on the plastic damage evolution, specimens with different notch sizes illustrated in Figure 1b–f were carried out. The net sections of notched specimens are consistent with the area of 4.5 mm2 given in Figure 1g, while their notched radius ranging from 0.25 mm to 4 mm. Tensile tests were carried out on CTM504-B1 universal testing machine with the strain rate of 5 × 10 4   s 1 at room temperature.
The load was acquired by the load sensor, while the strain was acquired by DIC observation. DIC observation is with the advantage to measure the strain field of notched specimens [37], and the effect of notch radius on the strain field distribution and evolution during the tensile process can be directly observed by DIC. The principle of DIC is to measure a specific displacement field by finding the correspondence of numerous grid points between different images using the surface texture. Two serious of droplets were sprayed and resulted in a speckle pattern illustrated in Figure 2a with a high color contrast. Figure 2b shows the mesh to calculate the strain field and Figure 2c shows the strain field contour plot.

2.2. FES of Plastic Damage Evolution

Although the strain field can be directly observed by DIC, it is difficult to observe the plastic damage evolution during tensile tests of notched specimens. Therefore, the FES of the plastic damage process is needed to quantitatively reveal the influence of stress triaxiality on the plastic damage evolution for notched specimens. The damage model describing the influence of damage caused by voids on the plastic deformation behavior was first proposed by Gurson [18]. The damage process in porous ductile material involves void nucleation, growth and coalescence, which is well considered in the GTN damage model modified and refined by Tvergaard and Needleman [22,23,24]. Based on the Gurson model, q 1 , q 2 and q 3 are the calibration parameters introduced to consider the void interaction effect, and classically, q 3 = q 1 2 . It is expressed as follows [23]:
Φ ( σ eq , σ h , σ y , f * ) = σ eq σ y 2 + 2 q 1 f * cosh q 2 σ k k 2 σ y 1 + q 3 f * 2 = 0
f * = f 0 f f c f c + 1 / q 1 f c f F f c f f c f c < f < f F 1 / q 1 f F f
where σ eq denotes the macroscopic Mises equivalent stress, σ y is the equivalent tensile flow stress of the matrix material, σ k k / 3 is the macroscopic mean stress [24]. The effective void volume fraction f * was proposed to account for the onset of void coalescence, f is the volume fraction of voids in the material, f 0 is the initial void volume fraction, f c is the critical value at the onset of void coalescence and f F is the void volume fraction at failure.
The evolution equation of the void volume fraction rate f ˙ consists of the growth rate of existing voids f ˙ growth and the nucleation rate of new voids f ˙ nucleation :
f ˙ = f ˙ growth + f ˙ nucleation
f ˙ growth = 1 f ε ˙ k k p
f ˙ nucleation = A N ε ˙ p
A N = f N s N 2 π exp 1 2 ε p ε N s N 2
where ε ˙ p is the macro plastic strain rate, f N is the volume fraction of potential void nucleating particles, ε N donates the mean equivalent plastic strain for nucleation and s N is the corresponding standard deviation. The value of voids nucleated A N is only used if ε p exceeds its current maximum in the increment considered; otherwise, A N = 0. The effective plastic strain ε p represents the microscopic strain-state in the matrix material [24,38].
In order to simulate the damage process during tensile test, nine damage parameters ( q 1 , q 2 , q 3 , f 0 , f c , f F , ε N , s N , f N ) of the GTN model for 316L need to be determined. Furthermore, both void observation by optical microscope and inverse finite element analysis method with ABAQUS/EXPLICIT are used to determine these GTN parameters.
In the finite element model, it is assumed that the material is isotropic with elastic-plastic behavior and the specimens are meshed with continuum, three-dimensional solid, eight-node linear brick, reduced integration together with hourglass control (C3D8R) elements. Fixed constraint is applied on one side of specimen, and the loading displacement is applied on the other boundary, which is consistent with tensile test. Since mesh densities may affect the damage process [39], fine meshes with the edge length of 0.1 mm are applied at the central local zone of notched specimens, and the edge length of 1 mm is applied in other zones.
The calculation results are in agreement with experimental results when q 1 = 1.5, q 2 = 1 and q 3 = q 1 2 = 2.25 for most metal materials [22,24,40]. The true stress-true strain curve of 316L is observed by tensile test for specimen without notch as shown in Figure 3a, and f 0 , f c and f F are determined by the mesoscopic observation of void fraction after interrupting the uniaxial tensile test. The ultra-deep optical microscope Keyence VHX-700FC (Keyence Corporation, Osaka, Janpan) is used with the advantage of observing subtle contours and uneven surfaces. The calculation processes of f 0 , f c and f F are as follows:
(1)
With the high magnification factor of 5000, the voids can be observed by the ultra-deep optical microscope after fine polishing as shown in Figure 3b–d.
(2)
The voids can be extracted by color range limiting with image processing software, as shown in Figure 3e–g.
(3)
The pixel numbers of voids in Figure 3b–d and total image in Figure 3e–g can be determined, and the void fraction can be calculated by the pixel numbers shown in Figure 3h.
Based on the image method, the original void volume fraction f 0 , is counted as 0.0012. Critical void volume fraction f c is obtained under the maximum load, which is counted as 0.042. Total volume void fraction at failure f F is obtained near the fracture area of the specimen, which is counted as 0.092.
The damage process and fracture mechanism of materials are very complicated. It is difficult to establish the relationship between the nucleation of the secondary phase particles and the microscopic characteristics of the interface. Therefore, three void nucleation parameters ( ε N , s N and f N ) need to be determined by the inverse finite element analysis method. The three-factor-three-level including parameter boundary and level, is listed in Table 1 to determine the combinations of three parameters ( ε N , s N and f N ).
The comprehensive test of three parameters with three levels is 3 3 . The orthogonal test is used to reasonably arrange and analyze the multi-factor test, and the number of orthogonal experiments is only nine times. The mixed-level L 9 3 3 orthogonal table is designed in Table 2 according to orthogonal design method [44]. The mixed-level L 9 3 3 orthogonal table is designed in Table 2, and the tensile result of the notched specimen with notch radius of 0.5 mm is used to determine the GTN damage parameters. The error results are corresponding to different combination of parameters, and k ¯ i j = k i j 3 is the average error for factor j and level i ( i , j = 1, 2, 3). For certain factor j , min ( k ¯ 1 j , k ¯ 2 j and k ¯ 3 j ) is the best level. The best design is ε N 3 s N 3 f N 1 , i.e., ε N = 0.3, s N = 0.12, f N = 0.004.
Based on the mesoscopic observation of void fraction by optical microscopy and the inverse finite element analysis method with orthogonal test, the parameters of the GTN damage model for 316L are specified in Table 3, and the plastic damage evolution of 316L can be quantitatively characterized by FES with GTN model.

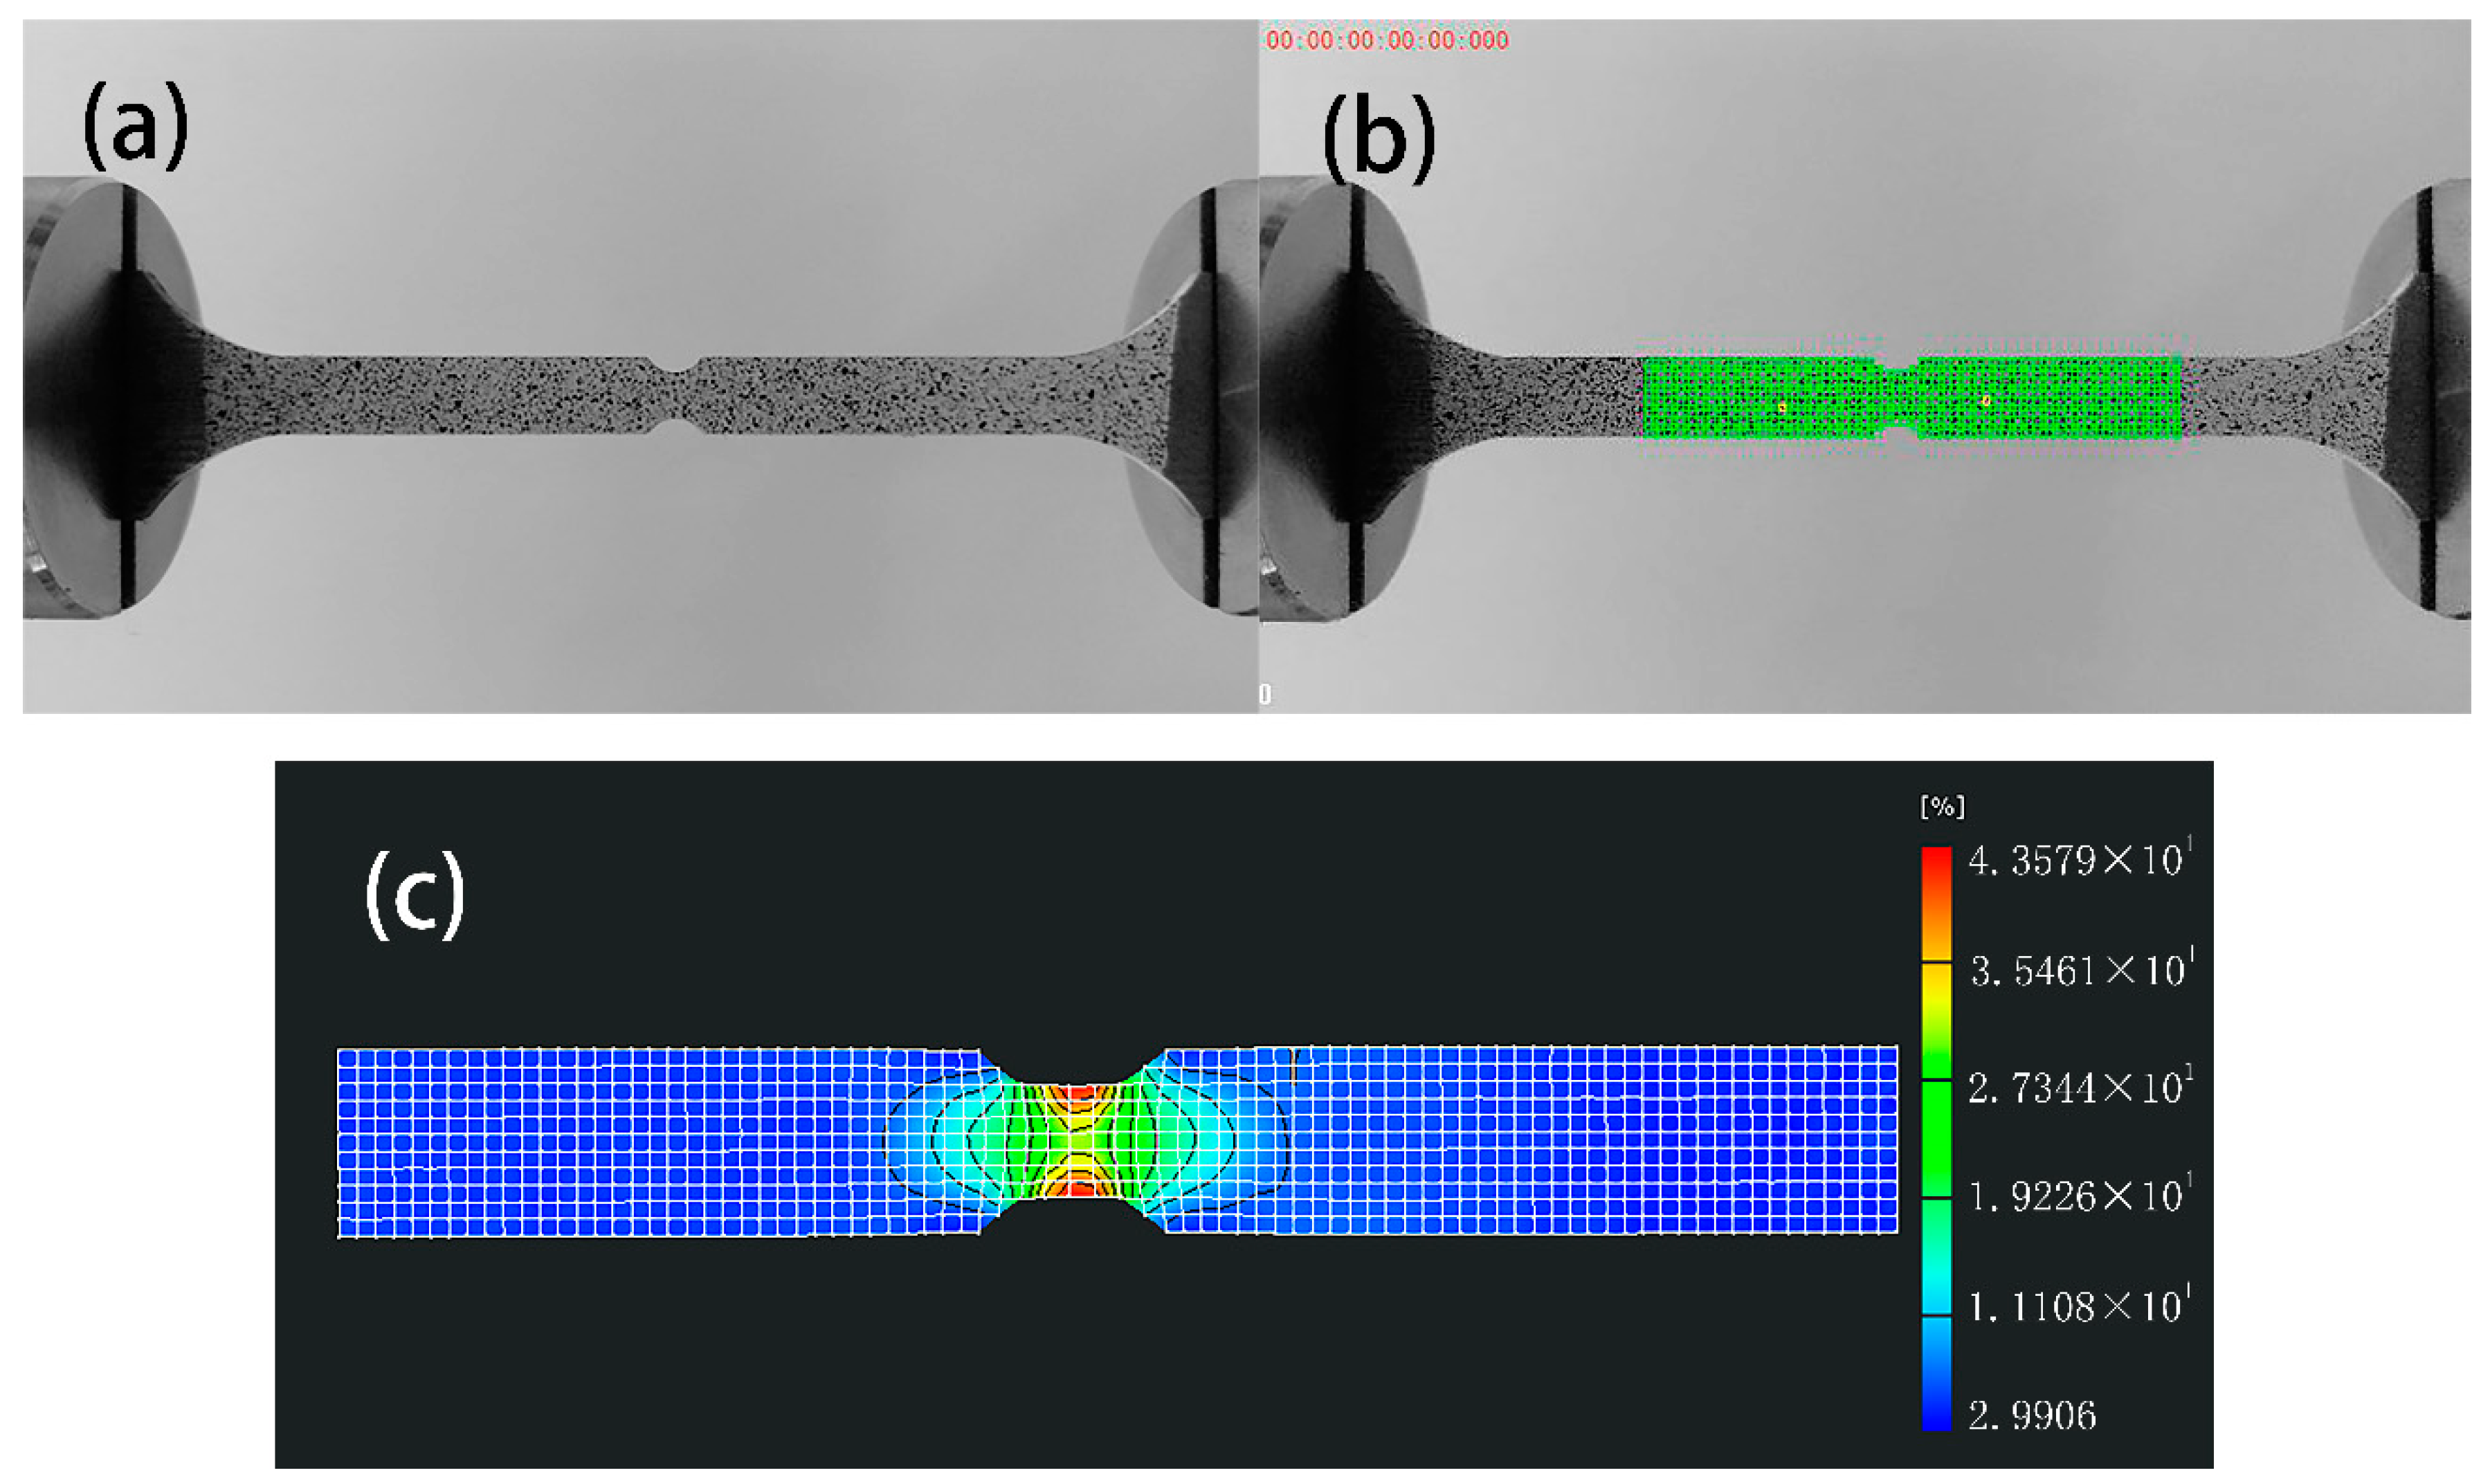
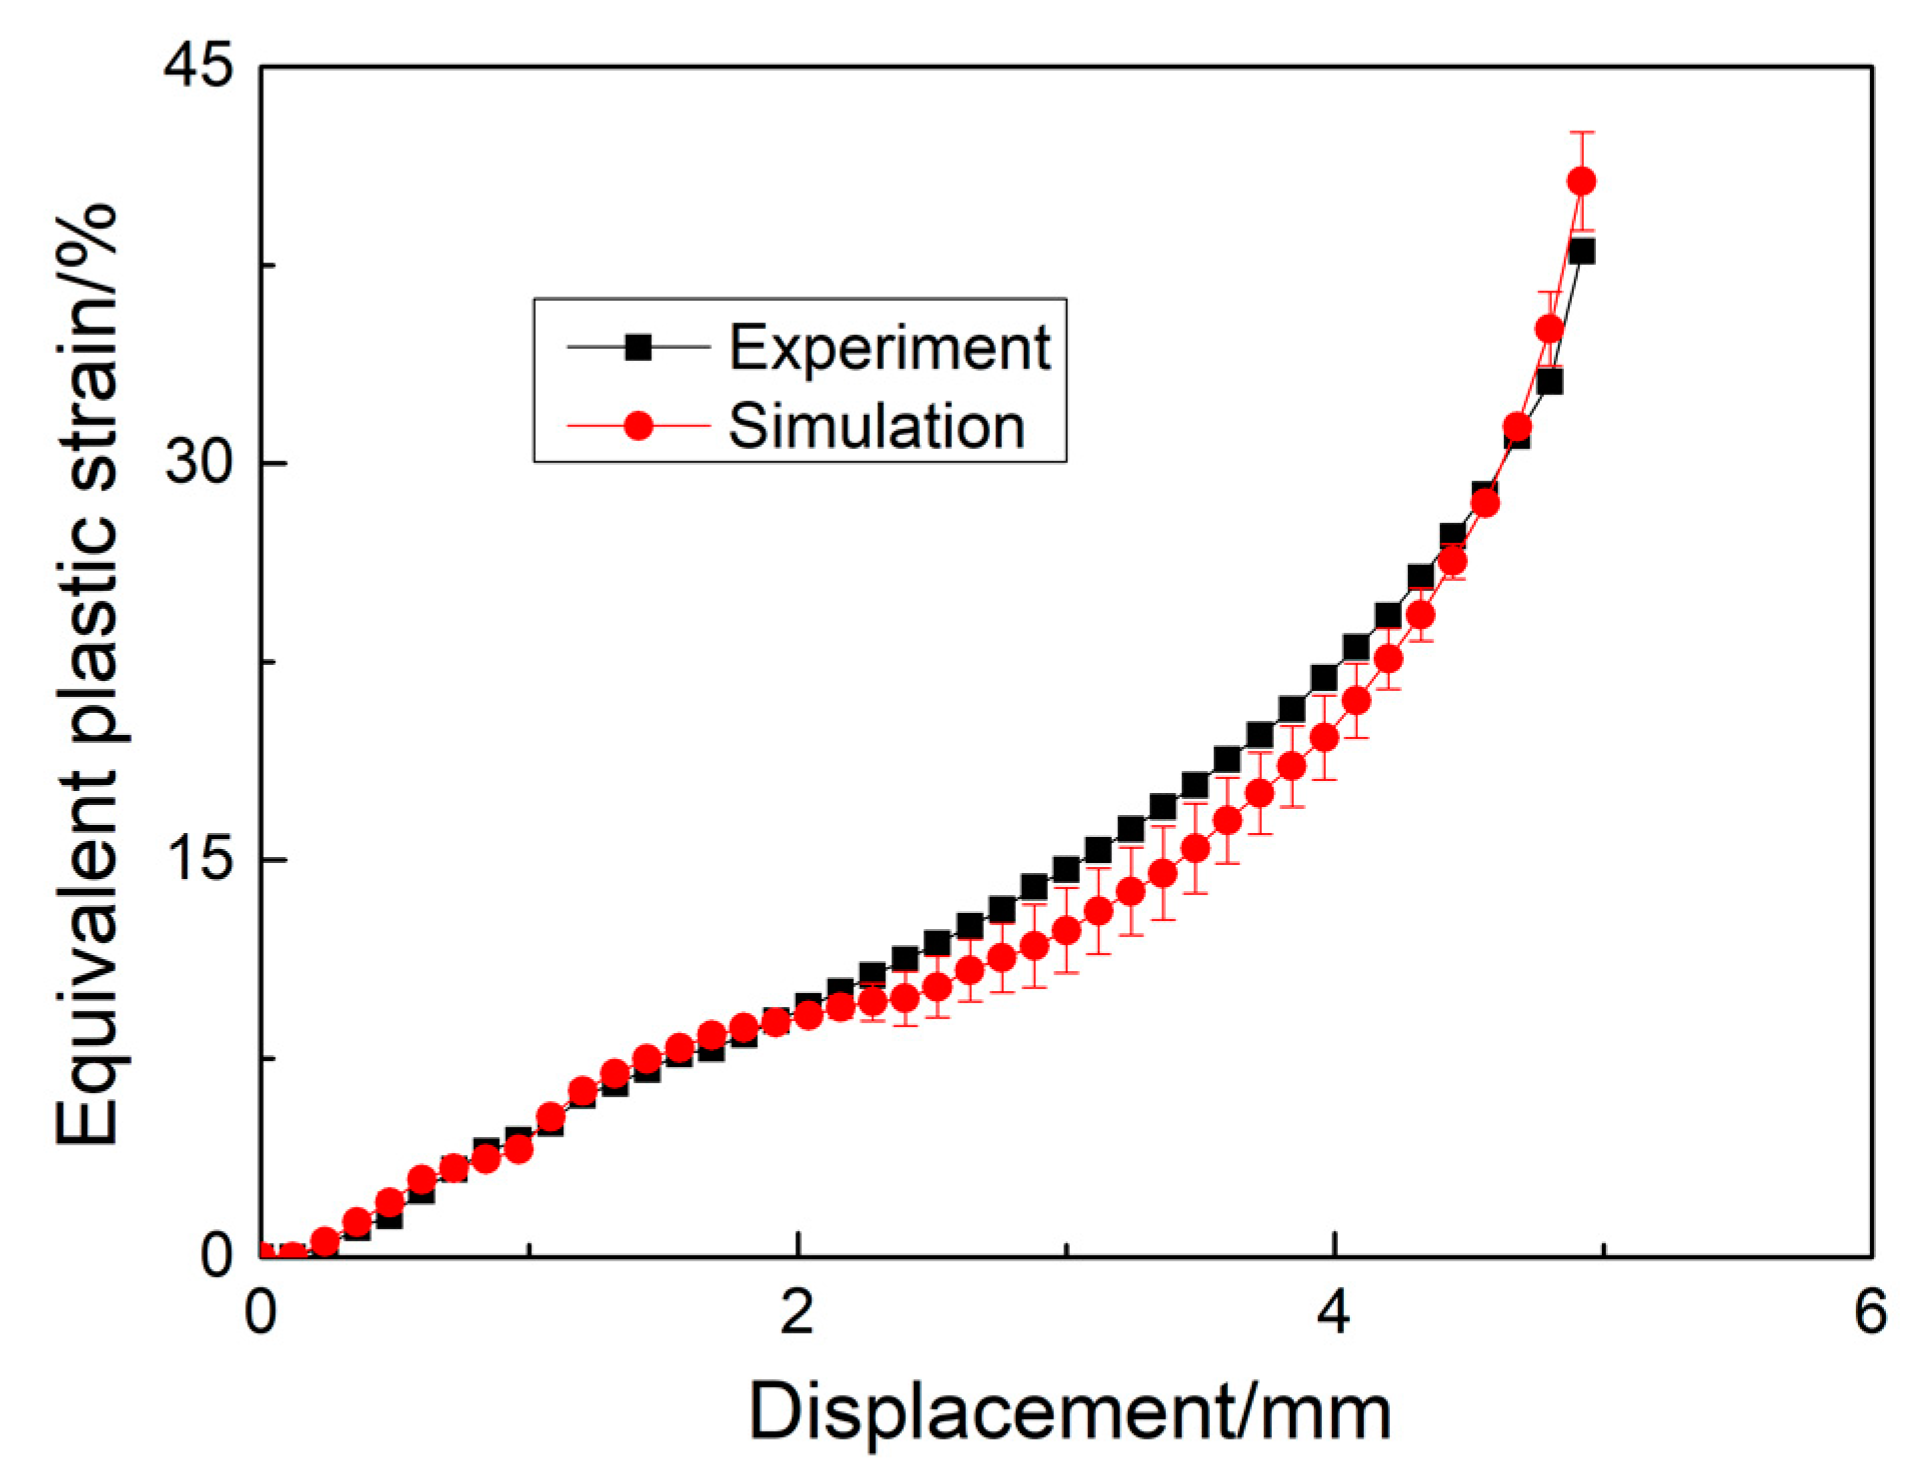
2.3. Comparison of FES Results and DIC Experimental Results

Based on FES with GTN parameters in Table 3, the strain and plastic damage evolutions of notched specimen can be simulated. In order to verify the simulation results, DIC technology is applied to obtain the strain field of notched specimens. Figure 4 compares the strain field counter plots obtained by FES and DIC observation. It can be observed that the strain field counter plots by FES agree well with those by DIC observation for notched specimens with different radii under different loading displacements. Moreover, strain contour plots show that the smaller the notch radius is, the more concentrated the strain at the notch root is, and the larger the maximum strain near the notch root is. Therefore, the notch size has a great effect on the strain distribution of notched specimen.
Moreover, Figure 5 gives the comparison of loading displacement-strain curves obtained by experimental results and FES with the GTN damage model. The Y-value of Figure 5 is the equivalent plastic strain at center position of the notched specimen with the notched radius of 0.5 mm, and the red color curve is corresponding to the FES results, while the black color curve is corresponding to the DIC experimental results. The simulated loading displacement-strain curve agrees well with the experimental result.
Both the consistencies of strain distributions by FES and DIC in Figure 4 and loading displacement-strain curves by FES and experiment in Figure 5 prove that the FES of strain fields for notched specimens at different loads is effective, and the material parameters and damage model parameters obtained in Section 2.2 are suitable to present the tensile and plastic damage behaviors of notched specimen for 316L.

3. Results and Discussion

3.1. The Evolution of Stress Triaxiality for the Notched Specimen

For round bar notched specimens, the stress triaxiality at the center of net section can be calculated by the formula η = 1 3 + ln 1 + a 0 2 R 0 , which was proposed by Bridgman [45], where a 0 is the round radius of the net section and R 0 is the notch radius. In practice, plate structures with notch are very common, but the theoretical solution of stress triaxiality for non-axisymmetric structures can hardly be solved. The stress triaxiality is defined as the ratio of hydrostatic stress to von Mises equivalent stress:
η = σ h q
where the hydrostatic stress σ h = 1 3 ( σ 1 + σ 2 + σ 3 ) and the Mises equivalent stress q = ( σ 1 σ 2 ) 2 + ( σ 2 σ 3 ) 2 + ( σ 1 σ 3 ) 2 2 .
In order to understand the effect of notch size on the stress triaxiality for 316L plate specimen, the evolution of stress triaxiality with notch radius is observed by FES presented in Figure 6.
Three points at the center, middle and root of notched specimens are selected shown in Figure 6a to analyze the evolution of stress triaxiality with displacement load. It can be observed in Figure 6b–d that the stress triaxiality values at center, middle and root positions decrease with notch radius increasing. The stress triaxiality values at center and middle points are relatively stable with loading, and followed by a sharp increase before fracture, as shown in Figure 6b,c. It is worth noting that the stress triaxiality value at the notch root fluctuates during tensile process as shown in Figure 6d. The loading displacements where the stress triaxiality values fluctuate are marked in Figure 6d. It can be found that the corresponding loading displacement increases with the increase in the notch radius. It can be speculated that the fluctuation of stress triaxiality is correlated with the plastic damage evolution, which will be explained in Section 3.3.

3.2. Effect of Stress Triaxiality on Strain Distribution and Fracture Ductility

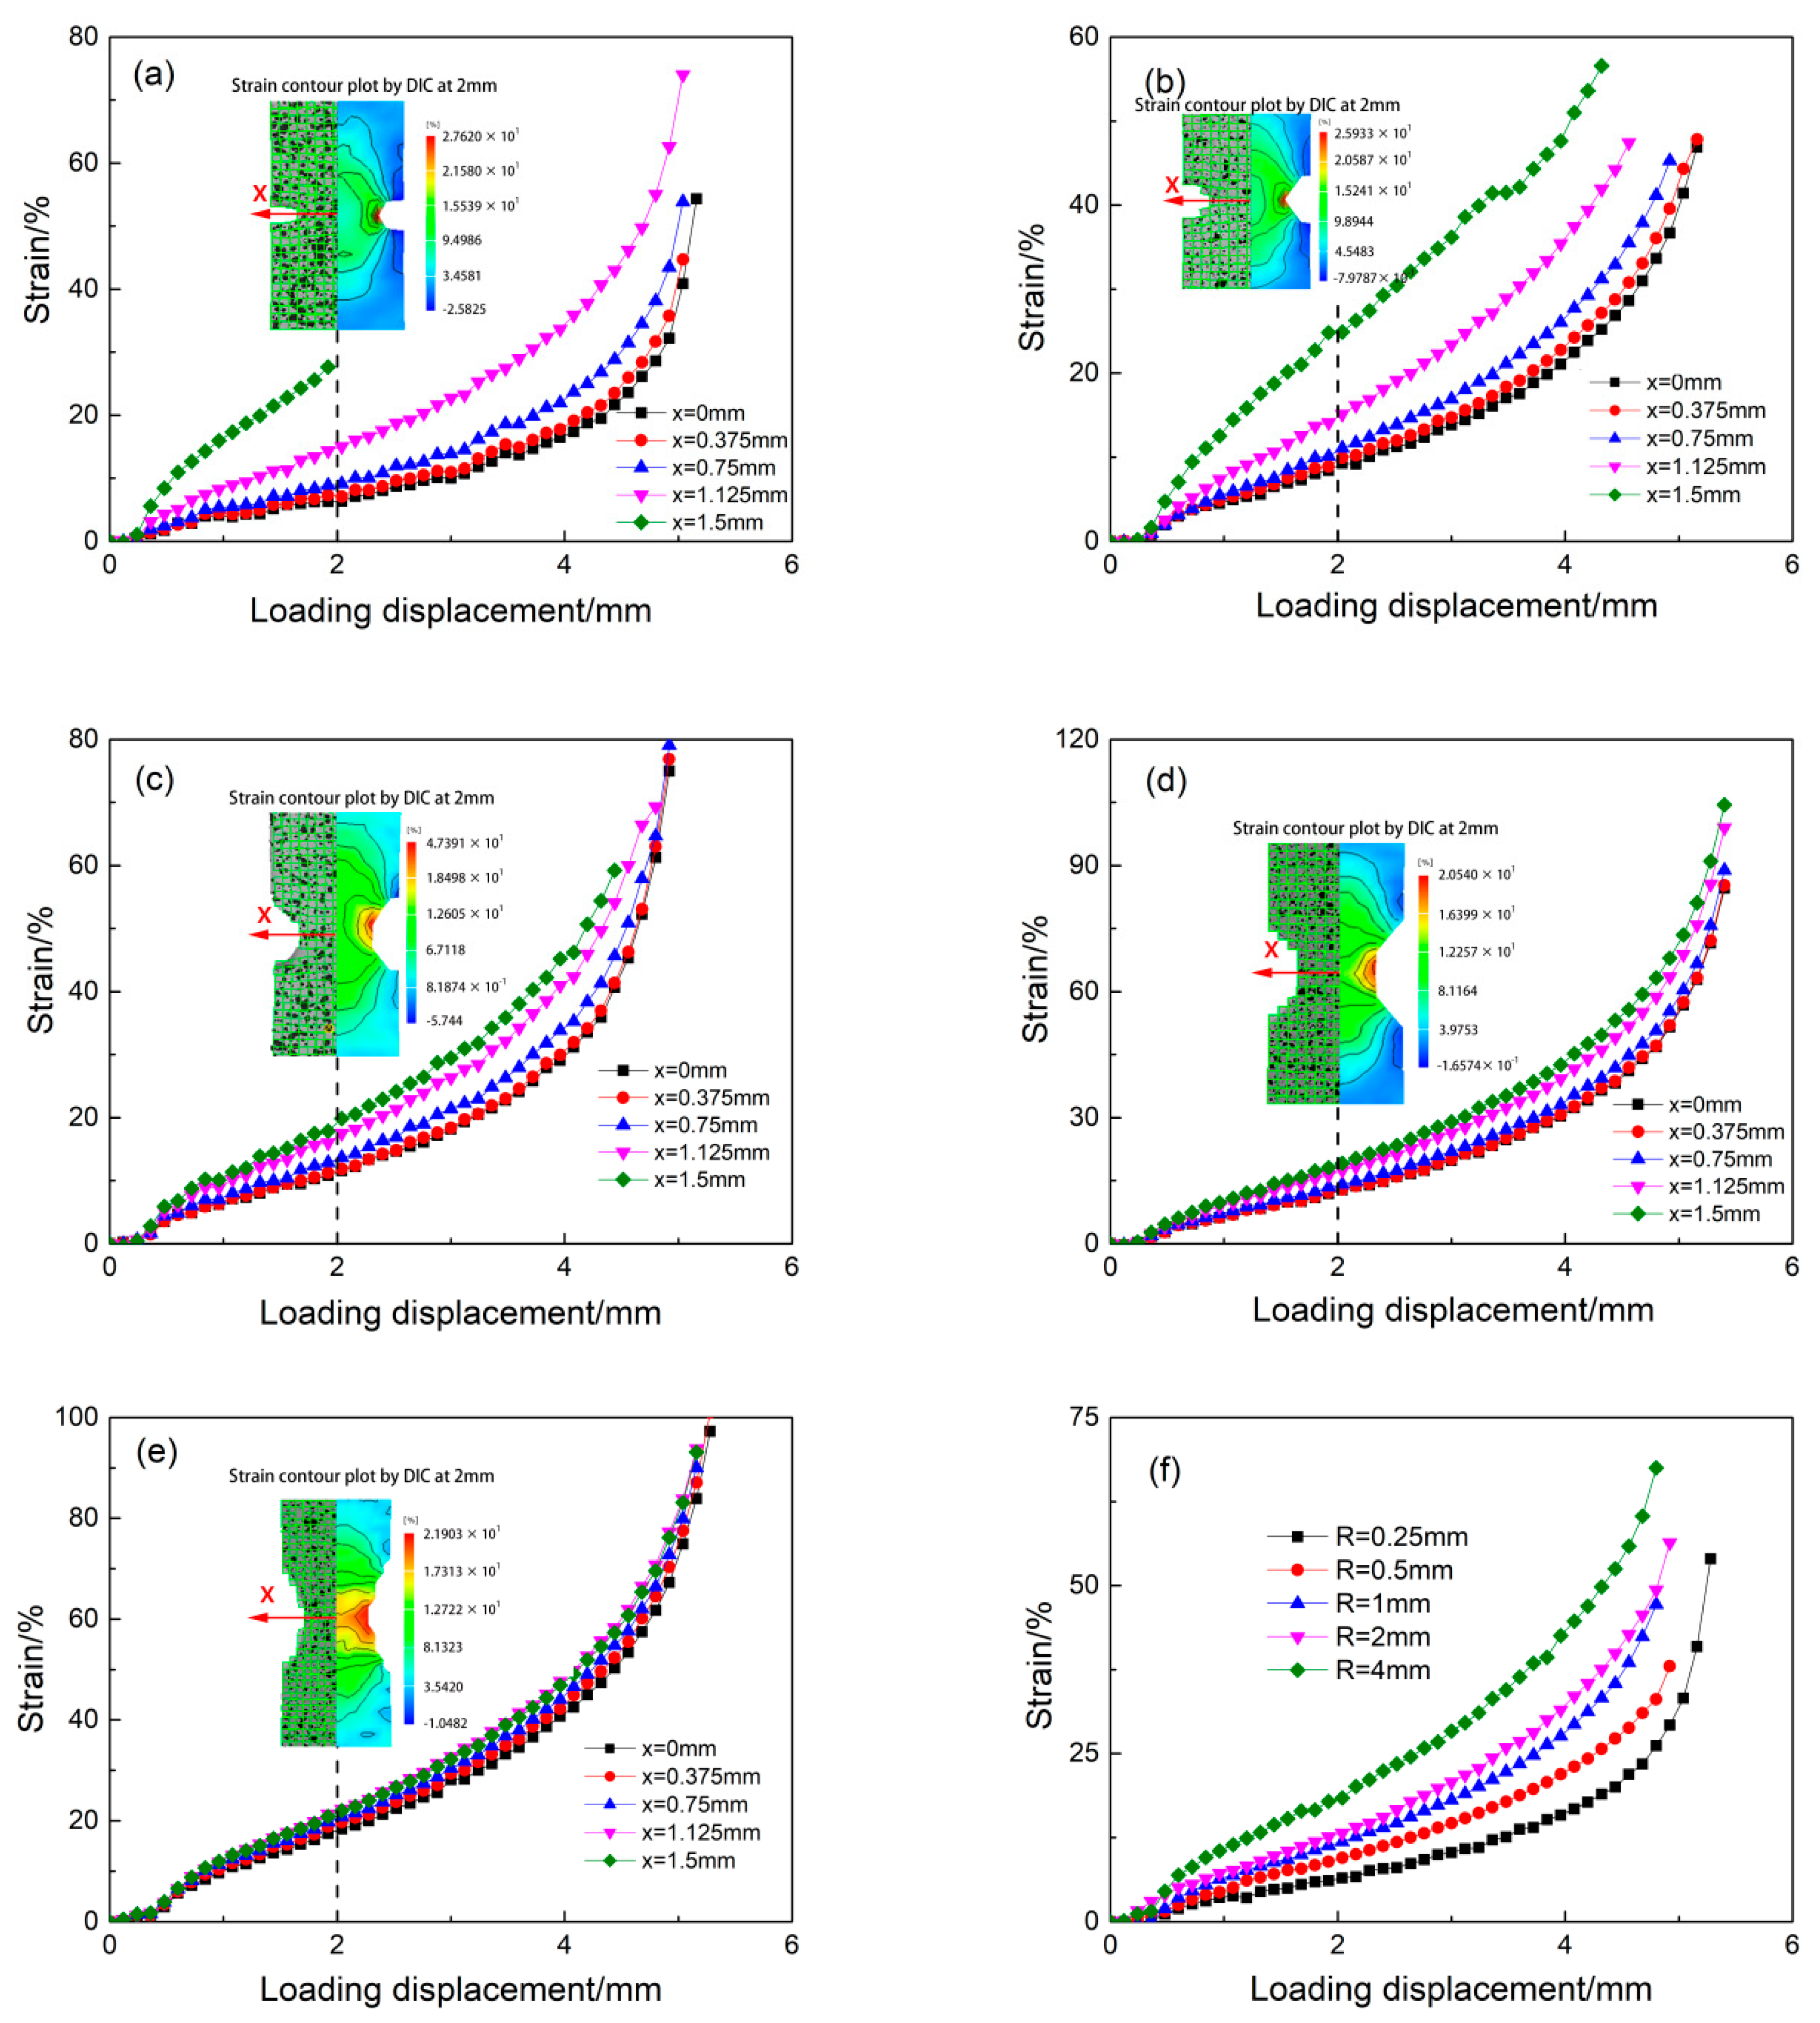
3.2.1. Strain Observation by DIC

Figure 7a–e show the strain contour plots and strain evolutions observed by DIC method for different notched specimens, where x is the distance from the specimen center in the net section line. In general, the strain is concentrated at notch root from both contour plots and variation lines. However, with notch radius increasing, the strain difference between notch root and center is decreasing. This proves that the stress triaxiality has a great effect on the strain distribution of notched specimen, which will affect the damage distribution.
In order to analyze the effect of stress triaxiality on the strain distribution, Figure 7f compares the strain-loading displacement curves of different notch radii at the center position. The results show that the variations of strain with loading displacement follow the same trend at the center position for different notched specimens, and the smaller the notch is, the smaller the strain value at the center position is. During the tensile experiments, when the specimen begins to neck, the specimen surface becomes significantly deformed especially near the notch root, which causes the speckle become severely dim. Therefore, the strain field near the plastic failure cannot be experimentally observed by DIC technology. In order to solve this problem, FES with plastic damage model and fine mesh is used to observe the strain and damage distributions during the entire tensile test.

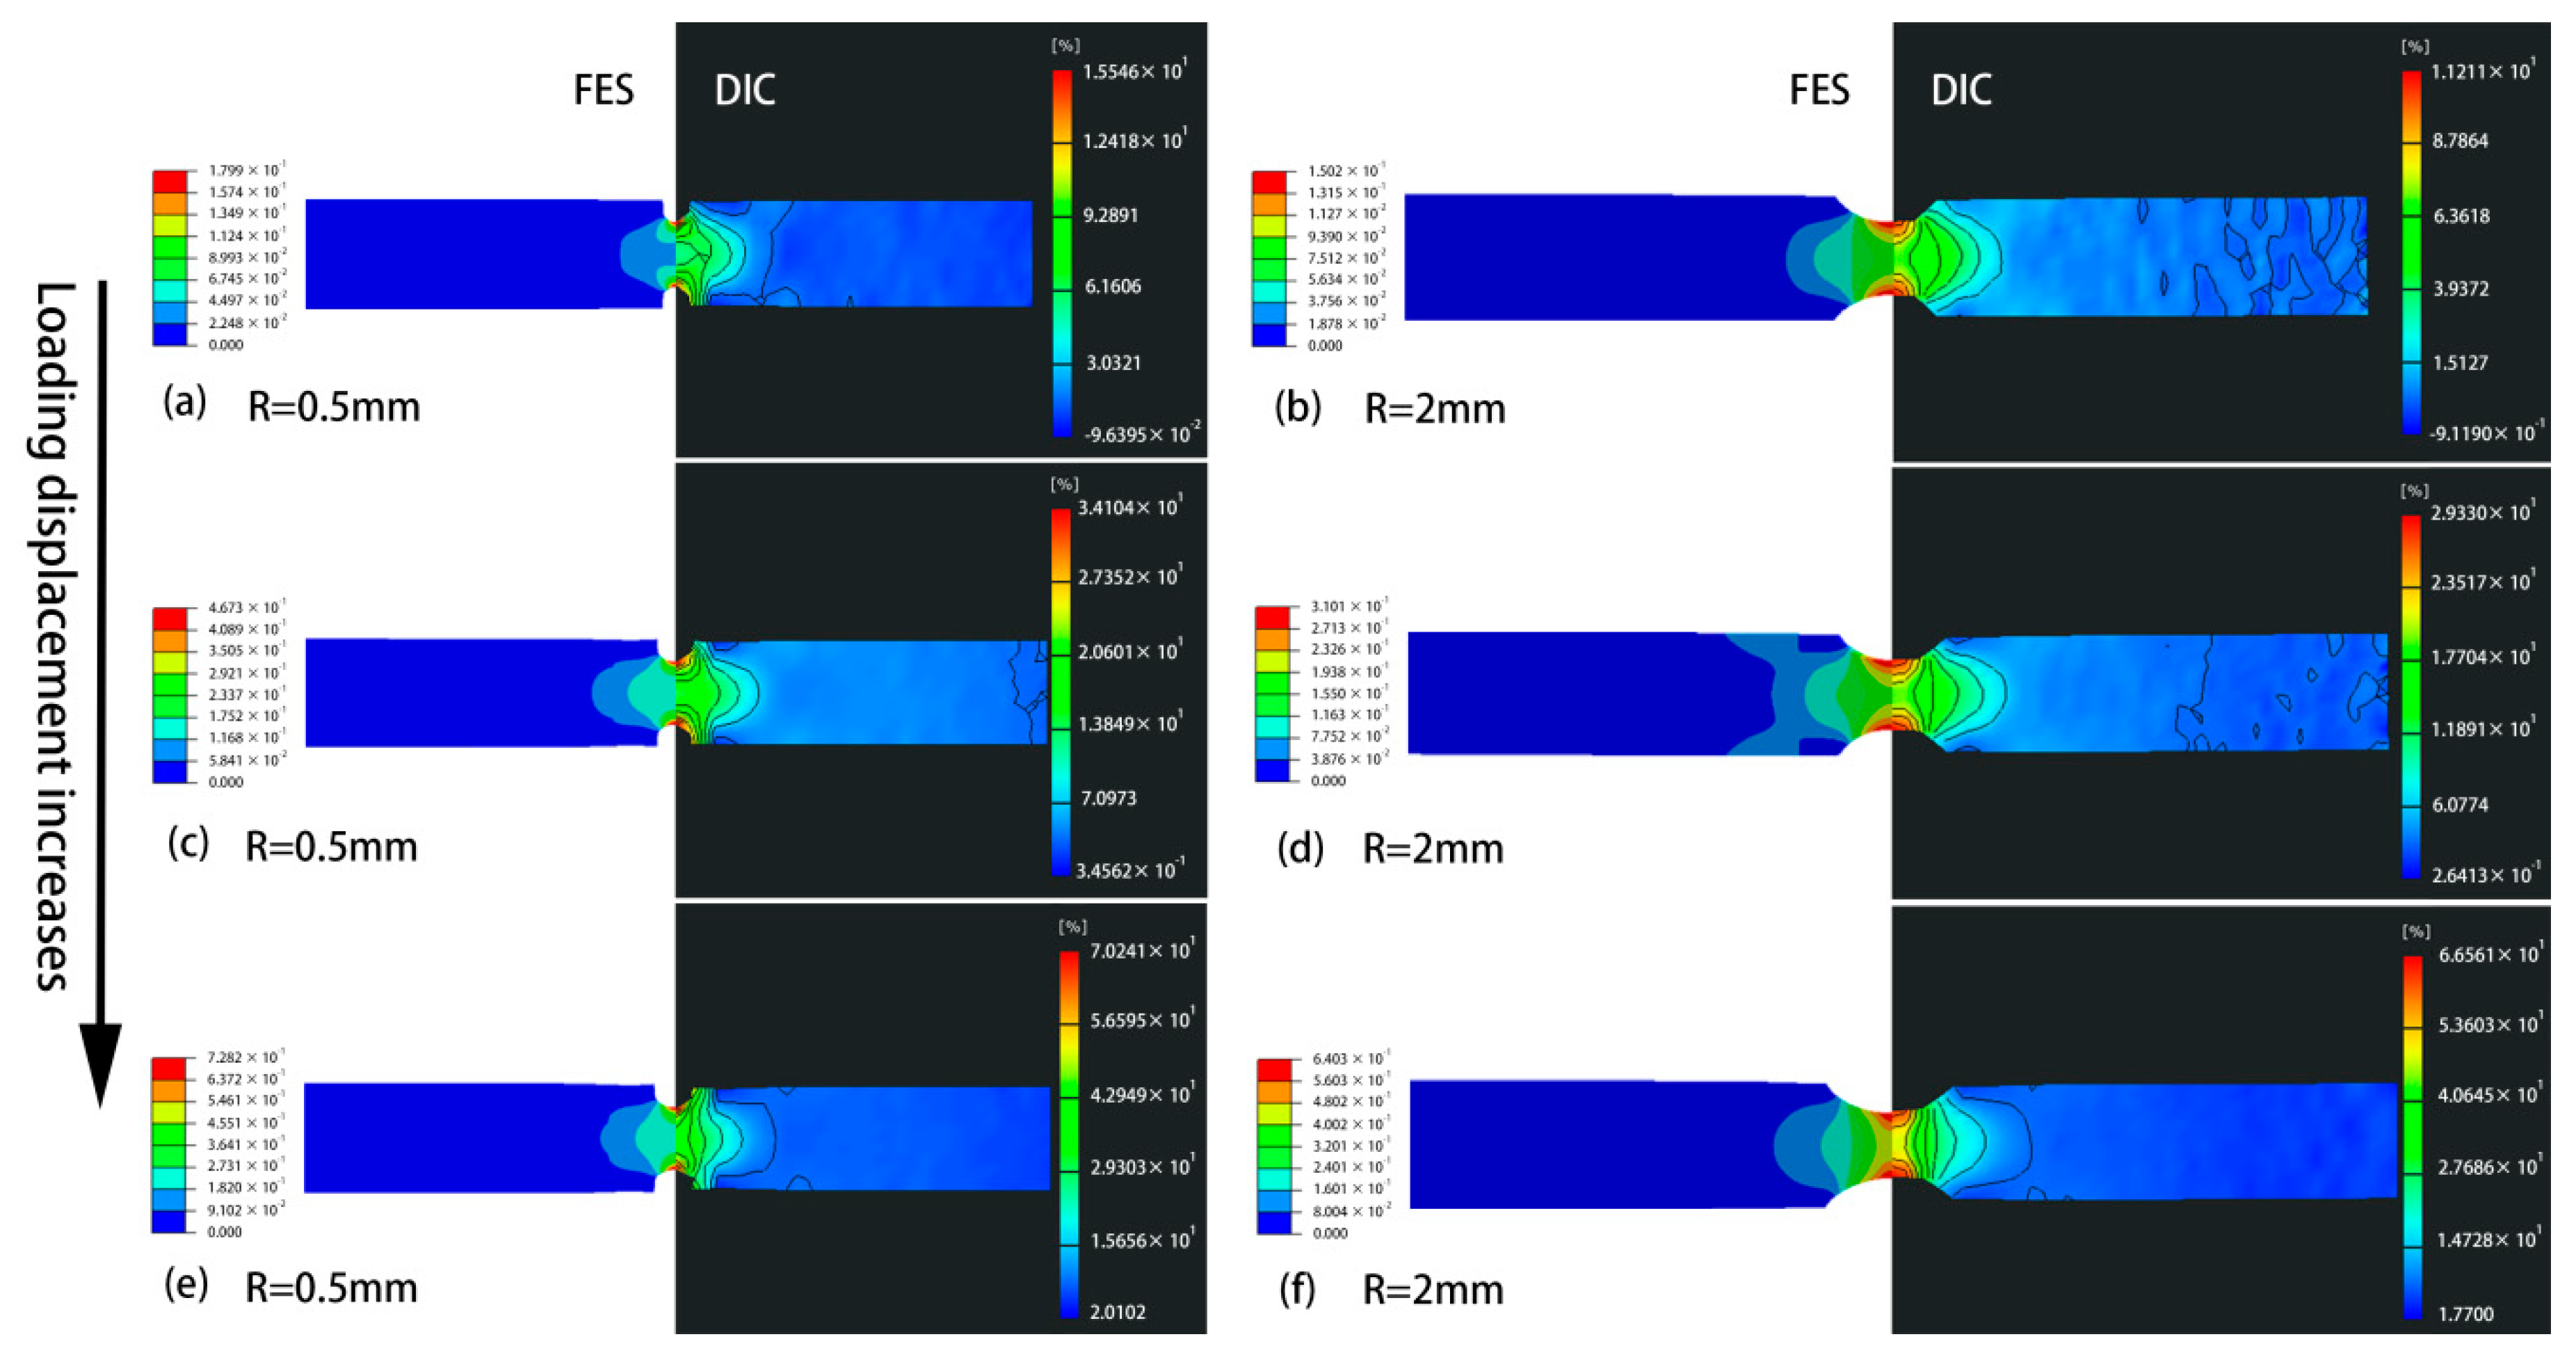
3.2.2. Strain Observation by FES

Variations of equivalent plastic strain with loading displacement at both center and root positions by FES with damage model are illustrated in Figure 8. As presented in Figure 8a, at the initial stage, the strain value at the center position is positively correlated with the notch radius, which is in agreement with the results of DIC shown in Figure 7. When the plastic damage appears, the strain sharply increases at the center position. However, the variation of equivalent plastic strain with notch size at the root position is opposite with that at the center position, as shown in Figure 8b. With notch size increasing, the equivalent plastic strain at the root position is decreasing with the increase in notch size. Moreover, the differences of strain-displacement curves for different notch sizes at the notch root position are greater than those at the center position.
In order to understand the equivalent plastic strain variation at the net section, Figure 9 displays the variation law of strain from center to root at loading displacements of 1 mm, 3 mm and 5 mm. The strain increases from the center position to the root position and the smaller the notch radius is, the greater the difference between the strain values at the center position and at the root position is. Moreover, it is worth noting that, at small loading displacements of 1 mm and 3 mm as shown in Figure 9, the strain increases with notch radius increasing at the center position, but decreases at the root position. Under the large displacement before fracture with 5 mm shown in Figure 9c, the strain decreases with notch radius increasing at all positions. This indicates that with loading displacement increasing, the relationship between strain and notch radius at the center position changes from positive to negative.

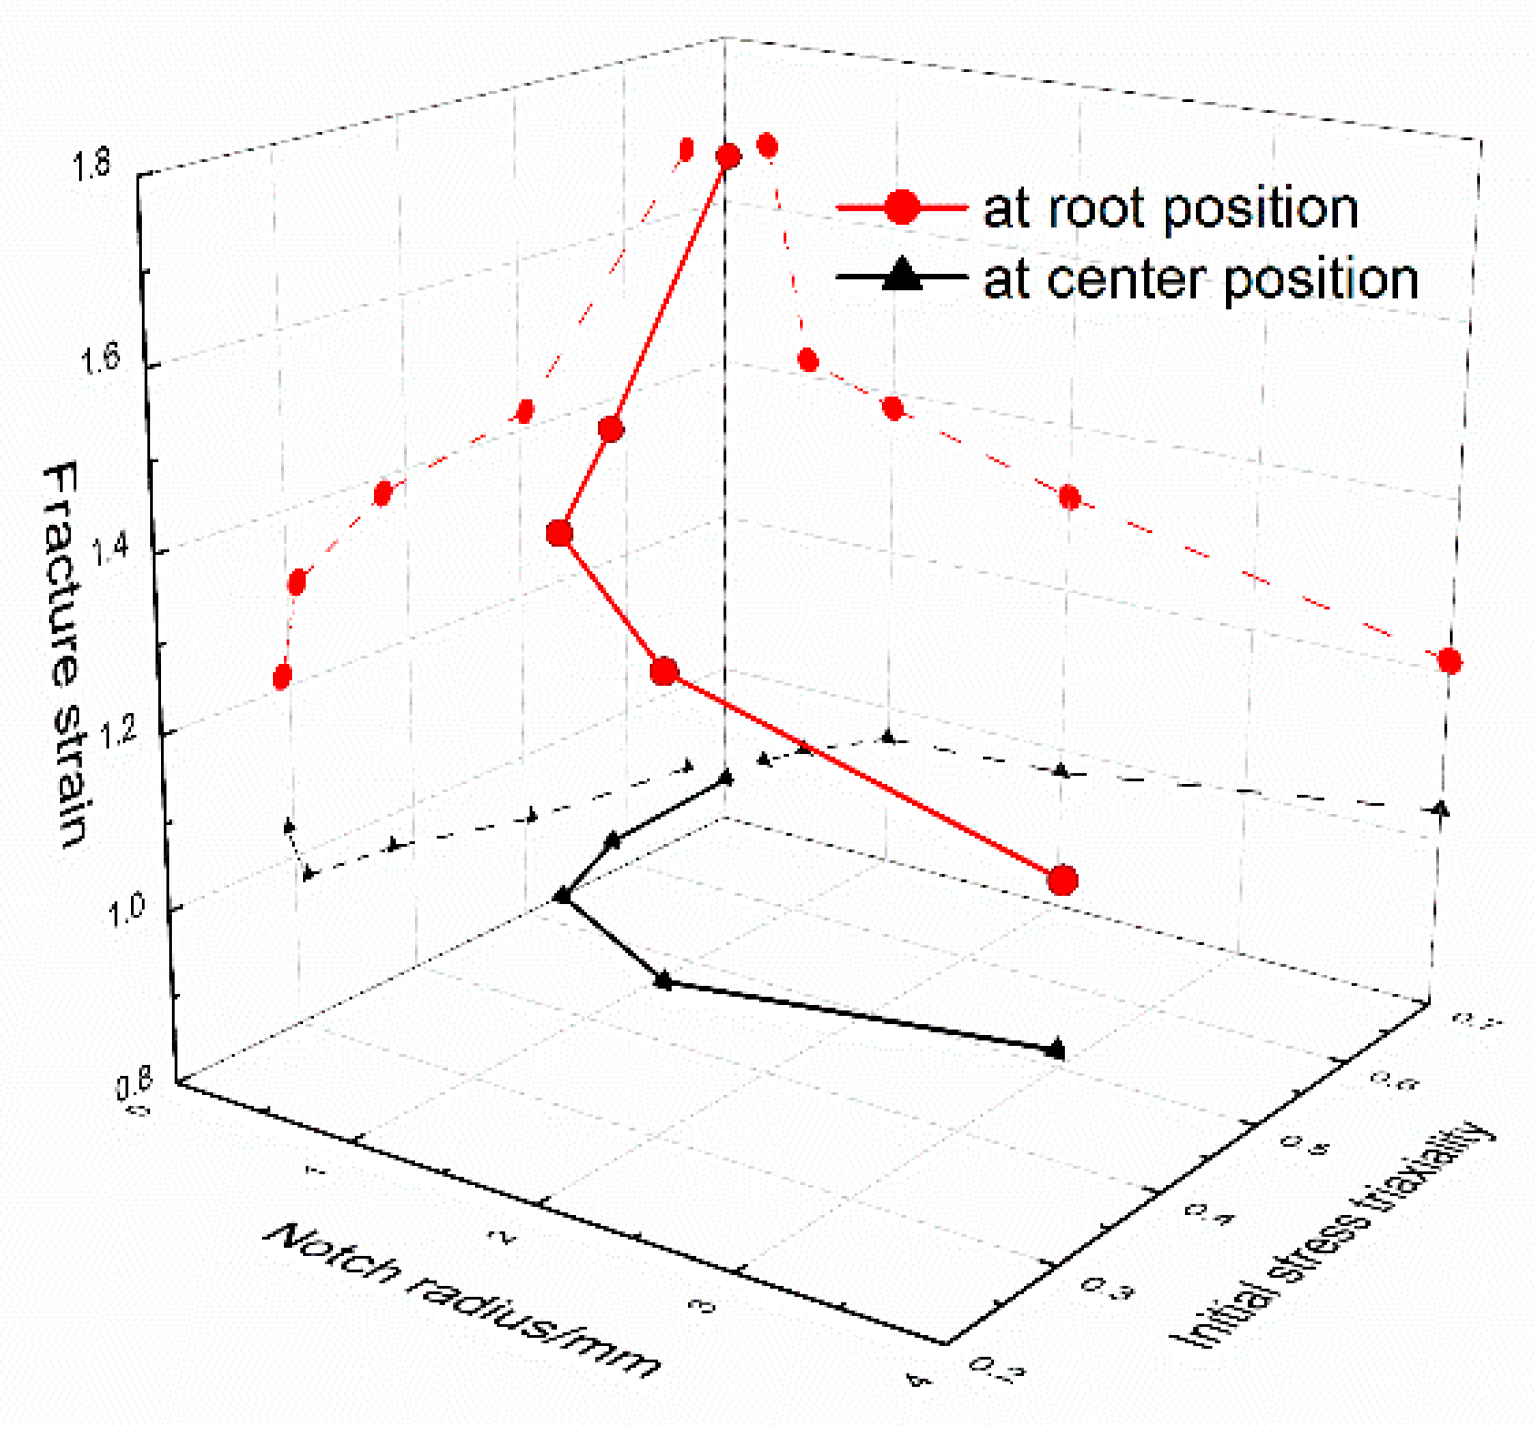
3.2.3. Effect of Stress Triaxiality on Fracture Ductility

In order to study the influence of the notch constraint on the fracture ductility, Figure 10 shows the variations of fracture strain with the initial stress triaxiality and notch size at the root position and at the center position. It is worth noting that the fracture strain at the root position increases when the initial stress triaxiality increases, but the fracture strain at the center position decreases when the initial stress triaxiality increases. Moreover, the variation amplitude of fracture strain with initial stress triaxiality at the root position is much larger than that at the center position. Kato et al. [3] obtained the relationship between the equivalent plastic strain and the stress triaxiality at the center position for ferritic/martensitic steel, and drew the conclusion that the fracture ductility at the center position decreased as the increase in stress triaxiality, which agrees well with the results of 316L in this work.

3.3. Effect of Stress Triaxiality on Plastic Damage Evolution and Failure Mode

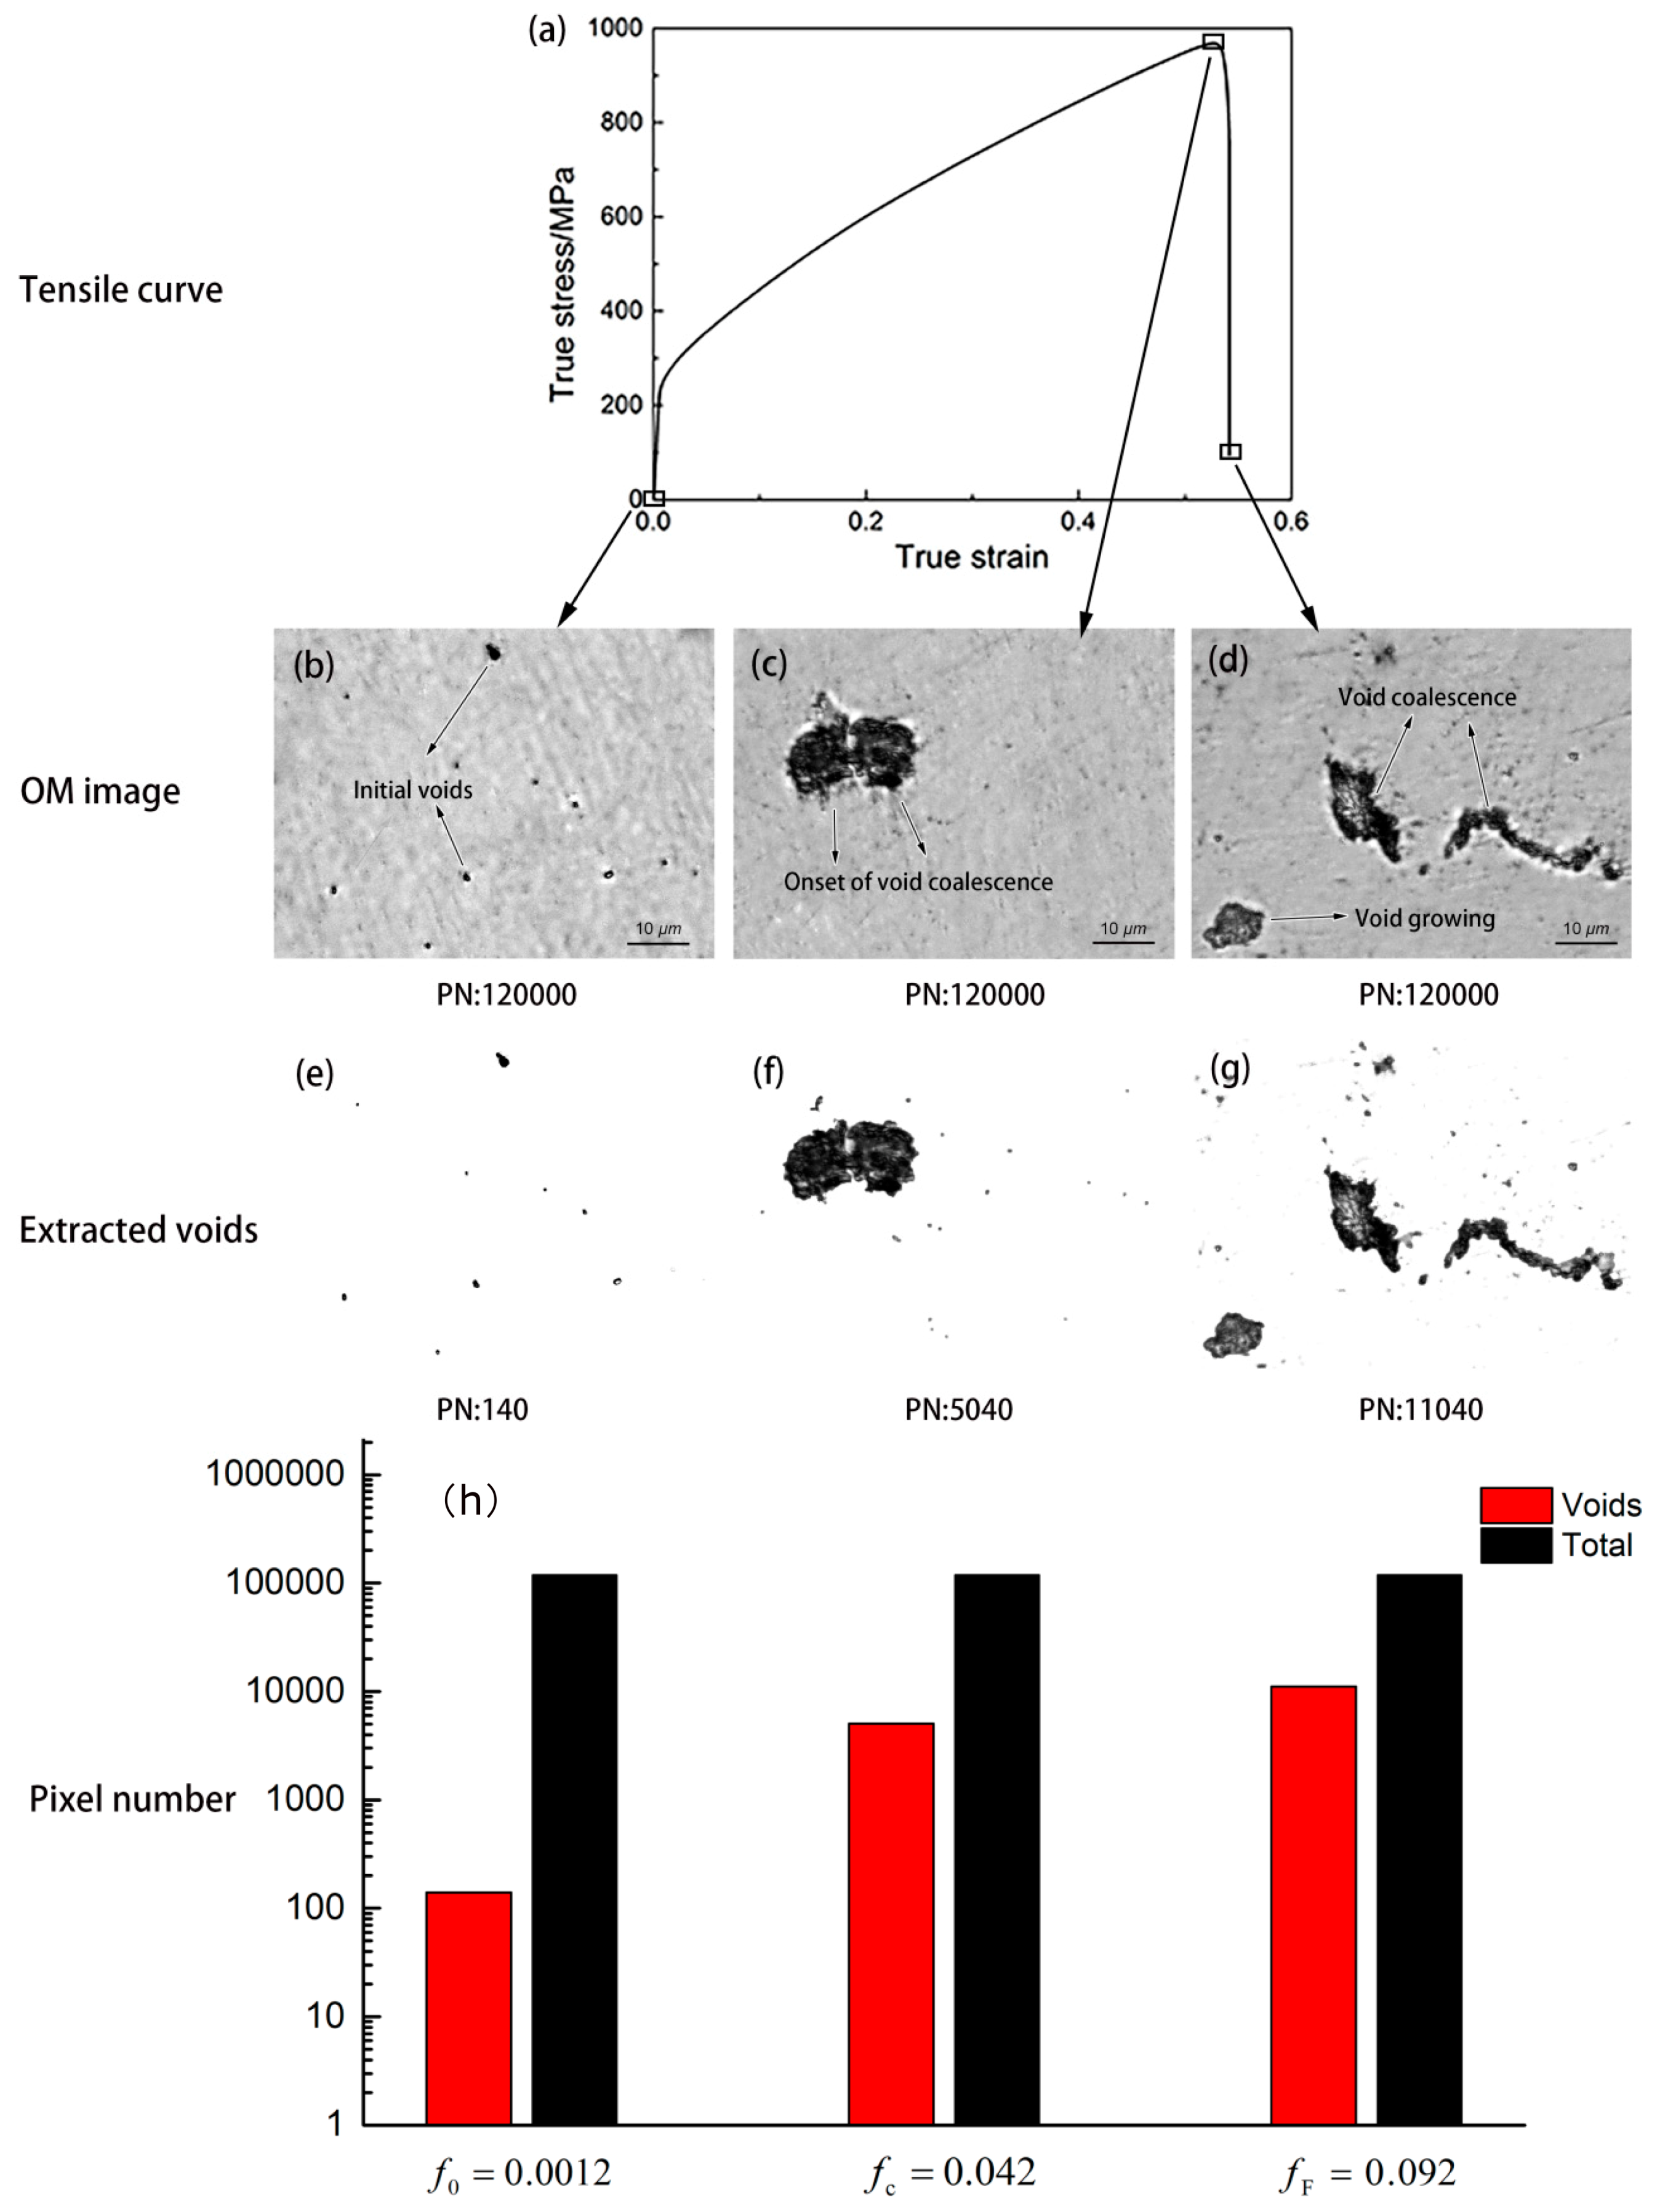
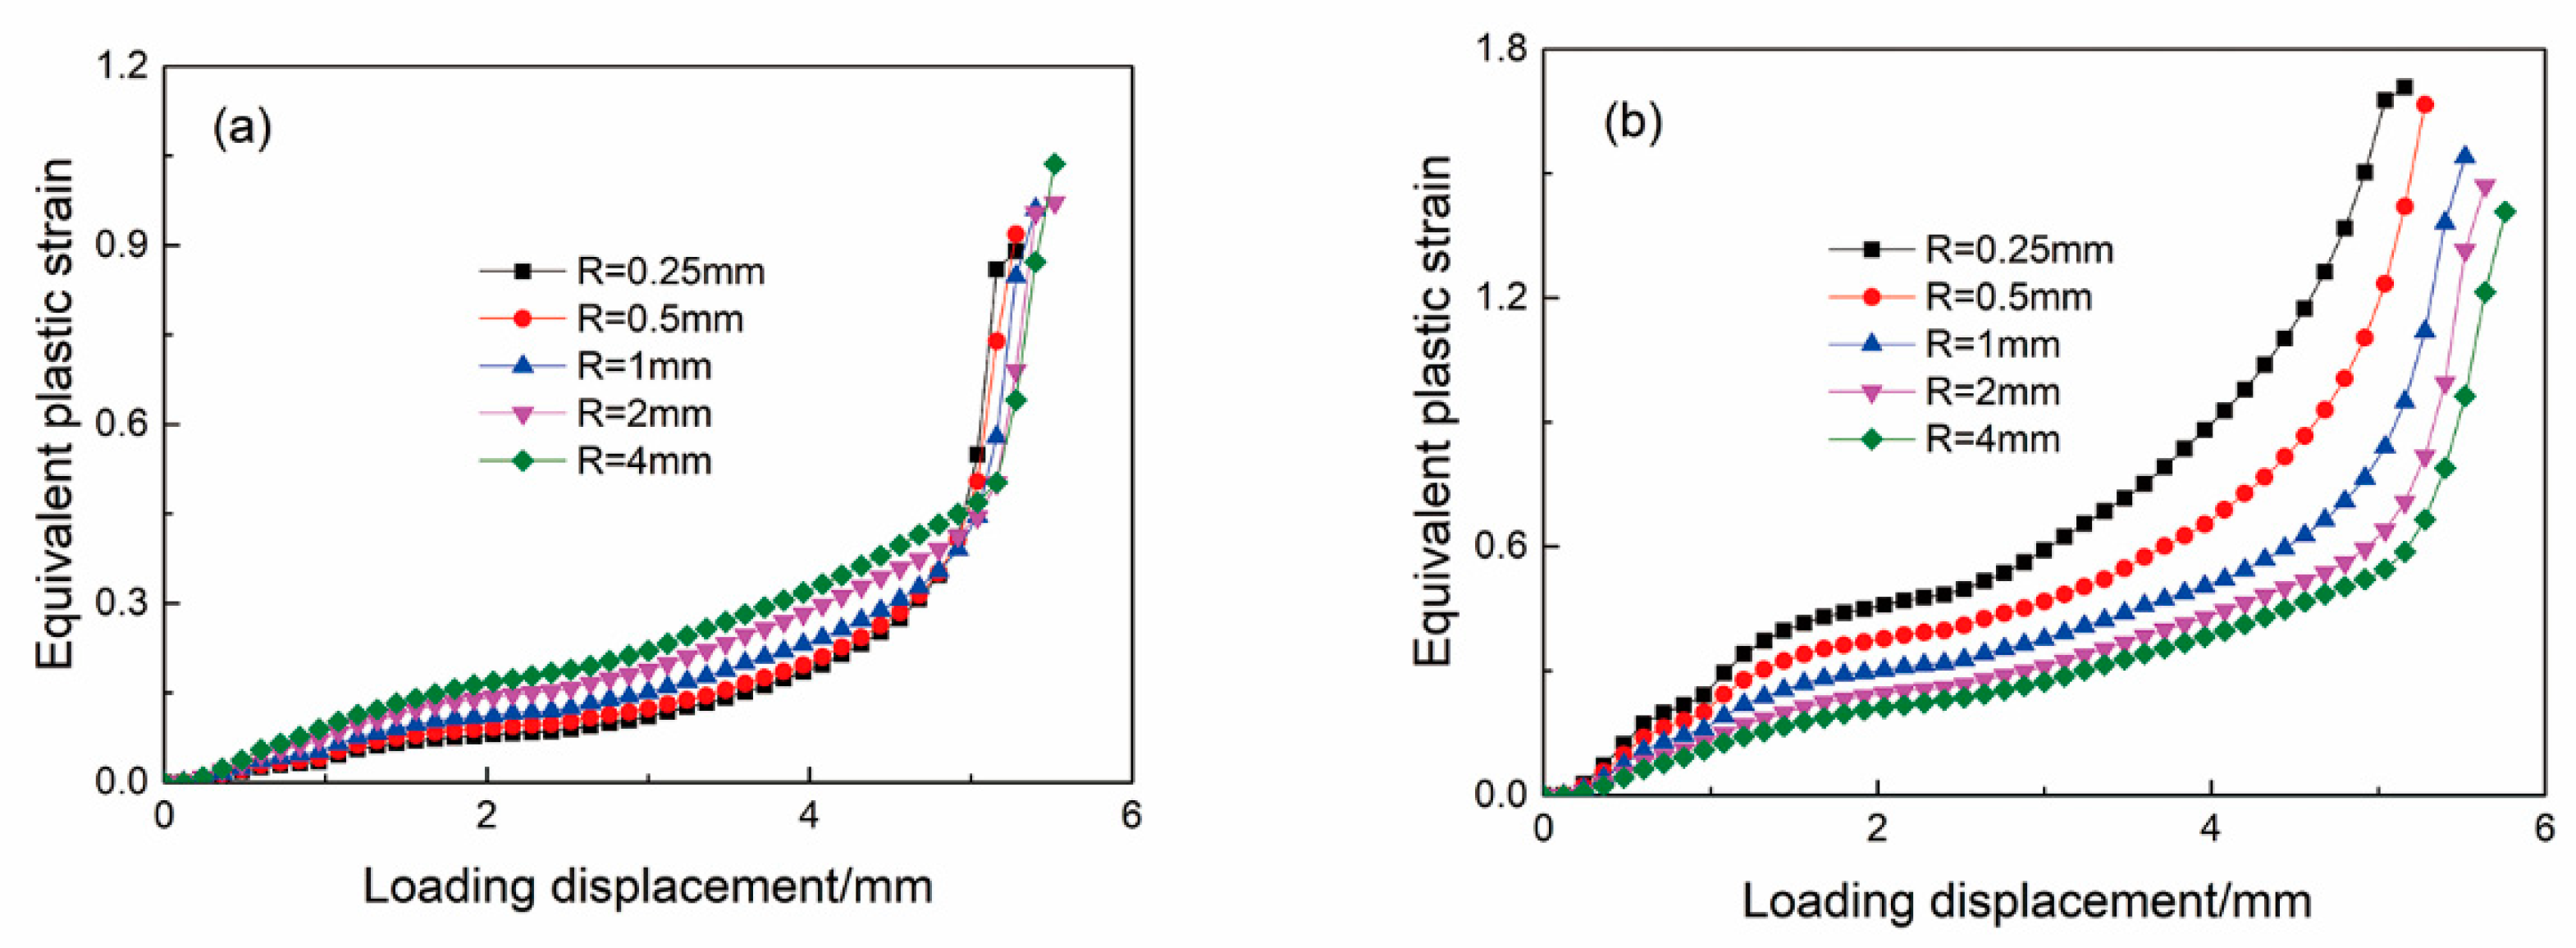
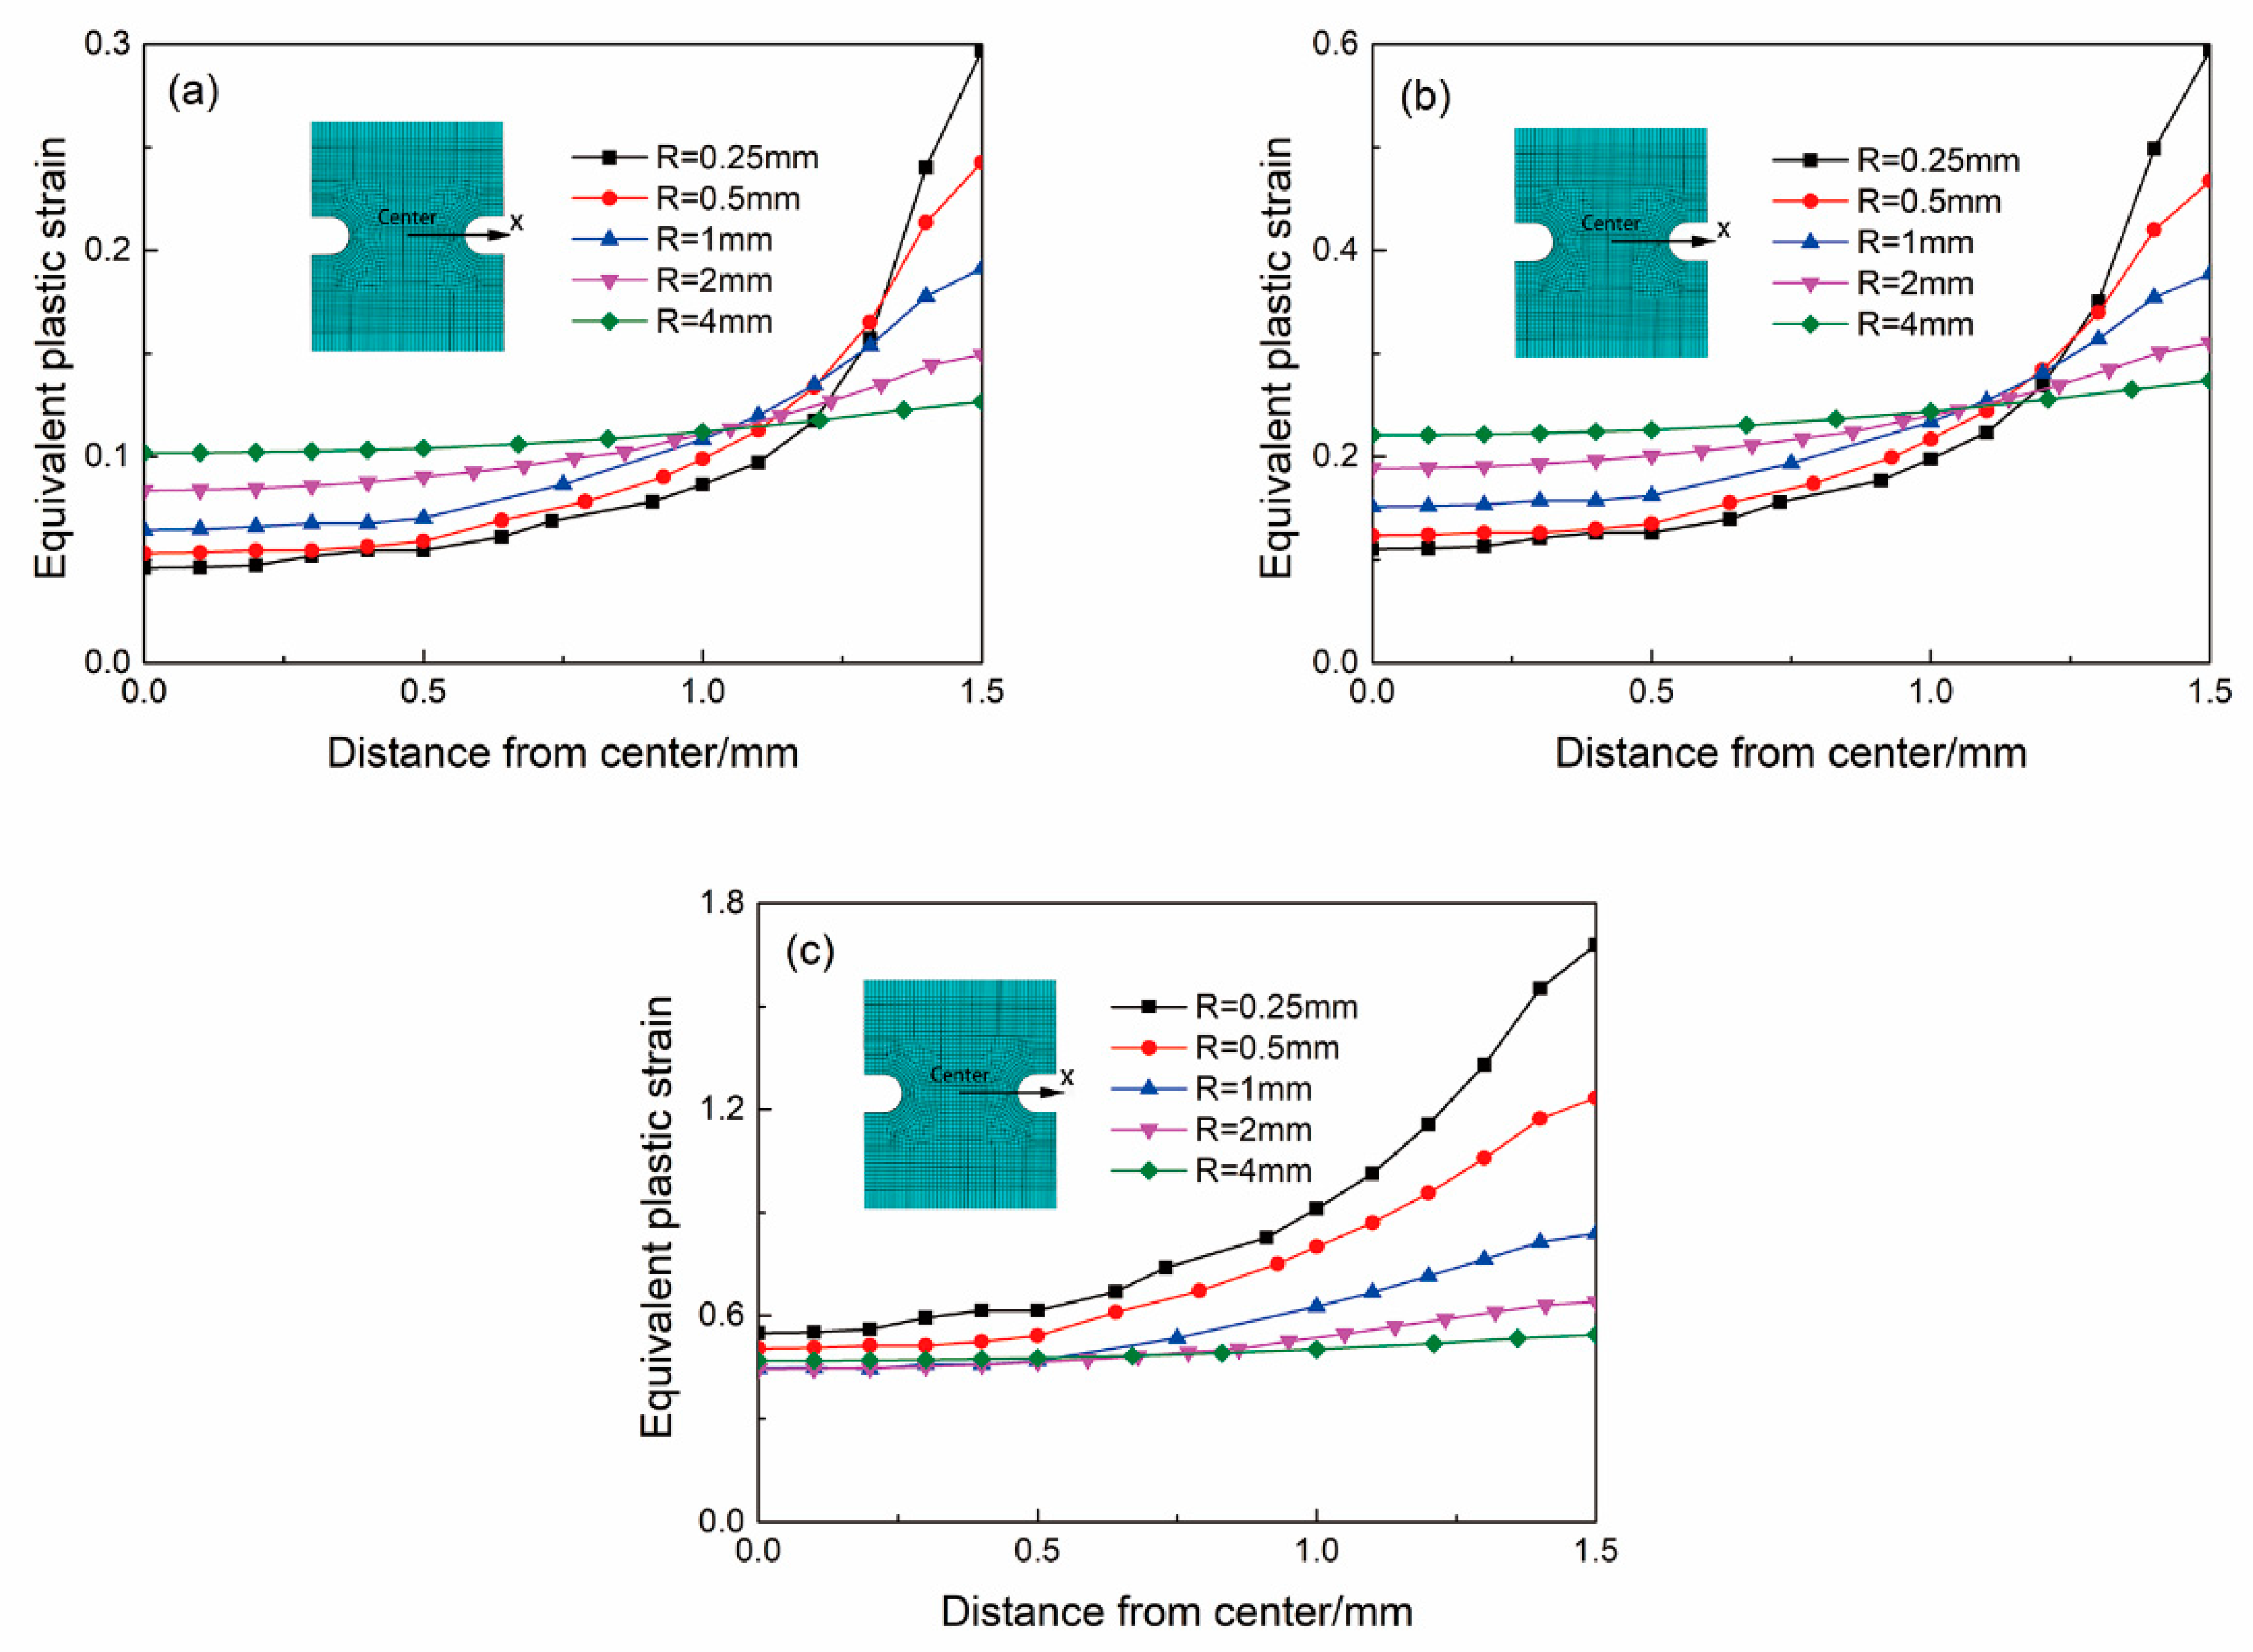
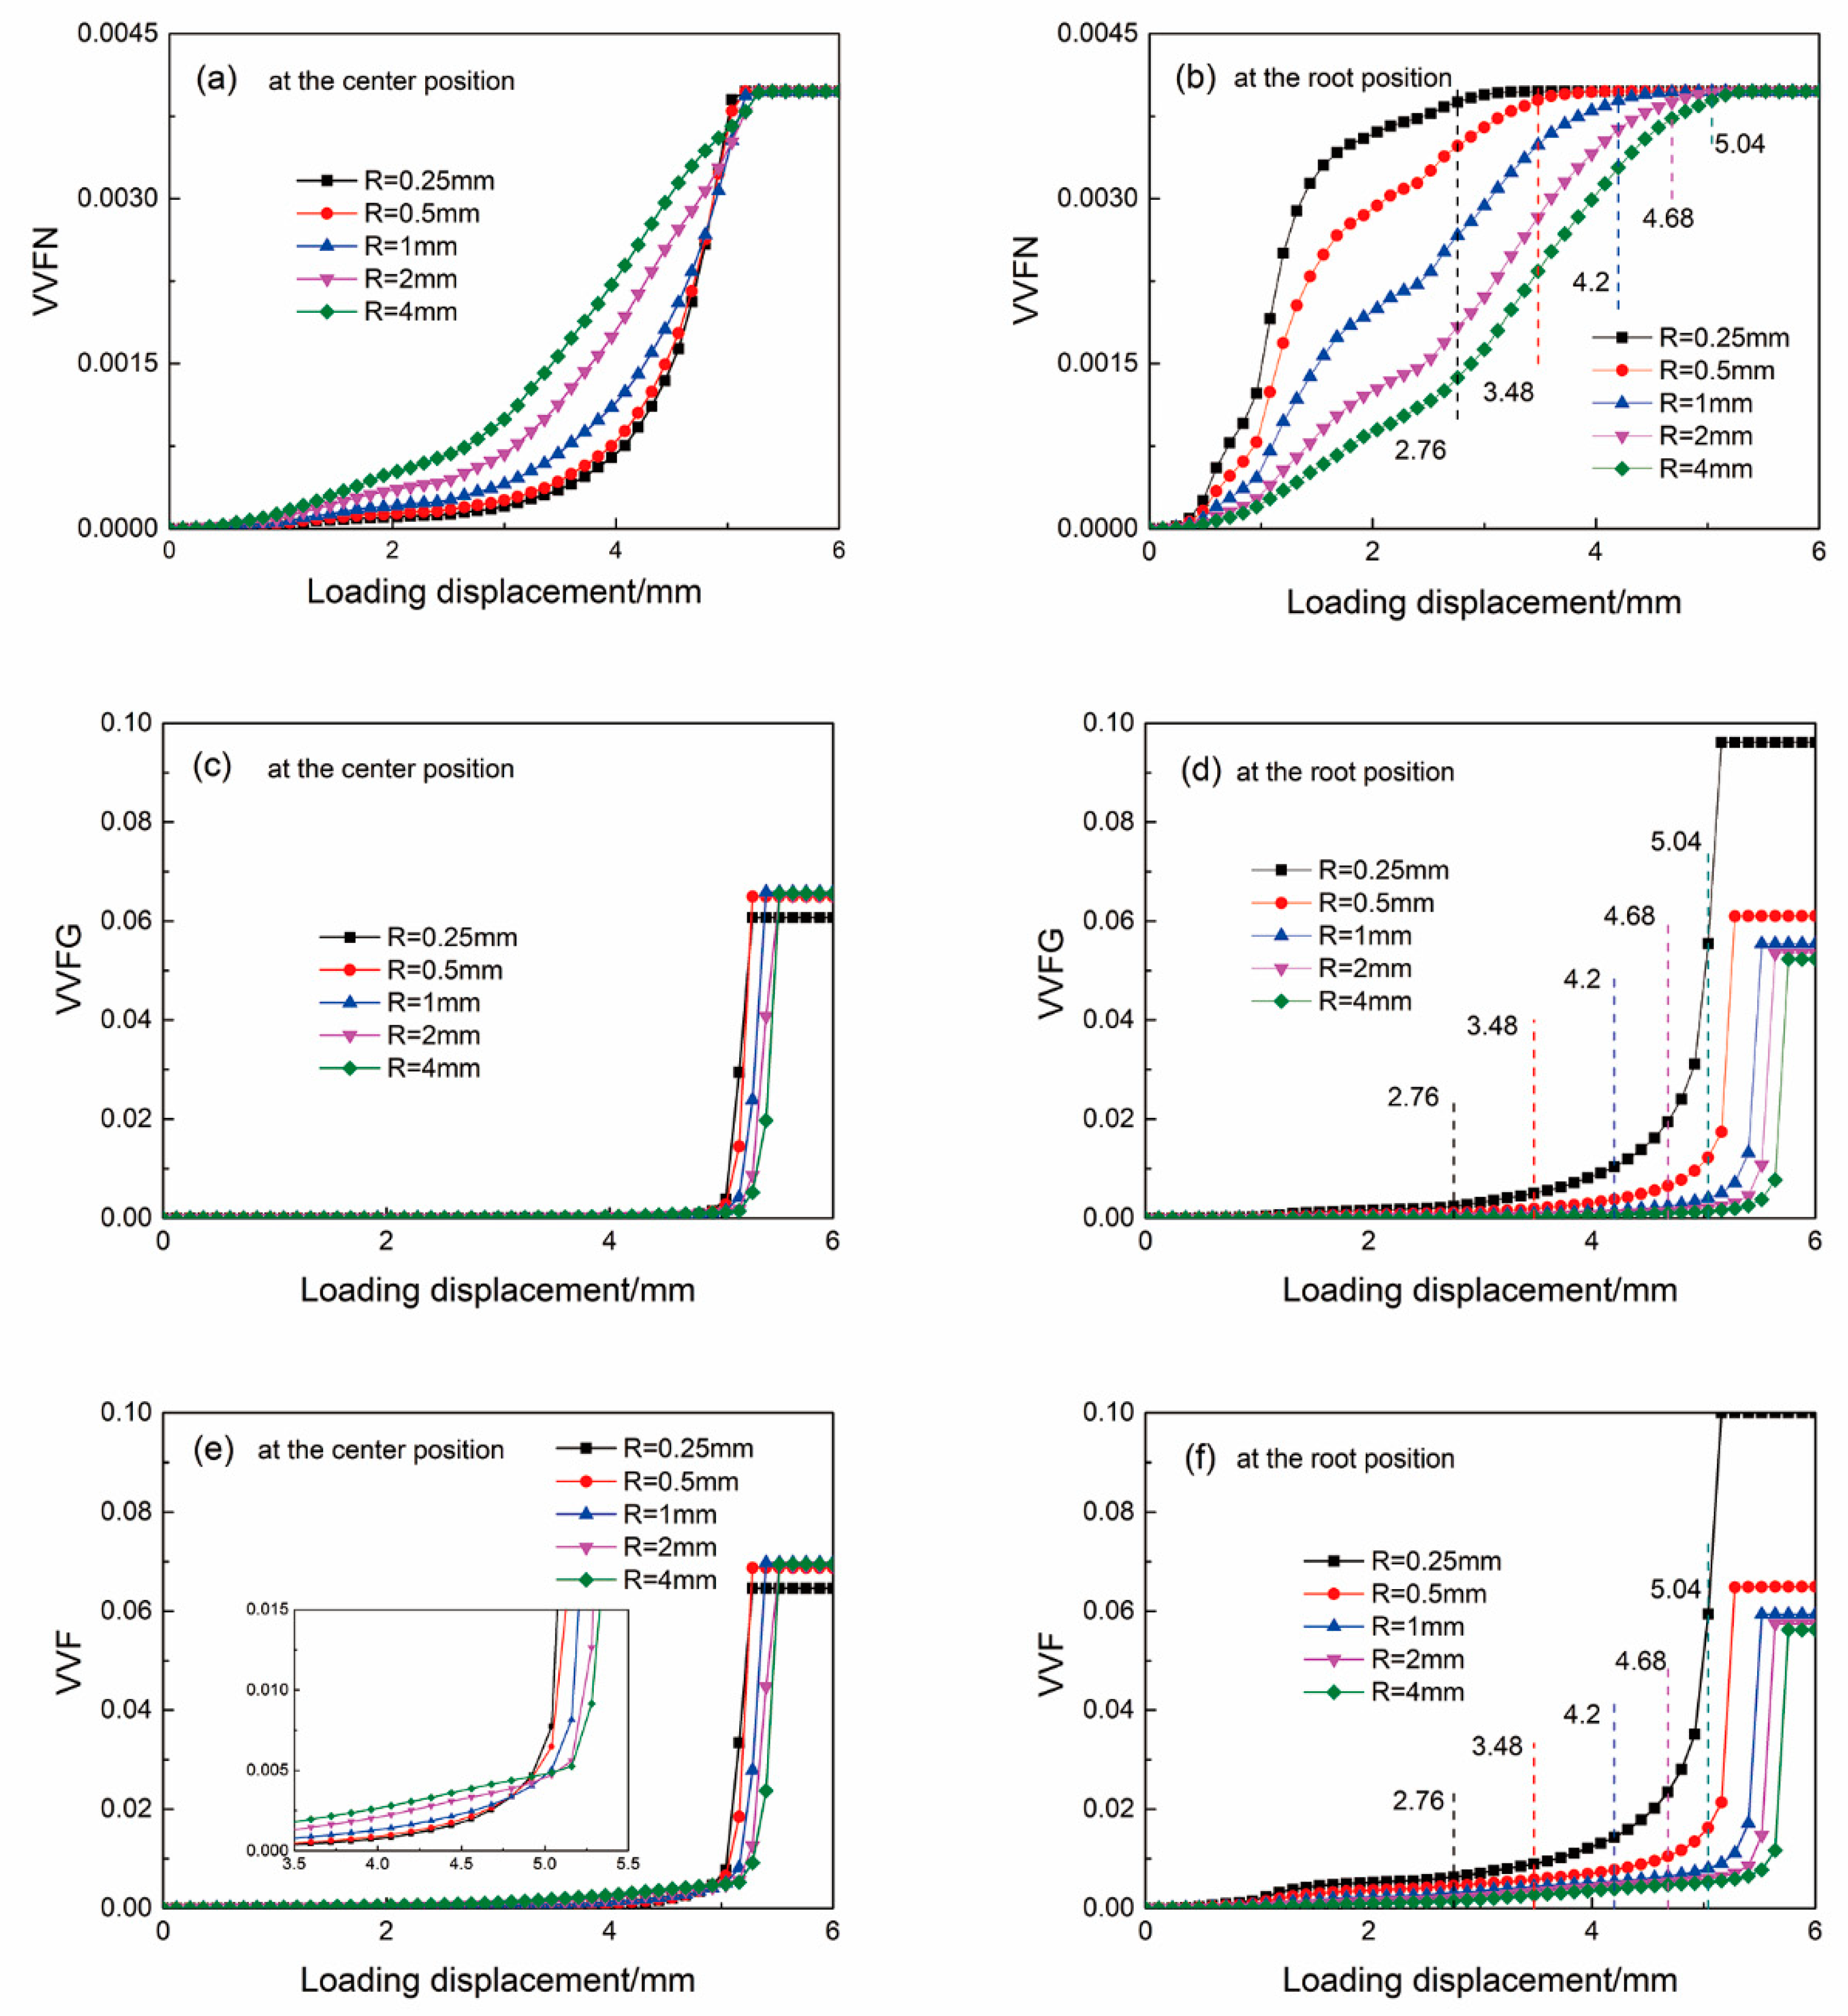
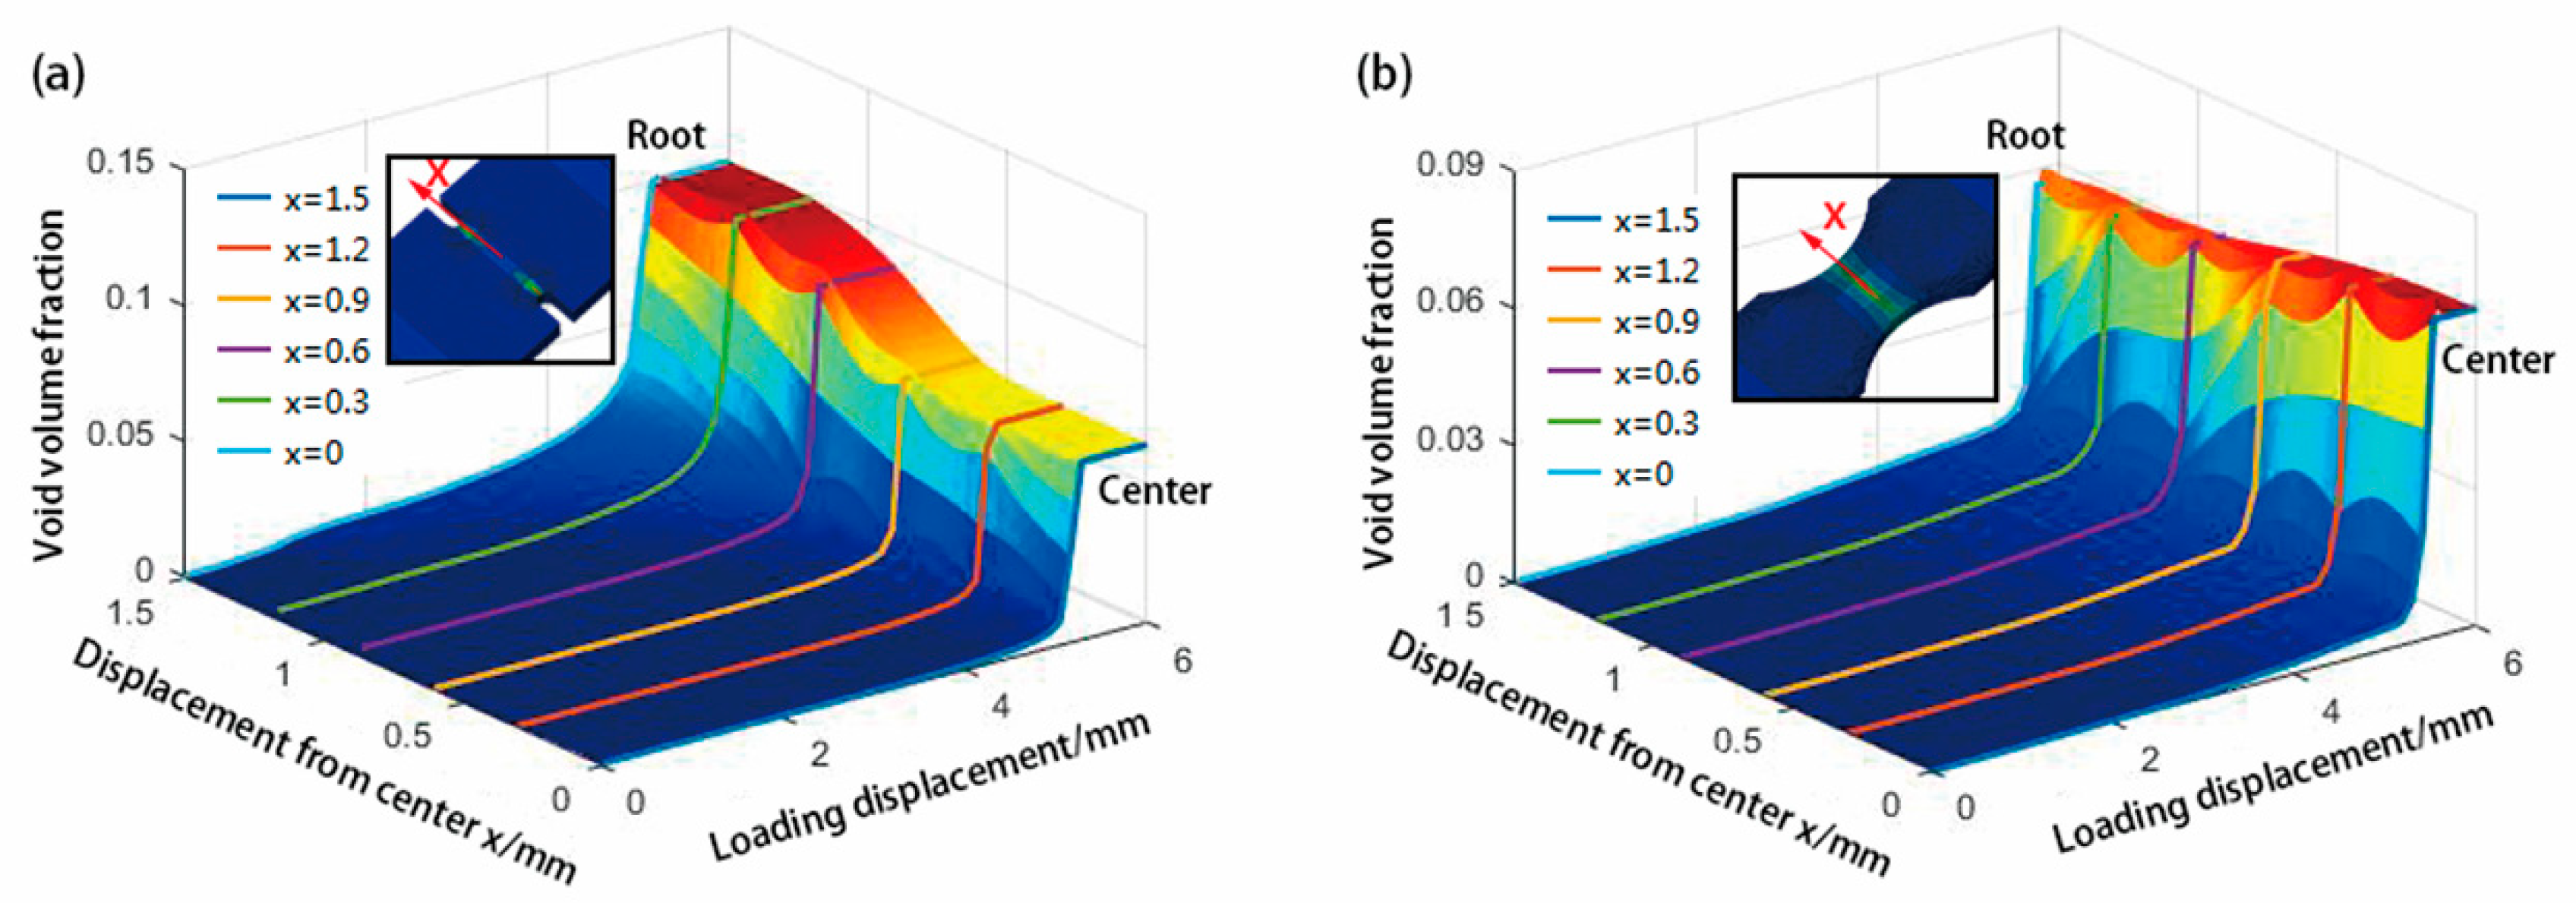
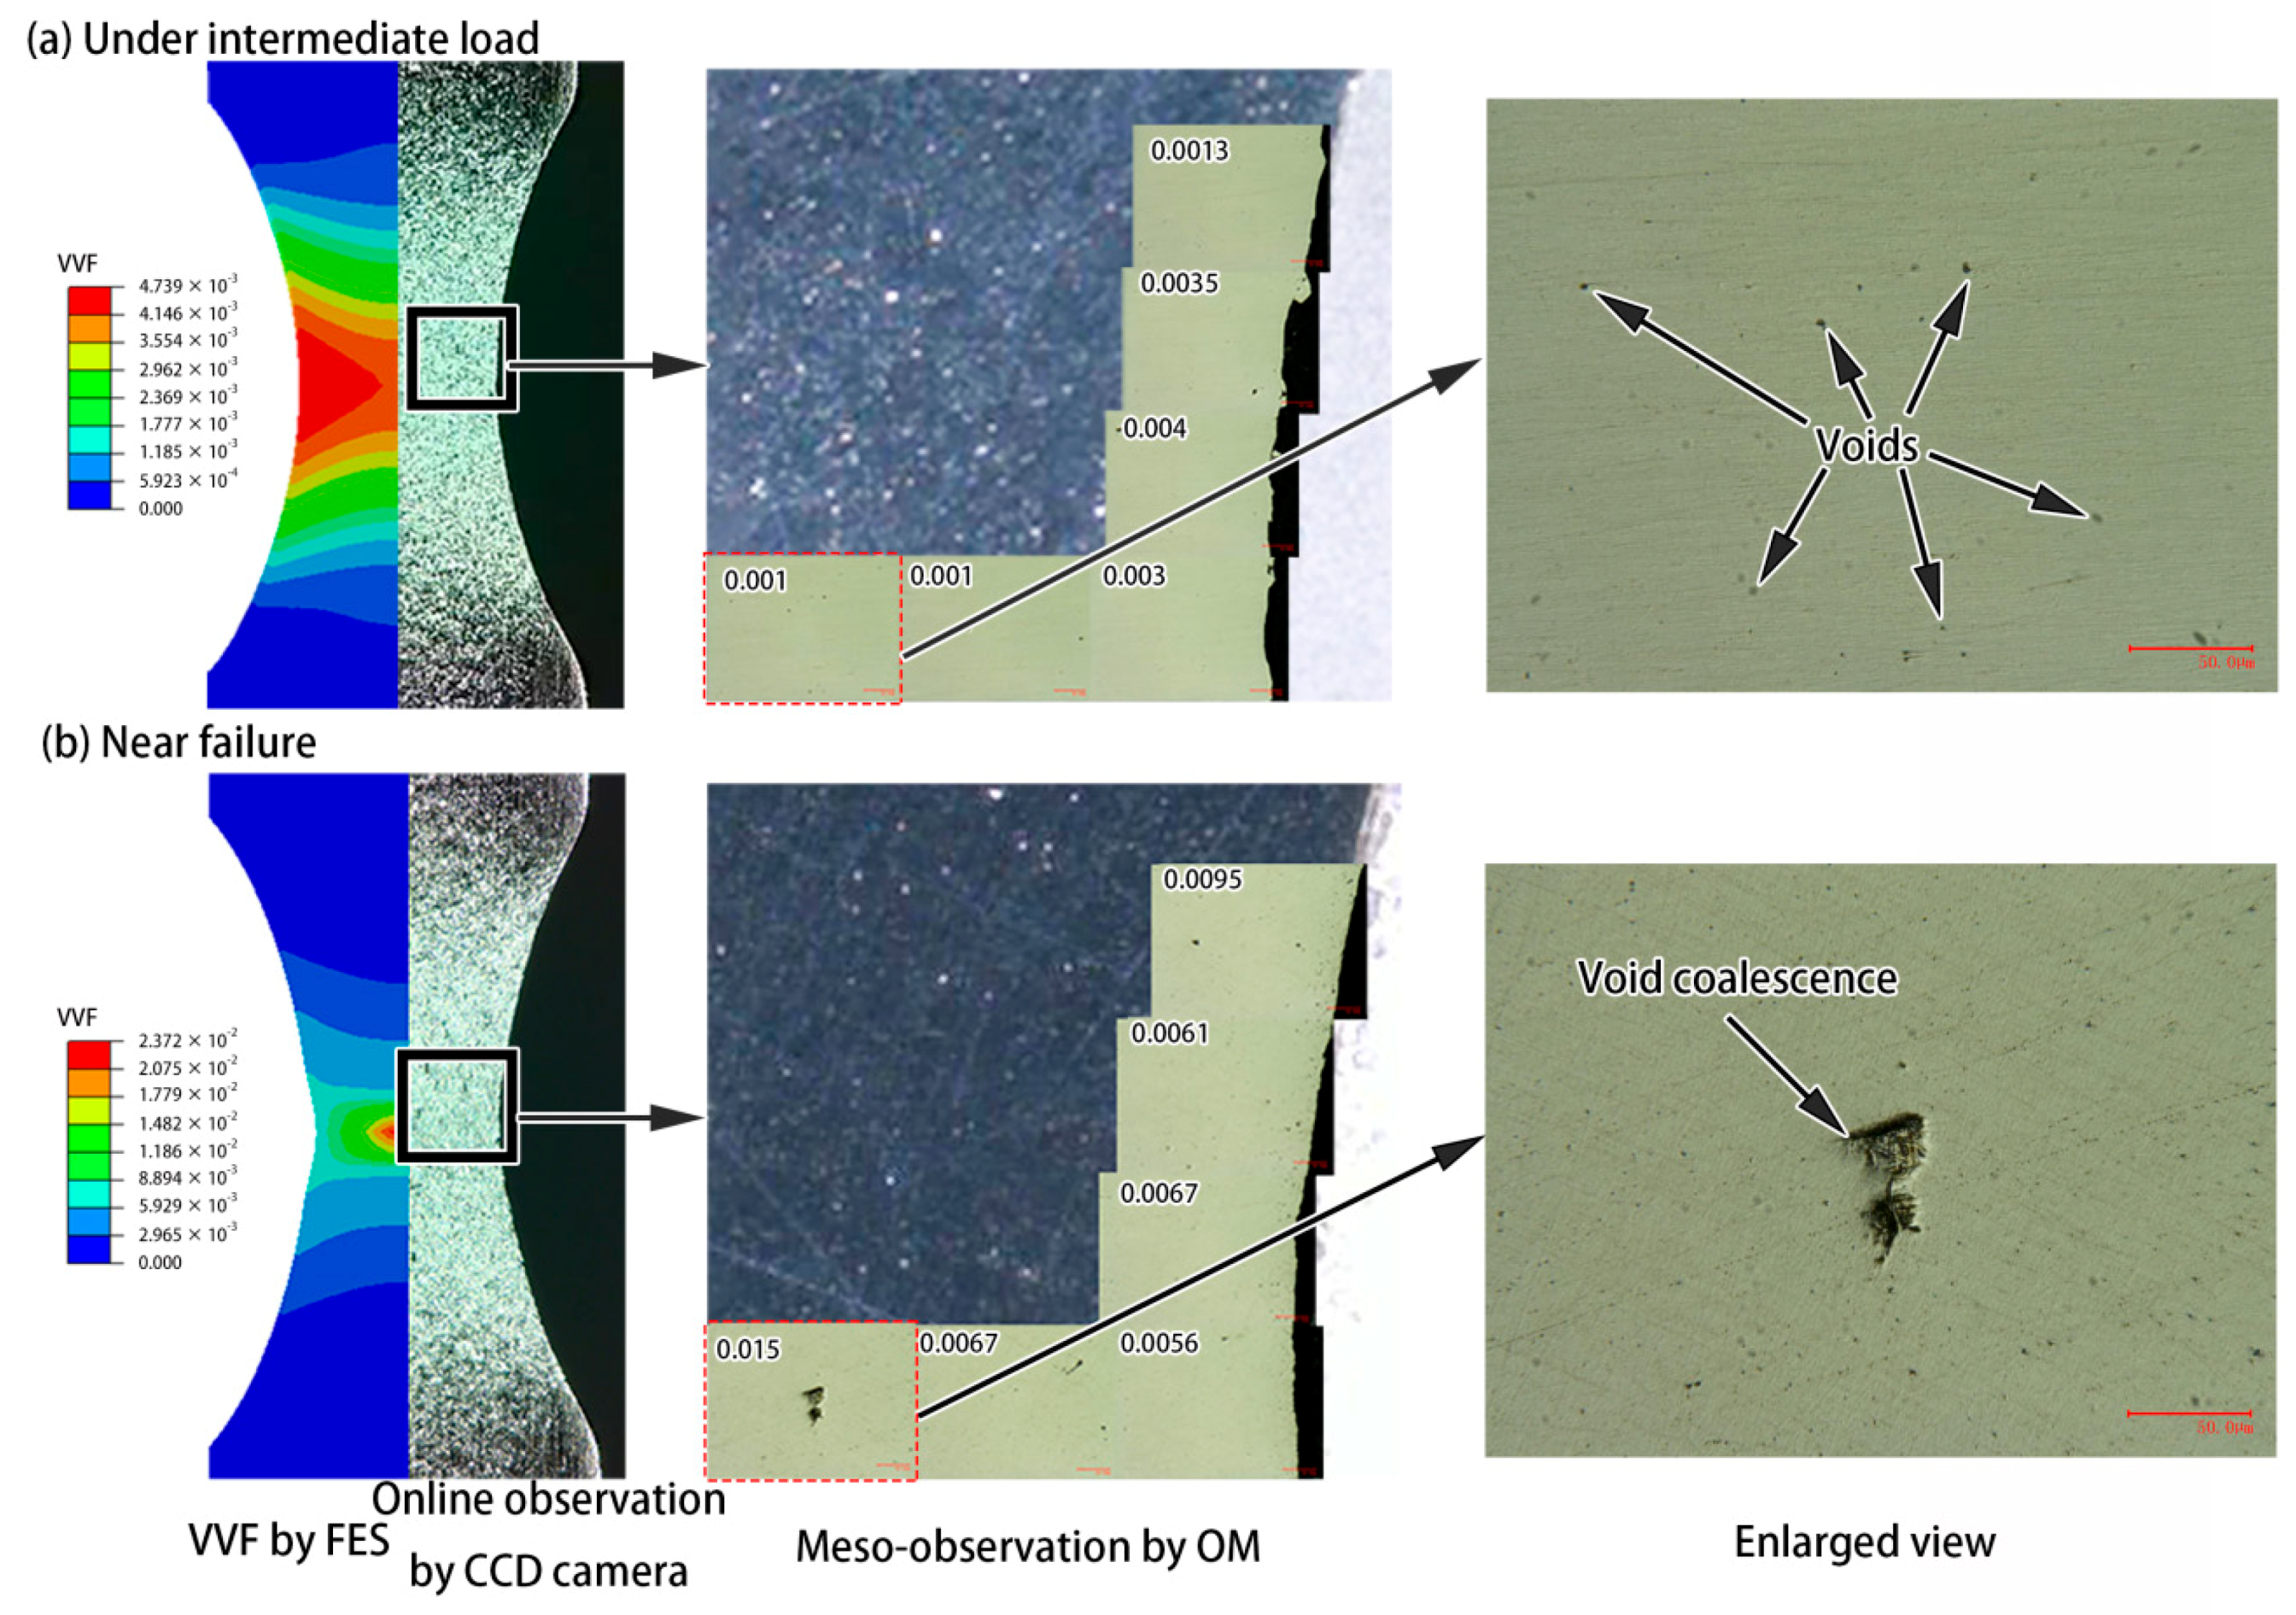
3.3.1. Effect of Stress Triaxiality on Plastic Damage Evolution

In order to understand the contributions of void nucleation and void growth to void volume fraction, Figure 11 presents variations of the void volume fraction due to nucleation (VVFN), the void volume fraction due to growth (VVFG) and the total void volume fraction (VVF) with loading displacement at center and root positions for different notched specimens by FES.

VVFN

From the view of VVFN as shown in Figure 11a, it can be observed that the VVFN at the center position increases slowly at first, and then increases rapidly and reaches the maximum value. The saturated VVFN values at center position for different notch sizes are close, but before reaching the saturation, the VVFN value of large notch size is greater than that of small notch size at the center position. Variation of VVFN with notch size at the root position as shown in Figure 11b is completely opposite with that at the center position, and the smaller the notch radius is, the earlier VVFN reaches the maximum value. As shown in Figure 11a,b, the VVFN is dependent on the notch radius and position, and the stress triaxiality has a significant influence on the void nucleation. In the view of the initial stress triaxiality at the notch root, the larger the initial stress triaxiality is, the larger the void nucleation volume fraction is and the earlier the VVFN reaches the saturation value.

VVFG

From the view of VVFG in Figure 11c, the values at the center position among different notch sizes are close before the VVFG reaching the sharply increasing stage. At the notch root, the VVFG value decreases with the increase in notch radius as shown in Figure 11d. The saturated VVFG value increases with the notch radius decreasing. Therefore, the VVFG at notch root is also significantly dependent on the initial stress triaxiality.

VVF

Comparing the VVF values at the center position in Figure 11e with those at the root position in Figure 11f, the VVF values of different notch radii are close at the center position; however, the VVF value decrease with the increase in notch radius at root position. As shown in Figure 11e at center position, the VVFs are close for different notch radius. However, as shown in Figure 11f at root position, the VVF is increasing with the decrease in the notch radius, especially for the minimum notch radius. At the notch root, the smaller the notch radius is, the earlier the VVF value reaches the maximum value, and the earlier the fracture occurs.
In order to understand the contribution of VVFN and VVFG to VVF, comparing the values of VVFN shown in Figure 11a,b and VVFG shown in Figure 11c,d, it can be found that the contributions of VVFG to VVF are greater than those of VVFN at both center and root positions. Therefore, the damage process of notched specimen is dominated by void growth.
Figure 11b,e,f are marked with the loading displacements where the stress triaxiality values fluctuate as discussed in Figure 6. It can be illustrated in Figure 11b,e that the loading displacements where the stress triaxiality values fluctuate are where the void volume fraction due to nucleation reaches the maximum value and the void volume fraction due to growth begins to sharply increase. Therefore, the fluctuation of the stress triaxiality value is caused by the void damage evolution.

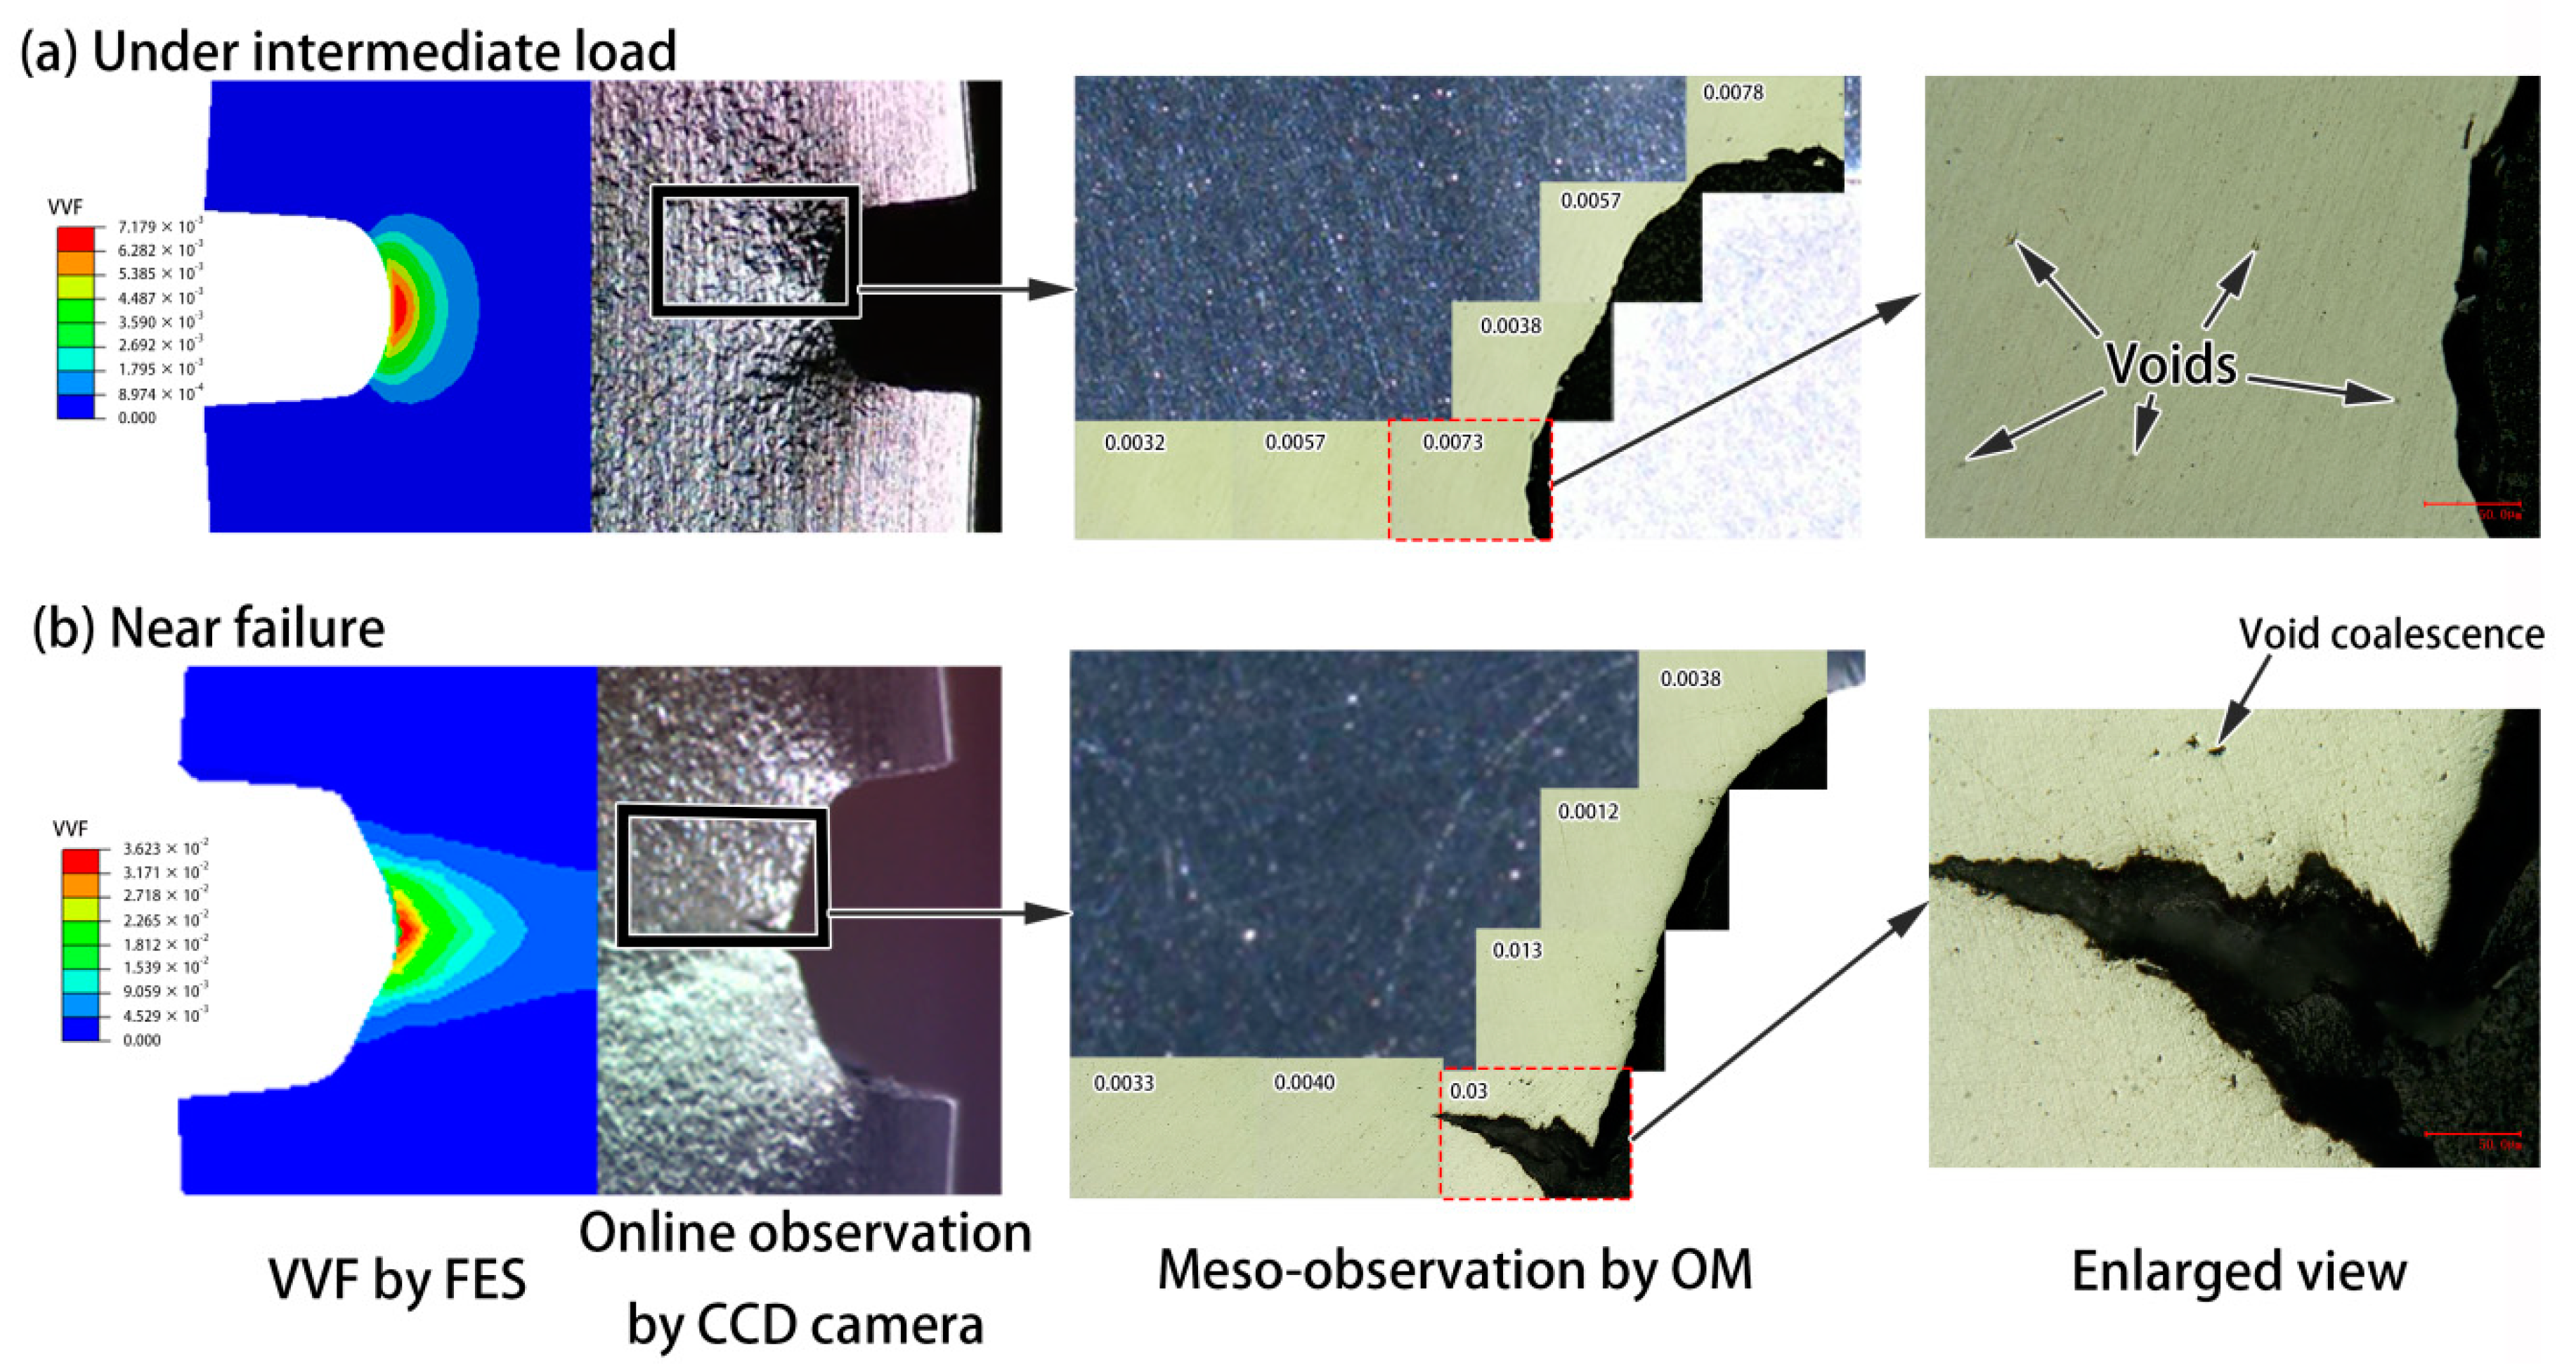
3.3.2. Transition of Failure Mode with Stress Triaxiality

In order to study the failure mode of notched specimen, variations of VVF from the center position to the root position during the tensile process are shown in Figure 12 for different notched specimens (R = 0.25 mm and R = 4 mm). At the initial loading placement, the VVFs of both small notch radius and large notch radius are at low levels. However, at large loading displacement, the VVF values sharply grow, and the difference between specimens with large notch radius and small notch radius is significant. It can be observed in Figure 12 that the maximum VVF value of the specimen with 0.25 mm notch radius appears at the notch root position, but the maximum VVF value of the specimen with 4 mm notched radius appears at the center position. With the notch radius increasing, the position of the maximum initial stress triaxiality value changes from the root position to the center position as discussed in Figure 6 and the position of the maximum VVF value also shifts from the root position to the center position as shown in Figure 12.
In order to understand the effect of stress triaxiality on the failure mode of notched specimen, Figure 13 and Figure 14 show the VVF distribution by FES, online observation by online charge coupled device (CCD) camera and void distribution observation by mesoscopic observation for specimens with small notch radius 0.25 mm and large notch radius 4 mm, respectively. It can be clearly observed from online CCD camera, the specimen surface become rough after stretching and slip bands concentrate at the notch root. For specimen with the small notch radius of 0.25 mm in Figure 13b, voids are coalescing at notch root and a crack is generated by void coalescence before failure. On the contrary, for specimen with large notch radius as 4 mm in Figure 14b, voids are coalescing at the center position, and the ductility failure start from the center position. Moreover, after the polished treatment of tested specimen, it can be observed that the void distribution is concentrated at the notch root under intermediate load, and there is little difference between specimens with small notch radius and large notch radius, as shown in Figure 13a and Figure 14a. However, when the specimen is near failure, the difference between specimens with large notch radius and small notch radius is significant as shown in Figure 13b and Figure 14b. Therefore, it can be deduced that, with the increase in notch radius, the degree of stress restraint decreases, and the fracture initiation position changes from the notch root position to the center position. The results of mesoscopic observation quite agree with those by damage analyses by FES in Figure 12. Therefore, from both views of VVF distributions by FES and mesoscopic observation by OM, the failure mode changes from crack initiation at the notch root position to ductility fracture with void coalescence at the center position, with the decrease in stress triaxiality.

4. Conclusions

The influence of stress triaxiality on the damage evolution and failure mode was investigated by FES with GTN model, DIC observation and mesoscopic observation. The main findings are listed below:
(1)
Combined with void fraction calculation by OM observation and plastic damage simulation by FES, the GTN damage parameters were determined for 316L, and the FES results were verified by experimental DIC observation.
(2)
From the damage simulation, the VVF at root position increases with the decrease in the notch radius, and the VVF due to growth dominates the void volume fraction evolution during tensile testing.
(3)
From both mesoscopic voids observation and plastic damage simulation, the failure mode changes from crack initiation at notch root to ductile fracture at the center position, with notch radius increasing and stress triaxiality decreasing. The position where the initial stress triaxiality is the largest is the position where the failure starts.

Author Contributions

Conceptualization and methodology, J.P. and Q.D.; Experiment, Y.W., FEA, J.P. and Y.W.; data curation, L.L.; writing—original draft preparation, J.P. and Y.W.; writing—review and editing, X.L. and Z.Z.

Funding

This research was funded by National Natural Science Foundation of China, grant number 51805230, 51505041.

Conflicts of Interest

The authors declare no conflict of interest.

References

  1. Martínez-Donaire, A.J.; Borregoo, M.; Morales-Palma, D.; Centeno, G.; Vallellano, C. Analysis of the influence of stress triaxiality on formability of hole-flanging by single-stage SPIF. Int. J. Mech. Sci. 2019, 151, 76–84. [Google Scholar] [CrossRef]
  2. Rodriguez-Millan, M.; Garcia-Gonzalez, D.; Rusinek, A.; Arias, A. Influence of stress state on the mechanical impact and deformation behaviors of aluminum alloys. Metals 2018, 8, 520. [Google Scholar] [CrossRef]
  3. Kato, T.; Ohata, M.; Nogami, S.; Tanigawa, H. Evaluation of impacts of stress triaxiality on plastic deformability of RAFM steel using various types of tensile specimen. Fusion Eng. Des. 2016, 109, 1631–1636. [Google Scholar] [CrossRef]
  4. Ma, Y.S.; Sun, D.Z.; Aurieux, F.; Zhang, K.S. Influences of initial porosity, stress triaxiality and Lode parameter on plastic deformation and ductile fracture. Acta Mech. Solida Sin. 2017, 30, 493–506. [Google Scholar] [CrossRef]
  5. Wen, J.F.; Tu, S.T.; Xuan, F.Z.; Zhang, X.W.; Gao, X.L. Effects of stress level and stress state on creep ductility, evaluation of different models. J. Mater. Sci. Technol. 2016, 32, 695–704. [Google Scholar] [CrossRef]
  6. Chandan, P.; Mahapatra, M.M.; Pradeep, K.; Saini, N. Effect of strain rate and notch geometry on tensile properties and fracture mechanism of creep strength enhanced ferritic P91 steel. J. Nucl. Mater. 2018, 498, 176–186. [Google Scholar]
  7. Erice, B.; Roth, C.C.; Mohr, D. Stress-state and strain-rate dependent ductile fracture of dual and complex phase steel. Mech. Mater. 2018, 116, 11–32. [Google Scholar] [CrossRef]
  8. Keshavarz, A.; Ghajar, R.; Mirone, G. A new experimental failure model based on triaxiality factor and Lode angle for X-100 pipeline steel. Int. J. Mech. Sci. 2014, 80, 175–182. [Google Scholar] [CrossRef]
  9. Yu, F.; Jar, P.Y.B.; Hendry, M.T. Constitutive analysis of pressure-insensitive metals under axisymmetric tensile loading, A stress triaxiality-dependent plasticity damage model. Int. J. Mech. Sci. 2018, 142, 21–32. [Google Scholar] [CrossRef]
  10. Zhang, H.; Zhang, H.; Li, F.; Cao, J. A Novel Damage Model to Predict Ductile Fracture Behavior for Anisotropic Sheet Metal. Metals 2019, 9, 595. [Google Scholar] [CrossRef]
  11. Zhang, Y.C.; Jiang, W.C.; Tu, S.T.; Wen, J.F. Simulation of creep and damage in the bonded compliant seal of planar solid oxide fuel cell. Int. J. Hydrogen Energy 2014, 39, 17941–17951. [Google Scholar] [CrossRef]
  12. Luo, Y.; Jiang, W.C.; Zhang, Y.C.; Zhou, F.; Tu, S.T. A new damage evolution model to estimate the creep fracture behavior of brazed joint under multiaxial stress. Int. J. Mech. Sci. 2018, 149, 178–189. [Google Scholar] [CrossRef]
  13. Luo, Y.; Jiang, W.C.; Zhang, W.Y.; Zhang, Y.C.; Woo, W.; Tu, S.T. Notch effect on creep damage for Hastelloy C276-BNi2 brazing joint. Mater. Des. 2015, 84, 212–222. [Google Scholar] [CrossRef]
  14. Huang, J.; Shi, D.Q.; Yang, X.G.; Pan, B.; Shi, H. Experimental investigation and numerical modeling for elasto-plastic notch-root stress/strain analysis under monotonic loadings. Sci. China Technol. Sci. 2014, 57, 1411–1424. [Google Scholar] [CrossRef]
  15. Benzerga, A.A. Plastic potentials for anisotropic porous solids. Eur. J. Mech. 2001, 20, 397–434. [Google Scholar] [CrossRef]
  16. Decamp, K.; Bauvineau, L.; Besson, J. Size and geometry effects on ductile rupture of notched bars in a C-Mn steel: Experiments and modelling. Int. J. Fract. 1997, 88, 1–18. [Google Scholar] [CrossRef]
  17. Besson, J.; Devillers-Guerville, L.; Pineau, A. Modeling of scatter and size effect in ductile fracture: Application to thermal embrittlement of duplex stainless steels. Eng. Fract. Mech. 2000, 67, 169–190. [Google Scholar] [CrossRef]
  18. Gurson, A.L. Porous rigid-plastic materials containing rigid inclusions-yield function, plastic potential, and void nucleation. In The Physical Metallurgy of Fracture, Proceedings of the Fourth International Conference on Fracture, Waterloo, Canada, 19–24 June 1977; Taplin, D.M.R., Ed.; Elsevier: Amsterdam, The Netherlands, 1978; Volume 2, pp. 357–364. [Google Scholar]
  19. Rice, J.R.; Tracey, D.M. On the ductile enlargement of voids in triaxial stress fields. J. Mech. Phys. Solids 1969, 17, 201–217. [Google Scholar] [CrossRef]
  20. Chen, M.S.; Lin, Y.C. Numerical simulation and experimental verification of void evolution inside large forgings during hot working. Int. J. Plast. 2013, 49, 53–70. [Google Scholar] [CrossRef]
  21. Besson, J. Continuum models of ductile fracture, a review. Int. J. Damage Mech. 2010, 19, 3–52. [Google Scholar] [CrossRef]
  22. Needleman, A.; Tvergaard, V. An analysis of ductile rupture in notched bars. J. Mech. Phys. Solids 1984, 32, 461–490. [Google Scholar] [CrossRef]
  23. Tvergaard, V. Influence of voids on shear band instabilities under plane strain conditions. Int. J. Fract. 1981, 17, 389–407. [Google Scholar] [CrossRef]
  24. Tvergaard, V.; Needleman, A. Analysis of the cup-cone fracture in a round tensile bar. Acta Metall. 1984, 32, 157–169. [Google Scholar] [CrossRef]
  25. Ten, B.G.; Wang, W.N.; Xu, Y.C. Ductile fracture prediction in aluminium alloy 5A06 sheet forming based on GTN damage model. Eng. Fract. Mech. 2017, 186, 242–254. [Google Scholar]
  26. Giang, N.A.; Kuna, M.; Hütter, G. Influence of carbide particles on crack initiation and propagation with competing ductile-brittle transition in ferritic steel. Theor. Appl. Fract. Mech. 2017, 92, 89–98. [Google Scholar] [CrossRef]
  27. Sun, Q.; Zan, D.; Chen, J.J.; Pan, H.L. Analysis of edge crack behavior of steel sheet in multi-pass cold rolling based on a shear modified GTN damage model. Theor. Appl. Fract. Mech. 2015, 80, 259–266. [Google Scholar] [CrossRef]
  28. Peng, J.; Li, K.S.; Zhou, C.Y. Construction of whole stress-strain curve by small punch test and inverse finite element. Results Phys. 2018, 11, 440–448. [Google Scholar]
  29. Lin, Y.C.; Jiang, X.Y.; Shuai, C.J.; Zhao, C.Y.; He, D.G.; Chen, M.S.; Chen, C. Effects of initial microstructures on hot tensile deformation behaviors and fracture characteristics of Ti-6Al-4V alloy. Mater. Sci. Eng. A 2018, 711, 293–302. [Google Scholar] [CrossRef]
  30. Lin, Y.C.; Yang, H.; Xin, Y.C.; Li, C.Z. Effects of initial microstructures on serrated flow features and fracture mechanisms of a nickel-based superalloy. Mater. Charact. 2018, 144, 9–21. [Google Scholar] [CrossRef]
  31. Gerstein, G.; Besserer, H.B.; Nürnberger, F.; Barrales-Mora, L.A.; Shvindlerman, L.S.; Estrin, Y.; Maier, H.J. Formation and growth of voids in dual-phase steel at microscale and nanoscale levels. J. Mater. Sci. 2017, 52, 4234–4243. [Google Scholar] [CrossRef]
  32. Wen, J.F.; Tu, S.T. A multiaxial creep-damage model for creep crack growth considering cavity growth and microcrack interaction. Eng. Fract. Mech. 2014, 123, 197–210. [Google Scholar] [CrossRef]
  33. Garrison, W. Ductile fracture. J. Phys. Chem. Solids 1987, 48, 1035–1074. [Google Scholar] [CrossRef]
  34. Needleman, A. A continuum model for void nucleation by inclusion debonding. J. App. Mech. 1987, 54, 525–531. [Google Scholar] [CrossRef]
  35. Saeidia, N.; Ashrafizadeha, F.; Niroumanda, B.; Forouzanb, M.R.; Mohseni-Mofidib, S.; Barlatc, F. Void coalescence and fracture behavior of notched and un-notched tensile tested specimens in fine grain dual phase steel. Mater. Sci. Eng. A 2015, 644, 210–217. [Google Scholar] [CrossRef]
  36. Peng, J.; Li, K.S.; Dai, Q.; Peng, J. Mechanical properties of pre-strained austenitic stainless steel from the view of energy density. Results Phys. 2018, 10, 187–193. [Google Scholar] [CrossRef]
  37. Lin, L.X.; Xu, M.J.; Xu, J.J.; Lu, H.; Ye, C.H.; Yu, C.; Chen, J.M. Measurement and evaluation of strain fields in T23 steel based on digital image correlation method. J. Cent. South. Univ. 2017, 24, 1977–1985. [Google Scholar] [CrossRef]
  38. Chu, C.C.; Needleman, A. Void nucleation effects in biaxially stretched sheets. J. Eng. Mater. Technol. 1980, 102, 249–256. [Google Scholar] [CrossRef]
  39. Qian, L.Y.; Fang, G.; Zeng, P.; Wang, Q. Experimental and numerical investigations into the ductile fracture during the forming of flat-rolled 5083-O aluminum alloy sheet. J. Mater. Process. Technol. 2015, 220, 264–275. [Google Scholar] [CrossRef]
  40. Tvergaard, V. On localization in ductile materials containing spherical voids. Int. J. Fract. 1982, 18, 237–252. [Google Scholar]
  41. Huang, J.; Guo, Y.Z.; Qin, D.Y.; Zhou, Z.X.; Li, D.D.; Li, Y.L. Influence of stress triaxiality on the failure behavior of Ti-6Al-4V alloy under a broad range of strain rates. Theor. Appl. Fract. Mech. 2018, 97, 48–61. [Google Scholar] [CrossRef]
  42. Ying, L.; Liu, W.Q.; Wang, D.T.; Hu, P. Parameter calibration of GTN damage model and formability analysis of 22MnB5 in hot forming process. J. Mater. Eng. Perform. 2017, 26, 5155–5165. [Google Scholar] [CrossRef]
  43. Jiang, W.; Li, Y.Z.; Su, J. Modified GTN model for a broad range of stress states and application to ductile fracture. Eur. J. Mech. A-Solid 2016, 57, 132–148. [Google Scholar] [CrossRef]
  44. Geramita, A.V.; Seberry, J. Orthogonal Designs: Quadratic Forms and Hadamard Matrices; Marcel Dekker: New York, NY, USA, 1979. [Google Scholar]
  45. Bridgman, P.W. Studies in Large Plastic Flow and Fracture: With Special Emphasis on the Effects of Hydrostatic Pressure; Harvard University Press: Cambridge, MA, USA, 1964. [Google Scholar]
Figure 1. Tensile testing specimens: (a) specimen without notch, notched specimens with root radius of (b) 0.25 mm, (c) 0.5 mm, (d) 1 mm, (e) 2 mm, (f) 4 mm and (g) dimension of notched specimen (mm).
Metals 09 01067 g001
Figure 2. Strain field observation by digital image correlation (DIC): (a) speckle patterns of the notched specimen (R = 2 mm), (b) mesh for calculation and (c) strain field contour plot.
Metals 09 01067 g002
Figure 3. Mesoscopic observation of voids: (a) true stress-true strain curve, (b) optical microscope (OM) of original material, (c) OM of the onset of voids coalescence, (d) OM near failure, (e) extracted voids of original material, (f) extracted voids of the onset of voids coalescence, (g) extracted voids near failure, (h) void percentage of different stages. Note: PN is the pixel number.
Metals 09 01067 g003
Figure 4. Strain contour plots for notched specimens at different loading displacements: (a,b) 1 mm, (c,d) 3 mm and (e,f) 5 mm.
Metals 09 01067 g004
Figure 5. Comparison of the loading displacement-strain curves at the center position.
Metals 09 01067 g005
Figure 6. Evolution of stress triaxiality for notched specimens with different notch radii: (a) point location, (b) at the center position, (c) at the middle position and (d) at the root position.
Metals 09 01067 g006
Figure 7. Strain evolution for notched specimens with different notch radii by DIC observation: (a) R = 0.25 mm, (b) R = 0.5 mm, (c) R = 1 mm, (d) R = 2 mm, (e) R = 4 mm and (f) at the center position.
Metals 09 01067 g007
Figure 8. Variations of equivalent plastic strain with loading displacement by finite element simulation (FES): (a) at the center position and (b) at the root position.
Metals 09 01067 g008
Figure 9. Variation of strain from center to root of notched specimens at different loading displacements: (a) 1 mm, (b) 3 mm and (c) 5 mm.
Metals 09 01067 g009
Figure 10. Variation of fracture strain with initial stress triaxiality and notch size.
Metals 09 01067 g010
Figure 11. Variations of void volume fraction due to nucleation (VVFN), void volume fraction due to growth (VVFG) and void volume fraction (VVF) with loading displacement: (a,c,e) at the center position and (b,d,f) at the root position.
Metals 09 01067 g011
Figure 12. VVF distribution for specimen with notch size of (a) R = 0.25 mm and (b) R = 4 mm.
Metals 09 01067 g012
Figure 13. VVF and void distributions for specimen with R = 0.25 mm: (a) under intermediate load, and (b) near failure.
Metals 09 01067 g013
Figure 14. VVF and void distributions for specimen with R = 4 mm: (a) under intermediate load and (b) near failure.
Metals 09 01067 g014
Table 1. Factors and levels of parameters.
Level ε N [26,41] s N [28] f N [42,43]
Level 10.20.080.004
Level 20.250.10.01
Level 30.30.120.02
Table 2. Orthogonal arrays with L 9 3 3 and error results.
Experiment ε N s N f N Error (%)
11119.74
212311.2
313210.9
421316.7
522210.7
62319.66
731210.21
83219.69
933310.47
k ¯ 1 j 10.6112.229.70
k ¯ 2 j 12.3510.5310.60
k ¯ 3 j 10.1210.3412.79
Table 3. Determined parameters of the Gurson-Tvergaard-Needleman (GTN) damage model.
q 1 q 2 q 3 f 0 f c f F ε N s N f N
1.512.250.00120.0420.0920.30.120.004

