Article

The Effect of Position of Materials on a Build Platform on the Hardness, Roughness, and Corrosion Resistance of Ti6Al4V Produced by DMLS Technology

1
Department of Mechanical Technology and Materials, Faculty of Mechanical Engineering, Technical University of Košice, Košice 040 01, Slovakia
2
Department of Applied Mathematics and Informatics, Faculty of Mechanical Engineering, Technical University of Košice, Košice 040 01, Slovakia
3
Department of Biomedical Engineering and Measurement, Faculty of Mechanical Engineering, Technical University of Košice, Košice 040 01, Slovakia
*
Author to whom correspondence should be addressed.
Metals 2019, 9(10), 1055; https://doi.org/10.3390/met9101055
Submission received: 5 September 2019 / Revised: 24 September 2019 / Accepted: 27 September 2019 / Published: 28 September 2019

Abstract

:
This article is focused on the effect of position on a build platform on the hardness, roughness and corrosion rate of parts (Ti6Al4V) produced by direct metal laser sintering (DMLS) technology. During the sintering process, the test samples were located at key positions—at the corners and in the middle of the build platform. An experimental program started with a microstructure investigation in two perpendicular directions in individual positions. The selected mechanical property—hardness—was investigated on metallographic cuts in both directions and all positions, and data sets underwent a statistical analysis (analysis of variance (ANOVA), t-test, F-test). The same procedure was repeated for an assessment of position effect to surface roughness (Kruskal–Wallis test) and material corrosion resistance. On the build platform, the course of hardness, roughness, and corrosion rate values that can be expected in individual positions was mapped in detail.

1. Introduction

Additive manufacturing of prototypes is becoming commonplace in many industrial areas. It provides a high production speed, processing a wide range of materials, the ability to produce complex components with a compact or porous structure containing various ribs, bulkheads, bridges, and even has the potential to build multiple parts in one process, maintaining joints, hinges, etc. [1]. The selected properties of the products can largely be altered by a controlled porosity from almost compact material to scaffold structures [2,3,4,5,6]. In addition, it is possible to design the appropriate shape of the individual scaffold cells as well as their orientation with respect to the stresses of the product [7]. In examining the impact of the orientation of the porous structures against the stress direction, the scope of interest has also been extended to the impact of the orientation of compact products on the building platform, in particular on mechanical properties and fatigue resistance [8,9,10,11,12,13,14,15].
However, the resulting product orientation with respect to build direction must be a compromise between the requirement of achieving optimum mechanical properties and the manufacturability of the prototype. The fact that additive manufacturing processes do not require tools once led to the assumption that there are no rules, or that there is no need for rules governing design for additive manufacturing. Although direct metal laser sintering (DMLS) may not comply with conventional design rules, there are procedures that apply to this process, especially when considering cost and waste reduction [16]. The proper orientation of the product on the plate in the vertical plane towards the build direction significantly affects the need for support structures. They provide support for the actual melted layer, protect from deformation, and dissipate heat from the geometry being built. Supporting structures are necessary especially when downward-facing structures, large openings on vertical walls, overhanging or angled surfaces are going to be produced. If an inclination angle does not exceed the critical value (e.g., 20–30° for Ti alloys), they can be considered as self-supporting without the need for a supporting structure. The support structure represents the loss of both material and energy needed to create and remove it. There is a risk of heat build-up in products with a large top-view area. This can affect a built geometry, especially when using titanium-based alloys. Very high temperatures in the DMLS process can cause considerable stresses in the component. These stresses can lead to delamination of the component layers, cracking, and wall collapse during manufacturing or finishing operations [17]. The solution may be to tilt the workpiece against the platform, thereby significantly minimizing the horizontal cross-section in each layer produced. In the manufacture of slim, tall products, it should be remembered that the long axis of the product can be identical to the build direction only if the height-to-section ratio does not exceed 8:1. However, the orientation/rotation of the product on the platform in the horizontal plane relative to the recoater blade movement is also important. As the recoater blade passes above the part and deposits next layer of powder, it may touch the layer below it, sometimes by force. The orientation of the part relative to the recoater movement is therefore important. It is inappropriate to orient thin walls parallel to the recoater blade because the blade tends to “bounce” off the parallel wall. The parts must be turned at least 5° towards the blade [16].
The nature of the DMLS process allows multiple parts to be built in situ simultaneously. This can save considerable time and cost to build the appropriate geometry. This is a strategic advantage of additive technologies over conventional technologies. Focusing on dental prosthesis, additive manufacturing displaces conventional technologies such as casting procedures and competes with modern technologies such as CAD (Computer Aided Design) milling, which are lagging behind due to a low material efficiency. While the daily production of dental replacements made by conventional hand-operated casting techniques is limited to up to twenty, automated sintering technology allows the production of several hundreds of dental units within 24 h. The time required to work in a dental laboratory is considerably shorter, and the dentist can do other activities [18]. For process efficiency, the platform is not included in the production until it is fully occupied by implants (90–120 units). However, the production of quality implants is not only a matter of high hourly production. Homogeneous and stable properties are expected from each product. The homogeneity of the microstructure and the consistency of the product properties are key to ensuring the repeatability of the production process. It is important for medical device manufacturers to know all input, process, and output parameters that could affect the quality of anatomically matched medical devices, also called patient-matched devices. The extensive reviews compiled by Grasso [17] and Agius [19] have consistently concluded that, despite the continuous technological improvement of additive manufacturing of metals, deficiencies in process repeatability and stability of properties are still an obstacle to the massive deployment of additive technologies in industry. In addition to the above-mentioned studies on the impact of build orientation on many product properties, the question of the impact of product position on the build platform also arises. Variation of properties in different positions on the build platform can be expected due to the technology—the nature of the DMLS process, where the laser beam is deflected from a central position to fill the contours of the product within areal dimensions of the platform. The powder near the edges of the build platform interacts with the laser beam at a significantly smaller angle than the powder at the center of the platform. The laser beam is projected onto the surface of the powder spread by the recoater, with the projection area near the edges of the platform being significantly larger than in the center of the platform, and thus the energy density is lower. This may result in insufficient melting of the powder near the edges of the platform and the associated increased presence of defects, in particular the lack-of-fusion type. The uneven expected distribution of defects on the platform inevitably leads to unequal mechanical properties, unequal roughness, dimensional accuracy, geometric precision, and different residual stress distributions [20,21,22]. These phenomena were observed by Oter [23] in products made of steel powder on the same sintering device as the authors of this article. A detailed cataloguing of defects and identification of possible sources was developed by Grasso and Colosimo in [17].
Another source of inhomogeneity of the resulting product properties is to be sought again in DMLS technology and is linked to the washing of the chamber with an inert gas to prevent the powder from oxidizing during the DMLS process. In his review [19], Agius states that the inert gas flow through the production chamber is not uniform and may therefore affect the porosity level of the components produced (and consequently, their mechanical properties). Uneven gas flow causes reduced condensate removal from the melting process. Insufficient removal of condensate, ejected powder, and spatter can cause collision with the recoater during spreading of the next powder layer and failure to observe layer thickness. This again leads to lack-of-fusion defects. Another reason for part inhomogeneity across the building platform can be non-uniform powder deposition on the building platform caused by powder parameters [24], powder moisture content, powder flowability, powder morphology, etc. In the mentioned studies, the impact of positioning on the corrosion properties of products was not studied, so the authors decided to address this issue in the interest of the novelty of the article. They assume that a different energy density when sintering the powder at different positions on the platform, manifested by different levels of internal stresses and mechanical properties, could also result in a change in the corrosion rate. The abovementioned questions directed the research activities of the authors and motivated them to write this paper.
The experimental program in the presented research was focused on determining the effect of implant placement on the building platform, represented by the test samples, on the stability of their mechanical properties, surface microgeometry, and corrosion resistance. The test samples were made using DMLS technology, placed in strategic positions—at the corners and in the center of the building platform. The stability of mechanical properties was tested by measuring the microhardness of materials in two perpendicular directions and evaluation by statistical methods.

2. Materials and Methods

For production of the test samples, gas atomized powder of Ti6Al4V alloy, grade 5, was used. The α-β microstructure typically consists of a Widmanstätten pattern consisting of alternating needles of both phases. The structure is characterized by high strength and satisfactory malleability [25]. The material meets the standard ASTM F136 [26]. The maximum particle size d50 is 39 ± 3 μm.

2.1. DMLS Parameters

Test samples were made by DMLS technology using an EOSINT M 280 sintering device (EOS-Electro Optical Systems, München, Germany) equipped with a high-energy CO2 laser system. Parameters of sintering: laser power: 170 W, scanning speed: 1250 mmps, thickness of the layer: 30 μm, protective atmosphere: argon.

2.2. Test Samples

The dimension of the samples was 20 mm × 20 mm × 2 mm. The samples differed only in the position on the build platform during sintering (see Figure 1a). The samples were tested as-build, without heat treatment.

2.3. Collection of Samples for Metallographic Observation

Samples were taken from the produced blocks for metallographic study and to measure the material hardness in two perpendicular directions—perpendicular to the sintered layers (⊥) and parallel to the sintering plane (‖).
After collection, the samples were mounted into acrylic resin and prepared by grinding on a set of sandpapers and polishing using a silica suspension. The etching was performed with Kroll etching agent within 5–10 s at 25 °C.

2.4. Material Hardness Testing

The hardness measurement was performed on metallographic cuts using a Shimadzu HMV2 (Shimadzu, Kyoto, Japan), a load of 980.7 mN, and a dwell time of 15 s (HV 0.1). The measuring pattern is shown in Figure 1b. For each position on the build platform, 30 indentations were carried out in each direction.

2.5. Material Roughness Testing

The samples were also subjected to roughness measurements. The measurement was carried out by the Surftest SJ-201 contact profilometer (Mitutoyo, Tokyo, Japan). The instrument parameters applied in the measurement were as follows: mean line system, cut-off length 0.8 mm, number of sampling lengths: 5, evaluation length: 4 mm, number of measurements: 50.
Measurements of roughness were performed in compliance with ISO 4287, which defines individual height and spacing parameters. As the roughness assessment was insufficient with only one parameter, a set of parameters was chosen to accurately capture the character of the surfaces. These are the following parameters:
  • arithmetical mean deviation of the assessed profile (Ra),
  • maximum height of profile (Rz),
  • mean width of the profile elements (RSm).
The 3D surface texture was created by a contact profilometer. The resulting spatial image of the surface was generated by aligning the profilographs obtained by scanning parallel planes (perpendicular to the sample building direction) at a defined scanning distance of 0.1 mm. To display one type of surface, an X × Y × Z data matrix was available, where X was the number of rows, each row containing a certain number of measured discrete points of the profile on the evaluated length as the profile height deviation (Z) from the mean line of the profile, and Y was the number of columns, i.e., number of parallel planes. For 3D surface representation, the measured data were covered by surface area using Matlab R2017a software, MathWorks Inc., Natick, MA, USA.

2.6. Methodology of Statistical Analysis of Material Hardness

A statistical analysis was performed with the intention of determining statistically significant differences in the hardness:
  • in different position on the build platform, evaluated in particular direction-comparisons within samples A–E in the perpendicular direction and separate comparison within samples A–E in the parallel direction (analysis of variance (ANOVA), Tukey’s honest significant difference (HSD) test),
  • in two different directions within particular positions on the build platform—comparison between perpendicular and parallel directions within position A, and similarly in position B, C, D, and E (t-test).
One-way ANOVA was used to investigate the variability of a variable (hardness), assuming that one factor affects the variable (position). Variability was measured by the sum of squares of deviations from the overall average. In our case, the variable was the hardness of the material, and the influencing factor was the position on the build platform. The aim of the test was therefore to determine whether the position on the platform affects the hardness (comparison between 5 groups of samples—positions on the build platform). The following hypotheses were formulated for the purposes of the test:
H0: μ1 = μ2 =…. μm (mean hardness values found in different positions on the platform do not show a statistically significant difference) and
H1: means are not all equal (at least one mean hardness value significantly differs from others).
The tests were performed at the significance level α = 0.05. If p > α, hypothesis H0 is accepted, otherwise, we accept the alternative hypothesis H1.
Before using ANOVA, Fischer assumptions—independence, normality of distribution and homogeneity of observations—must be verified.
The independence assumption was guaranteed by the method of data collection: five different samples from five different positions on the build platform, each group of indentations consists of 30 individual, independent indentations. Normality was proved using the Shapiro–Wilks test and graphically interpreted by histograms and p–p plots. The test consists of a comparison between the empirical and the theoretical distribution function. The test statistic W is calculated as described in [27]. The closer the test statistic W approaches 1, the better the match between the theoretical and empirical distribution. The following hypotheses are tested: H0: the sample belongs to a normal distribution; H1: the sample doesn’t belong to a normal distribution. If the test statistic W < Wα (tabulated critical threshold), H0 is rejected at the significance level α, and the assumption of normal distribution has to be rejected. Homogeneity of variances means equal population variances in each group.
Using ANOVA, we determined whether some of the group means of the hardness values were different. However, it is necessary to specify differences between groups—the positions on the platform. Post-hoc tests were used for multiple comparisons. In this study, the Tukey’s HSD test (HSD = honest significant difference) was used. The result of the test is a matrix of p-values that identifies statistically significant differences between all pairs of groups.
The following hypotheses were tested:
H0: μi = μj (mean hardness values found in the i-th and j-th position on the platform do not show a statistically significant difference), and
H1: μi ≠ μj (mean hardness values measured at the i-th and j-th positions differ significantly), where i, j = A, B, C, D, and E. Tests were performed at the α = 0.05 significance level. If p > α, hypothesis H0 is accepted, otherwise, we accept the alternative hypothesis H1.
To detect the dependence of hardness on build direction (comparison between perpendicular and parallel directions at a particular position on the build platform), the t-test and F-test were used. According to the F-test result, either a 2-sample t-test assuming equal variances or a 2-sample t-test assuming unequal variances was used. The hypotheses tested were:
H0: μ1 = μ2 (hardness means in both directions in a particular position are equal), and
H1: μ1 ≠ μ2 (hardness means in both directions in a particular position differ significantly).

2.7. Methodology of Statistical Analysis of Surface Microgeometry

2.7.1. Kruskal–Wallis Test

The Kruskal–Wallis nonparametric test was used to compare positions on the building platform for each roughness parameter evaluated (Ra, Rz, RSm). This test compares more than two groups, regardless of whether the populations have the same distribution. The hypotheses for the test are:
H0: the medians of all groups are equal,
H1: the median of at least one group differs from another group.
If p ≤ α, the differences between some of the medians are statistically significant.

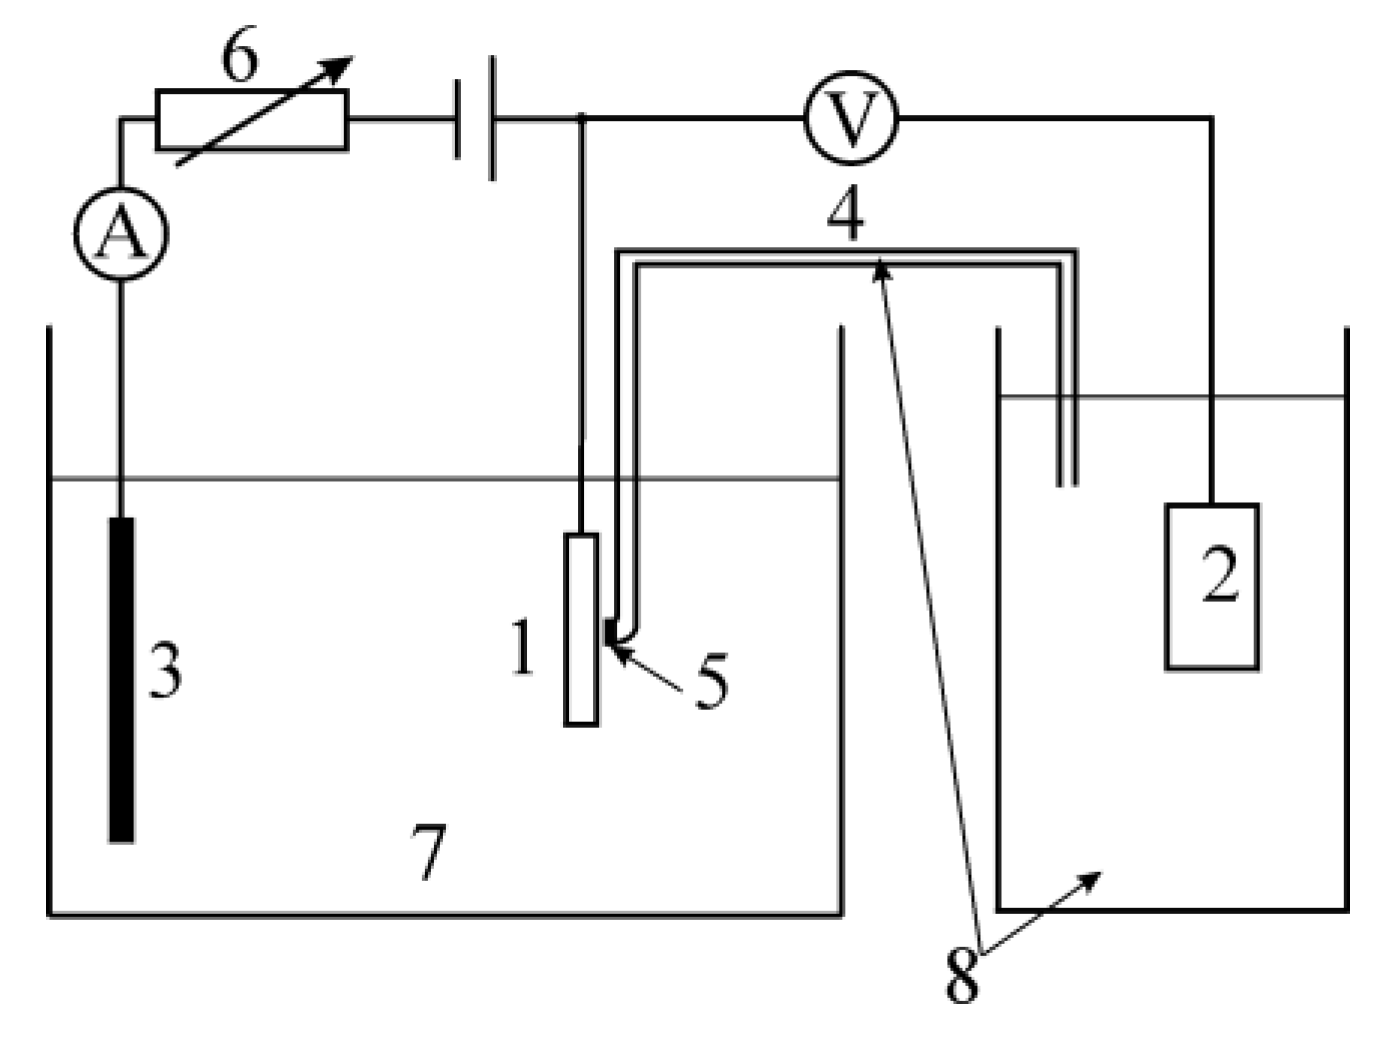
2.7.2. Corrosion Properties of Sintered Material

Before corrosion measurement, test samples of 20 mm x 20 mm x 2 mm were mounted in acrylic resin. The 20 mm x 20 mm area was ground on a set of sandpapers up to 1000 grit, polished using a colloidal silica suspension, and then ultrasonically cleaned in acetone, methanol, and distilled water, for 5 min in each cleaner. Samples were then dried and immediately connected to the corrosion cell.
Potentiodynamic measurements were performed on potentiostat SP 150, Bio-Logic Science Instruments using a 3-electrode system: sample, SCE (Saturated Calomel Electrode) electrode, and a platinum counting electrode (Figure 2) in 0.9% NaCl solution.
Stabilization of samples in the electrolyte was set to 30 min. The open circuit potential (OCP) after 30 min of stabilization was used as a starting value for polarization to the cathode and then to the anode region within the range of ±0.250 V. The polarization rate was set to 0.5 mV·s−1. Potentiodynamic curves were plotted in semi-logarithmic coordinates and analyzed by Tafel extrapolation. The potentiodynamic curves were analyzed by 1st Stern analysis with the following outputs: Ecorr, Icorr, anodic and cathodic slopes of the curves ba and bc. 2nd Stern analysis yielded the polarization resistance Rp as the slope of the tangent to the polarization curve shown in the coordinates i-E in the point, where i = 0.

3. Results

3.1. Microstructure Characterization of Material

The microstructure of the samples in two perpendicular directions is shown in Figure 3 at lower magnification and in Figure 4 at higher magnification.
Samples collected from five positions and two directions showed very similar microstructures. The microstructure consisted of primary β grains. They can be seen above all at low magnification (Figure 3C⊥). They transformed during repeated cooling/heating to fine Widmanstätten α′-martensite needles in primary β grains (Figure 4A⊥). In the microstructure, few micropores were observed at higher magnification (Figure 4) as a consequence of gas entrapped in the fusion zone during the DMLS process. Lack-of-fusion defects were not present in the micrographs. The type of microstructure and presence of discontinuities are consequences of thermal conditions during the sintering process. According to Ramesh Raju [28], heating and cooling conditions are considered to be the significant factor that is controlled by sintering parameters.
In the ‖ direction, almost polyhedral grains of very close diameter are observed, corresponding to the sections through the columnar primary β grains. In the ⊥ direction, the mostly long grains of β phase are observed parallel to the building direction, across several sintered layers. A very similar microstructure was observed by Weißmann [7], Konečná [9], and Syed [10].

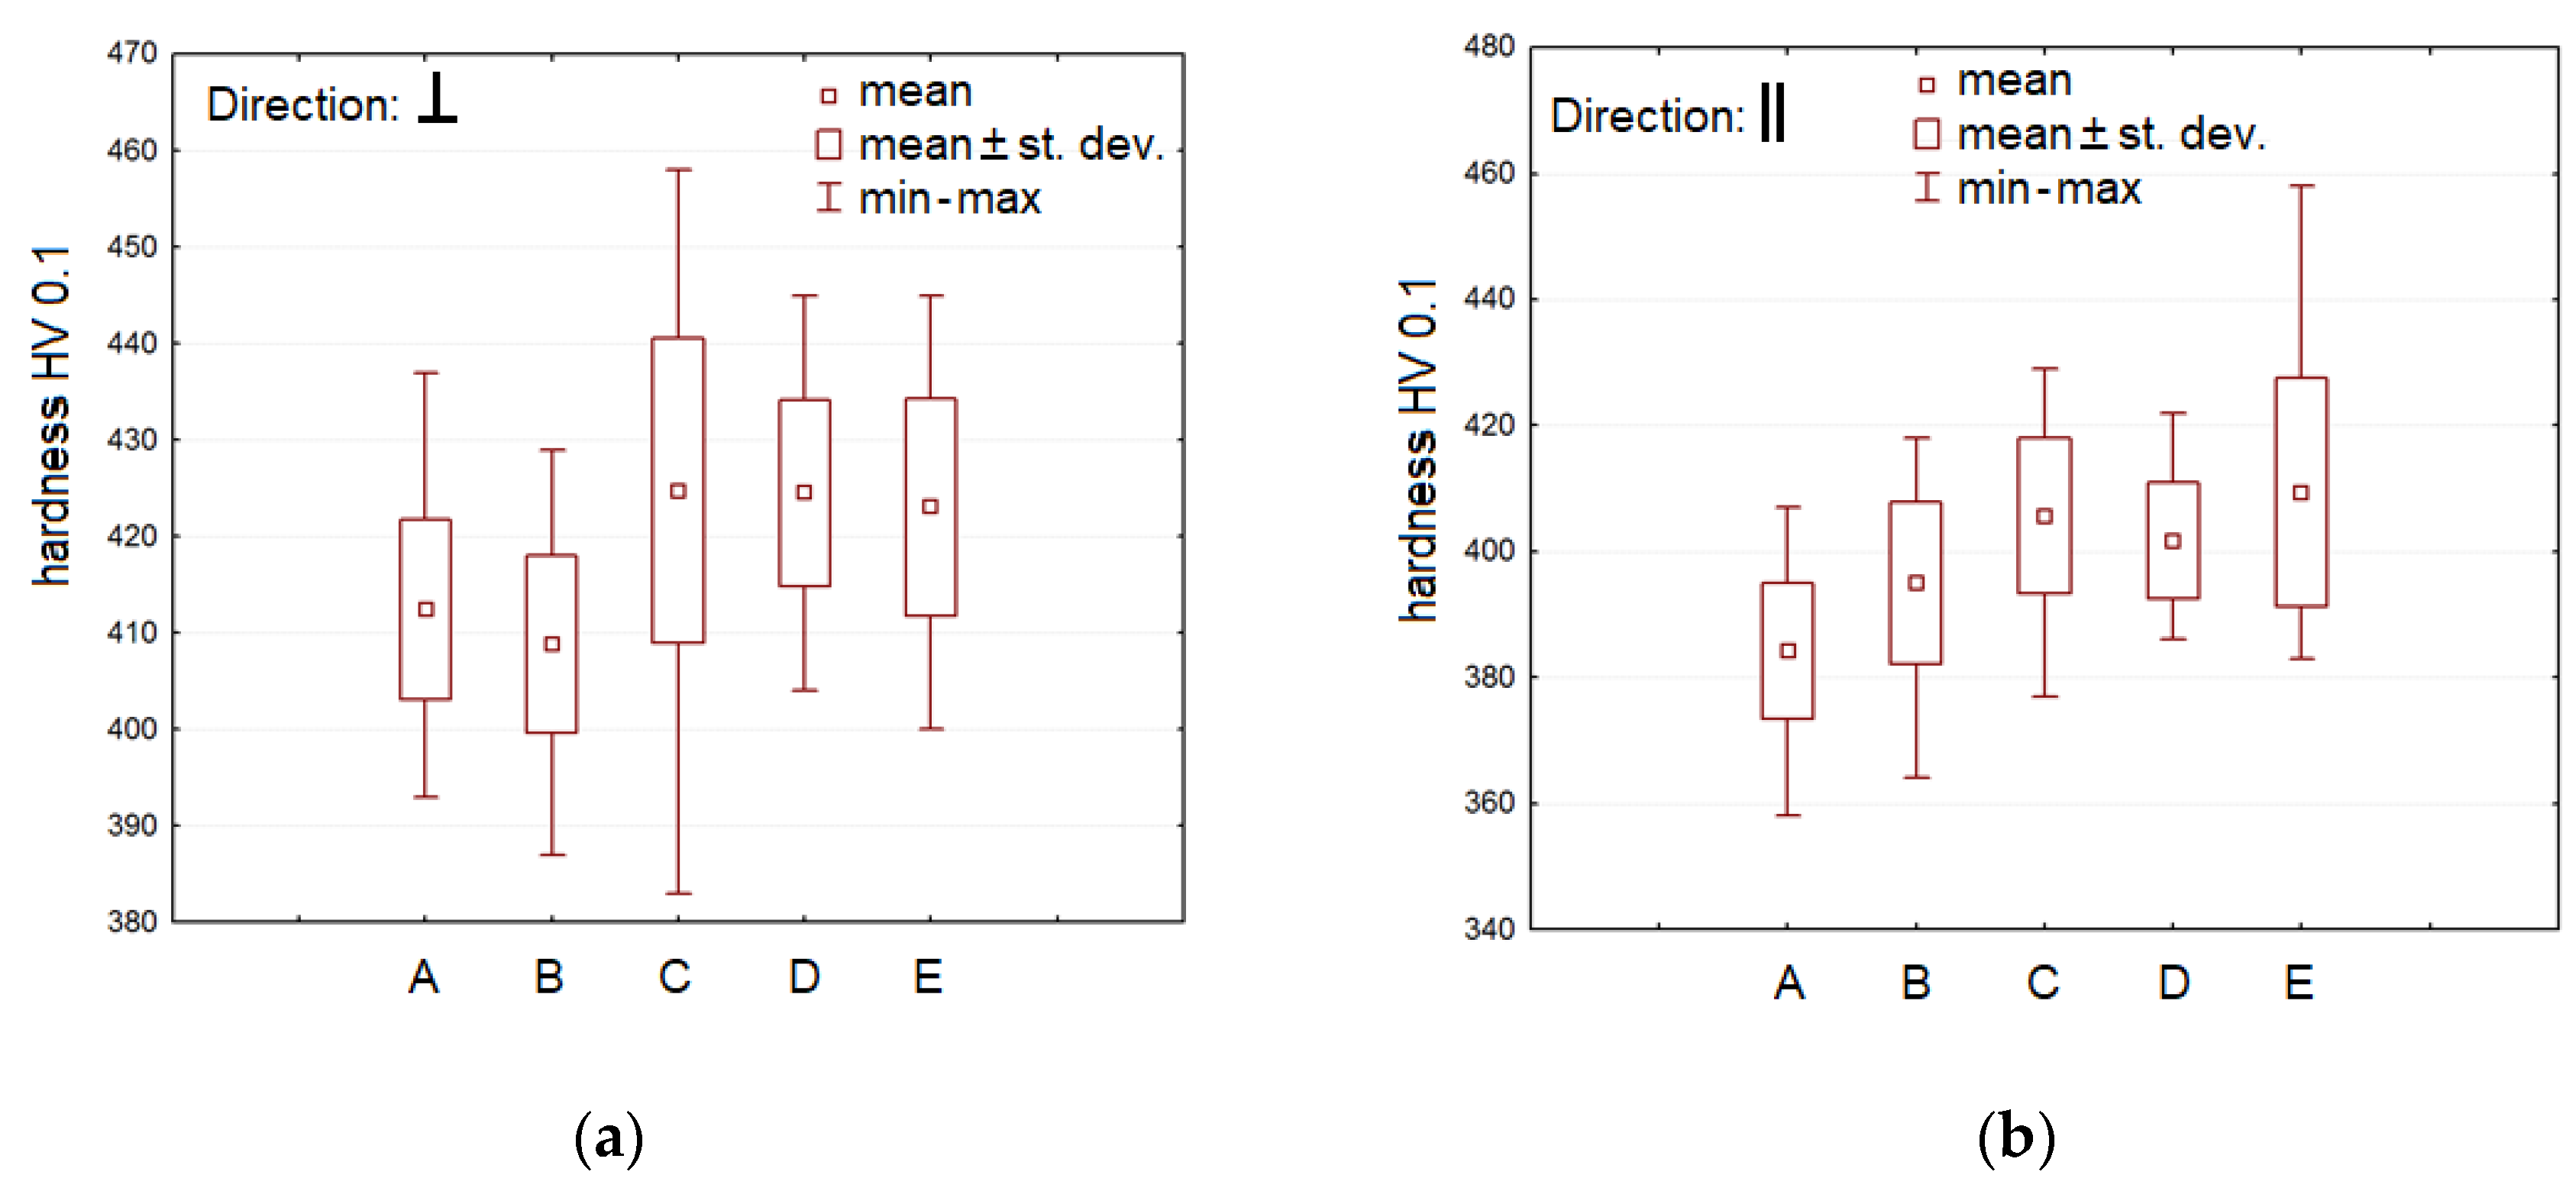
3.2. Statistical Analysis of Hardness

Descriptive statistics of all realized measurements of hardness are given in Table 1.
A Shapiro–Wilk normality test was performed for each set of measured values. The test output was a histogram and a p–p graph. An example for the sample at position A and both directions is shown in Figure 5.
Comparison of the test statistic W with the table critical threshold value Wα is given in Table 2.
Table 2 shows that all test statistic values W are greater than the table critical threshold value Wα, which means that the null hypothesis about the normal distribution cannot be rejected. Based on the Shapiro–Wilk test, we conclude that all measurements meet the conditions of independence, normality, and homogeneity, and it is possible to carry out a one way analysis of variance (ANOVA).
In Figure 6, box plots are shown containing the mean, standard deviation, and variation range of hardness values for all positions on the platform and both directions.
The results of the ANOVAs are shown in Table 3.
Table 3 shows that p < α, i.e., there is a statistically significant difference between the mean values of hardness in all positions on the platform in the ⊥ direction and separately in the ‖ direction.
The Tukey’s HSD test revealed specific pairs of positions with a statistically significant difference, Table 4.
From Table 4 (⊥ direction), it is clear that the mean hardness achieved in the samples in positions A and B differs significantly from the mean hardness in positions C, D, and E.
The hardness value achieved in the sample in the ‖ direction in position A differs significantly from all other positions, position B differs from all other positions except D, position C differs from A and B, position D from A, and position E differs most from positions A and B.
Figure 7 shows box plots comparing the mean, standard deviation, and variation range of hardness values in two directions for individual platform positions.
From Figure 7, it is obvious that the mean hardness values in the ‖ direction are lower than the ⊥ direction in all positions on the platform. The variation range (min–max range) of the hardness values is wider in the ‖ direction in positions A, B, and E. In positions C and D, the variation range is wider in the ⊥ direction.
The results of the t-test, comparing two perpendicular directions at each position, are shown in Table 5.
Since p < α for all p-values (Table 5), we can conclude that the hardness of the material in two perpendicular directions shows a statistically significant difference at the α significance level in each position.
Table 6 and Figure 8 show summary effects of both factors—directions and positions.
As p < α, both factors have a statistically significant effect on material hardness.

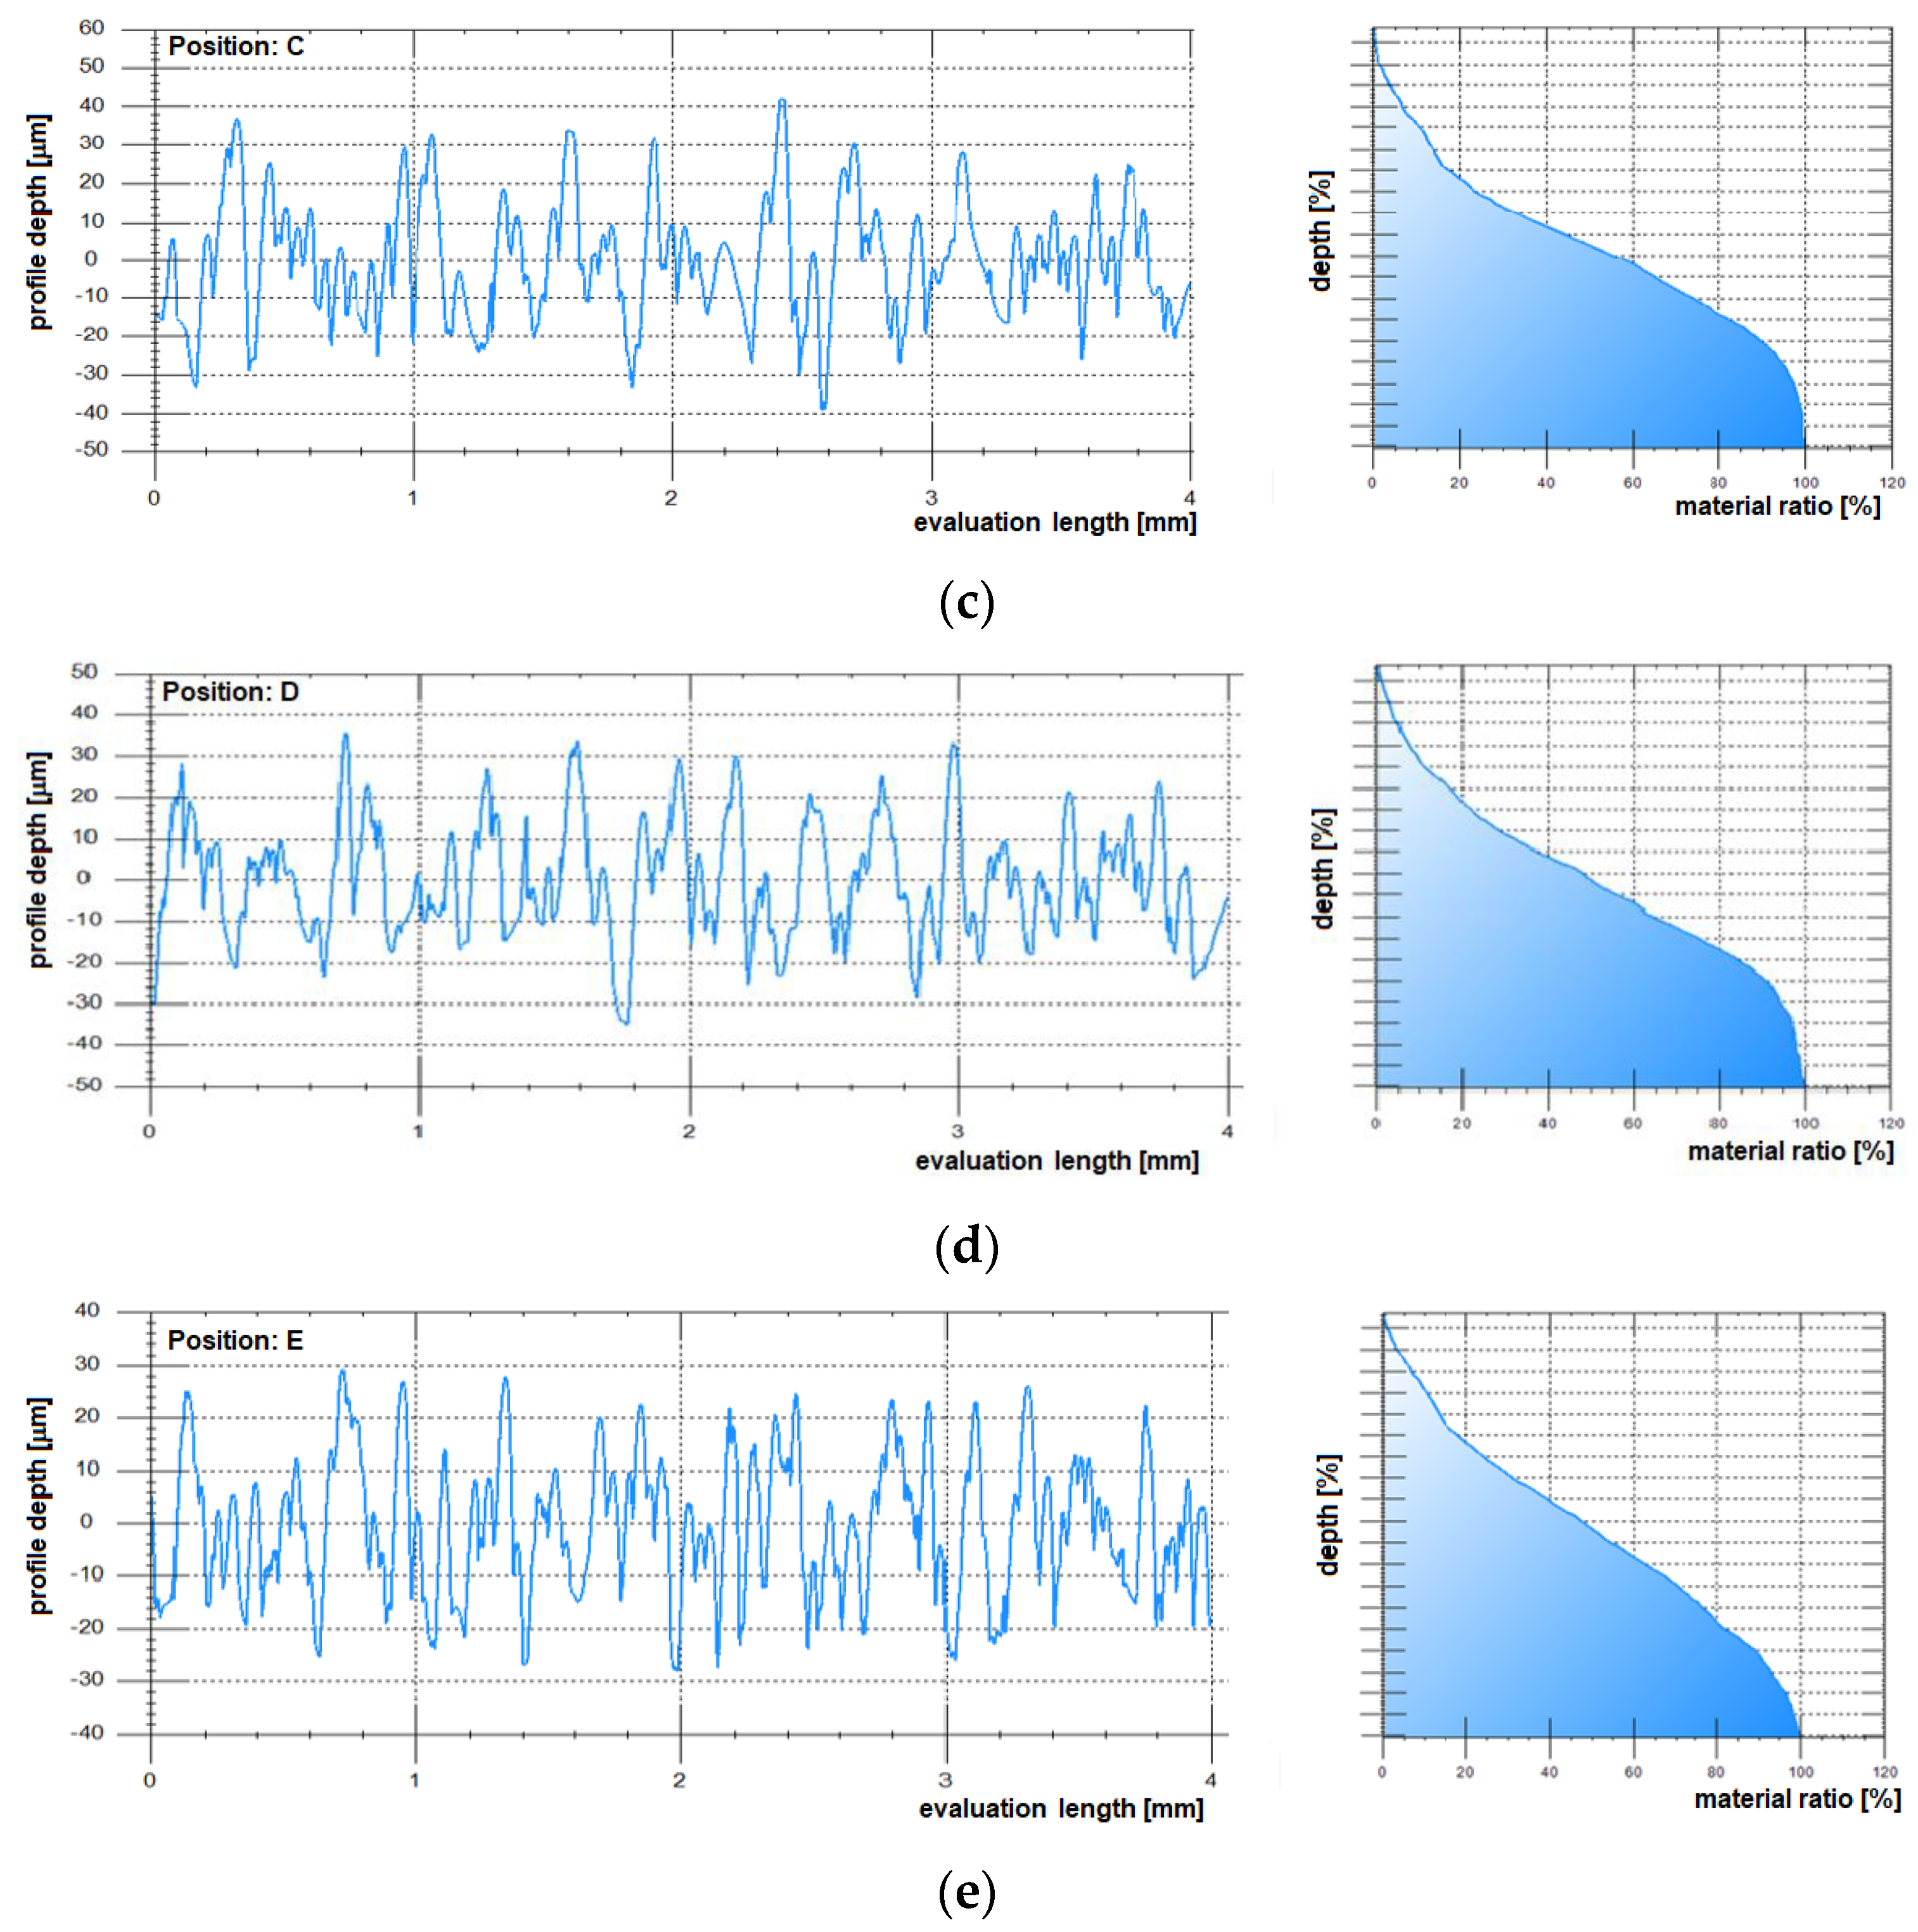
3.3. Statistical Analysis of Roughness

Based on the methodology mentioned above, experimental measurements of the individual roughness parameters of the sample surfaces were performed, and their arithmetic means are given in Table 7.
In Figure 9, the box plots containing the median, first and third quartiles (25–75%), and the variation range of the individual roughness parameters for all positions on the platform are shown.
The differences between samples A–E are shown in Figure 9. In verifying the extreme values of the roughness parameters, any presence of outliers was refuted. The numerical values of the parameters do not come from a selection with a normal distribution, and therefore nonparametric tests were used. Statistically significant differences in roughness parameters Ra, Rz, and RSm in individual positions on the build platform were assessed using the Kruskal–Wallis test.
If p < α, the null hypothesis of the agreement of the mean values at the significance level α = 0.05 is rejected—the parameter shows a statistically significant difference against the position compared. Statistically significant differences identified by post-hoc analysis are marked in bold in Table 8.
For Ra, statistically significant differences were not confirmed between positions B–E and C–D, for Rz between positions B–E, and for RSm between positions A–C, A–D, B–E, C–D.
Profilographs of surfaces and Abbot–Firestone curves of the material ratio are shown in Figure 10.
Figure 11 shows a visualization of surfaces at all positions on the platform, obtained by assembling the measured profiles in Matlab.

3.4. Measurement of Corrosion Properties

Figure 12 shows the course of the OCP of the investigated samples over 30 minutes. The course of the potential shows a gradual increase to more positive values. This indicates that anodic reaction controls the electrochemical process and protective titanium oxides begin to form on the surface. A similar course of the OCP was also observed by Wu et al. [29].
Linear potentiodynamic polarization revealed polarization characteristics of the material in cathodic and anodic directions (Figure 13). The slope of the anode (ba) and cathode (bc) dependence was determined by Tafel (1st Stern) analysis. By determining the intersection of the tangents to the linear part of the Tafel curves, the corrosion potential of Ecorr and the corrosion current density of Icorr were found.
2nd Stern analysis of the potentiodynamic curve (with linear scale of current density) allows the determination of the polarization resistance Rp as the slope of the curve shown in Figure 14 at zero current density. Measurements were performed three times in individual positions on the platform.
Icorr values were calculated based on the slope of the anode and cathode part of the Tafel curve and the polarization resistance Rp. Based on the experimentally determined corrosion current density, the corrosion rate rcorr was calculated using Faraday’s law.
The resulting values, as an average of the three independent measurements, are shown in Table 9.
From the above data, the quantity of Icorr is of great importance because its size determines the kinetics of the corrosion process in equilibrium, which the metal can reach without external intervention even under real conditions.
The corrosion rate determined by calculation from the measured data coincides in all positions; the lowest values were found in the C position (0.0035 mmpy) and the highest in the D position (0.0044 mmpy). The determined corrosion rate is very low; the differences between the positions are at the level of hundreds of thousands of mmpy, which is a negligible value.
From the measured data, it is evident that the position of the material on the build platform during sintering does not significantly affect its corrosion rate and is irrelevant to the corrosive behavior of the Ti6Al4V alloy. This can be attributed to the fact that titanium (the dominant element in the alloy), although belonging to the group of less noble metals, forms very stable compounds with oxygen, passivates, and exhibits very good corrosion resistance.

4. Discussion

4.1. Microhardness of Material

The hardness of the test samples exhibits a considerable dispersion and a significant difference in two mutually perpendicular directions (380–425 HV 0.1), which is typical for as-build thermally untreated materials. The hardness values are quite high and comparable to the hardness of the laser weld of Ti6Al4V at the HAZ (heat affected zone) and fusion zone interface [30]. Raju [28] found approximately 370 HV 0.5 on the same alloy deposited by LMD (laser metal deposition) technology, compared to 310 HV 0.5 achieved on forged and hot-rolled slab. Comparing hardness in different directions is not a frequent topic of research work. The authors conducted similar studies [31] but compared samples produced with different laser power (DMLS) and as-build and stress-relieved samples. A similar study was conducted by Wu et al. [29], who examined hardness in two mutually perpendicular planes to the building orientation and found, like us, a higher hardness in the vertical plane compared to the horizontal plane, although it was another additive technology of material production—gas tungsten wire Arc Additive Manufacturing (GTWAAM) Process. The authors of [29] explained this phenomenon by the influences of grain size, phase orientation, distribution of lattice imperfections in different planes, and building failures present in additively manufactured parts. The study also compares the additively produced Ti6Al4V material against the wrought plate of Ti6Al4V. Additively produced materials achieve a significantly higher hardness compared to rolled compacted materials due to repeated thermal cycles during deposition. The aforementioned authors [28,29,30], who in addition carried out a detailed phase analysis, explain this by the presence of the martensitic α′ phase and Widmanstätten α grains, which contribute to the resulting hardness of the alloy.
Regarding the sectors investigated, sectors C, D, and E show increased hardness compared to A and B (Figure 15).

4.2. Roughness of Material

The resulting roughness of parts produced in an additive way is always the result of a combination of input parameters—in particular, the particle size of the powder used, melting conditions (laser power and speed, laser scanning strategy, layer height), or orientation of the produced part relative to the building platform [6,32,33]. The roughness affects implant–bone interaction, the friction coefficient, osseointegration process [3,34] (especially in porous structures [4,5,6,7]), and the fatigue life of the product [11]. Liu [1] notes that the roughness is affected by several factors: (1) the staircase effect related to the subsequently deposited layers; (2) the attachment of the partly melted particles to the surface, and (3) the presence of pores and other imperfections close to surface. She also notes that surface topography is closely related to processing parameters. The authors of this paper tried to find out whether the same surface roughness is achieved under the same production conditions depending on the location on the building platform. The paper evaluates the roughness of material produced by DMLS technology under the same conditions without any additional treatment. The aim was to identify the basic roughness parameters in various positions on the building platform. Figure 16 show that sector A, where the highest values of the parameters Ra, Rz, and RSm were measured, dominates all evaluated positions. For all assessed parameters, roughness in the center of the build platform is lower than near the edges. The same results were found by Öter [23] for flat surfaces, whereas the opposite trend is valid for inclined surfaces. This can only be explained by the different angle of impact of the laser beam on the powder bed in the center and corners of the build platform.
The measured roughness values correspond to the values found by Sidambe [35], although he uses the spatial parameters (Sa) instead of profile parameters (Ra), and correspond also to the values given in [1]. Sidambe also notes that horizontally oriented surfaces have lower roughness values than inclined surfaces. The highest roughness is usually detected on vertical surfaces that contain a quantity of partially melted particles as a result of minimum exposure to the electron beam as a consequence of orientation. We also observed this in the preparation of metallographic sections (Figure 17). Reference [11] also notes the lower surface roughness produced by DMLS compared to EBM (electron beam melting).
Since many of the partially melted particles may have low adhesion to the sintered material and could be released into the body, it is advisable to blast the surfaces [14,36], possibly followed by etching [6], electropolishing, chemical etching, or a combination of these [37]. Blasting brings several benefits to the product, including removal of particles with insufficient adhesion to the surface and surface strengthening, which results in increased resistance of the product to fatigue. However, it is necessary to consider the transformation of the original microgeometry and the creation of a new surface morphology corresponding to the abrasive used (grit, shot) and blasting parameters (impact velocity, impact angle). Longhitano [37] reports a lower roughness for as-built samples made under the same conditions as in our research, but he turned the sample by 30° for each roughness measurement, eliminating the influence of the building direction, and stated lower final values than the authors of this article. The best match of results was obtained in [38], where Ra on the side wall of as-build samples produced by the same technology varied from 9 to 21 μm, according to scanning speed.
The effect of build orientation on material properties is so significant that Milton [39] has even identified a different resulting roughness after the machining of samples with different build-up directions during additive manufacturing.

4.3. Corrosion Resistance of Material

Although prior to each corrosion measurement samples were ground, polished, rinsed, dried, and immediately clamped into the measuring device, the corrosion current density and the calculated corrosion rate rcorr indicate the existence of a protective passive film on the alloy surface. Such a protective film is naturally formed by reaction of the material with the atmosphere or electrolyte, or we can induce the formation of such a film artificially by heat treatment [40], anodic oxidation [2,41,42], or other additional surface treatment [43,44,45,46,47]. Li [40] found that stress relief annealing of Ti6Al4V alloys moves the Tafel curves slightly to a more positive potential and lower current density, hence its corrosion resistance increases (use of protective atmosphere during annealing is not indicated). Thus, heat treatment of Ti6Al4V can, in addition to improving the homogeneity of mechanical properties, positively affect its corrosion resistance. The arisen passive protective film works as a barrier against the dissolution of Ti6Al4V in the solution. Xu [48] found an increase in corrosion resistance after laser surface texturing.
Figure 18 shows rcorr in particular positions on the build platform. It ranges from 3.5–4.4 × 10⁻³ mmpy, which are very small values. Noticeable differences in the corrosion rate of as-built material in individual sectors on the plate were not observed.

5. Conclusions

Results of this research can be summed up in the following items:
  • Microstructure: Material produced by DMLS technology under the given conditions contained fine Widmanstätten α′-martensite needles in primary β grains. The material contained a few gas micropores, and lack-of-fusion pores were not identified. This proves that parameters were sufficient for the creation of a compact, fully fused structure. In the direction parallel to fused layers, almost equiaxial grains of very close diameter oriented in the laying direction were observed. In the direction perpendicular to fused layers, the dominant β grains grew across several sintered layers. No change in microstructure in relation to position was observed.
  • Hardness: In both directions assessed, there was a statistically significant difference between the mean values of hardness in all positions on the platform. In the direction perpendicular to fused layers, the mean hardness in positions A and B differed significantly from the mean hardness in positions C, D, and E. The hardness value in the direction parallel to fused layers in position A differed significantly from all other positions, position B differed from all other positions except D, position C differed from A and B, position D from A, and position E differed most from positions A and B. The mean hardness values in the parallel direction (408–425 HV 0.1) were lower than in the perpendicular direction (384–409 HV 0.1) in all positions on the platform. The hardness of Ti6Al4V samples in two perpendicular directions showed a statistically significant difference at the α significance level at each position.
  • Roughness: Values of roughness parameters varied as follows within the studied positions: Ra 10–14 µm, Rz 52–70 µm, RSm 160–213 µm. Pairs of close values that did not exhibit statistically significant differences are: for Ra positions, B–E and C–D, for Rz positions, B-E, and for RSm positions, A–C, A–D, B–E, and C–D.
  • Corrosion characteristics: The course of the open circuit potential indicates that anodic reaction controls the electrochemical process, and a protective titanium oxide layer begins to form on the surface. rcorr values indicate the existence of a protective passive film on the alloy surface. It ranged between 3.5–4.4 × 10⁻³ mmpy in particular positions; significant differences in the corrosion rate of as-built material in individual sectors on the plate were not observed.
The performed experimental measurements made it possible to identify possible sources of inhomogeneity of products made by DMLS technology throughout the build platform—deflection of the laser beam, uneven gas flow through the chamber, and uneven powder spread throughout the platform. Positioning the product on the build platform during the DMLS process has been proven to have a statistically significant effect on the hardness and surface roughness of as-build products but less impact on corrosion resistance. Some sources of inhomogeneity are out of operator control and follow from the design and operation principles of the sintering device. Since the effect of laser beam deflection and the washing of the chamber by inert gas cannot be studied separately, it is not possible to clearly determine their partial contribution to material properties. The authors’ findings should be taken into account when designing the layout of the products on the platform. Products for which it is important to minimize the pore content and achieve the best geometric precision and dimensional accuracy as well as ensure the smallest differences in mechanical properties in different directions should be placed in the central part of the platform. From the point of view of powder use, it is important to strictly control the handling and preparation of the powder before loading it into the machine. Corrosion velocity measurements proved the formation of a protective oxide layer on the surface of the Ti6Al4V alloy, which leads to high corrosion resistance of the alloy in an environment close to the intrabody environment. Corrosion measurements have contributed to the comprehensiveness of mapping the homogeneity of product properties made by DMLS technology depending on the position on build platform. All these recommendations can help minimize product inhomogeneities and improve the reliability and repeatability of the process.

Author Contributions

Conceptualization, R.H., and J.Ž.; methodology, R.H. and J.B.; investigation, writing—original draft preparation, A.G., D.D., G.I., and R.M.; writing—review and editing, A.G.; visualization, D.D. and G.I.; project administration, funding acquisition, J.Ž. and R.H.

Funding

This research was funded by Slovak Research and Development Agency under the contract No. APVV-17-0278, No. APVV-15-00356 and APVV-16-0359, VEGA No. 1/0179/19 and VEGA No. 1/0154/19, and by the Stimulus for Research and Development of the Ministry of Education, Science, Research and Sport of the Slovak Republic under the contract S-19-103/0001-00.

Conflicts of Interest

The authors declare no conflict of interest.

References

  1. Liu, S.; Shin, Y.C. Additive manufacturing of Ti6Al4V alloy: A review. Mater. Des. 2019, 164, 107552. [Google Scholar] [CrossRef]
  2. Damborenea, J.J.; Larosa, M.A.; Arenas, M.A.; Hernández-López, J.M.; Jardini, A.L.; Ierardi, M.C.F.; Zavaglia, C.A.C.; Filho, R.M.; Conde, A. Functionalization of Ti6Al4V scaffolds produced by direct metal laser for biomedical applications. Mater. Des. 2015, 83, 6–13. [Google Scholar] [CrossRef]
  3. Palmquist, A.; Shah, F.A.; Emanuelsson, L.; Omar, O.; Suska, F. A technique for evaluating bone ingrowth into 3D printed, porous Ti6Al4V implants accurately using X-ray micro-computed tomography and histomorphometry. Micron 2017, 94, 1–8. [Google Scholar] [CrossRef] [PubMed]
  4. Wauthle, R.; Vrancken, B.; Beynaerts, B.; Jorissen, K.; Schrooten, J.; Kruth, J.P.; Humbeeck, J.V. Effects of build orientation and heat treatment on the microstructure and mechanical properties of selective laser melted Ti6Al4V lattice structures. Addit. Manuf. 2015, 5, 77–84. [Google Scholar] [CrossRef]
  5. Cuadrado, A.; Yánez, A.; Martel, O.; Deviaene, S.; Monopoli, D. Influence of load orientation and of types of loads on the mechanical properties of porous Ti6Al4V biomaterials. Mater. Des. 2017, 135, 309–318. [Google Scholar] [CrossRef]
  6. Bartolomeu, F.; Costa, M.M.; Gomes, J.R.; Alves, N.; Abreu, C.S.; Silva, F.S.; Miranda, G. Implant surface design for improved implant stability—A study on Ti6Al4V dense and cellular structures produced by Selective Laser Melting. Tribol. Int. 2019, 129, 272–282. [Google Scholar] [CrossRef]
  7. Weißmann, V.; Bader, R.; Hansmann, H.; Laufer, N. Influence of the structural orientation on the mechanical properties of selective laser melted Ti6Al4V open-porous scaffolds. Mater. Des. 2016, 95, 188–197. [Google Scholar] [CrossRef]
  8. Saxena, A.K.; Tewari, A.; Pant, P. Quantitative analysis of orientation and near neighbor interaction effects during deformation of polycrystalline Ti6Al4V. Mater. Sci. Eng. A 2015, 648, 1–8. [Google Scholar] [CrossRef]
  9. Konečná, R.; Kunz, L.; Bača, A.; Nicoletto, G. Resistance of direct metal laser sintered Ti6Al4V alloy against growth of fatigue cracks. Eng. Fract. Mech. 2017, 185, 82–91. [Google Scholar] [CrossRef]
  10. Syed, A.K.; Ahmad, B.; Guo, H.; Machry, T.; Eatock, D.; Meyer, J.; Fitzpatrick, M.E.; Zhang, X. An experimental study of residual stress and direction-dependence of fatigue crack growth behaviour in as-built and stress-relieved selective-laser-melted Ti6Al4V. Mater. Sci. Eng. A 2019, 755, 246–257. [Google Scholar] [CrossRef]
  11. Nicoletto, G.; Konečná, R.; Frkáň, M.; Riva, E. Surface roughness and directional fatigue behavior of as-built EBM and DMLS Ti6Al4V. Int. J. Fatigue 2018, 116, 140–148. [Google Scholar] [CrossRef]
  12. Konečná, R.; Kunz, L.; Bača, A.; Nicoletto, G. Long fatigue crack growth in Ti6Al4V produced by direct metal laser sintering. Procedia Eng. 2016, 160, 69–76. [Google Scholar] [CrossRef]
  13. Bača, A.; Konečná, R.; Nicoletto, G.; Kunz, L. Influence of build direction on the fatigue behaviour of Ti6Al4V alloy produced by direct metal laser sintering. Mater. Today Proc. 2016, 3, 921–924. [Google Scholar] [CrossRef]
  14. Brezinová, J.; Hudák, R.; Guzanová, A.; Draganovská, D.; Ižaríková, G.; Koncz, J. Direct Metal Laser Sintering of Ti6Al4V for Biomedical Applications: Microstructure, Corrosion Properties, and Mechanical Treatment of Implants. Metals 2016, 6, 171. [Google Scholar] [CrossRef]
  15. Wang, Q.; Bruschi, S.; Ghiotti, A.; Mu, Y. Modelling of fracture occurrence in Ti6Al4V sheets at elevated temperature accounting for anisotropic behavior. Int. J. Mech. Sci. 2019, 150, 471–483. [Google Scholar] [CrossRef]
  16. Design Guidelines for Direct Metal Laser Sintering (DMLS). Available online: https://www.crucibledesign.co.uk/images/uploaded/guides/bs7000-part-2-a-management-guide-download-original.pdf (accessed on 11 May 2019).
  17. Grasso, M.; Colosimo, B.M. Process defects and in situ monitoring methods in metal powder bed fusion: A review. Meas. Sci. Technol. 2017, 28, 044005. [Google Scholar] [CrossRef]
  18. Venkatesh, K.V.; Nandini, V.V. Direct Metal Laser Sintering: A digitised metal casting technology. J. Indian Prosthodont. Soc. 2013, 13, 389–392. [Google Scholar] [CrossRef]
  19. Agius, D.; Kourousis, K.I.; Wallbrink, C. A Review of the as-built SLM Ti-6Al-4V mechanical properties towards achieving fatigue resistant designs. Metals 2018, 8, 75. [Google Scholar] [CrossRef]
  20. Sun, D.; Gu, D.; Lin, K.; Ma, J.; Chen, W.; Huang, J.; Sun, X.; Chu, M. Selective laser melting of titanium parts: Influence of laser process parameters on macro- and microstructures and tensile property. Powder Technol. 2019, 342, 371–379. [Google Scholar] [CrossRef]
  21. Fox, J.C.; Moylan, S.P.; Lane, B.M. Effect of process parameters on the surface roughness of overhanging structures in laser powder bed fusion additive manufacturing. Procedia CIRP 2016, 45, 131–134. [Google Scholar] [CrossRef]
  22. Hanzl, P.; Zetek, M.; Bakša, T.; Kroupa, T. The influence of processing parameters on the mechanical properties of SLM parts. Procedia Eng. 2015, 100, 1405–1413. [Google Scholar] [CrossRef]
  23. Öter, Z.; Coşkun, M.; Koç, E. Effect of Building Platform Position on the Surface Quality, Dimensional Accuracy, and Geometrical Precision of Direct Metal Laser Sintering (DMLS) Parts. In Proceedings of the Euro PM2018-AM Beam Based II, Bilbao, Spain, 14–18 October 2018. [Google Scholar]
  24. Tan, J.H.; Wong, W.L.E.; Dalgarno, K.W. An overview of powder granulometry on feedstock and part performance in the selective laser melting process. Addit. Manuf. 2017, 18, 228–255. [Google Scholar] [CrossRef]
  25. Leyens, C.H.; Peters, M. Titanium and Titanium Alloys: Fundamentals and Applications; WILEY-VCH Verlag GmbH & Co. KGaA: Weinheim, Gremany, 2003. [Google Scholar]
  26. ASTM F136-11. Standard Specification for Wrought Titanium-6Aluminum-4Vanadium ELI (Extra Low Interstitial) Alloy for Surgical Implant Applications (UNS R56401). Available online: https://webstore.ansi.org/standards/astm/astmf13611 (accessed on 17 June 2019).
  27. Fundamental of Statistics. Shapiro-Wilk Test. Available online: http://www.statistics4u.info/fundstat_eng/ee_shapiro_wilk_test.html (accessed on 24 April 2019).
  28. Raju, R.; Duraiselvam, M.; Petley, V.; Verma, S.; Rajendran, R. Microstructural and mechanical characterization of Ti6Al4V refurbished parts obtained by laser metal deposition. Mater. Sci. Eng. A 2015, 643, 64–71. [Google Scholar] [CrossRef]
  29. Wu, B.; Pan, Z.; Li, S.; Cuiuri, D.; Ding, D.; Li, H. The anisotropic corrosion behaviour of wire arc additive manufactured Ti-6Al-4V alloy in 3.5% NaCl solution. Corros. Sci. 2018, 137, 176–183. [Google Scholar] [CrossRef]
  30. Hong, K.M.; Shin, Y.C. Analysis of microstructure and mechanical properties change in laser welding of Ti6Al4V with a multiphysics prediction model. J. Mater. Process. Technol. 2016, 237, 420–429. [Google Scholar] [CrossRef]
  31. Guzanová, A.; Ižaríková, G.; Brezinová, J.; Živčák, J.; Draganovská, D.; Hudák, R. Influence of build orientation, heat treatment, and laser power on the hardness of Ti6Al4V manufactured using the DMLS process. Metals 2017, 7, 318. [Google Scholar] [CrossRef]
  32. Miranda, G.; Faria, S.; Bartolomeu, F.; Pinto, E.; Alves, N.; Peixinho, N.; Gasik, M.; Silva, F.S. A study on the production of thin-walled Ti6Al4V parts by selective laser melting. J. Manuf. Process. 2019, 39, 346–355. [Google Scholar] [CrossRef]
  33. Zhou, G.; Bi, Y.; Ma, Y.; Wang, L.; Wang, X.; Yu, Y.; Mutzke, A. Large current ion beam polishing and characterization of mechanically finished titanium alloy (Ti6Al4V) surface. Appl. Surf. Sci. 2019, 476, 905–913. [Google Scholar] [CrossRef] [Green Version]
  34. Kümmel, D.; Hamann-Schroer, M.; Hetzner, H.; Schneider, J. Tribological behavior of nanosecond-laser surface textured Ti6Al4V. Wear 2019, 422–423, 261–268. [Google Scholar] [CrossRef]
  35. Sidambe, A.T. Three dimensional surface topography characterization of the electron beam melted Ti6Al4V. Met. Powder Rep. 2017, 72, 200–205. [Google Scholar] [CrossRef]
  36. Draganovská, D.; Ižaríková, G.; Guzanová, A.; Brezinová, J. General regression model for predicting surface topography after abrasive blasting. Metals 2018, 8, 938. [Google Scholar] [CrossRef]
  37. Longhitano, G.A.; Larosa, M.A.; Munhoz, A.L.J.; Zavaglia, C.A.C.; Ierardi, M.C.F. Surface finishes for Ti-6Al-4V alloy produced by direct metal laser sintering. Mater. Res. 2015, 18, 838–842. [Google Scholar] [CrossRef]
  38. Mierzejewska, Z.A.; Hudák, R.; Sidun, J. Mechanical properties and microstructure of DMLS Ti6Al4V alloy dedicated to biomedical applications. Materials 2019, 12, 176. [Google Scholar] [CrossRef] [PubMed]
  39. Milton, S.; Morandeau, A.; Chalon, F.; Leroy, R. Influence of finish machining on the surface integrity of Ti6Al4V produced by Selective Laser Melting. Procedia CIRP 2016, 45, 127–130. [Google Scholar] [CrossRef]
  40. Li, J.; Lin, X.; Wang, J.; Zheng, M.; Guo, P.; Zhang, Y.; Ren, Y.; Liu, J.; Huang, W. Effect of stress-relief annealing on anodic dissolution behaviour of additive manufactured Ti-6Al-4V via laser solid forming. Corros. Sci. 2019, 153, 314–326. [Google Scholar] [CrossRef]
  41. Benea, L.; Celis, J.P. Reactivity of porous titanium oxide film and chitosan layer electrochemically formed on Ti-6Al-4V alloy in biological solution. Surf. Coat. Technol. 2018, 354, 145–152. [Google Scholar] [CrossRef]
  42. Hwang, I.J.; Choe, H.C.H. Effects of Zn and Si ions on the corrosion behaviors of PEO-treated Ti-6Al-4V alloy. Appl. Surf. Sci. 2019, 477, 79–90. [Google Scholar] [CrossRef]
  43. Simsek, I.; Ozyurek, D. Investigation of the wear and corrosion behaviors of Ti5Al2.5Fe andTi6Al4V alloys produced by mechanical alloying method in simulated body fluid environment. Mater. Sci. Eng. C 2019, 94, 357–363. [Google Scholar] [CrossRef]
  44. Toptan, F.; Alves, A.C.; Carvalho, Ó.; Bartolomeu, F.; Pinto, A.M.P.; Silva, F.; Miranda, G. Corrosion and tribocorrosion behaviour of Ti6Al4V produced by selective laser melting and hot pressing in comparison with the commercial alloy. J. Mater. Process. Technol. 2019, 266, 239–245. [Google Scholar] [CrossRef]
  45. Huo, W.T.; Zhao, L.Z.; Zhang, W.; Lu, J.W.; Zhao, Y.Q.; Zhang, Y.S. In vitro corrosion behavior and biocompatibility of nanostructured Ti6Al4V. Mater. Sci. Eng. C 2018, 92, 268–279. [Google Scholar] [CrossRef] [PubMed]
  46. Yu, F.; Addison, O.; Davenport, A.J. A synergistic effect of albumin and H2O2 accelerates corrosion of Ti6Al4V. Acta Biomater. 2015, 26, 355–365. [Google Scholar] [CrossRef] [PubMed]
  47. Poursaee, A. Corrosion of Ti6Al4V orthopaedic alloy under stress. Materialia 2019, 6, 100271. [Google Scholar] [CrossRef]
  48. Xu, Y.; Li, Z.; Zhang, G.; Wang, G.; Zeng, Z.; Wang, C.H.; Wang, C.H.; Zhao, S.; Zhang, Y.; Ren, T. Electrochemical corrosion and anisotropic tribological properties of bioinspired hierarchical morphologies on Ti-6Al-4V fabricated by laser texturing. Tribol. Int. 2019, 134, 352–364. [Google Scholar] [CrossRef]
Figure 1. (a) Positions of samples on build platform during sintering (A–E); (b) collection of samples for metallographic observation.
Metals 09 01055 g001
Figure 2. Three electrode system: 1—test sample (working electrode), 2—SCE (reference electrode), 3—Pt auxiliary electrode, 4—salt bridge, 5—semipermeable membrane, 6—adjustable voltage source, 7—electrolyte, 8—solution of own ions of reference electrode.
Metals 09 01055 g002
Figure 3. Micrographs of material in individual positions (AE) and directions (⊥ and ‖), light microscope (LM), the arrow indicates build direction (BD).
Metals 09 01055 g003aMetals 09 01055 g003b
Figure 4. Micrographs of material in individual positions (AE) and directions (⊥ and ‖) at higher magnification, LM, the arrow indicates build direction (BD).
Metals 09 01055 g004aMetals 09 01055 g004b
Figure 5. Histogram and normal p–p graph for position A and both directions.
Metals 09 01055 g005
Figure 6. The hardness of the material in particular positions in the (a) ⊥ and (b) ‖ directions.
Metals 09 01055 g006
Figure 7. Comparison of hardness characteristics for two directions in each position on the build platform: (a) position A, (b) position B, (c) position C, (d) position D, (e) position E.
Metals 09 01055 g007
Figure 8. Interaction plots for both factors, (a) direction vs. hardness, (b) positions vs. hardness.
Metals 09 01055 g008
Figure 9. Box plots for roughness parameters (a) Ra, (b) Rz, and (c) RSm in particular positions.
Metals 09 01055 g009
Figure 10. Profilographs (left) and areal material ratio Abbot–Firestone curves (right) of surfaces in particular positions: (a) position A, (b) position B, (c) position C, (d) position D, (e) position E.
Metals 09 01055 g010aMetals 09 01055 g010b
Figure 11. 3D maps of sample surfaces in individual positions: (a) position A, (b) position B, (c) position C, (d) position D, (e) position E.
Metals 09 01055 g011aMetals 09 01055 g011b
Figure 12. Course of the open circuit potential (OCP) during stabilization.
Metals 09 01055 g012
Figure 13. Polarization diagram with logarithmic scale of current density—Tafel extrapolation.
Metals 09 01055 g013
Figure 14. Polarization diagram with linear scale of current density—determination of Rp.
Metals 09 01055 g014
Figure 15. Distribution of hardness in strategic positions on the build platform in (a) ⊥ and (b) ‖ directions.
Metals 09 01055 g015
Figure 16. Distribution of roughness parameters in strategic positions on the build platform in (a) Ra, (b) Rz, and (c) RSm.
Metals 09 01055 g016
Figure 17. Partially melted, poorly adherent particles at the edge of a sample cross-section.
Metals 09 01055 g017
Figure 18. Distribution of corrosion rate in strategic positions on the build platform.
Metals 09 01055 g018
Table 1. Descriptive statistics of hardness measurement.
CountMeanMedianModeMode Freq.MinMaxVariabilitySt. Dev.Coef. Var.SkewKurt
A⊥30412.43411Mult.639343786.679.312.260.581.33
A‖30384.103833837358407116.3710.782.81−0.440.67
B⊥30408.83407Mult.638742983.799.152.240.290.65
B‖30395.03397Mult.5364418164.4512.823.25−0.670.02
C⊥30424.73426Mult.6383458249.7815.803.72−0.981.63
C‖30405.63405.54146377429152.7212.353.05−0.16−0.43
D⊥30424.50426429640444594.269.712.280.14−0.28
D‖30401.70404Mult.638642285.189.232.290.07−0.51
E⊥30423.034264268400445126.2411.242.66-0.27−0.04
E‖30409.33405.5Mult.4383458330.7118.184.441.101.20
Mode Freq.—mode frequency, St. Dev.—standard deviation, Coef. Var.—coefficient of variation, Mult.—multiple.
Table 2. Results of Shapiro–Wilk test of normality.
Position/DirectionTest Statistic Wp-ValueTable Critical Threshold
Wα = 0.9269
Hyp: H0
A ⊥0.950.15W > WαAccepted
A ‖0.970.47
B ⊥0.950.21
B ‖0.950.15
C ⊥0.930.08
C ‖0.970.64
D ⊥0.970.49
D ‖0.950.21
E ⊥0.960.25
E ‖0.940.06
Table 3. Results of analysis of variance (ANOVA) for the assessed directions.
DirectionSSDFMSSS ErrorDF ErrorMS ErrorF-Statisticp-Value
6763.2341690.8118,581.87145128.1513.190
11,870.5642967.6424,633.60145169.8917.470
SS—sum of squares; DF—degree of freedom; MS—mean squares.
Table 4. Tukey’s honest significant difference (HSD) test, p-values.
ABCDE
A-0.7328<0.0005<0.00050.0027
B0.7328-<0.0005<0.0005<0.0005
C<0.0005<0.0005-0.99990.9778
D<0.0005<0.00050.9999-0.9872
E0.0027<0.00050.97780.9872-
ABCDE
A-0.0102<0.0005<0.0005<0.0005
B0.0102-0.01410.2753<0.0005
C<0.00050.0141-0.76930.8069
D<0.00050.27530.7693-0.1553
E<0.0005<0.00050.80690.1553-
Table 5. Results of the t-test—comparison between two groups.
DirectionMean of ⊥Mean of ‖t-Valuep-Value
A ⊥ vs. ‖412.43384.1010.890
B ⊥ vs. ‖408.83395.034.79<0.0005
C ⊥ vs. ‖424.73405.635.21<0.0005
D ⊥ vs. ‖424.50401.709.320
E ⊥ vs. ‖423.03409.333.510.0009
Table 6. Interactions of factors assessed.
FactorSSDFMSF-Statisticp-Value
Positions16,3064407627.40
Directions28,655128,655192.30
Positions × Directions232845823.90.0042
Table 7. The mean and standard deviation for roughness parameters.
PositionRa [µm]Rz [µm]RSm [µm]
A13.86 ± 0.9170.54 ± 1.97213.03 ± 11.98
B10.02 ± 0.8252.29 ± 4.62162.86 ± 18.11
C12.31 ± 1.0763.45 ± 4.39195.36 ± 22.95
D11.39 ± 0.7858.45 ± 4.19190.37 ± 20.56
E10.11 ± 0.7152.39 ± 3.06161.89 ± 15.19
Table 8. Results of the Kruskal–Wallis test, p-values.
RaABCDE
A-00.009400
B0-0<0.00051
C0.00940-0.17620
D0<0.00050.1762-<0.0005
E010<0.0005-
RzABCDE
A-00.009900
B0-00.00101
C0.00990-0.04880
D00.00100.0488-0.0007
E0100.0007-
RSmABCDE
A-00.36820.08210
B0-0<0.00051
C0.36820-10
D0.0821<0.00051-<0.0005
E010<0.0005-
Table 9. Corrosion characteristics of measured samples.
PositionMeasurementmVuAmVmVmmpyOhm
EcorrIcorrbcbarcorrRp
A1−4770.102211900.0055406,273
2−5020.071921690.0037521,109
3−4610.051701740.0028659,221
average−4800.071941780.0040528,868
B1−4450.062651870.0034681,194
2−4450.042031820.0024945,942
3−4890.091981960.0052434,692
average−4600.062221880.0037687,276
C1−4320.061911790.0032685,597
2−4330.072021880.0038584,907
3−4300.072001890.0035502,400
average−4320.071981850.0035590,968
D1−3710.091891890.0052374,813
2−4050.072261720.0036600,120
3−4090.082131740.0044484,030
average−3950.082091780.0044486,321
E1−4020.052251640.0026805,905
2−4210.072151820.0037581,262
3−4110.092051830.0046455,848
average−4110.072151760.0036614,338

