Abstract
The linear contraction and hot tearing behavior of 9Cr3Co3W heat-resistant steel during solidification were studied by combining in-situ casting experiments and the corresponding numerical simulations. The linear contraction, stress and temperature of the samples were detected during solidification. The results show that the linear contraction of 9Cr3Co3W heat-resistant steel was 1.7% in the sand mold. Meanwhile, the critical temperature and stress of the hot tearing that occurred at the hot spot were 1304 °C and 0.72 MPa, respectively. The occurrence of hot tearing was observed at the tip of secondary dendrites along the primary dendritic arms, where the solute elements were significantly enriched at the final solidification.
1. Introduction
Heat-resistant steels with a Cr content of 9–12 wt.% have been used in steam pipes of thermal power plants because of excellent creep, thermal properties and lower production costs compared with austenitic heat-resistant steels and nickel-based superalloys. It is well known that the critical steam temperature and pressure are the main indicators that decide the thermoelectric conversion efficiency and CO2 emission, so the development of heat-resistant steel for ultra-supercritical thermal power generating units is the key research of this field [1,2,3,4].
Due to the high content of components in heat-resistant steel and the large mushy zone during solidification, hot cracks are prone to occur during casting and welding, which brings difficulties to production [5,6].
Hot tearing that occurs in the mushy zone with high solid fraction during solidification has been researched since the 1940s [7,8,9]. In previous decades, many experiments have been designed to determine the hot tearing susceptibility and mechanism of alloys. It is generally known that hot tearing occurs between dendrites. The process of the alloy changing from a liquid to a solid phase can be divided into four stages, among which three critical temperature points are “coherence point”, “coalescence point”, “rigidity point”, respectively [10]. Hot tearing occurs between “coalescence point” and “rigidity point” at which the solid fraction is 90%–98% [6,11,12]. Farup et al. [9] used succinitrile-acetone alloy to in-situ observe the formation process of hot tearing, showing the process of hot tearing intuitively. The model proposed by Rappaz et al. [13] considered liquid feeding due to deformation of the coherent dendritic network and shrinkage. If the liquid feeding in the inter-dendritic region of the mushy zone is insufficient to compensate for the shrinkage and cumulative deformation of the mushy zone, then the pressure drops below a certain cavitation pressure, voids form and eventually coalesce to form a crack. Agarwal et al. [14] observed the solidification process of dual-phase steel in-situ by using a high-temperature laser scanning confocal microscope. Liquid feeding was observed in the inter-cellular regions during the terminal stage of solidification. Hot tearing of steel has been quantitatively analyzed.
The simulation of the casting process and temperature field is an increasingly important role in casting, which provides a reference for the optimization of the casting process. It is of great importance to obtain the critical temperature and stress conditions of hot tearing generating for optimizing the production process and improving the quality of castings. A number of hot tearing susceptibility experiments [15,16,17] have been done by impeding the shrinkage of molten alloy to generate hot cracks during solidification, and then authors have quantified the number of cracks and assessed the severity of cracks. Unfortunately, hot tearing experiments [15,16,17,18,19,20] consist mostly of low melting point alloys, which could not provide guidance for the casting process of steel castings. Zhong et al. [21] studied the hot tearing susceptibility of duplex stainless steel using in-situ casting equipment and obtained the critical temperature of thermal stress release during solidification.
In this paper, the hot tearing critical stress, temperature and solid fraction of the 9Cr3Co3W heat-resistant steel were investigated by casting experiments. The interface Heat Transfer Coefficients (iHTCs) was calculated by an iterated solving inverse model, and the temperature field of the sample was simulated by ProCAST, which provided reference parameters for the mold design and casting of 9Cr3Co3W heat-resistant steel castings.
2. Experimental Section
2.1. Method and Device
The hot cracks were produced by impeding shrinkage of the test rod in the axial direction with the device (Figure 1), where the temperature, tensile force and linear contraction of the test rod were recorded by thermocouples and sensors during solidification. The liquidus temperature and linear contraction of 9Cr3Co3W heat-resistant steel were inferred on the grounds of the recorded data. ProCAST (ProCAST 2009, ESI Group, Paris, France) was used to simulate the casting solidification process and optimized the temperature field of the sample. The optimization method is based on the inverse solidification heat transfer model [22], which is an algorithm for solving the definite solution conditions (or thermophysical parameters) according to the experimental results. More details on numerical simulation were expounded in Section 2.2. Therefore, the critical hot tearing stress and solid fraction can be analyzed.
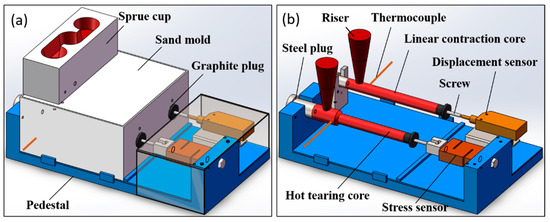
Figure 1.
Device diagram; (a) is assembled and (b) shows more details.
The composition of 9Cr3Co3W heat-resistant steel used in the experiment is shown in Table 1, among which row A represents the initial composition of steel and row B represents the composition of steel after pouring and solidification.

Table 1.
Composition of steel at different stages (wt.%, Fe: balance).
The schematic diagram of the test device is as shown in Figure 1. The pedestal material is Fe-0.45 wt.% C plain carbon steel, and its thickness is 10 mm for ensuring the rigidity of the device. The hot tearing and linear contraction measuring devices are placed on one pedestal. The sprue cup is designed to be one mold with two cavities. The sand mold material is made of silica sand and fly ash (the volume ratio of silica sand and fly ash is 20:1), and the binder is waterglass. Firstly, the conical filling pores (taper degree 1:15) that is used for exhausting are made on the formed sand mold. Secondly, the sand mold needs to be dried for 5 h in 200 °C with the purpose of ensuring the crystal water in the binder evaporates completely. Finally, an alcohol-based coating is coated on the inner surface of the mold cavity after drying, so that it can effectively avoid sand sticking and ensure the surface quality of the sample. Table 2 shows materials of sand and components of the coating. The thermocouple is type B with an upper limit of temperature of 1800 °C. The position of the thermocouples is the orange line as shown in Figure 1 and it is located 20 mm from the riser center and inserted radially into the core by 15 mm.
Table 2.
Composition of sand and coating.
The hot tearing core (shown as Figure 2) consists of two parts: a vertical runner and a horizontal rod with a total length of 200 mm. The rod consists of three sections: The coarse section with a diameter and length of 30 mm and 60 mm, respectively, the thin section with a diameter and length of 20 mm and 135 mm, respectively, and the hot pot with a length of 5 mm. One end of a steel screw (with a diameter of 6 mm) is fixed on the fixture, and another section with the length of 5 mm is inserted through the graphite plug into the cavity. The screw offered resistance to impede shrinkage of the rod during solidification with the purpose of generating hot cracks at the hot spot. The graphite plug (external diameter is 20 mm, inner diameter is 6 mm) is coaxial with the core. The inner hole of the graphite plug is smooth, which ensures the movement of the screw is unimpeded, and the plug can prevent the molten steel from flowing out of the mold during casting. The function of the steel plug is the same as the graphite plug.
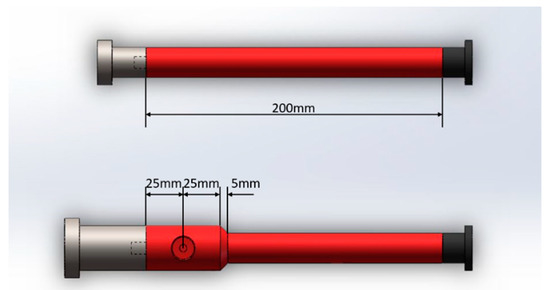
Figure 2.
Mold cores, steel plug and graphite plug.
The linear contraction core (shown as Figure 2) also consists of two parts: a vertical runner and a horizontal bar with a diameter of 20 mm and a total length of 200 mm. The function of the screw, graphite plug and steel plug assembled is the same as above.
After the whole device was assembled, it was placed in an intermediate frequency induction melting furnace. The vacuum was then pumped to below 10 Pa, and 99.99% pure argon gas was filled as a protective atmosphere. The melting time had to be controlled in 25 min. The pouring time was about 3 s. While the molten steel cooled with the mold, the two sensors and the temperature recorder collected data synchronously with a frequency of 10 Hz. The measurement precision of the stress sensor is ±0.01 N. The measurement precision of the displacement sensor is ±0.01 mm.
The test rods cooled to room temperature and then were removed from the sand mold. The test rod of the hot tearing experiment was cut into a sample and polished. The sample was etched for about 30 s in saturated picric acid aqueous solution while heating in a water bath. The dendritic structure of it was observed by optical microscopy. A scanning electron microscopy (SEM) sample was made by wire cutting for comparing the difference between the section of general crack and hot crack.
2.2. Interface Heat Transfer Coefficients
Numerical simulation can be used to reproduce the casting process and predict the occurrence of defects. The whole casting solidification process can be simulated to get the correct temperature field, among which iHTCs [23] is an important parameter. iHTCs were decided by many factors, such as pouring temperature, air gap, compositions of ingot, materials of sand mold, etc. However, iHTCs between ingot and mold were set to a fixed value in many articles that analyzed the ingot solidification process based on numerical simulation. Although this simplification improves the calculation efficiency, the influence of an interface air gap on ingot solidification heat transfer, solute convection and surface quality could not be ignored [24]. Accurate iHTCs between casting and mold could be acquired by using the Inverse Heat Conduction Problem (IHCP), so as to simulate more accurately the casting temperature field [25,26]. This method was adopted in this article. The device model was built by ProCAST. Considering the principle of mesh generation and calculation efficiency, the meshes of sand mold were rougher (≤5 mm), while the meshes of core were finer (≤2 mm).
3. Results and Discussion
Figure 3 shows the sample after pouring. The surface of the test rod was smooth after being taken out from the sand mold, and the risers have been removed. Figure 3a shows the linear contraction sample, and Figure 3b shows the hot tearing sample with cracks that appeared in the hot spot. The cracks appear to be an oxidation phenomenon. The surface of the crack is smooth, and there is no burr. According to the external morphology of the crack, it can be preliminarily deduced that the hot cracks were produced during solidification.
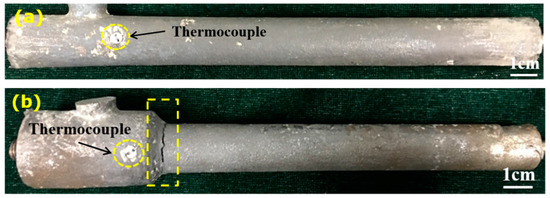
Figure 3.
(a) Sample of linear contraction experiment; (b) sample of a hot tearing experiment.
3.1. Linear Contraction Test Result
The pouring temperature of the molten steel is 1550 °C. Shown as Figure 4, from the point of view of thermal analysis, when the liquid phase transited to the solid phase, the latent heat of solidification released, and cooling rate slowed down. This corresponded to the first valley point of cooling rate curve at the solidification platform. The liquidus temperature of the steel could be judged as 1508.8 °C. The latent heat release occurred for the second time at 1399.0 °C, which was the phase transition point [5,21,27].
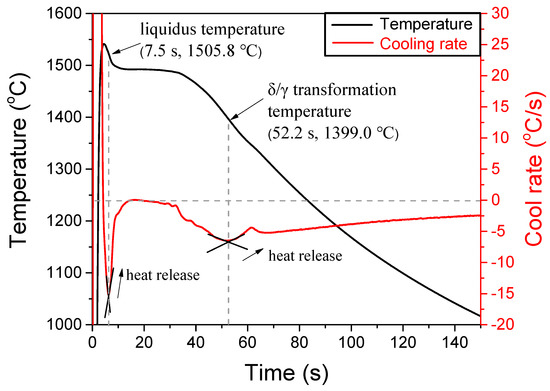
Figure 4.
Temperature and cooling rate vs. time curves.
In Figure 5, the linear contraction of the sample from 1550 °C to cooling to 300 °C was 3.42 mm (≈1.7%). In Figure 5a, point A represents that the sample began to shrink at 17.8 s after pouring. The main reason for the singular point B was that the sample was restricted by the cavity during cooling. As the solidification proceeded, the resistance collapsed. The contraction decreased after point C because of the phase transition. Point A in Figure 5b corresponds to point C in Figure 5a. When the phase transition was completed at 341.8 °C, then the contraction increased further because the temperature continued to decrease.
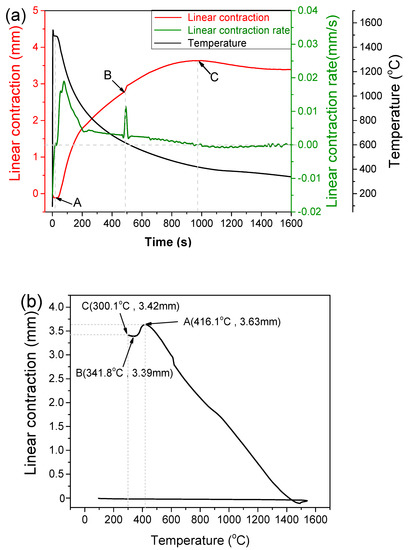
Figure 5.
(a) Temperature, linear contraction and the first derivative of linear con traction vs. time curves; (b) linear contraction vs. temperature curve.
3.2. Numerical Simulation Result
Figure 6a is the relationship between iHTCs changing with solidification, which was obtained by an iterated solving of the inverse model. As can be seen in Figure 6b, the iteration error is about 4.5 after 11 times of iteration, and it no longer decreases with an increase in the number of solutions. When the molten steel contacted with the sand mold, iHTCs were approximately 1825 W/(m2·K), it decreased rapidly to 20 W/(m2·K) at 20 s, it increased to about 400 W/(m2·K) at 40 s, after fluctuating slightly, and then it decreased to 20 W/(m2·K) at 140 s. It could have led to the change of iHTCs from 20 s to 40 s because of the existence of gas holes in the sand mold. The iHTCs being obtained in this way is closest to the actual value. Figure 7 shows that the numerical simulation cooling curve could be well matched with the measured cooling curve after correcting the iHTCs.
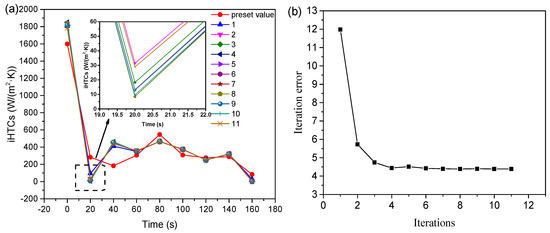
Figure 6.
(a) Interfacial heat transfer coefficient and (b) iteration error.
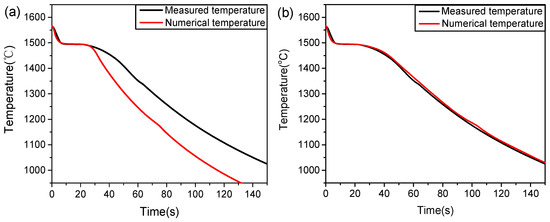
Figure 7.
Measured temperature and numerical simulation temperature vs. time curves of the sample. (a) Before correcting the iHTCs, (b) after correcting the iHTCs.
3.3. Hot Tearing Test Result
It can be seen that the force loaded on the stress sensor during a period of time is negative (compressive stress) and then increases to a positive value (pulling stress) just after pouring in Figure 8. The initial compressive stress was due to the expansion of a screw. In fact, there were two opposite phenomena, which were the contraction of the cast and the expansion of the apparatus, which took place simultaneously after pouring. At the initial solidification, when the solid fraction of the melt was very small, the shrinkage force of the melt and the casting could not be effectively transmitted to the pressure sensor; therefore the pressure stress induced by expansion was dominant. When a solidified shell with high strength was formed between the screw and the cast surface, the shrinkage force overcame the expansion force, so the stress value became positive. It can be understood that the cooling rate of bar far away from the gate was higher than that of the hot spot, which was due to the cooling effect of screws and the long-distance migration of molten steel. Therefore, for this casting, the area far away from the gate reached the coalescence point earlier than the hot spot area. Although during these stages of solidification the magnitude of the tensile force exerted on the stress sensor increased, the highest increase in the stress sensor is not realized until the end of the casting gate reached its coalescence point. At such stage, the hot spot of the casting started to behave like a fully cohesive porous medium and the whole casting formed a coherent solid body which contracted as a whole and could resist any restraint against its contraction [28].
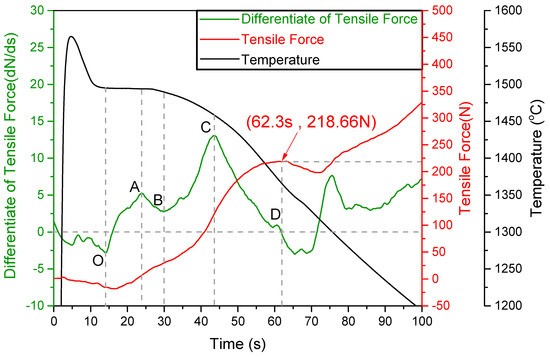
Figure 8.
The first derivative of tensile force, tensile force and temperature vs. time curves.
According to the theory of intergranular bridging and solidification shrinkage compensation [29,30,31,32], in Figure 8, the OA segment shows that dendrites begin to bridge, and the stress sensor was transformed from compressive stress to tensile stress. The cracks initiation occurred at point A, and the rate of stress increase was slow. However, the liquid alloy had strong feeding capacity, and the crack sources did not propagate. The BC segment began to enter the later stage of solidification, and the strength of the whole sample increased rapidly. The origin of cracks appeared again at point C because it was in the late solidification stage. When the feeding healed, the non-feeding zone was short of remnant liquid, so the sources of micro-crack formed in the dendrite separation stage and were enlarged continuously at this stage. The stress release phenomenon was observed at point D, and, finally, the cracks expanded continuously.
The variation rate of tensile stress at point C is zero in Figure 8, which represented tensile stress maximal value. The release of tensile stress occurred at 62.3 s in the solidification process after pouring. The measuring device limited the position of the sand mold and the stress sensor. When the molten steel was poured into the sand mold, the filling integrity of the molten steel could be judged from the sample, so the stress sensor was not subjected to reverse loading after 62.3 s, which proved the generating of hot cracks.
During the solidification, if the stress was higher than the yield strength of solidified shell and dendritic skeleton, the dendrites may have separated, and then cracks may occur. Such cracks can be repaired easily by feeding the molten metal before the coalescence point. However, after the coalescence point, the flow of liquid metal between dendrites becomes so difficult, it is almost impossible to flow to the final solidification region, and any cracks formed during this solidification stage may be retained in the casting [33].
The dendrite morphology which was infected by the cooling function of the inner surface of the casting mold is shown in Figure 9. Several obvious phenomena can be seen:
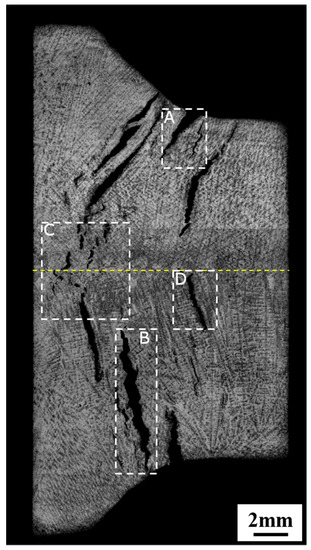
Figure 9.
The dendrite morphology of hot spot.
Area A: The cracks are triangular in shape. The aperture near the surface is larger than that far away from the surface, from which we can infer that the cracks originated from the surface and propagated to the center.
Area B: It can be observed that the crack is located in the center of the sample, and the crack did not extend to the surface. The crack aperture in the middle is larger than both ends, which shows an obvious ‘eye’ shape. It can be inferred that the crack germinated in the middle of the sample, and then propagated to the surface and center of the hot spot.
Area C is in the center of the hot spot. Because the temperature gradient of the sample is perpendicular to the surface of the sand mold, the region of cracks aggregation can be observed. The region is the last place to solidify in the hot spot.
Area D: The cracks on this position can be observed to be markedly serrated. It can be inferred that the hot tearing occurred in the gap between primary dendritic arm and another.
Scanning electron microscopy samples were made by wire cutting as shown in Figure 10a; the sampling position was at the dotted frame of Figure 3b. The sample was cleaned by an ultrasonic wave in an acetone solution for 20 min, and then it was washed with alcohol and dried by a blower. Part A marked in Figure 10a’ is the hot crack formed during solidification, so its surface was oxidized. Part B is a shear fracture interface, so its surface was bright. The fracture interface presents lamellar-type, while the hot crack surface presents an obvious spherical shape. This phenomenon coincides with the two-dimensional zigzag shape of secondary dendrites shown in area D of Figure 9. Therefore, it was inferred that the path of hot tearing was at the tip of the secondary dendrites along the primary dendritic arm, within the solute enrichment zone at the final solidification [16,34]. The peaks in Figure 10b which were observed by SEM were generated from dendrite bridges which were broken by an external force during solidification [9]. However, the shape of the peak was incomplete because of the oxidation of the sample during cooling and impact of external forces during sampling.
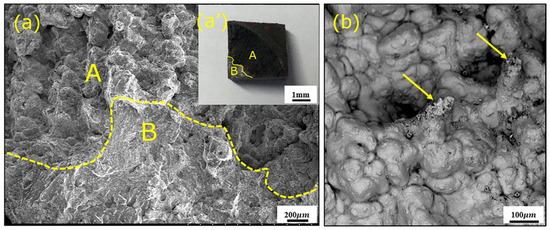
Figure 10.
SEM images of hot crack. (a’) Sample for observation; (a) Partial enlarged detail of (a’); (b) The peaks generated from broken dendrite bridges.
There is 10 mm between the point of the thermocouples and the hot crack along the axial direction, the temperature curve and solid fraction of the hot crack were produced by numerical simulation after correcting the iHTCs, as shown in Figure 11. The critical temperature, solid fraction and stress were 1304 °C, 0.962 and 0.72 MPa at 62.3 s after pouring, respectively. The calculation formula of critical stress is as follows:
where is the stress, is the solid fraction, is the tensile force; is the cross-sectional area size of the rod at the hot crack.
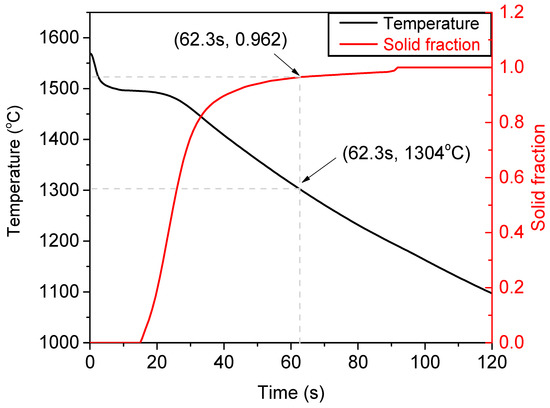
Figure 11.
Temperature and solid fraction vs. time curves at hot crack by numerical simulation.
4. Conclusions
In this paper, hot tearing that occurred in 9Cr3Co3W heat-resistant steel was studied by combining solidification experiments and the corresponding numerical simulations. The related conclusions can be drawn as follows:
- The measured linear contraction of the steel sample in the sand mold was 1.7% when the temperature was decreased from 1550 °C to 300 °C.
- The solid fraction, temperature and stress corresponding to the stress release point (i.e., the cracks initiation point) in the hot spot were 0.962, 1304 °C and 0.72 MPa, respectively. The achieved solid fraction and stress at the stress release point can be regarded as the criteria for the occurrence of hot tearing under this experiment.
- According to the metallographic results, the trajectory of hot tearing was observed at the tip of the secondary dendrites along the primary dendritic arm, which was in the solute enrichment zone at the final solidification.
Author Contributions
H.Z. conceived and designed the experiments; X.L., H.Z. and B.W. performed the experiments; H.Z., X.L., B.W., Y.Z., T.W., B.L. and Q.Z. analyzed and discussed the data; all authors contributed equally in writing the paper.
Funding
This work was financially supported by the National Natural Science Foundation of China (Grant No. 51504148, 51704192 and U1760204), the National Key Research and Development Program of China (Grant No. 2017YFB0701802).
Conflicts of Interest
The authors declare no conflict of interest.
Abbreviations
The following abbreviations are used in this manuscript:
| iHTCs | Interface Heat Transfer Coefficients |
| IHCP | Inverse Heat Conduction Problem |
| SEM | Scanning electron microscopy |
References
- Xiao, B.; Xu, L.; Zhao, L.; Jing, H.; Han, Y.; Zhang, Y. Creep properties, creep deformation behavior, and microstructural evolution of 9Cr-3W-3Co-1CuVNbB martensite ferritic steel. Mater. Sci. Eng. A 2018, 711, 434–447. [Google Scholar] [CrossRef]
- Abe, F. Research and Development of Heat-Resistant Materials for Advanced USC Power Plants with Steam Temperatures of 700 °C and Above. Engineering 2015, 1, 211–224. [Google Scholar] [CrossRef]
- Viswanathan, R.; Coleman, K.; Rao, U. Materials for ultra-supercritical coal-fired power plant boilers. Int. J. Press. Ves. Pip. 2006, 83, 778–783. [Google Scholar] [CrossRef]
- U.S. Energy Information Administration. International Energy Outlook 2017; EIA: Washington, DC, USA, 2017; pp. 77–90.
- Zhou, X.; Liu, Y.; Qiao, Z.; Guo, Q.; Liu, C.; Yu, L.; Li, H. Effects of cooling rates on δ-ferrite/γ-austenite formation and martensitic transformation in modified ferritic heat resistant steel. Fusion Eng. Des. 2017, 125, 354–360. [Google Scholar] [CrossRef]
- Li, Y.; Gao, X.; Zhang, Z.R.; Xiao, W.L.; Li, H.X.; Du, Q.; Katgerman, L.; Zhang, J.S.; Zhuang, L.Z. Experimental and Theoretical Studies of the Hot Tearing Behavior of Al-xZn-2Mg-2Cu Alloys. Metall. Mater. Trans. A 2017, 48, 4744–4754. [Google Scholar] [CrossRef]
- Farup, I.; Mo, A. Two-phase modeling of mushy zone parameters associated with hot tearing. Metall. Mater. Trans. A 2000, 31, 1461–1472. [Google Scholar] [CrossRef]
- Dahle, A.K.; StJohn, D.H. Rheological behaviour of the mushy zone and its effect on the formation of casting defects during solidification. Acta Mater. 1998, 47, 31–41. [Google Scholar] [CrossRef]
- Farup, I.; Drezet, J.M.; Rappaz, M. In situ observation of hot tearing formation in succinonitrile-acetone. Acta Mater. 2001, 49, 1261–1269. [Google Scholar] [CrossRef]
- Eskin, D.G.; Suyitno; Katgerman, L. Mechanical properties in the semi-solid state and hot tearing of aluminium alloys. Prog. Mater. Sci. 2004, 49, 629–711. [Google Scholar] [CrossRef]
- Djurdjevic, M.B.; Schmid-Fetzer, R. Thermodynamic calculation as a tool for thixoforming alloy and process development. Mater. Sci. Eng. A 2006, 417, 24–33. [Google Scholar] [CrossRef]
- Eskin, D.G.; Katgerman, L. Quest for a New Hot Tearing Criterion. Metall. Mater. Trans. A 2007, 38, 1511–1519. [Google Scholar] [CrossRef]
- Rappaz, M.; Drezet, J.M.; Gremaud, M. A new hot-tearing criterion. Metall. Mater. Trans. A 1999, 30, 449–455. [Google Scholar] [CrossRef]
- Agarwal, G.; Amirthalingam, M.; Moon, S.C.; Dippenaar, R.J.; Richardson, I.M.; Hermans, M.J.M. Experimental evidence of liquid feeding during solidification of a steel. Scr. Mater. 2018, 146, 105–109. [Google Scholar] [CrossRef]
- Gunde, P.; Schiffl, A.; Uggowitzer, P.J. Influence of yttrium additions on the hot tearing susceptibility of magnesium-zinc alloys. Mater. Sci. Eng. A 2010, 527, 7074–7079. [Google Scholar] [CrossRef]
- Wang, Y.; Wang, Q.; Wu, G.; Zhu, Y.; Ding, W. Hot-tearing susceptibility of Mg-9Al-xZn alloy. Mater. Lett. 2002, 57, 929–934. [Google Scholar] [CrossRef]
- Cao, G.; Kou, S. Hot cracking of binary Mg-Al alloy castings. Mater. Sci. Eng. A 2006, 417, 230–238. [Google Scholar] [CrossRef]
- Song, J.; Pan, F.; Jiang, B.; Atrens, A.; Zhang, M.; Lu, Y. A review on hot tearing of magnesium alloys. J. Magnes. Alloys 2016, 4, 151–172. [Google Scholar] [CrossRef]
- Song, J.; Wang, Z.; Huang, Y.; Srinivasan, A.; Beckmann, F.; Kainer, K.U.; Hort, N. Effect of Zn addition on hot tearing behaviour of Mg-0.5Ca-xZn alloys. Mater. Des. 2015, 87, 157–170. [Google Scholar] [CrossRef]
- Li, S.; Sadayappan, K.; Apelian, D. Role of Grain Refinement in the Hot Tearing of Cast Al-Cu Alloy. Metall. Mater. Trans. B 2013, 44, 614–623. [Google Scholar] [CrossRef]
- Wei, Z.; Chen, X.; Zhong, H.; Zhai, Q.; Wang, G. Hot tearing susceptibility of Fe-20.96Cr-2.13Ni-0.15N-4.76Mn-0.01Mo duplex stainless steel. J. Iron Steel Res. Int. 2017, 24, 421–425. [Google Scholar] [CrossRef]
- Kermanpur, A.; Eskandari, M.; Purmohamad, H.; Soltani, M.A.; Shateri, R. Influence of mould design on the solidification of heavy forging ingots of low alloy steels by numerical simulation. Mater. Des. 2010, 31, 1096–1104. [Google Scholar] [CrossRef]
- Wang, D.; Zhou, C.; Xu, G.; Huaiyuan, A. Heat transfer behavior of top side-pouring twin-roll casting. J. Mater. Process. Technol. 2014, 214, 1275–1284. [Google Scholar] [CrossRef]
- Qiang, L.; Chunli, M.; Xiuhong, K.; Dianzhong, L.; Bainian, Q. Numerical simulation of the influence of heat extract boundary conditions and desities on the thermo-solutal convection. Mater. Sci. Technol. 2005, 13, 94–98. [Google Scholar]
- Palumbo, G.; Piglionico, V.; Piccininni, A.; Guglielmi, P.; Sorgente, D.; Tricarico, L. Determination of interfacial heat transfer coefficients in a sand mould casting process using an optimised inverse analysis. Appl. Therm. Eng. 2015, 78, 682–694. [Google Scholar] [CrossRef]
- Zhang, L.; Reilly, C.; Li, L.; Cockcroft, S.; Yao, L. Development of an inverse heat conduction model and its application to determination of heat transfer coefficient during casting solidification. Heat Mass Transf. 2014, 50, 945–955. [Google Scholar] [CrossRef]
- Wendler, M.; Hauser, M.; Fabrichnaya, O.; Krüger, L.; Weiß, A.; Mola, J. Thermal and deformation-induced phase transformation behavior of Fe-15Cr-3Mn-3Ni-0.1N-(0.05-0.25)C austenitic and austenitic-martensitic cast stainless steels. Mater. Sci. Eng. A 2015, 645, 28–39. [Google Scholar] [CrossRef]
- Esfahani, M.R.N.; Niroumand, B. Study of hot tearing of A206 aluminum alloy using Instrumented Constrained T-shaped Casting method. Mater. Charact. 2010, 61, 318–324. [Google Scholar] [CrossRef]
- M’Hamdi, M.; Mo, A.; Fjær, H.G. TearSim: A two-phase model addressing hot tearing formation during aluminum direct chill casting. Metall. Mater. Trans. A 2006, 37, 3069–3083. [Google Scholar] [CrossRef]
- M’Hamdi, M.; Mo, A.; Martin, C.L. Two-phase modeling directed toward hot tearing formation in aluminum direct chill casting. Metall. Mater. Trans. A 2002, 33, 2081–2093. [Google Scholar] [CrossRef]
- Mathier, V.; Drezet, J.; Rappaz, M. Two-phase modelling of hot tearing in aluminium alloys using a semi-coupled approach. Model. Simul. Mater. Sci. Eng. 2007, 15, 121–134. [Google Scholar] [CrossRef]
- Mathier, V.; Jacot, A.; Rappaz, M. Coalescence of equiaxed grains during solidification. Model. Simul. Mater. Sci. Eng. 2004, 12, 479–490. [Google Scholar] [CrossRef]
- Hamadellah, A.; Bouayad, A.; Gerometta, C. Hot tear characterization of AlCu5MgTi and AlSi9 casting alloys usingan instrumented constrained six rods casting method. J. Mater. Process. Technol. 2017, 244, 282–288. [Google Scholar] [CrossRef]
- Wang, Y.; Sun, B.; Wang, Q.; Zhu, Y.; Ding, W. An understanding of the hot tearing mechanism in AZ91 magnesium alloy. Mater. Lett. 2002, 53, 35–39. [Google Scholar] [CrossRef]


© 2018 by the authors. Licensee MDPI, Basel, Switzerland. This article is an open access article distributed under the terms and conditions of the Creative Commons Attribution (CC BY) license (http://creativecommons.org/licenses/by/4.0/).