Article

Estimating the Effective Elastic Parameters of Nodular Cast Iron from Micro-Tomographic Imaging and Multiscale Finite Elements: Comparison between Numerical and Experimental Results

1
Engineering School, Fluminense Federal University, Rua Passo da Patria 156, Niterói 24210-240, Brazil
2
Institute of Computing, Fluminense Federal University, Rua Passo da Pátria 156, Niterói 24210-240, Brazil
3
Group of Experimental and Computational Mechanics, University of Brasília, Gama 72.405-610, Brazil
*
Authors to whom correspondence should be addressed.
Metals 2018, 8(9), 695; https://doi.org/10.3390/met8090695
Submission received: 1 August 2018 / Revised: 1 September 2018 / Accepted: 4 September 2018 / Published: 5 September 2018
(This article belongs to the Special Issue Cast Irons: Properties and Applications)

Abstract

:
Herein, we describe in detail a methodology to estimate the effective elastic parameters of nodular cast iron, using micro-tomography in conjunction with multiscale finite elements. We discuss the adjustment of the image acquisition parameters, address the issue of the representative-volume choice, and present a brief discussion on image segmentation. In addition, the finite-element computational implementation developed to estimate the effective elastic parameters from segmented microstructural images is described, indicating the corresponding computational costs. We applied the proposed methodology to a nodular cast iron, and estimated the graphite elastic parameters through a comparison between the numerical and experimental results.

1. Introduction

Prior to the popularity of steel in construction, cast irons were the most widely used materials for such applications. Although cast iron has been mostly replaced by other materials, continuous improvements in metal-foundry processes have recently stimulated its production, resurrecting it as a major engineering material. Among the several types of cast irons available today, nodular (ductile, spheroidal) cast iron, which was developed in the mid-twentieth century, holds the most promise with respect to mechanical properties. The graphite phase within the nodular cast-iron matrix is in the form of small nodules, the size, shape, and arrangement of which control its effective mechanical properties, as illustrated in Fragassa et al. [1].
Scanning techniques such as microscopy are commonly used to capture the microstructures of cast irons. Although optical microscopy (as well as scanning electron microscopy) provides high-resolution imaging, its results are limited to the free surface of a specimen. Originally, studies on cast iron involved two-dimensional (2-D) images and models [2,3,4]. The quantification of graphite nodules by these techniques is possible but poor, because they only provide 2-D information, which limits the interpretation of results. Therefore, such models cannot provide a complete picture of the three-dimensional (3-D) cast-iron microstructures.
In recent years, X-ray micro-computed tomography (micro-CT) has proven to be well suited for the 3-D investigation of several materials, becoming an attractive non-destructive characterization technique in materials science [5]. More recently, micro-CT has also been applied to cast irons [6,7,8], showing that tomographic images provide affordable means to accurately describe, in 3-D, the morphological complexity of the graphite-nodule shapes and arrangements in nodular cast irons. Although these studies represent significant contributions, their quantitative analyses were restricted to geometric measurements such as the graphite volume fraction, nodule sphericity, minimum bounding-sphere diameter, graphite particle-size distributions, etc.
There is also a research community investigating the mechanical properties of nodular cast irons by means of numerical simulations and multiscale methods [2,3,4,9,10,11]. Therefore, the last two decades have evidenced a major shift, from treating cast irons only at the macroscale level, to complex multiscale models. Based on these well-documented numerical procedures and models [2,3,4,9,10,11], finite elements (FE) and homogenization techniques have been shown to be appropriate strategies for predicting the effective elastic properties of cast irons. However, most published studies have been restricted to the use of 2-D images [2,3,4], or have synthetically represented the graphite nodules as perfect discs or spheres [9,10,11], statistically distributed within the matrix. Such idealizations have led to poor numerical models, as indicated by Chuang et al. [7], where the authors investigated the complexity of the graphite 3-D structure, and its spatial distribution within the alloy.
To the best of our knowledge, there are no published studies that have taken advantage of the accurate description of the internal microstructure provided by micro-CT, to numerically evaluate the elastic properties of nodular cast irons. Therefore, the main aim of this work is to combine advanced numerical simulations with micro-CT imaging, to accurately compute the homogenized elastic parameters of nodular cast irons.
In addition, there are no literature reports that comprehensively describe the mechanical behavior of graphite nodules. To illustrate this, in Andriollo and Hattel [11], the authors summarized the graphite elastic parameters considered in several literature reports, highlighting that they range from 0 (void) to 375 GPa, as shown in Table 1 of the reference. In the present study, we apply the developed methodology to estimate the elastic parameters associated with graphite nodules. To that end, several numerical simulations were performed varying the graphite-nodule elastic parameters and keeping those of the ferritic-matrix fixed. The graphite elastic parameters were then estimated through a comparison between experimental and numerical results.

2. Materials and Methods

In this section, the nodular cast iron investigated in this study is introduced, and the methods used to obtain the homogenized elastic properties are discussed.

2.1. Nodular Cast Iron

The term “nodular cast iron” refers to a family of ternary alloys, formed by iron, carbon (4% maximum), and silicon (1.7 to 2.8%). This type of cast iron is characterized by the presence of carbon, in the form of spheroidal graphite, in a ferritic or pearlitic matrix. The graphite nodulation is achieved by adding a specific amount of magnesium to the molten metal. The resulting spheroidal graphite provides the nodular cast iron with better properties when compared to other cast irons, as discussed in Fragassa et al. [12]. The properties of nodular cast iron can be controlled through the cooling rate, addition of other alloying elements, casting method, and heat treatment, which may influence the graphite shape. The effective properties of these materials vary according to the graphite-nodule proportions and shapes. For these and other reasons, there is a need to characterize this material at the microstructural level.
The nodular cast iron used in this investigation was ASTM A536 (Metalrens, Minas Gerais, Brazil) grade 60-40-18 (the grade sequentially indicates the tensile strength (ksi), yield strength (ksi), and percent elongation at failure) ductile cast iron with a fully ferritic matrix, corresponding to the equivalent grade GGG40 for the DIN 1693 standard. The manufacturer was Metalrens, Ltd. [13]. Its mechanical behavior was characterized by tensile testing, and by digital and computational procedures consisting of micro-CT and multiscale homogenization with FE, respectively. The detailed test procedures are described in the following.

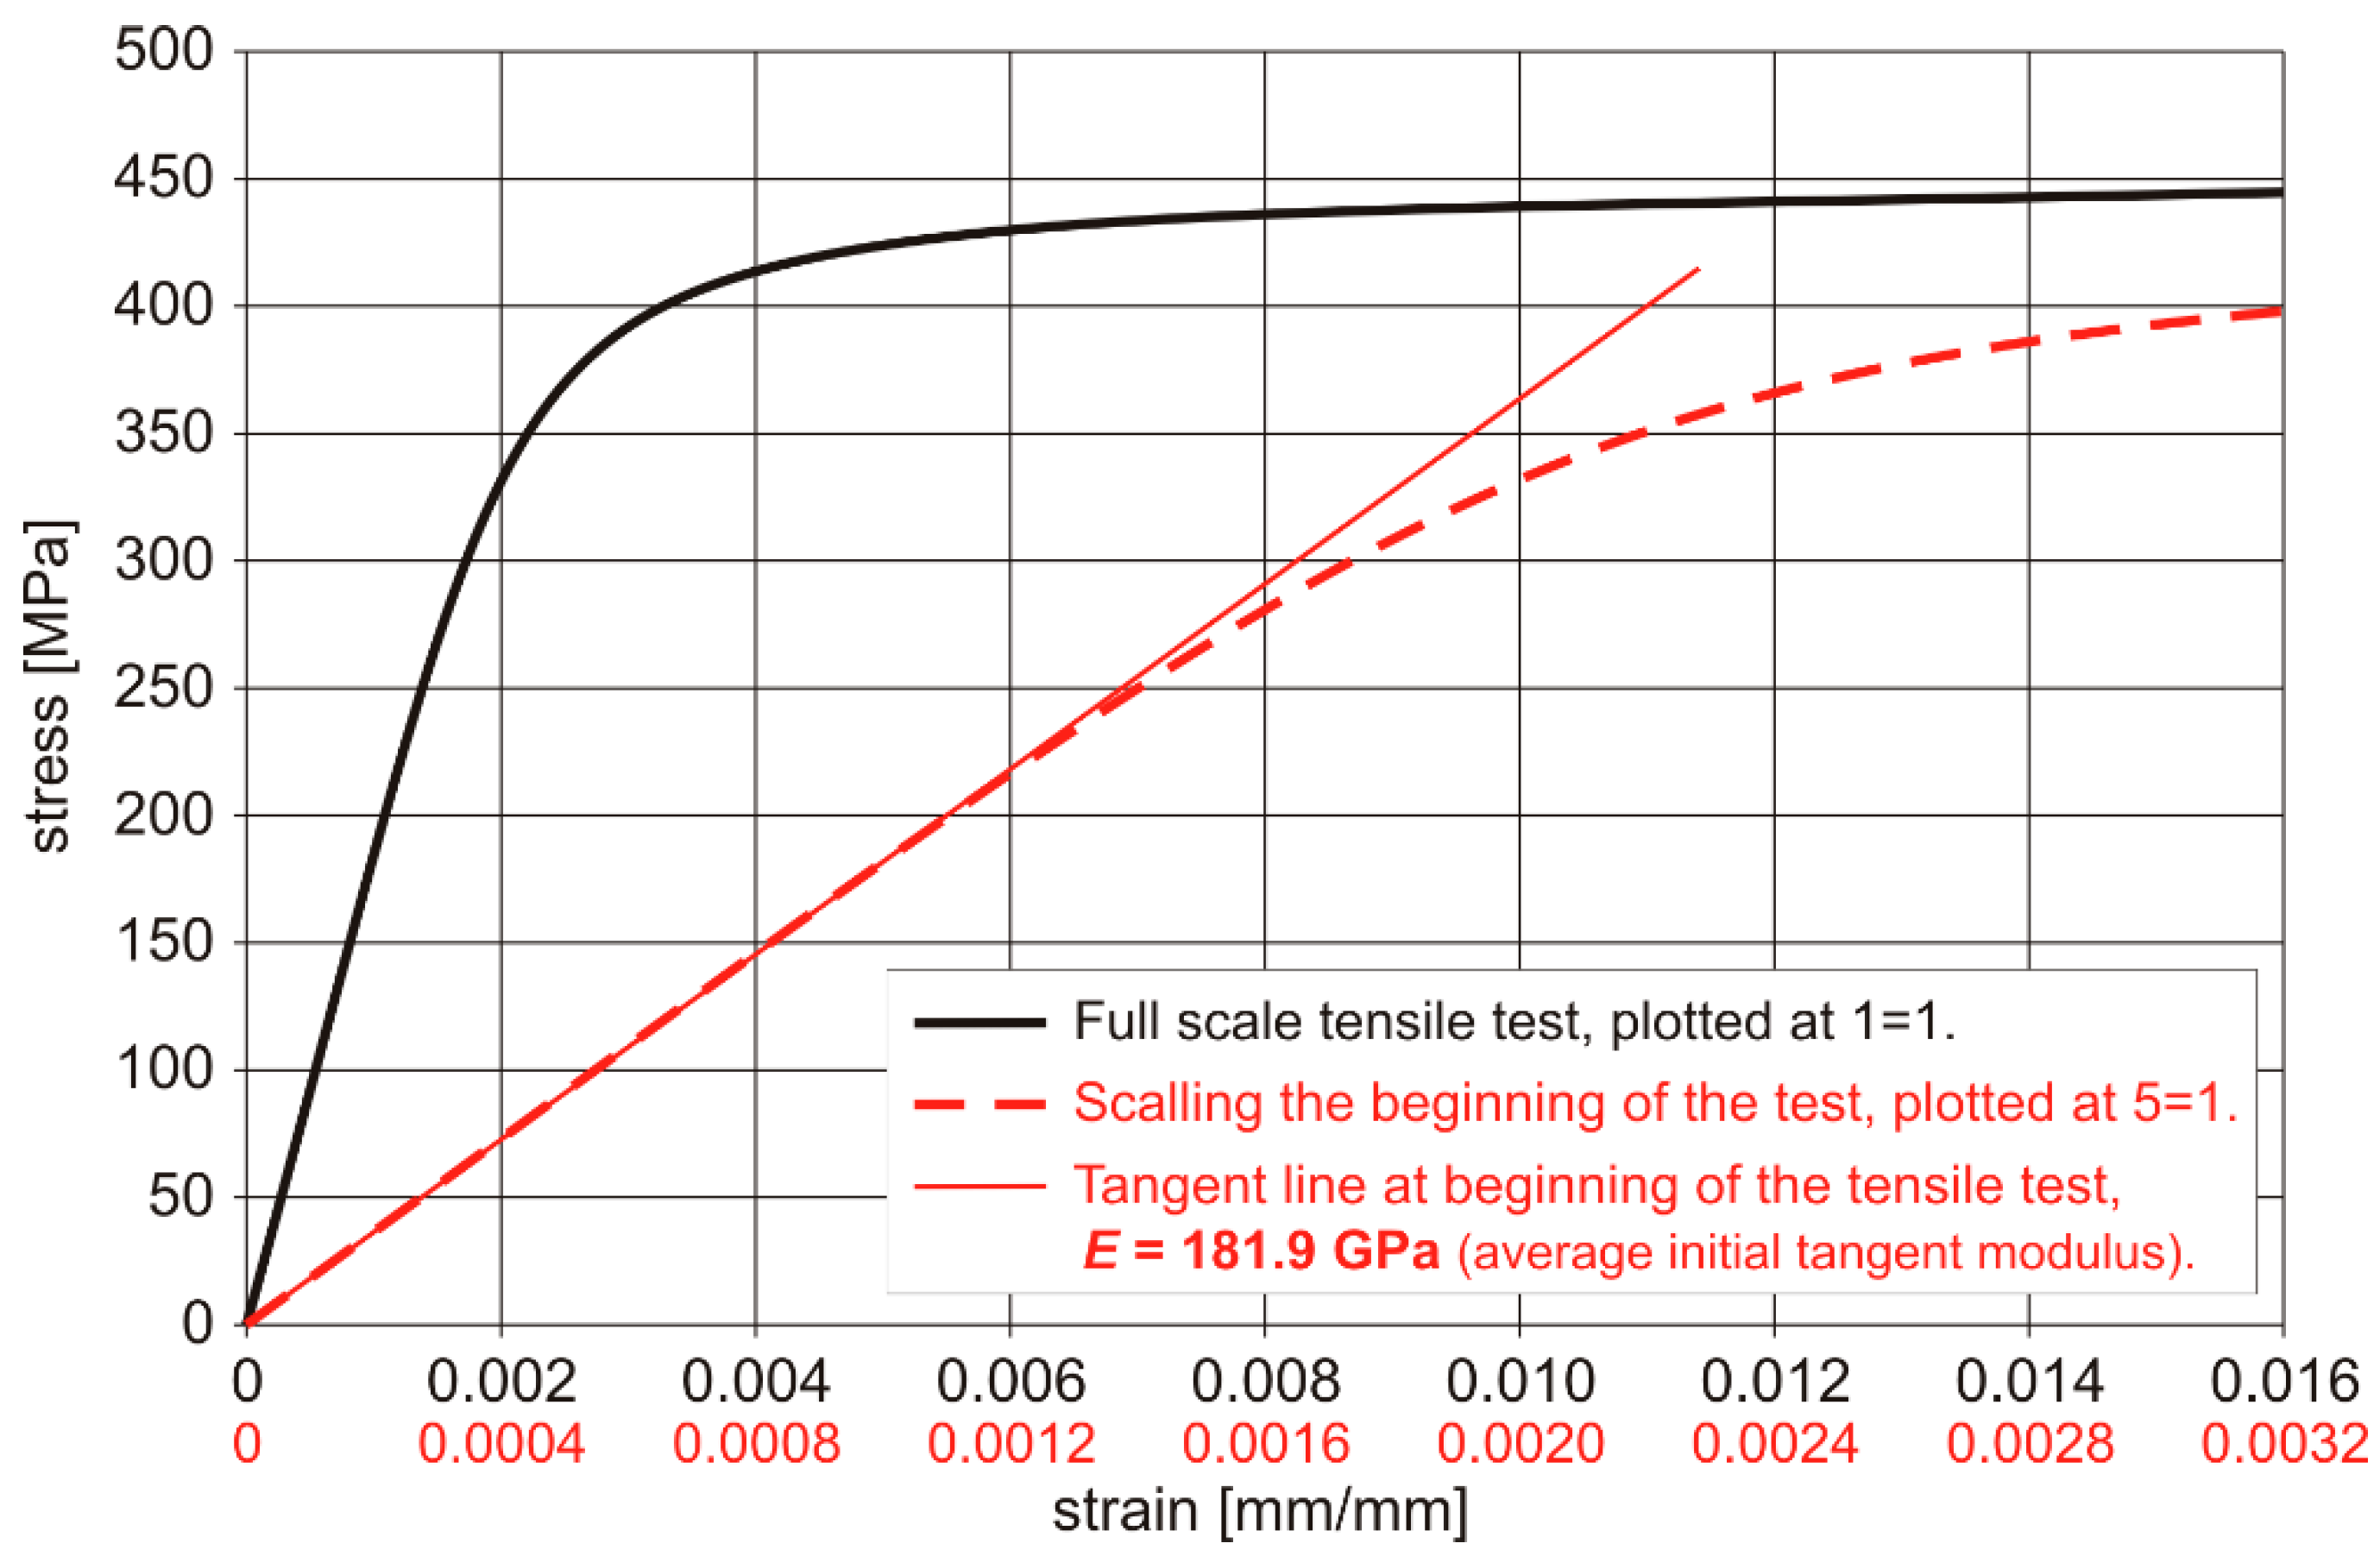
2.2. Experimental Tensile Testing

Tensile tests were performed according to the general guidelines given by the ASTM E8/E8M-09 Standard [14]. Four specimens were tested between parallel plates on an Instron 8801 test machine (Instron, Glenview, IL, USA) [100 kN (22,500 lbf)]. During testing, the specimen deflection increased at a constant rate, and was measured with a 2620-601 dynamic gauge extensometer (Instron, Glenview, IL, USA).
A single value was used for the elastic modulus obtained through the stress-strain curves. Since graphite sometimes exhibits nonlinear mechanical behavior, the use of a single-value elastic modulus could be questioned. Hence, the constitutive Young’s modulus was identified as the slope of the experimental stress-strain curve at the beginning of the test, as indicated in Figure 1. The average initial tangent modulus obtained from several tests was E = 181.9 GPa.

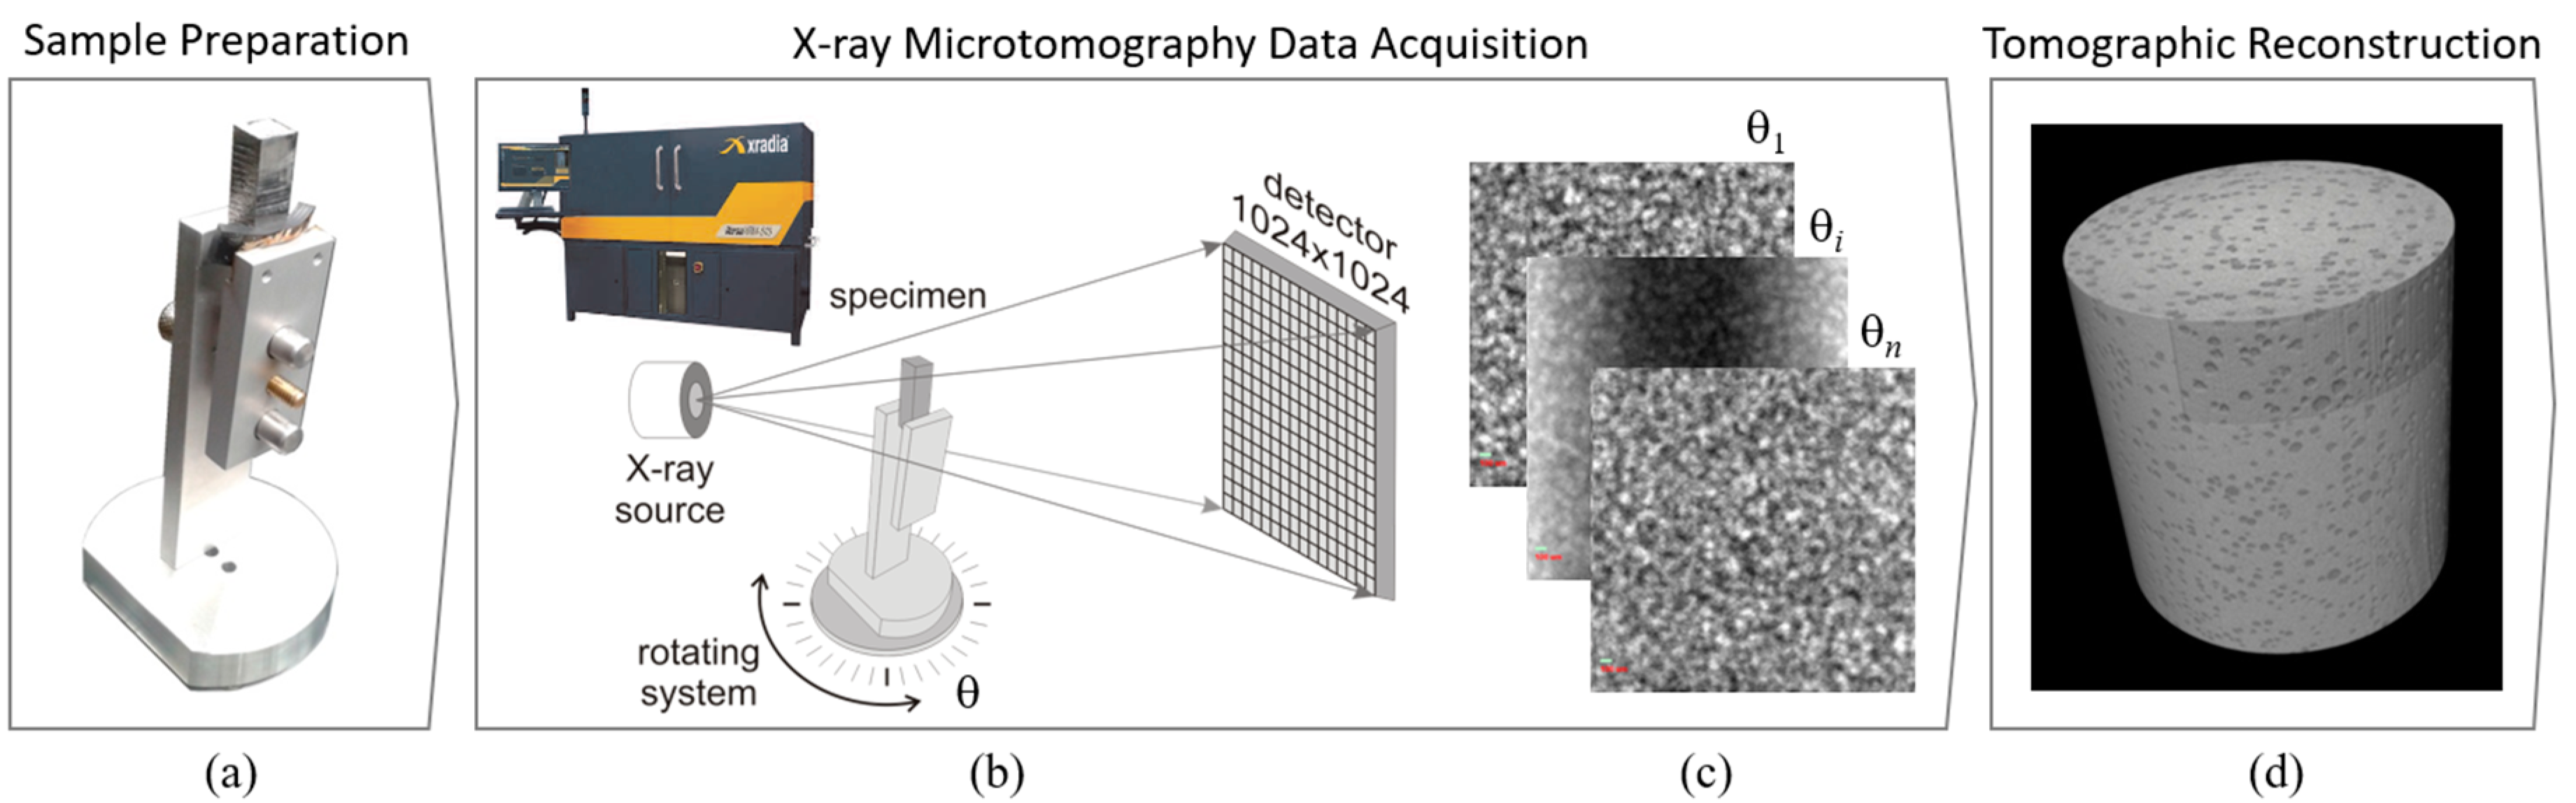
2.3. X-Ray Micro-Tomography, Image Reconstruction, and Image Segmentation

X-ray micro-computed tomography (micro-CT), depicted in Figure 2, was conducted using a laboratory-based ZEISS VersaXRM-510 (ZEISS, Jena, Germany) high-resolution scanner system, with a minimum voxel size of 0.1 μm (resolution), and a maximum power output and voltage of 10 W and 160 kV, respectively. TXM Controller software (or the Scout-and-scan Control System, both by Zeiss, version 11.1.8043, Jena, Germany) was used to perform the scanning.
To obtain the tomographic images, the sample dimensions were specially chosen to ensure adequate X-ray transmission for high-resolution radiographs. Since cast irons are generally commercialized in the form of large blocks, small prismatic samples were extracted from a larger block, and machined to the 7 × 8 × 24 mm3 dimensions as illustrated in Figure 2a.
In our system, the sample to be imaged is positioned between an X-ray source and detector, as schematically represented in Figure 2b. The system generates X-rays with a cone-beam geometry. The detector registers the energy transmitted through each X-ray beam, which is proportional to the sample-density spatial distribution, thus generating a radiograph. Computed tomography (CT) is based on the repetitive radiographic sectioning of a sample, where radiograms are sequentially acquired while the sample (or the source-detector system) is incrementally rotated, as schematically shown in Figure 2b,c. From the collection of acquired radiograms, cross-sectional images of the sample are computed using tomographic-reconstruction algorithms, producing a stack of 2-D raw grey-scale horizontal-image slices. The 3-D digital object can then be visualized from the 2-D grey-scale image stack, as indicated in Figure 2d. In micro-CT, the dimensions of the reconstructed voxels (i.e., a volumetric pixel element) are generally in the micrometer range. TXM Reconstructor software was used to perform the image reconstruction.
For high-quality micro-CT, all scans were conducted at an X-ray beam energy of 160 kV and a power of 10 W. The distance between the specimen and X-ray source, and between the specimen and detector, varied according to the target resolution. For the nodular cast iron sample under investigation, three micro-CTs were acquired, each with a different resolution. Optical magnifications of 0.4× and 4× were used for the lower (11 μm pixel size) and higher (both 3 μm and 1 μm pixel size) resolutions, respectively, in 1024 × 1024 pixel projection images. A different exposure time was set for each scan, to get intensity values ≥5000, for the best signal-to-noise ratio. Sets of 3200 projections (radiographs) were captured over a 360° sample rotation for each scan. Figure 3 shows the three regions of the sample that were imaged. The scanning parameters used to acquire the tomographic data, targeting three different resolutions, are shown in Table 1. The total scanning time for the 11 μm, 3 μm and 1 μm pixel size micro-CT was 2 h 40 min, 8 h 53 min and 26 h 40 min, respectively.
The image resolution plays a central role in the success of the subsequent analyses. The resolution is typically selected based on two opposing criteria: (i) it should be high enough to resolve the microstructure, and (ii) it should be low enough for selection of a representative volume whose corresponding image size is treatable in the numerical simulations. In the current study, images of up to 400 × 400 × 400 voxels were considered as treatable. The issue of imaging-resolution selection is illustrated in the following example.
In Figure 3b–d, three micro-CT slices of the same nodular cast iron sample are shown. In Figure 3b, the sample was imaged with a resolution of 11 μm, while in Figure 3c,d it was imaged with a resolution of 1 μm and 3 μm, respectively. All the outer circles represented in the figures are of 1024 pixel diameter. Visual inspection showed that the 3 μm resolution was sufficient to resolve the microstructure, since the graphite-grain contours in Figure 3d could be easily distinguished, as well as in the three-dimensional view of Figure 3a. The 1 μm resolution (of course) was also sufficient to resolve the microstructure. In fact, the graphite-grain contour details in Figure 3c are superior to those in Figure 3d, although this did not impact the numerical simulations significantly. On the other hand, the 11 μm resolution (Figure 3b) was insufficient to resolve the microstructure. In addition, as indicated by Figure 4 and Figure 5, for the 3 μm resolution, a 400 × 400 × 400 voxel cube would contain dozens, if not hundreds, of nodules, while, for the 1 μm resolution, a 400 × 400 × 400 voxel cube would contain only a few nodules. Further, for the 3 μm resolution, any 400 × 400 × 400 voxel cube would have approximately the same microstructure, being thus a representative volume, while, for the 1 μm resolution, 400 × 400 × 400 voxel cubes can potentially have very different microstructures. It can be concluded that the resolution of 3 μm is suitable for the present case, since it met both the criteria listed above.
Direct volume rendering is a convenient way to explore micro-CT data. This method allows the analyst to study in detail the compositional variation in terms of connectivity, distribution, and relative density. 3-D image-analysis software (AVIZO, version 8.1, FEI, Massachusetts, MA, USA) was used for visualization, image processing, and segmentation. As described in Chuang et al. [7], the occurrence of coral-tree-like morphology that can span several-hundred microns in the iron matrix, was identified in the nodular cast-iron sample.
To perform complex measurements and to generate the model-mesh, it requires the elimination of noise and artefacts. Initially, the full volume represented by the stack of 1024 slices of 1024 × 1024 pixels, was cropped by discarding approximately the first-100 slices at the top and the last-100 slices at the bottom. This was necessary because the X-ray cone-beam geometry typically generates artefacts in those regions. Next, a denoising filter was applied to improve the reconstructed-image quality. There are several different filters available for this purpose, and the non-local means image-smoothing filter that removes high-frequency noise, was used in this analysis. Then, different phases of the object were identified and separated, through a procedure known as segmentation. In the context of digital material science, the main goal of image segmentation is to identify (and label) all the distinct phases in the material-sample digital image. A sophisticated and robust image-segmentation technique known as “watershed algorithm” was used. This technique involves placing seeds in different regions of the image and growing them until they reach a “barrier”, determined by the image gradients. For image filtering and segmentation, a commercially available image-processing package (AVIZO) was used, which is capable of rapidly handling 1024 × 1024 × 1024 voxel images using an ordinary personal computer (PC). Illustrative results of filtering and segmentation for the nodular cast iron are depicted in Figure 4.
Figure 4a shows a single slice of a non-processed micro-CT, zoomed-in on a small region (Figure 4b), and highlights the effect of applying a filter (non-local mean, Figure 4c) and performing a segmentation (watershed algorithm, Figure 4d). In Figure 4d, the ferritic matrix is in a dark-blue color and the graphite nodules are in light blue.
The next step was to create a set of regions of interest (ROI), as depicted in Figure 4a, for measurements and property estimates. For each ROI, the graphite/ferrite relative amount was calculated by dividing the total number of graphite-phase voxels by the total number of ROI voxels (since all voxels are of the same size). Generally, the larger the ROI, the more accurate the estimates are.

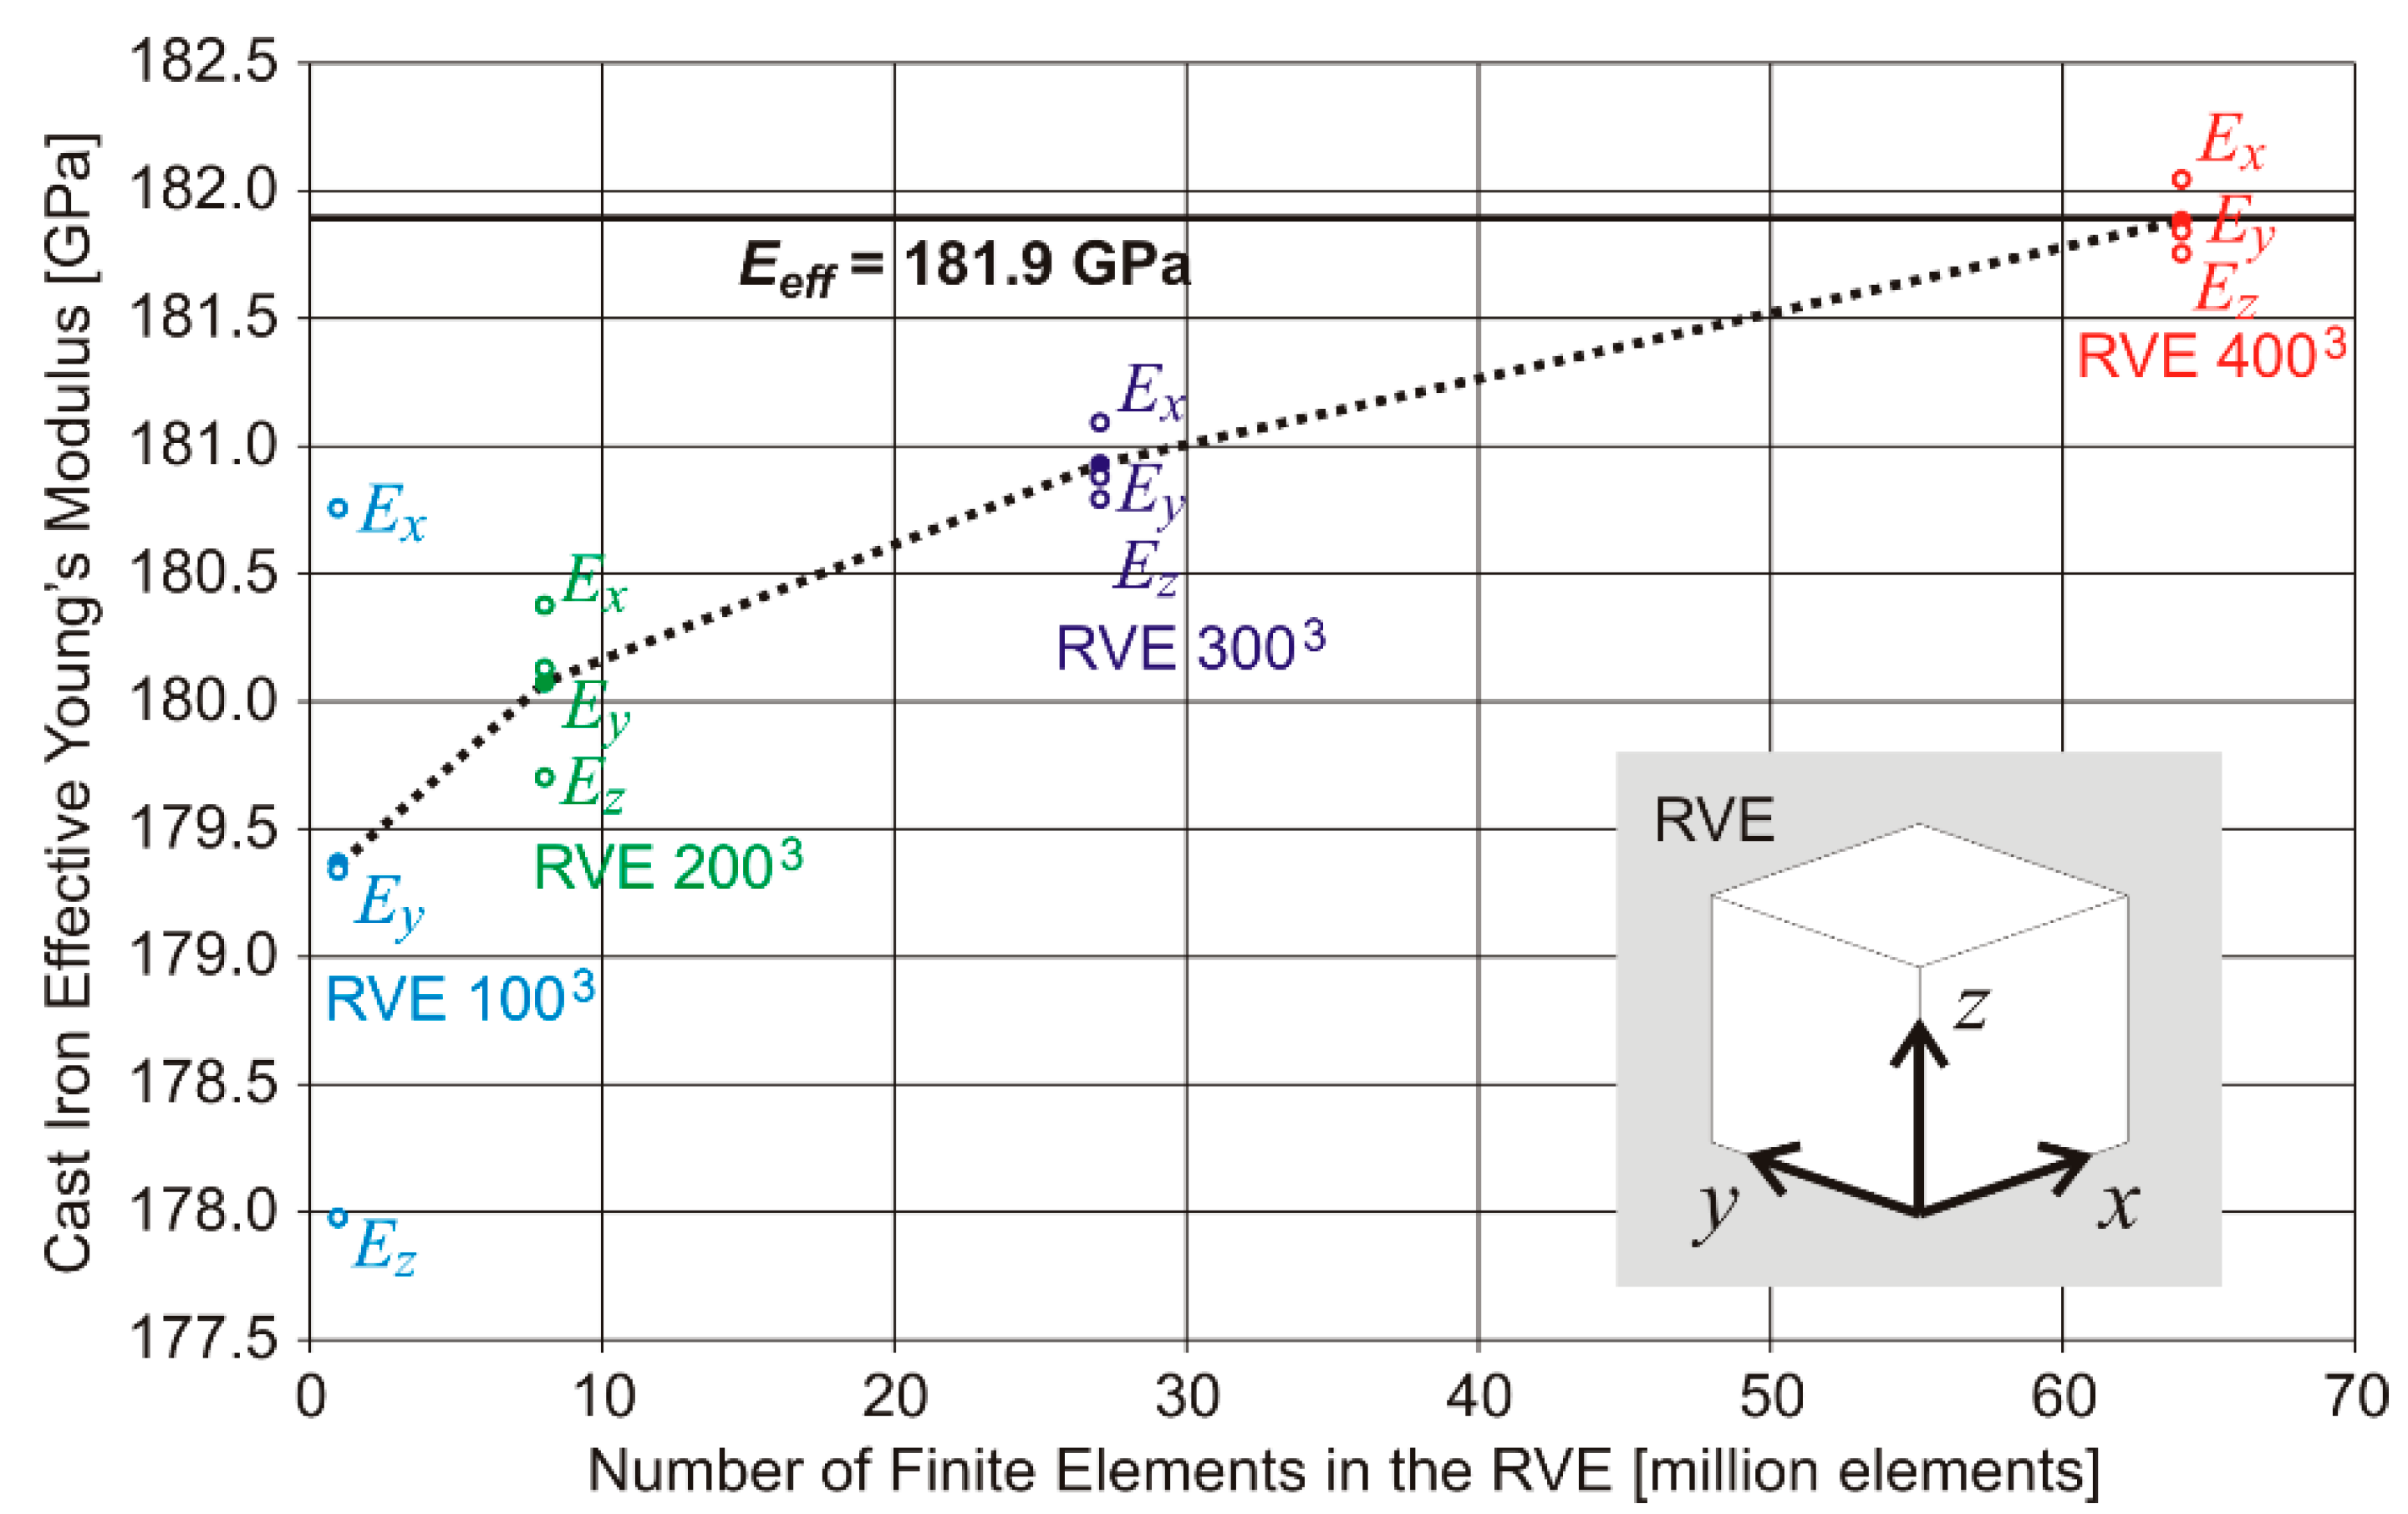
2.4. Homogenization with Finite Elements

The effective elastic parameters were computed using computational-homogenization techniques with the aid of the finite element method (FEM) [15]. The FEM is widely used in the context of computational solid mechanics, and is a numerical method mainly applied to solve (partial) differential equations. It is based on the weak (variational) formulation of a problem, and turns the original problem into a corresponding algebraic system through domain discretization. Computational homogenization [16], which is based on the premise of separation of scales, and on the concept of a representative volume element (RVE) [17], allows determination of the effective mechanical constitutive behavior of a composite material on a macroscopic scale, by modeling and investigating its microscopic features. This implies that with properly constructed models, a composite can be replaced by an effective homogeneous material for several practical means.
One of the main challenges in the present context is the generation of a FE mesh for a RVE of the actual material, to perform the numerical simulations. In the present study, the micro-CT 3-D images were converted into input data through a direct “voxel to finite element” transcription. Thus, the segmented micro-CT volumetric images were the starting point for the FE simulations. This involved the direct conversion of the 3-D digital-image voxel structure, where each voxel became an eight-node hexahedral element (with tri-linear shape functions). To use the FEM to analyze nodular cast irons and capture the graphite-nodule details, the element size needs to be significantly smaller than the nodule diameter, typically a few microns. With this type of discretization, millions of degrees of freedoms (DOFs) are required in the FEM model, to analyze a small material block. For example, a 3-D digital image composed of 400 × 400 × 400 voxels (see Figure 4a) would require a system with approximately 193 million DOFs.
The large number of FEs in the model restricted the application of a standard FEM for solving the problem, due to limitations in computer-processing time and memory storage. Therefore, the micromechanical analyses performed in this study were carried out by means of an in-house written software, using C++ programming language and OpenMP extension for parallelism. To handle the large linear systems, a special technique known as element-by-element (EBE) implementation [18,19] was adopted. The implementation took advantage of the fact that all elements in the mesh were of the same size. In addition, as is common for the EBE implementation, the resulting linear system (that is not assembled) was solved with the aid of a preconditioned conjugate gradient (PCG) algorithm [20]. Furthermore, the computations for each element were performed in parallel. However, the tasks could not be distributed arbitrarily between the processors, since two processors working with two different elements sharing the same node, could attempt to update the same vector entry simultaneously, causing memory contention or dirty read/write entries. Hence, in the present implementation, the elements were divided into different “groups” (or “colors”) such that elements of the same group did not share nodes. Within each group, the computations were then performed in parallel, although the groups were processed sequentially. For the 3-D regular mesh, where each voxel corresponded to an (cube) element, the elements were divided into 8 different groups.
Based on the mean-field homogenization schemes, there are three different numerical approaches for estimating the effective elastic parameters, as indicated in [21]. The first approach involves the application of a uniform strain-field component at the macroscale (a known average strain-field volume, typically unitary). This requires a microscale problem solution, with a prescribed equivalent displacement at the RVE boundary, and the posteriori computation of the average volume of the resulting stress-field using standard mathematical-averaging equations. Therefore, solving six different microscale problems (one for each uniform-strain component, corresponding to three uniaxial extensions and three simple-shear loadings), the averaging process leads to the full macroscopic stress field. The average volume of the resulting RVE stress field provides a specific column of the stiffness tensor (6 × 6 matrix representation). By relating the mean-stress and strain tensors, it is possible to obtain the homogenized constitutive relation at the macroscale. The second approach is similar and involves the application of a uniform stress-field component at the macroscale. (a known macroscopic average of stress-field volume). This requires a microscale problem solution, with a prescribed equivalent traction at the RVE boundary, and the posteriori computation of the mean strains. Several researchers have proved that imposing homogeneous strain-boundary conditions results in apparent properties close to the upper bound, while imposing homogeneous stress-boundary conditions generates estimates close to the lower bound. Hence, these two approaches provide two bounds for the effective elastic parameters. See Chevalier et al. [22], Harrison et al. [23], Niebur et al. [24], Rietbergen et al. [25], and Ulrich et al. [26] for examples of application with these two approaches. The third approach comes from the asymptotic multiscale homogenization, and consists of using the so-called periodic boundary conditions (PBC) [17]. The basic assumption behind the use of PBC is that the numerical model is a representative volume of an unbounded (statistically homogeneous) medium, i.e., a periodic microstructure is assumed throughout the medium. In the context of the FEM, PBC can be applied by assigning the same equation number to corresponding nodes at opposite sides, forcing the displacements at these corresponding nodes to be equal, and satisfying equilibrium. In this approach, the input is also a uniform strain-field component at the macroscale. See Nguyena et al. [21] for implementation details and Arns et al. [27], Garboczi and Day [28], Garboczi and Berryman [29], Makarynska et al. [30], and Roberts and Garboczi [31] for examples of application with this approach. The estimates provided by all three approaches described above get closer as the physical dimensions of the image (RVE) get larger in comparison to the microstructural characteristic length, and have been commonly used to estimate effective elastic parameters. However, the third approach naturally provides better approximations, and was therefore used in this study.

3. Results and Discussion

A realistic prediction of effective properties using a micromechanical model depends on whether the material behavior of each individual constituent and its geometry and topology can be accurately accounted for [32]. A realistic geometric representation of the models in the present study was achieved by using X-ray micro-CT. The heterogeneities were handled by direct numerical modeling of the composite structure, containing all the microstructural details, using the FEM. There were two well-distinguished constituents in the nodular cast-iron grade used in this work; a ferritic matrix and graphite nodules. No significant differences were found in the literature for the elastic properties of the ferritic matrix, and consensus values of 210 GPa for the Young’s modulus and 0.3 for the Poisson’s ratio were used in the computations. However, as mentioned previously, in Andriollo and Hattel [11], the authors showed that there is a wide range of graphite-nodule elastic parameters (Young’s modulus and Poisson’s ratio) found in the literature.
Therefore, to estimate the graphite-nodule Young’s modulus (assuming the nodules to be homogeneous and isotropic) several computations were performed, covering a wide range of possible values (varying from 0 to 200 GPa), while keeping the Poisson’s ratio fixed at 0.2225 (which is among the most commonly used values in the literature, i.e., 0, 0.2, 0.2225, or 0.3).
Since the representativeness of the numerical model plays an important role in the determination of the effective material properties (see, for example, Yu [32]), we considered the four ROIs shown in Figure 4a in our analysis, identifying the largest one (4003 voxels) as a suitable RVE (as indicated in Figure 5).
Isotropic linear-elastic constitutive-material characteristics were assumed for both constituents of the nodular cast iron. However, although the constituents are, the composite material is not necessarily isotropic, due to natural anisotropies caused by heterogeneities. Therefore, the starting point to determine the effective elastic parameters using the present approach was to assume linear-elastic orthotropic material behavior. For this assumption, nine elastic parameters are required to define the constitutive behavior. Therefore, for each RVE, at least six elementary numerical tests were required at the microscale, by applying either uniform strains or uniform stresses at the macroscale, where the effective elastic properties were defined from spatial averages of fields over the RVE volume. If the three resulting longitudinal elastic moduli are the same, and the three resulting transversal moduli are also the same, this indicates that the material is indeed isotropic. This is a reasonable strategy for confirming isotropy, as well as ensuring that the considered RVE can be, in fact, assumed to be a homogeneous representative volume of the material. This is expected for a representative volume of nodular cast iron, since most metals are identified to be isotropic and homogeneous at the macroscale.
The four models (RVE candidates) shown in Figure 5, with sizes of 1003, 2003, 3003, and 4003 voxels, were simulated. The numerical models corresponded to the digital-sample central region, so that their centroids were identical (see Figure 5). To visually inspect the graphite-nodule distribution, the ferritic matrix was omitted from the figure, and only the rendered graphite regions are shown. Although the FE volumes are small, up to (1.2 mm)3, in comparison to the laboratory tensile-test volume, they contained sufficient microstructural characteristics to be considered as potentially representative. Each analysis (one simulation for a unidirectional uniform-strain field with PBC) took approximately 2 min to run for a 100 × 100 × 100 voxel input image (3 million DOFs), 20 min for a 200 × 200 × 200 voxel input image (24 million DOFs), and 2 h for a 400 × 400 × 400 voxel input image (193 million DOFs). In all the analysis, the PCG convergence criterion used was 10−8 for the relative norm of the residue vector. The estimates were performed using an ordinary desktop PC.
The results from the analysis of each FE model, by varying the graphite-nodule Young’s modulus, are shown in Figure 6. From these plots, a convergence pattern in the RVE-size function can be observed. By using the largest FE model as the RVE of the nodular cast iron, a candidate value for the graphite Young’s modulus was identified, by comparing the numerical result with the experimental result obtained from the slope of the tensile-test stress-strain curve shown in Figure 1 (181.9 GPa). In that sense, the predicted graphite Young’s modulus value was found to be 39.7 GPa.
Next, assuming a graphite Young’s modulus of 39.7 GPa, the respective effective elastic modulus was computed for each FE model. The results for the cast iron effective elastic-modulus convergence, as a function of the number of FEs used in each RVE, are plotted in Figure 7. More specifically, since the RVE was initially assumed to be orthotropic, the effective elastic modulus in the three orthogonal directions (Ex, Ey and Ez) are plotted. These results are also summarized in Table 2.
The analysis of Figure 7 (and Table 2) allows us to draw three main conclusions: (i) The largest RVE presents the largest effective elastic modulus. This is explained by the fact that the largest RVE contains the smallest amount of graphite (10.3%). Since the graphite Young’s modulus is much smaller than the ferrite Young’s modulus, it results that a smaller amount of graphite leads to a larger effective elastic modulus; (ii) The difference between Ex, Ey and Ez is smaller for the largest RVE. This is because the largest RVE contains a larger amount of nodules and, therefore, a larger variety of nodule shapes and a homogeneous nodule distribution, making it more representative of the nodular cast iron under investigation than the smaller RVEs. This is confirmed by the trend seen in the results that the smaller is the RVE the larger will be the difference between Ex, Ey and Ez; (iii) The nodular cast iron under investigation seems to be indeed isotropic, since the difference between Ex, Ey and Ez is very small. The results shown in Figure 7 deserve yet one last comment: It can be seen that Ey and Ez increase monotonically with the RVE size. The same not occurs with Ex that is larger for the 1003 voxels volume than for the 2003 voxels volume. This is an evidence that the volumes of 1003 and 2003 voxels shown in Figure 5 do not represent so accurately the cast iron.

4. Conclusions

In the present work, we described in detail a methodology to estimate the effective elastic parameters of nodular cast iron, using micro-computed tomography in conjunction with multiscale finite elements. We discussed the adjustment of the image acquisition parameters and addressed the issue of representative volume choice. We also presented a brief discussion on image segmentation and described the finite element computational implementation we developed to estimate the effective elastic parameters from segmented microstructural images. Our finite element implementation easily handled images of up to 400 × 400 × 400 voxels (~2 × 10⁸ DOFs). We then applied the proposed methodology to a nodular cast iron and specifically estimated the graphite elastic parameters through a comparison between numerical and experimental results, by trial and error. The graphite Young’s modulus was estimated to be 39.7 GPa, which is within the range of values found in the literature. The numerical results also indicated that the considered volumes of 1003 and 2003 voxels (2.7 × 10⁻² mm3 and 2.16 × 10⁻¹ mm3, respectively) do not represent so accurately the cast iron, and that the cast iron is indeed isotropic at the macroscale.

Author Contributions

A.P. wrote the manuscript, performed the micro-CT and implemented the software to perform the computational homogenization; M.C. processed the micro-CT and implemented the software to perform the computational homogenization; C.A. performed the mechanical test and analyzed the data; J.P. analyzed the data; R.L. designed the software to perform the computational homogenization, analyzed the data and wrote the manuscript.

Funding

This research received no external funding.

Acknowledgments

This research was partially supported by CNPq (National Council for Scientific and Technological Development) Brazilian agency, grant number 404593/2016-0.

Conflicts of Interest

The authors declare no conflict of interest.

References

  1. Fragassa, C.; Minak, G.; Pavlovic, A. Tribological aspects of cast iron investigated via fracture toughness. Tribol. Ind. 2016, 38, 1–10. [Google Scholar]
  2. Carazo, F.D.; Giusti, S.M.; Boccardo, A.D.; Godoy, L.A. Effective properties of nodular cast-iron A multi-scale computational approach. Comput. Mater. Sci. 2014, 82, 378–390. [Google Scholar] [CrossRef]
  3. Fernandino, D.O.; Cisilino, A.P.; Boeri, R.E. Determination of effective elastic properties of ferritic ductile cast iron by computational homogenization, micrographs and microindentation tests. Mech. Mater. 2015, 83, 110–121. [Google Scholar] [CrossRef]
  4. Kasvayee, K.A.; Salomonsson, K.; Ghassemali, E.; Jarfors, A.E.W. Microstructural strain distribution in ductile iron; comparison between finite element simulation and digital image correlation measurements. Mater. Sci. Eng. A 2016, 655, 27–35. [Google Scholar] [CrossRef]
  5. Landis, E.N.; Keane, D.T. X-ray microtomography. Mater. Charact. 2010, 61, 1305–1316. [Google Scholar] [CrossRef]
  6. Mrzygłód, B.; Matusiewicz, P.; Tchórz, A.; Olejarczyk-Wożeńska, I. Quantitative Analysis of Ductile Iron Microstructure—A Comparison of Selected Methods for Assessment. Arch. Foundry Eng. 2013, 13, 59–63. [Google Scholar] [CrossRef]
  7. Chuang, C.; Singh, D.; Kenesei, P.; Almer, J.; Hryna, J.; Huff, R. 3D quantitative analysis of graphite morphology in high strength cast iron by high-energy X-ray tomography. Scr. Mater. 2015, 106, 5–8. [Google Scholar] [CrossRef] [Green Version]
  8. Yin, Y.; Tu, Z.; Zhou, J.; Zhang, D.; Wang, M.; Guo, Z.; Liu, C.; Chen, X. 3D Quantitative Analysis of Graphite Morphology in Ductile Cast Iron by X-ray Microtomography. Metall. Mater. Trans. A 2017, 48, 3794–3803. [Google Scholar] [CrossRef]
  9. Zybell, L.; Hütter, G.; Linse, T.; Mühlich, U.; Kuna, M. Size effects in ductile failure of porous materials containing two populations of voids. Eur. J. Mech. A Solids 2014, 45, 8–19. [Google Scholar] [CrossRef]
  10. Hutter, G.; Zybell, L.; Kuna, M. Micromechanisms of fracture in nodular cast iron: From experimental findings towards modeling strategies—A review. Eng. Fract. Mech. 2015, 144, 118–141. [Google Scholar] [CrossRef]
  11. Andriollo, T.; Hattel, J. On the isotropic elastic constants of graphite nodules in ductile cast iron: Analytical and numerical micromechanical investigations. Mech. Mater. 2016, 96, 138–150. [Google Scholar] [CrossRef] [Green Version]
  12. Fragassa, C.; Radovic, N.; Pavlovic, A.; Minak, G. Comparison of mechanical properties in compacted and spheroidal graphite irons. Tribol. Ind. 2016, 38, 49–59. [Google Scholar]
  13. METALRENS 2017. Available online: http://www.metalrens.com.br/ (accessed on 8 December 2017).
  14. ASTM E8/E8M-09, Standard Test Methods for Tension Testing of Metallic Materials; ASTM International: West Conshohocken, PA, USA, 2009. [CrossRef]
  15. Guedes, J.M.; Kikuchi, K. Preprocessing and postprocessing for materials based on the homogenization method with adaptive finite element methods. Comput. Meth. Appl. Mech. Eng. 1990, 83, 143–198. [Google Scholar] [CrossRef]
  16. Geers, M.G.D.; Kouznetsova, V.G.; Brekelmans, W.A.M. Multi-scale computational homogenization: Trends and challenges. J. Comput. Appl. Math. 2010, 234, 2175–2182. [Google Scholar] [CrossRef]
  17. Pindera, M.J.; Khatam, H.; Drago, A.S.; Bansal, Y. Micromechanics of spatially uniform heterogeneous media: A critical review and emerging approaches. Compos. Part B 2009, 40, 349–378. [Google Scholar] [CrossRef]
  18. Hughes, T.J.R.; Levit, I.; Winget, J. An element-by-element solution algorithm for problems of structural and solid mechanics. Comput. Meth. Appl. Mech. Eng. 1983, 36, 241–254. [Google Scholar] [CrossRef]
  19. Erhel, J.; Traynard, A.; Vidrascu, M. An element-by-element preconditioned conjugate gradient method implemented on a vector computer. Parallel Comput. 1991, 17, 1051–1065. [Google Scholar] [CrossRef]
  20. Shewchuk, J.R. An Introduction to the Conjugate Gradient Method without the Agonizing Pain; Technical Report for Carnegie Mellon University: Pittsburgh, PA, USA, 1994. [Google Scholar]
  21. Nguyen, V.D.; Béchet, E.; Geuzaine, C.; Noels, L. Imposing periodic boundary condition on arbitrary meshes by polynomial interpolation. Comput. Mater. Sci. 2012, 55, 390–406. [Google Scholar] [CrossRef] [Green Version]
  22. Chevalier, Y.; Pahr, D.; Allmer, H.; Charlebois, M.; Zysset, P. Validation of a voxel-based FE method for prediction of the uniaxial apparent modulus of human trabecular bone using macroscopic mechanical tests and nanoindentation. J. Biomech. 2007, 40, 3333–3340. [Google Scholar] [CrossRef] [PubMed]
  23. Harrison, N.M.; McDonnell, P.F.; O’Mahoney, D.C.; Kennedy, O.D.; O’Brien, F.J.; McHugh, P.E. Heterogeneous linear elastic trabecular bone modelling using micro-CT attenuation data and experimentally measured heterogeneous tissue properties. J. Biomech. 2008, 41, 2589–2596. [Google Scholar] [CrossRef] [PubMed]
  24. Niebur, G.L.; Feldstein, M.J.; Yuen, J.C.; Chen, T.J.; Keaveny, T.M. High-resolution finite element models with tissue strength asymmetry accurately predict failure of trabecular bone. J. Biomech. 2000, 33, 1575–1583. [Google Scholar] [CrossRef]
  25. Rietbergen, B.; Weinans, H.; Huiskes, R.; Odgaardt, A. A new method to determine trabecular bone elastic properties and loading using micromechanical finite-element models. J. Biomech. 1995, 28, 69–81. [Google Scholar] [CrossRef] [Green Version]
  26. Ulrich, D.; Rietbergen, B.; Weinans, H.; Ruegsegger, P. Finite element analysis of trabecular bone structure: A comparison of image-based meshing techniques. J. Biomech. 1998, 31, 1187–1192. [Google Scholar] [CrossRef]
  27. Arns, C.H.; Knackstedt, M.A.; Pinczewski, W.V.; Garboczi, E.J. Computation of linear elastic properties from microtomographic images: Methodology and agreement between theory and experiment. Geophysics 2002, 67, 1396–1405. [Google Scholar] [CrossRef]
  28. Garboczi, E.J.; Day, A.R. An algorithm for computing the effective linear elastic properties of heterogeneous materials: Three-dimensional results for composites with equal phase poisson ratios. J. Mech. Phys. Solids 1995, 43, 1349–1362. [Google Scholar] [CrossRef]
  29. Garboczi, E.J.; Berryman, J.G. Elastic moduli of a material containing composite inclusions: Effective medium theory and finite element computations. Mech. Mater. 2001, 33, 455–470. [Google Scholar] [CrossRef]
  30. Makarynska, D.; Gurevich, B.; Ciz, R.; Arns, C.H.; Knackstedt, M.A. Finite element modelling of the effective elastic properties of partially saturated rocks. Comput. Geosci. 2008, 34, 647–657. [Google Scholar] [CrossRef]
  31. Roberts, A.P.; Garboczi, E.J. Computation of the linear elastic properties of random porous materials with a wide variety of microstructure. Proc. R. Soc. Lond. A 2002, 458, 1033–1054. [Google Scholar] [CrossRef]
  32. Yu, W. A unified theory for constitutive modeling of composites. J. Mech. Mater. Struct. 2016, 11, 379–411. [Google Scholar] [CrossRef]
Figure 1. Stress-strain curve, with Young’s modulus measurement, for a nodular cast iron sample.
Metals 08 00695 g001
Figure 2. Schematic of the CT acquisition process: (a) sample preparation, dimensions of 7 mm × 8 mm × 24 mm; (b) setup of micro-CT scanner for image acquisition; (c) set of single radiographic projections; and (d) reconstructed volume with voxel size of 3 μm.
Metals 08 00695 g002
Figure 3. Three micro-CT (equivalent slices) obtained from the same nodular cast iron sample: (a) normal cross-sections at 3 μm resolution; (b) tomogram at 11 μm resolution; (c) 1 μm resolution; and (d) 3 μm resolution. The values for the corresponding acquisition parameters are in Table 1.
Metals 08 00695 g003
Figure 4. (a) A full slice of the micro-CT at 3 μm resolution, and four regions of interests with 100 × 100, 200 × 200, 300 × 300, and 400 × 400 pixels. Zoomed-in on a small region to show (b) the original image; (c) the image after filtering using a non-local mean filter; and (d) the watershed-algorithm segmented image.
Metals 08 00695 g004
Figure 5. RVEs used in the homogenization process, generated from a micro-CT with a 3 µm voxel size, for the nodular cast iron sample (only the graphite nodules are rendered): RVE (a) with 100 × 100 × 100; (b) with 200 × 200 × 200 voxels; (c) with 300 × 300 × 300 voxels; and (d) with 400 × 400 × 400 voxels.
Metals 08 00695 g005
Figure 6. Results for cast iron effective elastic-modulus as a function of the graphite Young’s modulus, for the RVE candidates shown in Figure 5.
Metals 08 00695 g006
Figure 7. Results for cast iron effective elastic-modulus convergence as a function of the size of (or number of finite elements used in each) RVE, for the RVE candidates shown in Figure 5.
Metals 08 00695 g007
Table 1. Optimal scanning parameters for a 10.63 mm diagonal cast-iron block, at three different resolutions.
Resolution (Voxel Size)Sample-Source DistanceSample-Detector DistanceOptical Magnify-CationFilter (HE = High-Energy)Beam EnergyPowerExposure TimeNumber of Projections
11 μm30 mm158 mm0.4×HE#4160 kV10 W3.0 s3200
3 μm28 mm35 mm4.0×HE#4160 kV10 W10.0 s3200
1 μm26 mm150 mm4.0×HE#6160 kV10 W60.0 s1600
Table 2. Cast iron effective elastic-modulus computed in each direction for each RVE candidate, assuming a graphite Young’s modulus of 39.7 GPa.
Effective Elastic-ModulusRVE 100 × 100 × 100RVE 200 × 200 × 200RVE 300 × 300 × 300RVE 400 × 400 × 400
Ex (GPa)180.757180.376181.090182.043
Ey (GPa)179.338180.129180.876181.838
Ez (GPa)177.976179.700180.790181.752
Average (GPa)179.357180.068180.919181.878

