Strength Prediction for Pearlitic Lamellar Graphite Iron: Model Validation


Abstract
:1. Introduction
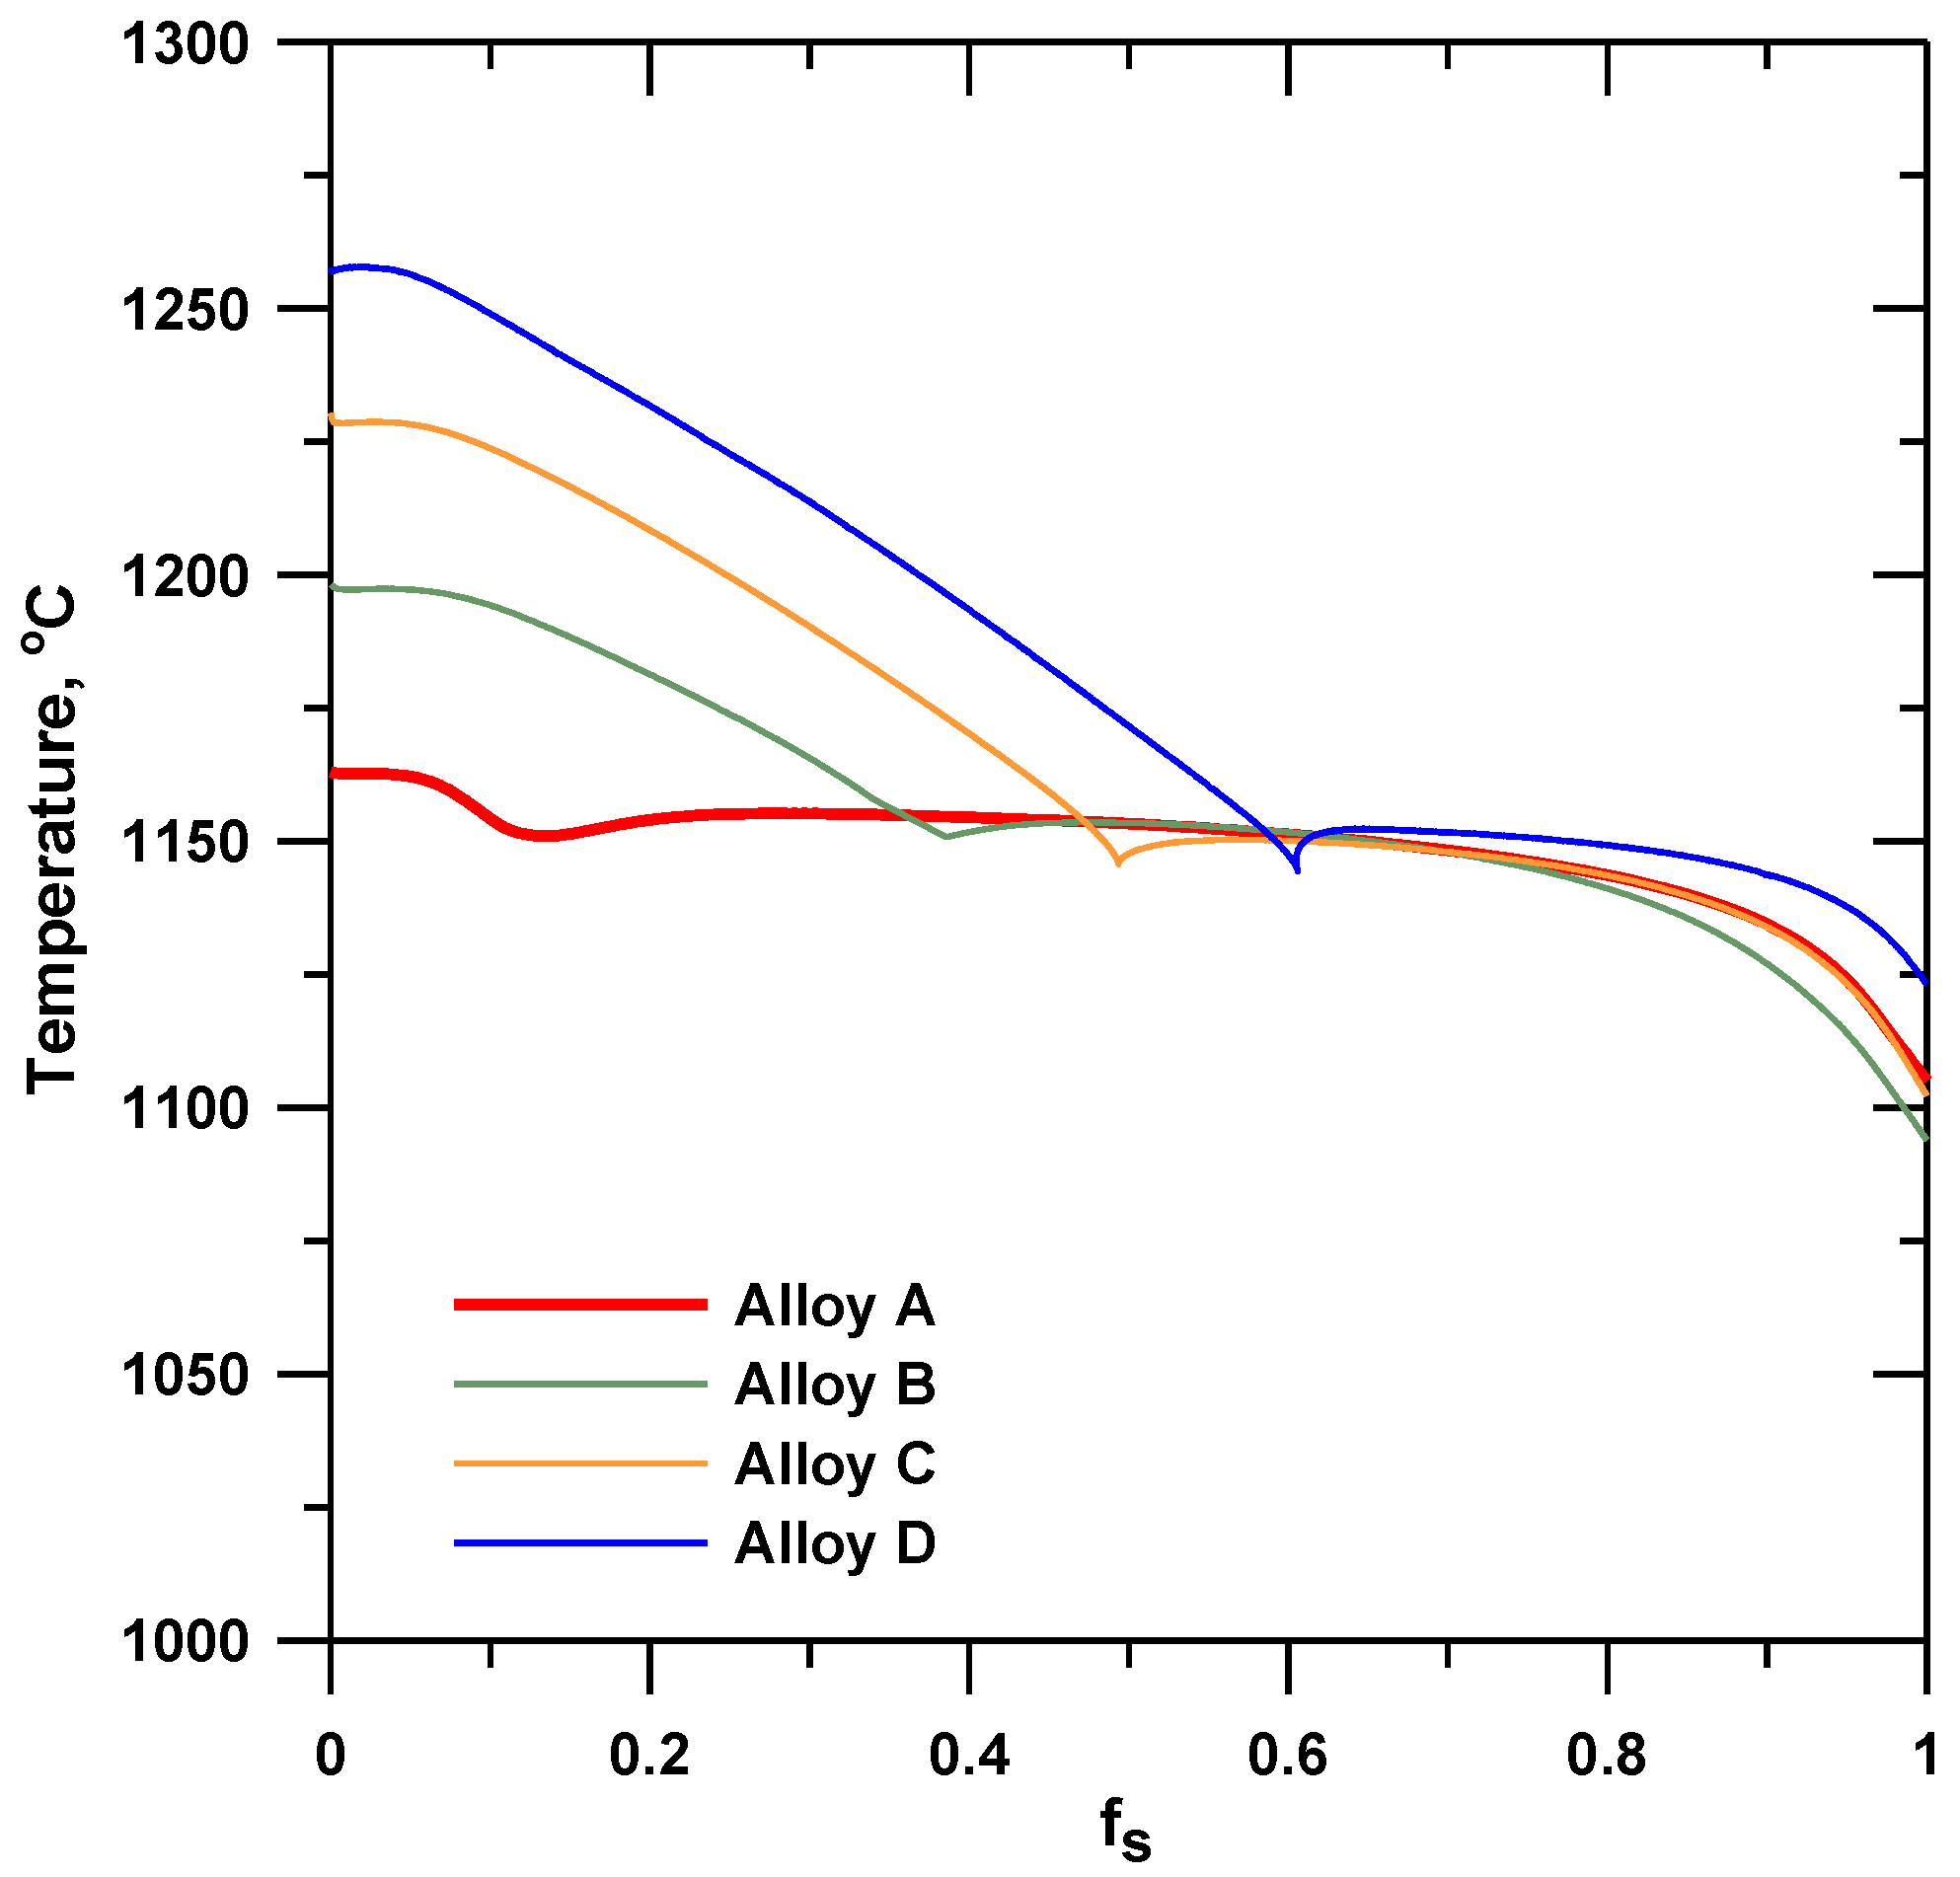
2. UTS Modeling
3. Materials and Methods
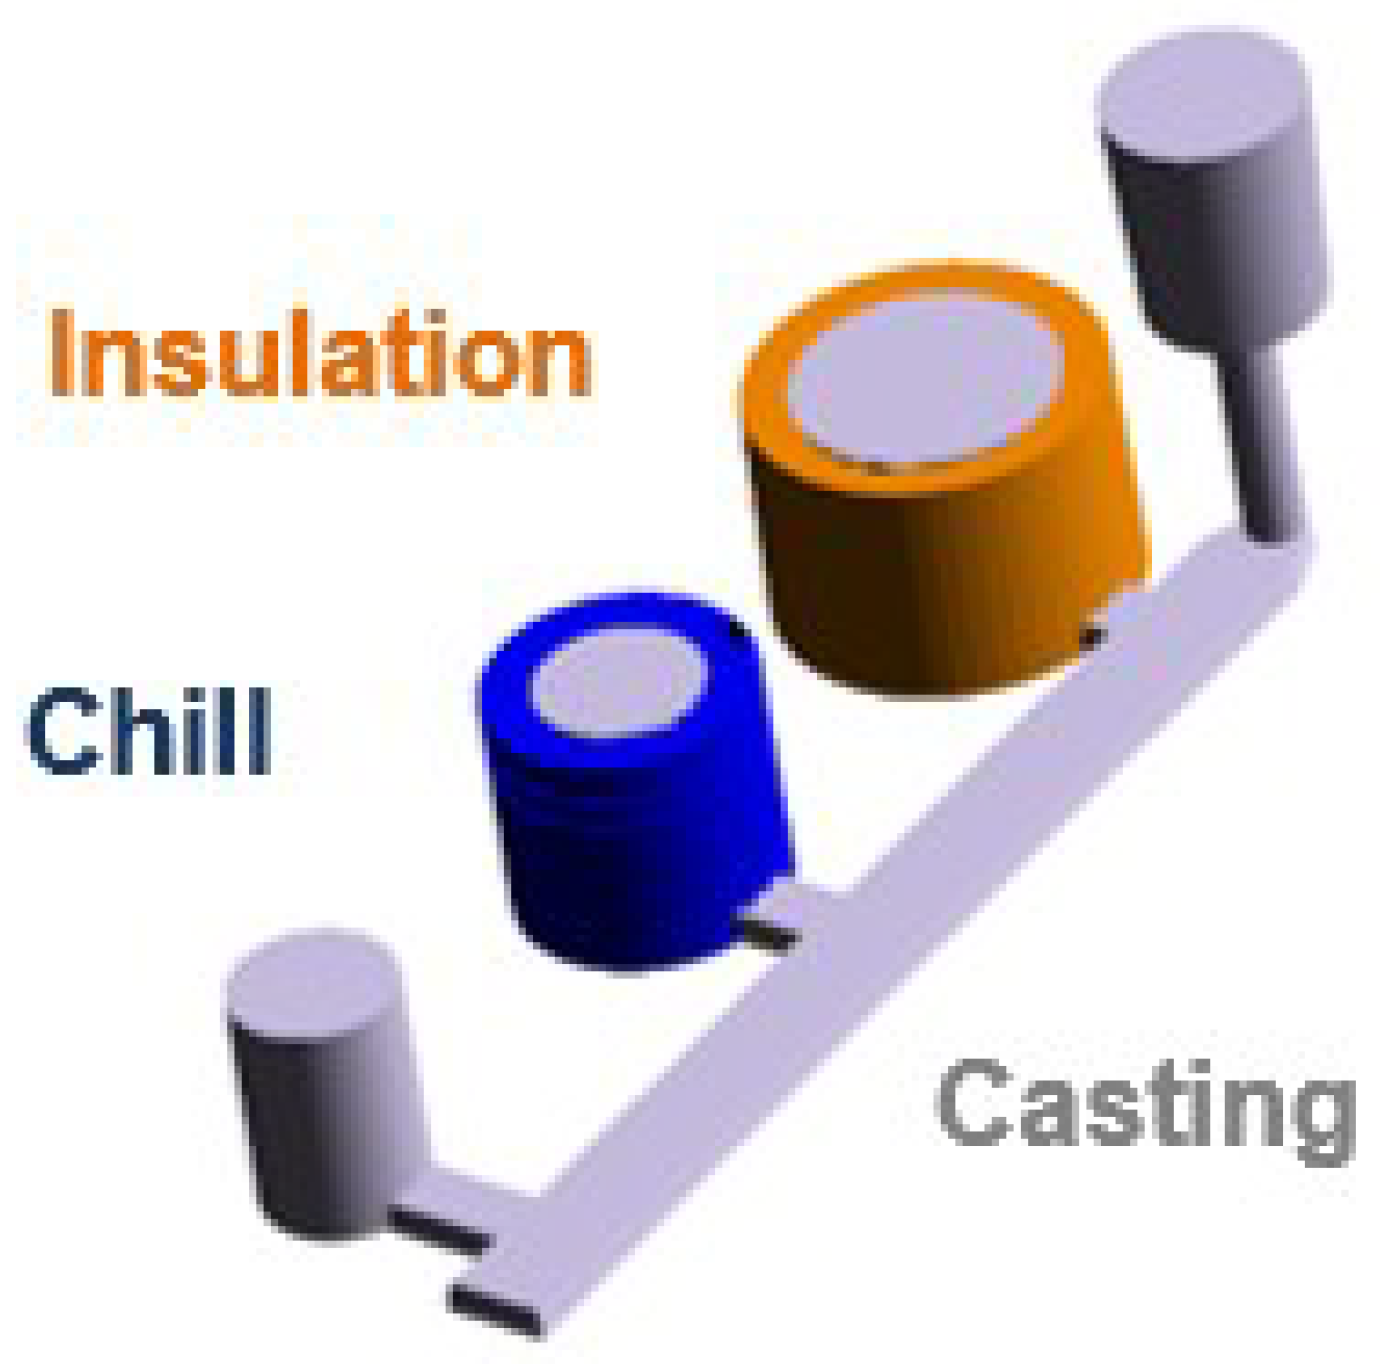
3.1. Cylindrical Castings
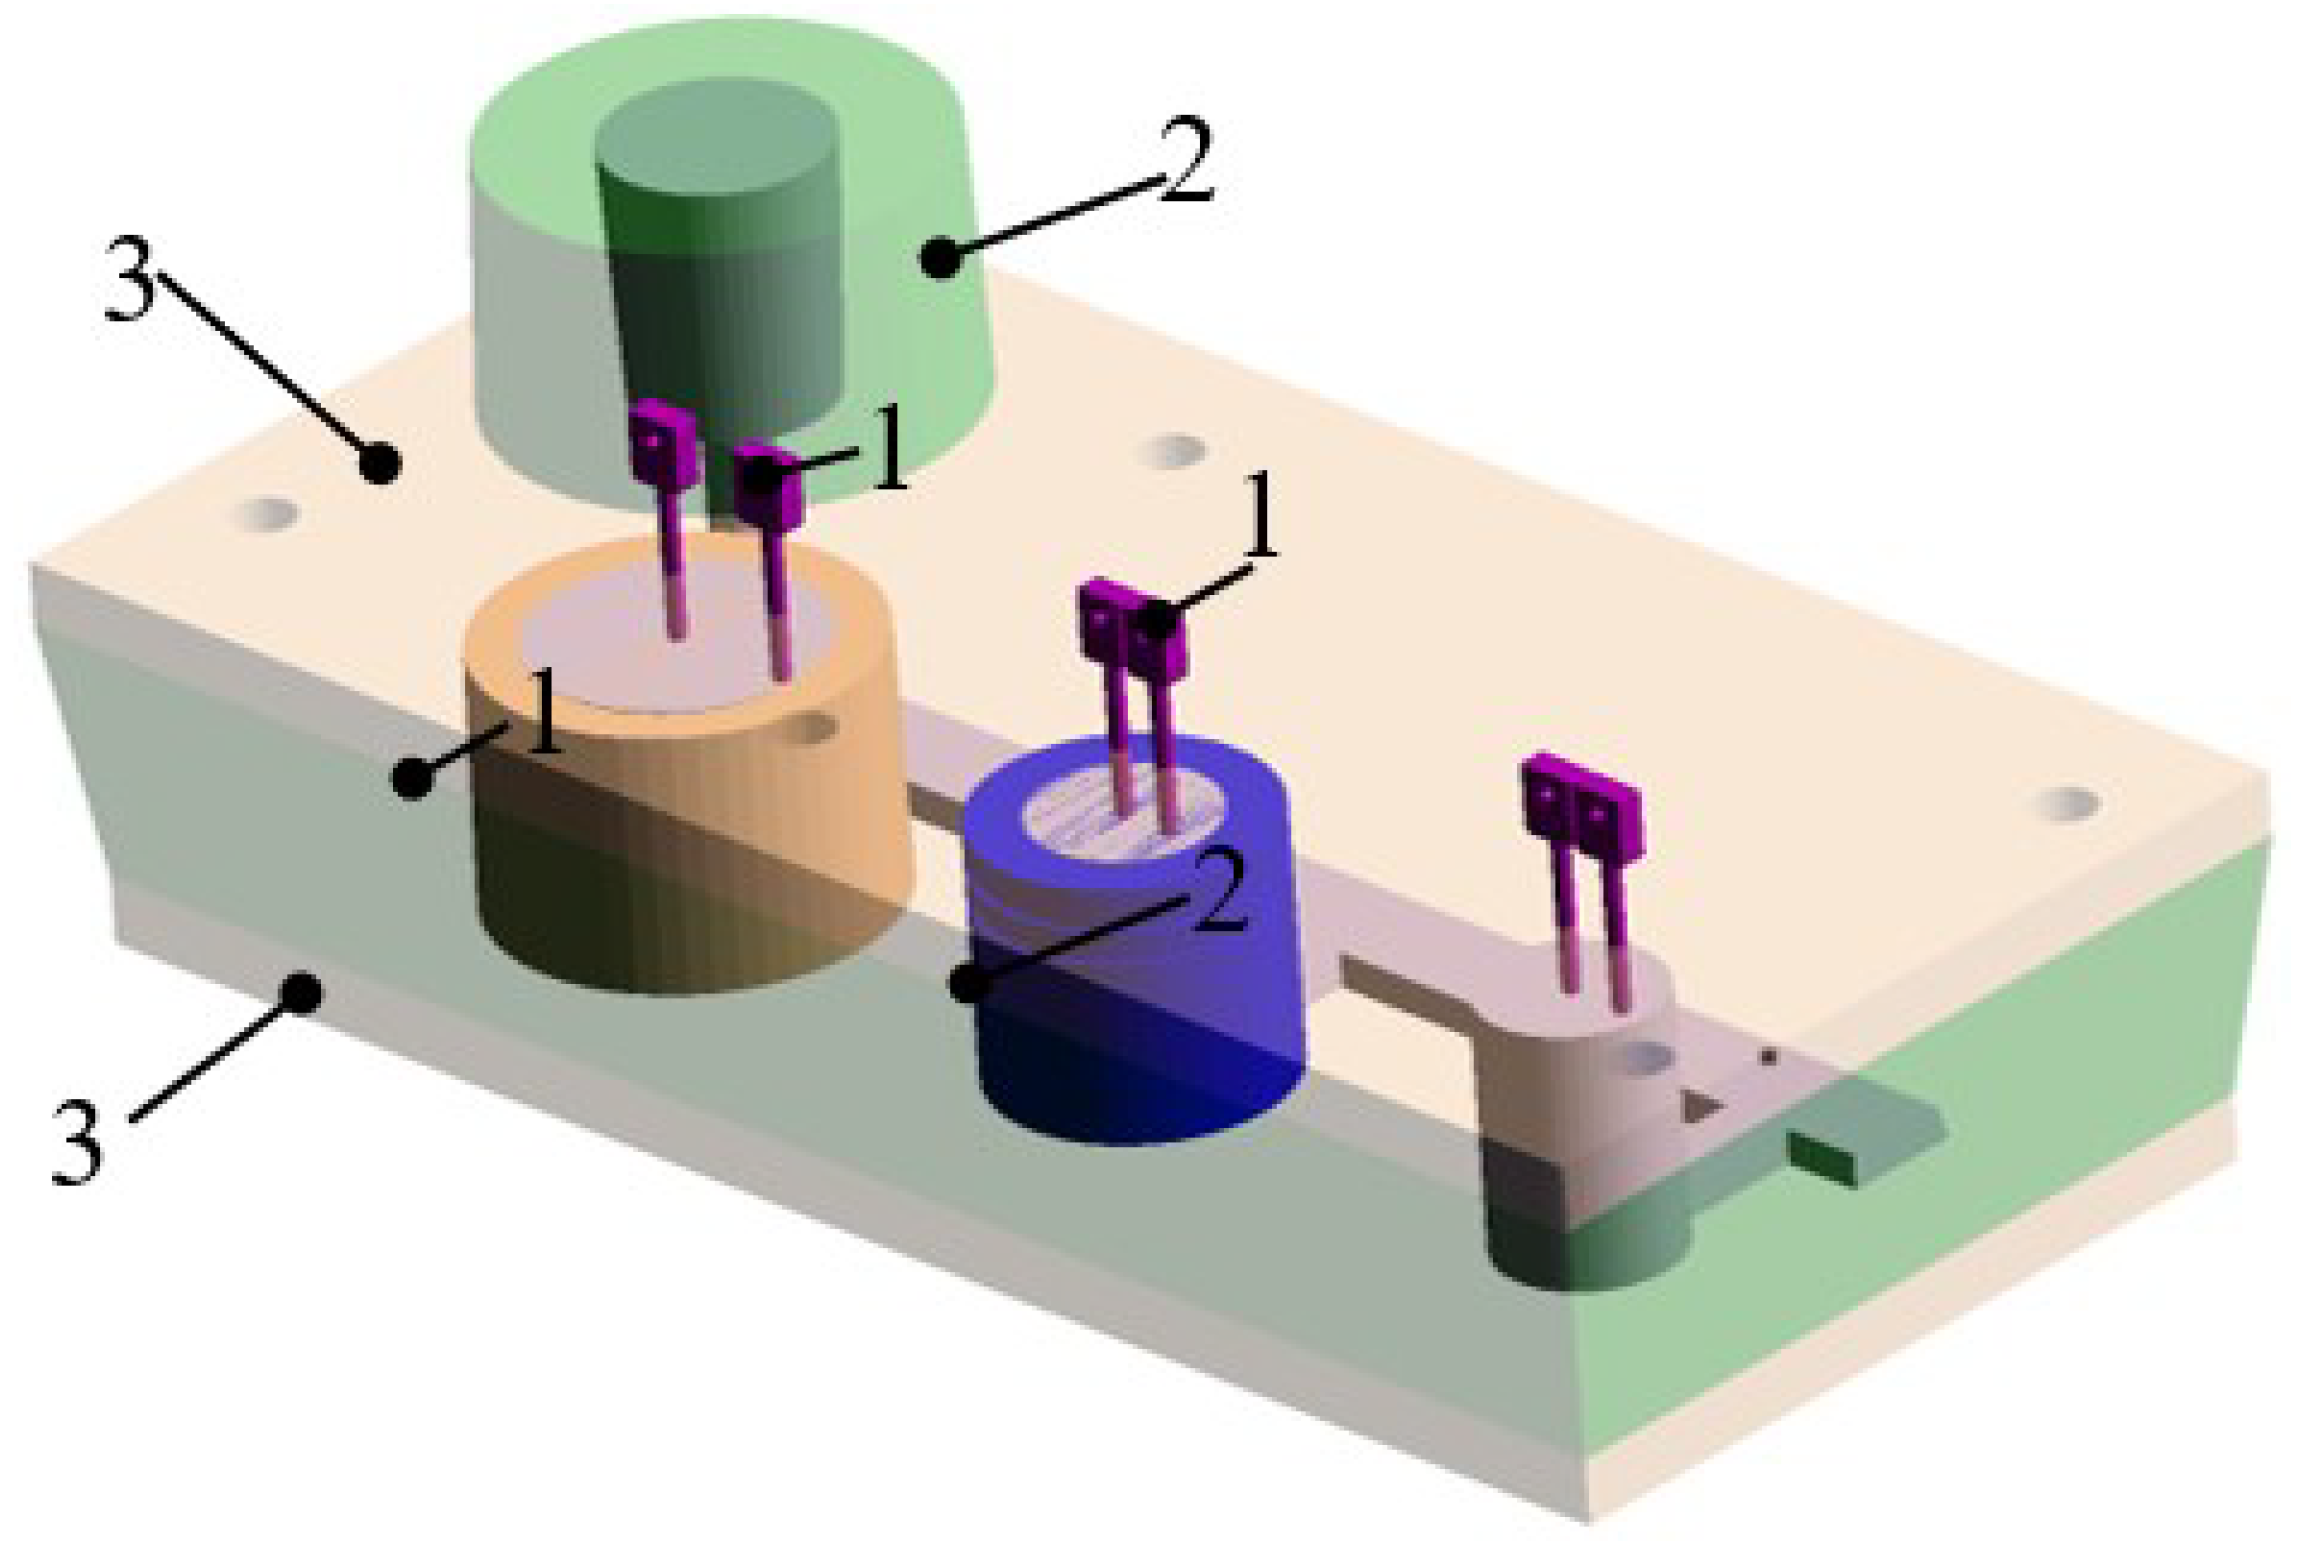
3.2. Simulation Model and Assumptions
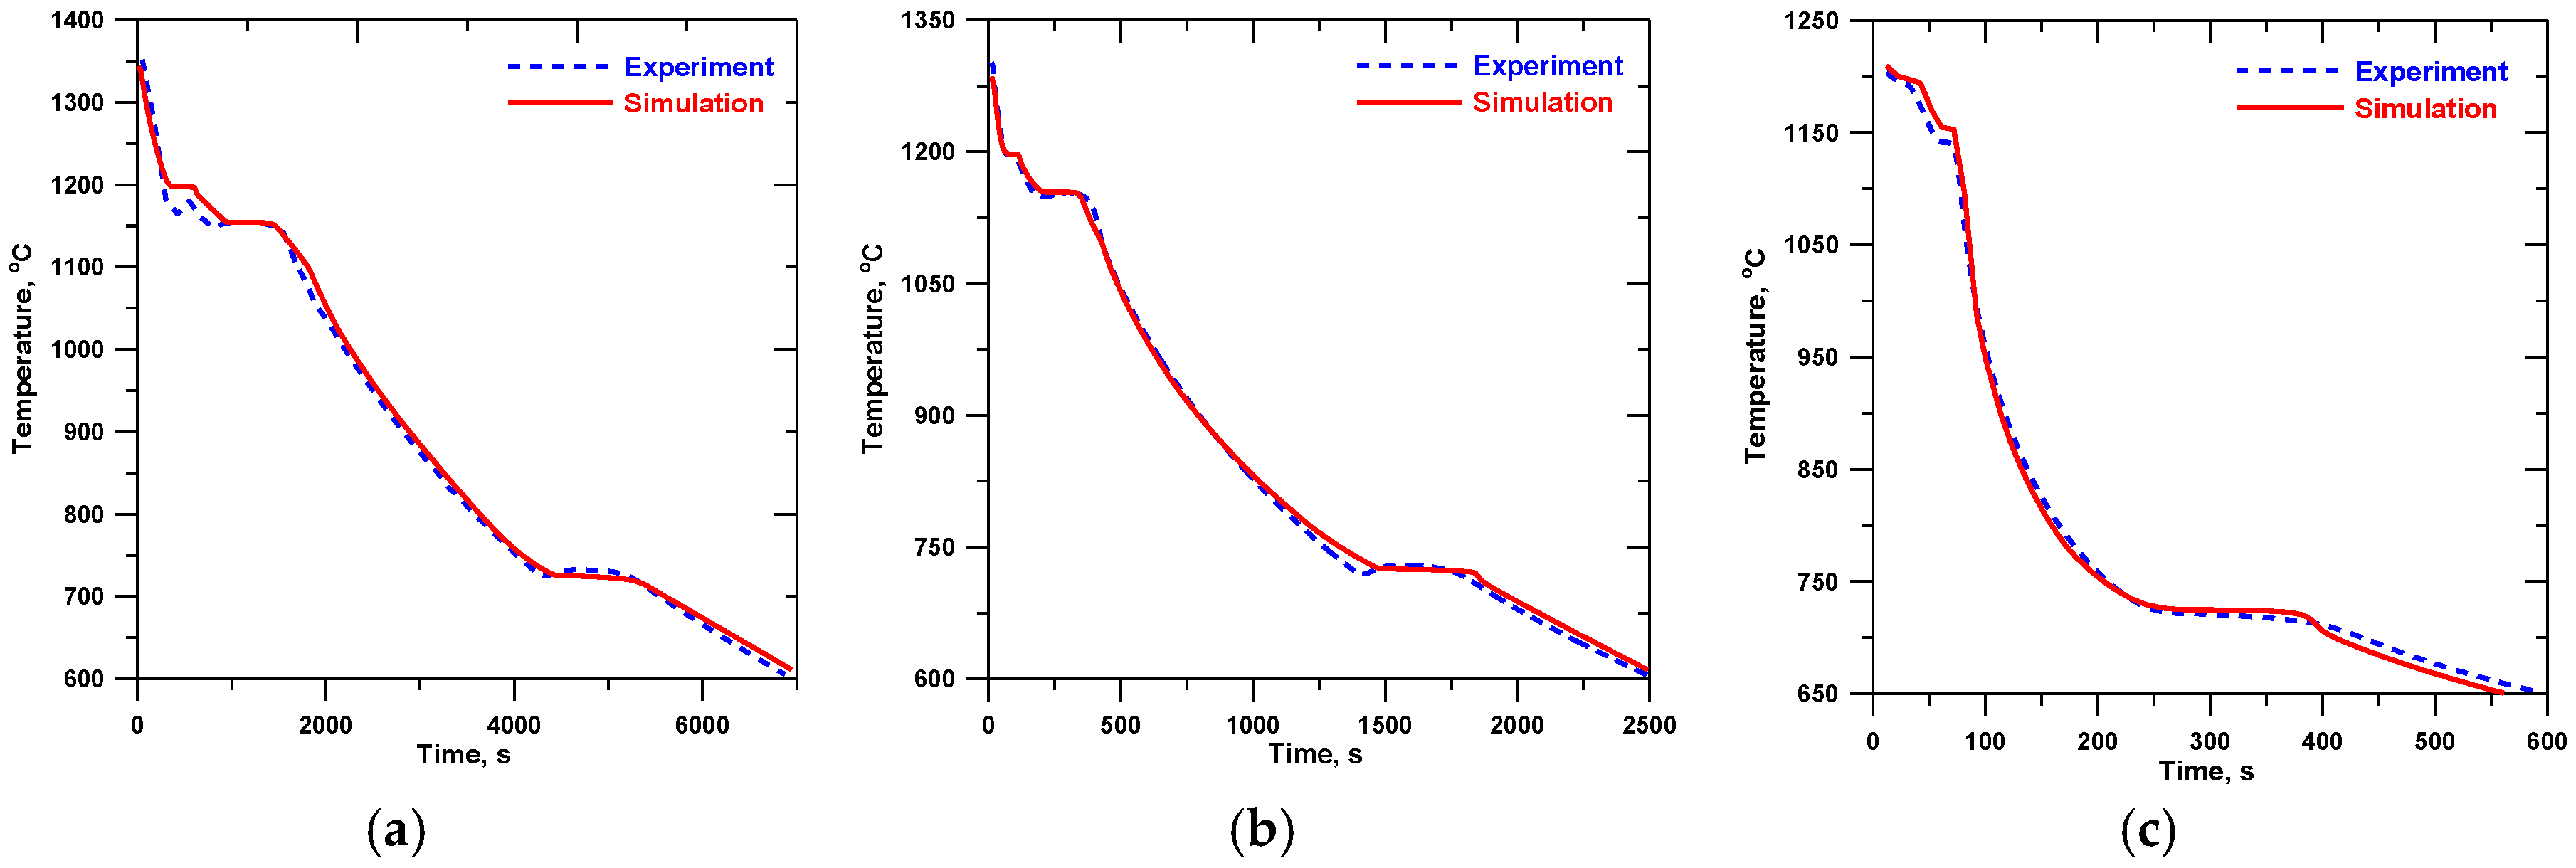
3.3. Simulation Procedure
4. Results and Discussion
5. Conclusions
Author Contributions
Funding
Acknowledgments
Conflicts of Interest
References
- Collini, L.; Nicoletto, G.; Konecná, R. Microstrucure and mechanical properties of pearlitic lamellar cast iron. Mater. Sci. Eng. A 2008, 488, 529–539. [Google Scholar] [CrossRef]
- Ruff, G.F.; Wallace, J.F. Effects of solidification structure on the tensile properties of lamellar iron. AFS Trans. 1977, 56, 179–202. [Google Scholar]
- Bates, C. Alloy element effect on lamellar iron properties: Part II. AFS Trans. 1986, 94, 889–905. [Google Scholar]
- Nakae, H.; Shin, H. Effect of graphite morphology on tensile properties of flake graphite cast iron. Mater. Trans. 2001, 42, 1428–1434. [Google Scholar] [CrossRef]
- Baker, T.J. The fracture resistance of the flake graphite cast iron. Mater. Eng. Appl. 1978, 1, 13–18. [Google Scholar] [CrossRef]
- Griffin, J.A.; Bates, C.E. Predicting in-situ lamellar cast iron properties: Effects of the pouring temperature and manganese and sulfur concentration. AFS Trans. 1988, 88, 481–496. [Google Scholar]
- Goettsch, D.D.; Dantzig, J.A. Modeling microstructure development in gray cast irons. Metall. Trans. A 1994, 25, 1063–1079. [Google Scholar] [CrossRef]
- Catalina, A.; Guo, X.; Stefanescu, D.M.; Chuzhoy, L.; Pershing, M.A. Prediction of room temperature microstructure and mechanical properties in lamellar iron castings. AFS Trans. 2000, 94, 889–912. [Google Scholar]
- Urrutia, A.; Celentano, J.D.; Dayalan, R. Modeling and Simulation of the Gray-to-White Transition during Solidification of a Hypereutectic Gray Cast Iron: Application to a Stub-to-Carbon Connection used in Smelting Processes. Metals 2017, 7, 549. [Google Scholar] [CrossRef]
- Fourlakidis, V.; Diószegi, A. A generic model to predict the ultimate tensile strength in pearlitic lamellar graphite iron. Mater. Sci. Eng. A 2014, 618, 161–167. [Google Scholar] [CrossRef]
- Fourlakidis, V.; Diaconu, L.; Diószegi, A. Strength prediction of Lamellar Graphite Iron: From Griffith’s to Hall-Petch modified equation. Mater. Sci. Forum 2018, 925, 272–279. [Google Scholar] [CrossRef]
- Diószegi, A. On the Microstructure Formation and Mechanical Properties in Grey Cast Iron. In Linköping Studies in Science and Technology; Dissertation No. 871; Jönköping: Jönköping, Sweden, 2004; p. 25. ISBN 91-7373-939-1. [Google Scholar]
- Leube, B.; Arnberg, L. Modeling gray iron solidification microstructure for prediction of mechanical properties. Int. J. Cast Metals Res. 1999, 11, 507–514. [Google Scholar] [CrossRef]
- Fourlakidis, V.; Diószegi, A. Dynamic Coarsening of Austenite Dendrite in Lamellar Cast Iron Part 2—The influence of carbon composition. Mater. Sci. Forum 2014, 790–791, 211–216. [Google Scholar] [CrossRef]
- Barkhudarov, M.R.; Hirt, C.W. Casting simulation: Mold filling and solidification—Benchmark calculations using FLOW-3D. In Proceedings of the 7th Conference on Modeling of Casting, Welding and Advanced Solidification Processes, London, UK, 10–15 September 1995. [Google Scholar]
- Diószegi, A.; Diaconu, L.; Fourlakidis, V. Prediction of volume fraction of primary austenite at solidification of lamellar graphite cast iron using thermal analyses. J. Therm. Anal. Calorim. 2016, 124, 215–225. [Google Scholar] [CrossRef]
- Svidró, P.; Diószegi, A.; Pour, M.S.; Jönsson, P. Investigation of Dendrite Coarsening in Complex Shaped Lamellar Graphite Iron Castings. Metals 2017, 7, 244. [Google Scholar] [CrossRef]
- Diószegi, A.; Hattel, J. An inverse thermal analysis method to study the solidification in cast iron. Int. J. Cast Met. Res. 2004, 17, 311–318. [Google Scholar]
- Hattel, J.H. Fundamentals of Numerical Modelling of Casting Processes, 1st ed.; Polyteknisk Forlag: Lyngby, Denmark, 2005. [Google Scholar]
- Diószegi, A.; Fourlakidis, V.; Lora, R. Austenite Dendrite Morphology in Lamellar Cast Iron. Int. J. Cast Met. Res. 2015, 28, 310–317. [Google Scholar] [CrossRef]


| Alloy | C | Si | Mn | P | S | Cr | Cu | Ceq |
|---|---|---|---|---|---|---|---|---|
| A | 3.62 | 1.88 | 0.57 | 0.04 | 0.08 | 0.14 | 0.38 | 4.26 |
| B | 3.34 | 1.83 | 0.56 | 0.04 | 0.08 | 0.15 | 0.37 | 3.96 |
| C | 3.05 | 1.77 | 0.54 | 0.04 | 0.08 | 0.14 | 0.36 | 3.65 |
| D | 2.80 | 1.75 | 0.54 | 0.04 | 0.08 | 0.15 | 0.35 | 3.40 |
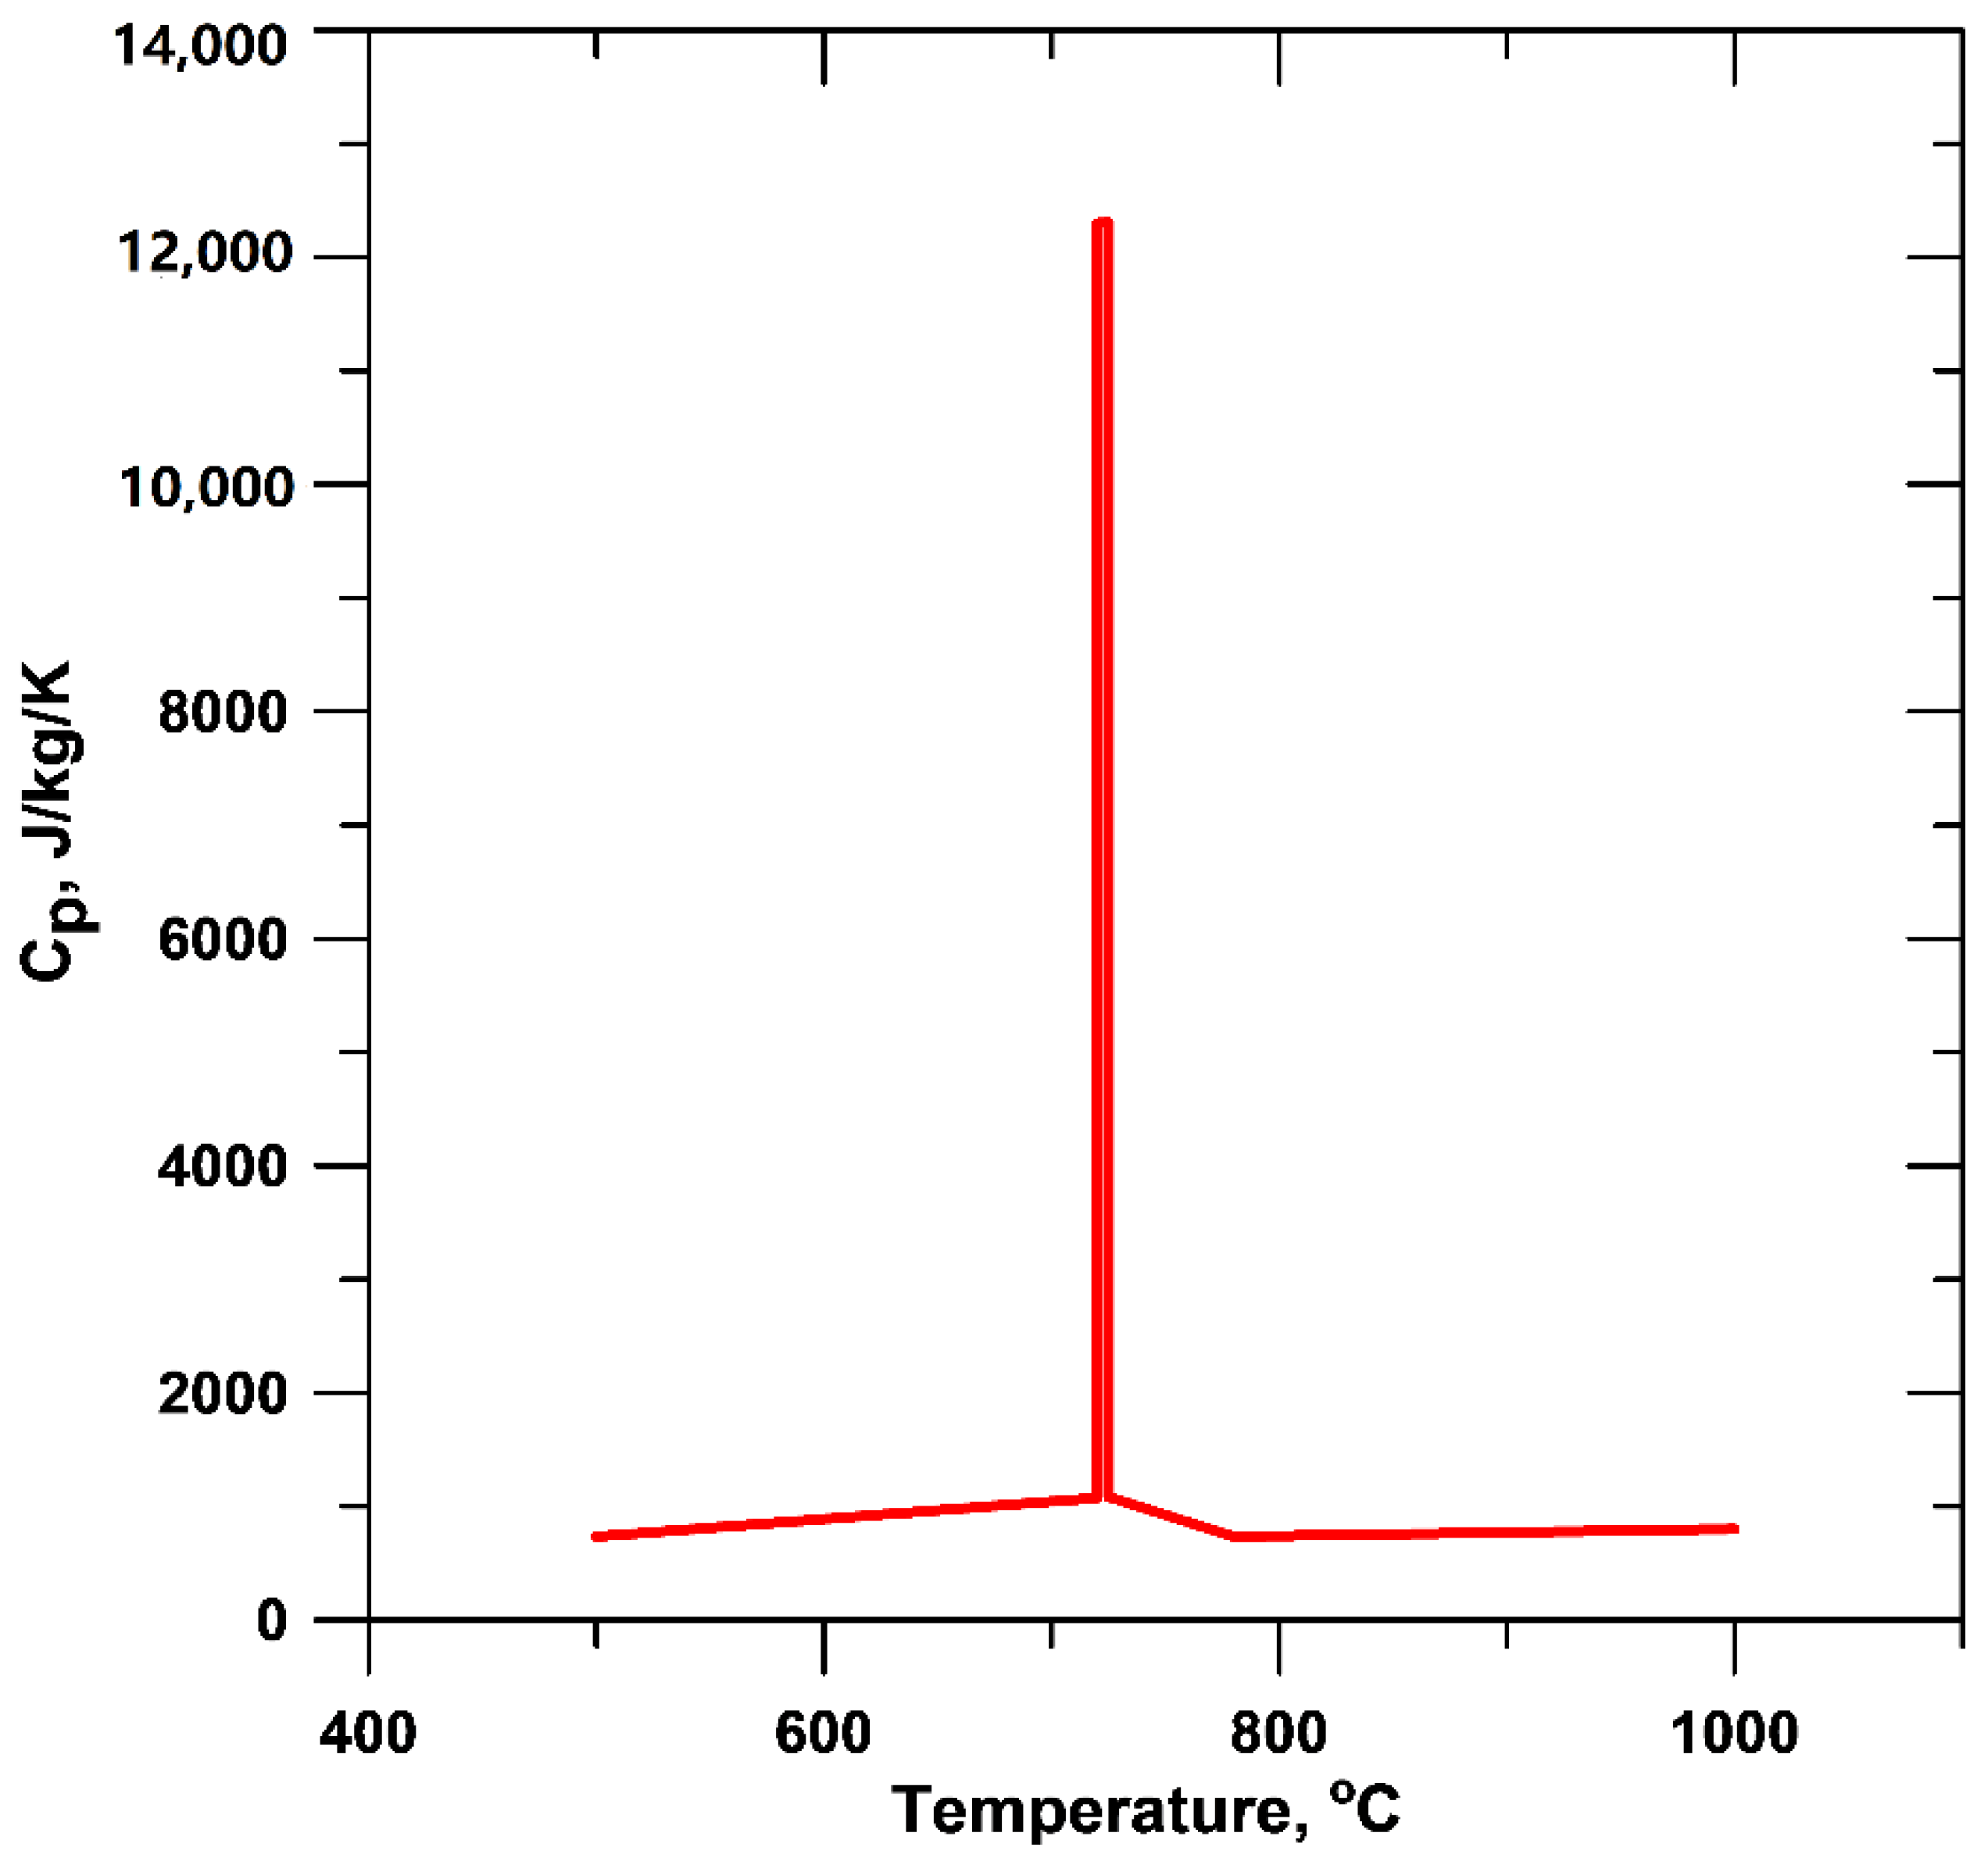
| Temperature (°C) | Cast Iron Thermophysical Properties | Heat Transfer Coefficient | ||||
|---|---|---|---|---|---|---|
| Density | Specific Heat | Thermal Conductivity | Sand-Casting | Chill-Casting | Insulation-Casting | |
| [kg/m3] | [J/kg/K] | [W/m/K] | [W/m2/K] | [W/m2/K] | [W/m2/K] | |
| 600 | 7146 | 700 | 40 | 40 | 100 | 10 |
| 720 | - | 1074 | - | - | 300 | - |
| 721 | - | 12301 | - | - | - | - |
| 724 | - | 12308 | - | - | - | - |
| 725 | - | 1082 | - | 50 | - | 10 |
| 750 | - | 733 | - | - | - | - |
| 900 | - | - | - | 80 | - | 15 |
| 1000 | 6994 | 800 | - | 150 | - | 25 |
| 1100 | - | 825 | - | 250 | 1300 | 55 |
| 1154 | 6960 | 837 | 40 | - | 1450 | - |
| 1170 | 7016 | - | - | - | - | - |
| 1200 | 6985 | - | - | - | 1600 | 60 |
| 1227 | 6939 | 749 | - | - | - | - |
| 1300 | 6876 | 771 | - | 380 | - | 180 |
| 1700 | 6395 | 807 | 38 | 940 | 2700 | 940 |
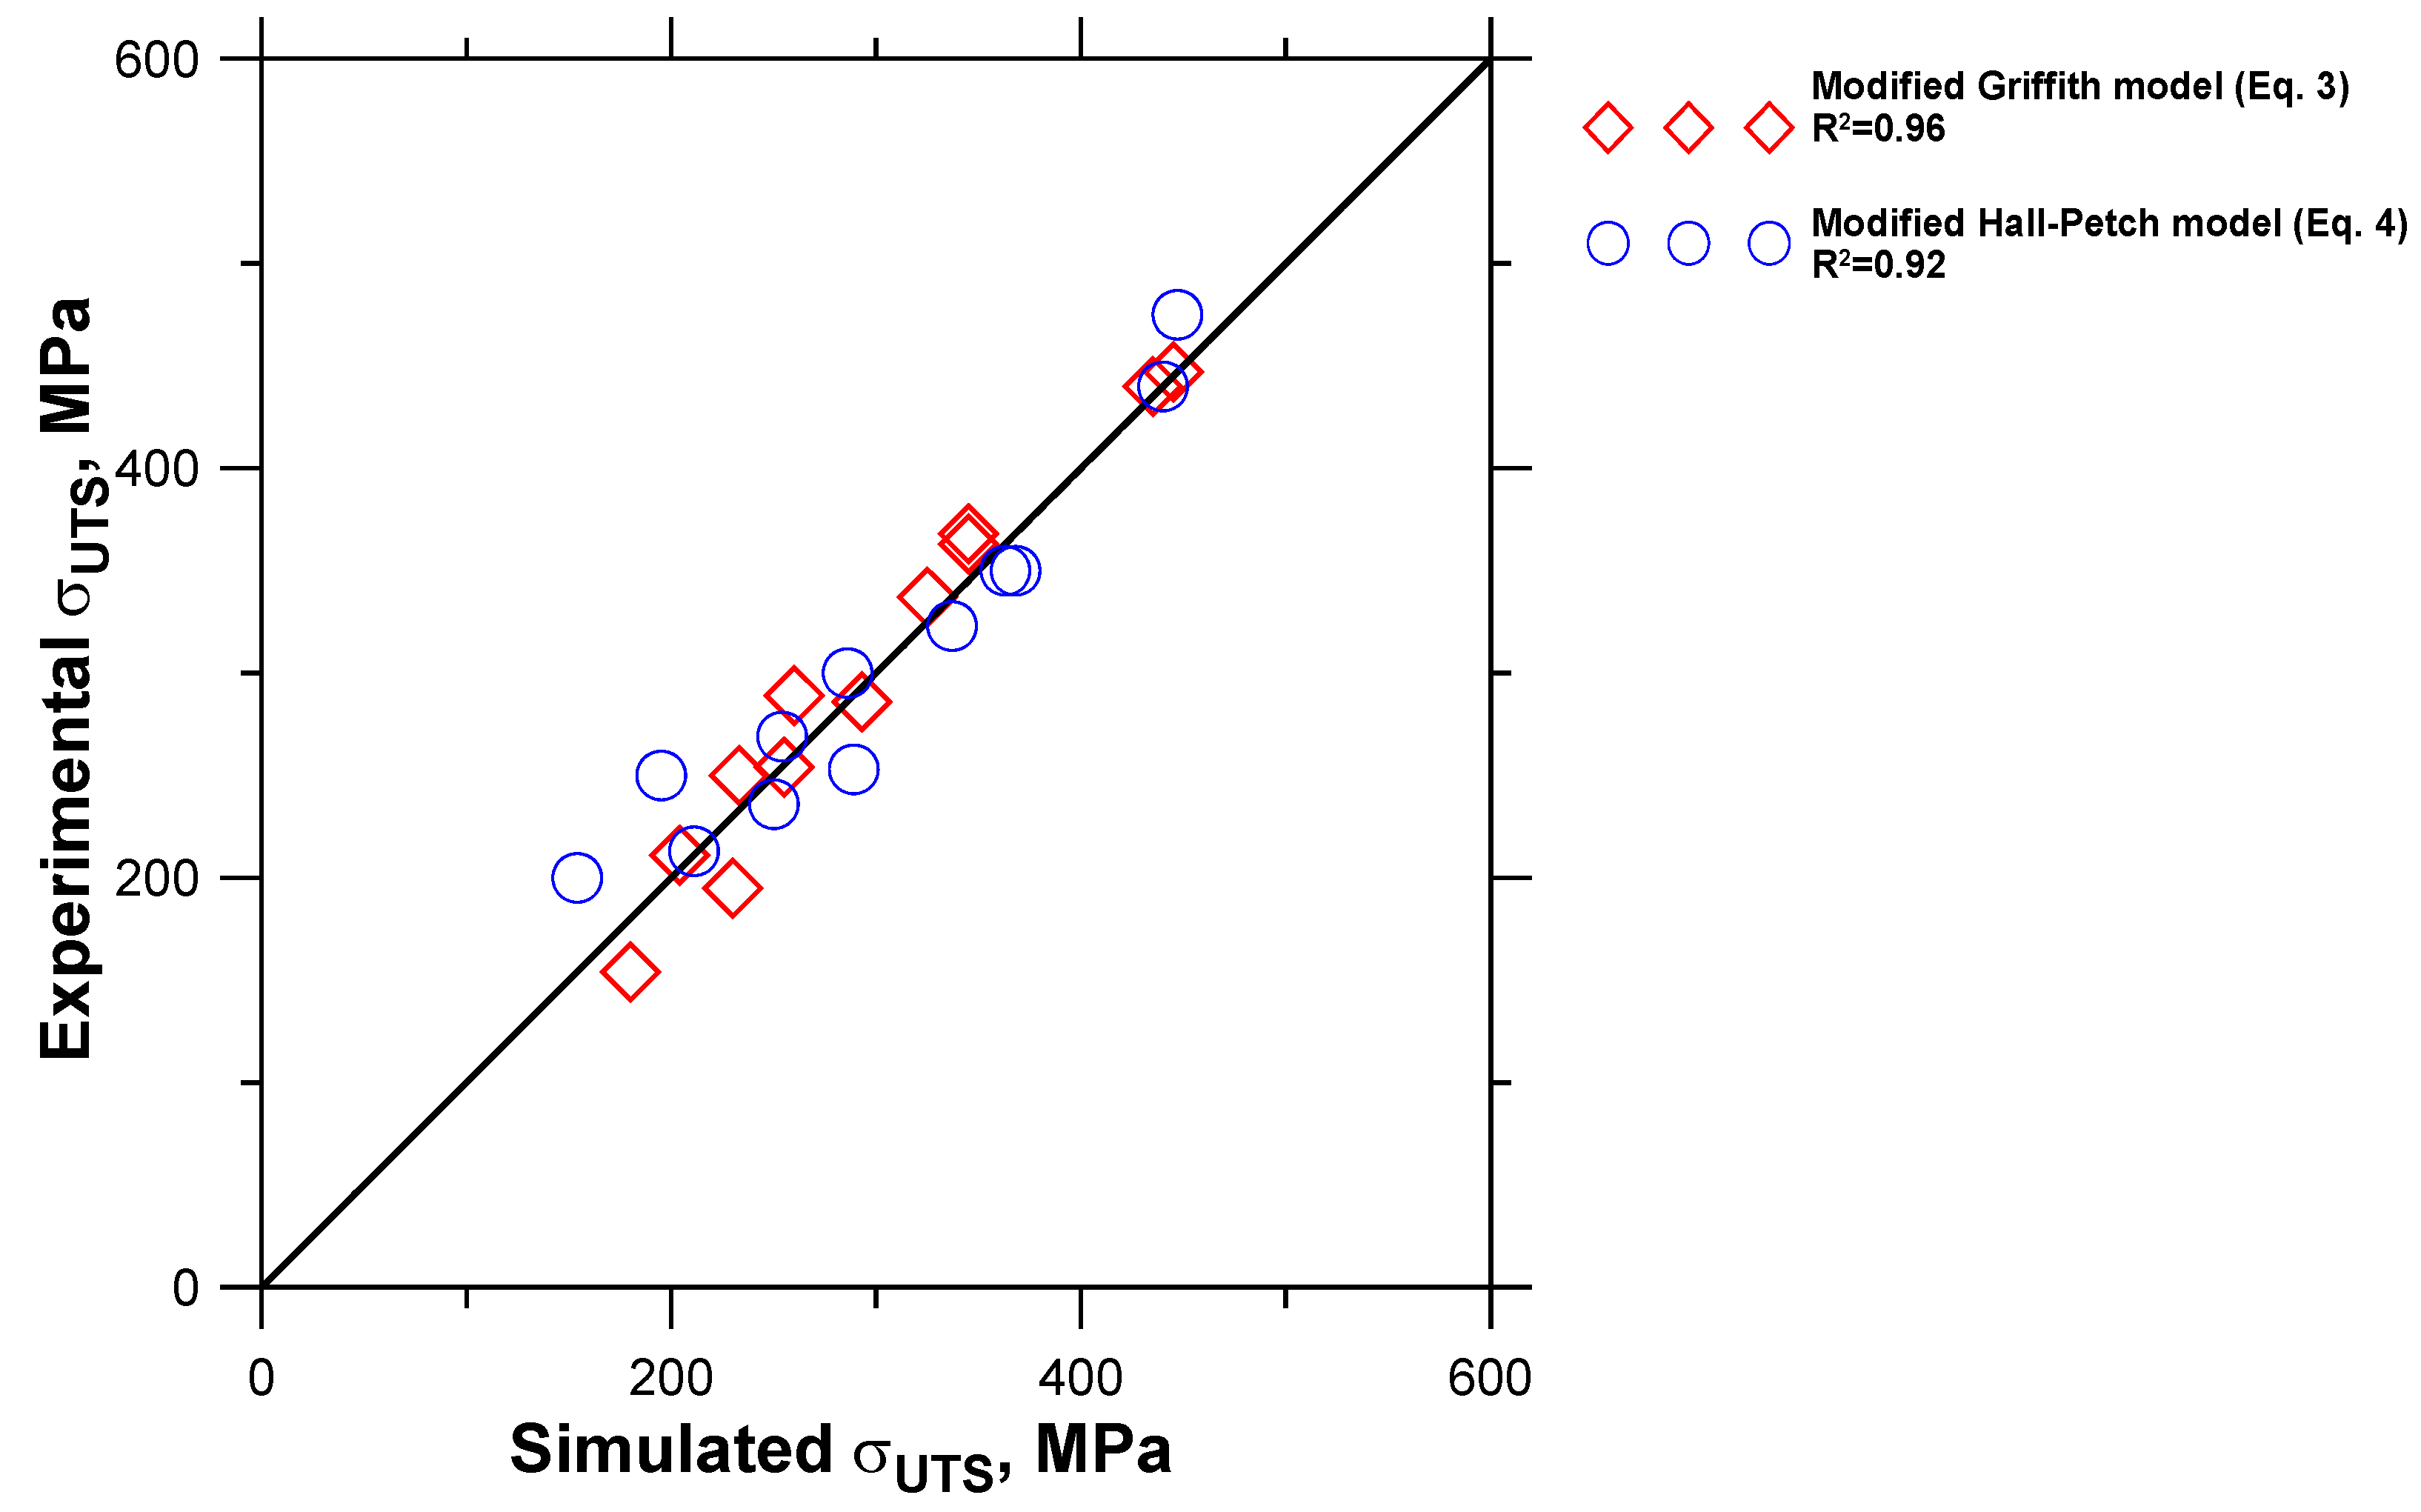
| Alloy | UTS, [MPa] | Average Percentage Error, [%] | ||||
|---|---|---|---|---|---|---|
| Experiment | Simulation | |||||
| Equation (3) 1 | Equation (4) 2 | Equation (3) 1 | Equation (4) 2 | |||
| A | Insulation | 154 | 180 | 200 | 17 | 30 |
| Sand | 195 | 230 | 250 | 18 | 28 | |
| Chill | 363 | 340–350 | 340–350 | 5 | 5 | |
| B | Insulation | 211 | 204 | 213 | 3 | 1 |
| Sand | 254 | 255 | 269 | 1 | 6 | |
| Chill | 368 | 365–375 | 385–395 | 1 | 6 | |
| C | Insulation | 250 | 233 | 236 | 7 | 6 |
| Sand | 286 | 293 | 300 | 2 | 5 | |
| Chill | 440 | 420–435 | 435–445 | 3 | 0 | |
| D | Insulation | 289 | 260 | 253 | 10 | 12 |
| Sand | 337 | 325 | 323 | 4 | 4 | |
| Chill | 447 | 440–455 | 475–490 | 0 | 8 | |
© 2018 by the authors. Licensee MDPI, Basel, Switzerland. This article is an open access article distributed under the terms and conditions of the Creative Commons Attribution (CC BY) license (http://creativecommons.org/licenses/by/4.0/).
Share and Cite
Fourlakidis, V.; Belov, I.; Diószegi, A. Strength Prediction for Pearlitic Lamellar Graphite Iron: Model Validation. Metals 2018, 8, 684. https://doi.org/10.3390/met8090684
Fourlakidis V, Belov I, Diószegi A. Strength Prediction for Pearlitic Lamellar Graphite Iron: Model Validation. Metals. 2018; 8(9):684. https://doi.org/10.3390/met8090684
Chicago/Turabian StyleFourlakidis, Vasilios, Ilia Belov, and Attila Diószegi. 2018. "Strength Prediction for Pearlitic Lamellar Graphite Iron: Model Validation" Metals 8, no. 9: 684. https://doi.org/10.3390/met8090684
APA StyleFourlakidis, V., Belov, I., & Diószegi, A. (2018). Strength Prediction for Pearlitic Lamellar Graphite Iron: Model Validation. Metals, 8(9), 684. https://doi.org/10.3390/met8090684