Abstract
In situ scanning electron microscopy three-point bending test was employed in this study to investigate the crack initiation and propagation in 5A05 aluminum alloy. The microscale strain fields around the crack tip were measured by using the geometric phase analysis method. Results show that prior to the crack initiation, the normal strain εyy (y direction is perpendicular to the load direction) was tensile around the notch, whereas the normal strain εxx (x direction is parallel to the load direction) was compressive around the notch. The shear strain εxy was nearly zero. With the increase in load, the normal strains εyy and εxx gradually increased, but the change in shear strain εxy was not evident. When the stresses at several sharp points at the notch root reached the breaking strengths, a few microcracks initiated at these points. At this moment, the normal strains εyy and εxx were much greater than the shear εxy, and dominated the strain fields around the crack tip. In the crack propagation process, the normal strains εyy and εxx, and the shear strain εxy dominated the strain fields around the crack tip, thereby leading to a Z-form of crack propagation path in the specimen.
1. Introduction
In many cases, material fracture may cause catastrophic failure. Therefore, understanding the fracture behavior is of fundamental importance to improve the mechanical properties of materials and assess the reliability of engineering components [1,2]. The investigation of the crack propagation and deformation fields around the crack tip is critical in understanding failure mechanisms and developing appropriate fracture criteria [3,4,5,6,7].
In situ scanning electron microscopy (SEM) has recently become a direct and effective tool to investigate crack initiation, propagation, and fracture mechanisms [8,9,10,11,12,13,14]. The fracture behavior of A390 aluminum cylinder liner alloys under static loading was investigated by in situ SEM [15]. The fracture evolution of DP600 steel under different stress states was investigated by in situ SEM tensile test [16]. The susceptibility of Fe–26Al–0.5Cr intermetallic alloy to hydrogen-assisted cracking was evaluated by using in situ micromechanical testing in an environmental SEM [17]. The micromechanical fracture behavior of a single crystalline, <001>{001} oriented tungsten was performed by in situ microcantilever testing inside an SEM [18]. The microstructure and fracture evolution of a magnesium alloy AZ31 were characterized by conducting quantitative in situ SEM tensile tests [19]. However, these studies mainly focused on the crack initiation and propagation behavior, but did not consider the deformation fields around the crack tip. Jin et al. measured the displacement fields at the crack tip in an aluminum specimen using in situ SEM combined with the grid method and digital image correlation (DIC) technique [20]. Koyama et al. characterized the strain component and distribution at a focused ion beam notch tip in a laminated Ti–6Al–4V alloy by performing in situ SEM tensile test and micrographic DIC [21]. Tong et al. reported the first quantitative experimental evidence of near-tip strain ratchetting with cycles, as captured in situ by DIC technique on a compact tension specimen of stainless steel 316L, using both stereo and SEM systems [22]. However, these studies failed to discuss the crack initiation and propagation behavior. In order to gain an improved understanding of the fracture mechanisms, it is essential to investigate both the crack propagation and strain field evolution around the crack tip.
Geometric phase analysis (GPA) is a very efficient method that maps deformation fields from high-resolution transmission electron microscopy (HRTEM) images [23,24]. To date, the GPA method has been applied to a wide variety of systems, such as nanoparticles [25], dislocations [26] and grain interface [27]. The GPA method was mainly applied to HRTEM images for measuring the nanoscale deformation fields, and its accuracy can reach 0.003 nm [23]. The pattern size of a crystal lattice captured by the HRTEM may not generally be larger than 1000 nm × 1000 nm. Therefore, the measured area by GPA is limited within a nanometer scope, which confined its application for a large area measurement. In fact, combining with advanced grating fabrication techniques, GPA can also be used to measure the deformation at the macro- and microscales [28,29,30]. For large area measurements using the GPA method, the mean relative error of the strain is approximately 1.5% [31]. Thus, the GPA method is accurate for large area measurements. The grating and speckle patterns are two basic deformation carriers in optical measurement methods. For the grating pattern, the strain measurement by GPA has a better accuracy than that by DIC [32].
In the current study, a microscale grating pattern was fabricated on the surface of a 5A05 aluminum alloy specimen by the sputtering deposition technology and fine square mesh copper grid [20], which was used as the marks for the subsequent strain field measurement. Crack initiation and propagation were also investigated by performing in situ SEM three-point bending test. Meanwhile, the microscale strain field evolution around the crack tip was analyzed by using the GPA method.
2. Geometric Phase Analysis
The geometric phase analysis (GPA) method involves the filtering of an image with an asymmetric filter centered on a Bragg spot in the Fourier transform of an HRTEM lattice image and performing an inverse Fourier transform. The phase component of the resulting complex image provides information about local displacements in a direction normal to lattice fringes corresponding to the position of the Bragg spot. The geometric phase Pg(r) of these local Fourier components is directly related to the displacement field component u(r) in the direction of the reciprocal lattice vector g. Pg(r) is calculated as follows:
The two-dimensional displacement fields are determined by measuring two phase images, namely, Pg1(r) and Pg2(r), as follows:
where a1 and a2 are the basis vectors of the lattices in real space corresponding to the reciprocal lattices defined by g1 and g2, respectively. Equation (2) is presented in matrix form, as follows:
where ux and uy are the displacements in x and y directions, respectively.
Thereafter, the plane strain is written as follows:
The standard deviation of the strain measurements by the GPA method is related to the mask radius in the Fourier analysis. Reducing the mask radius will decrease the standard deviation and increase the measurement precision, but at the expense of decreased spatial resolution [33]. This is an essential feature of local measurement, and precision is inversely related to the spatial resolution. In general, the mask radius between g/4 and g/3 (g is the module of the reciprocal lattice vector g) can achieve good reliability. To date, GPA has been developed as a commercial software by HREM Research Inc. (Higashimatsuyama, Japan), which is a plug-in for the image processing package Gatan Digital Micrograph.
3. Materials and Methods
3.1. Experimental Procedure
The material used in this study is the commercially available 5A05 aluminum alloy. Specimens were cut with electrical discharge machining out of a rectangular block. In order to observe the crack initiation in time, a through-thickness notch (depth: 1 mm; width: 0.3 mm; root diameter: 0.2 mm) was introduced at the center of one side as crack source, thereby resulting in stress concentration. After machining, the specimen was ground and mechanically and chemically polished to remove surface damage and residual stress. Lastly, the specimen was ultrasonically cleaned to produce an optically reflective surface.
In order to measure the deformation fields by GPA, sputtering deposition technology was adopted to generate a microscale grating pattern on the specimen surface [20]. A fine square mesh copper grid with 2000 mesh (G2000HS from Gilder Grids Ltd., Lincolnshire, UK) was first carefully laid over the 5A05 aluminum alloy specimen surface to cover the notch root. Special care was required to handle the mesh grid to ensure uniform flat contact between the mesh grid and specimen surface such that the grating pattern could be efficiently transferred onto the specimen surface. Thereafter, a thin layer of gold was deposited for 60 s by using an ion sputtering device (JFC-1600 from JEOL, Tokyo, Japan). Thus, the area underneath the mesh bar was not coated, while the space between the mesh bars was coated with gold. Therefore, the mesh grating pattern was transferred onto the 5A05 aluminum alloy specimen surface. The hole and bar widths of the mesh are 6.5 μm and 6 μm, respectively. The pitch size, which is the sum of the hole and bar widths, is 12.5 μm. Figure 1 shows the final geometry of the three-point bending specimen for the in situ SEM test and microscale grating pattern around its notch.
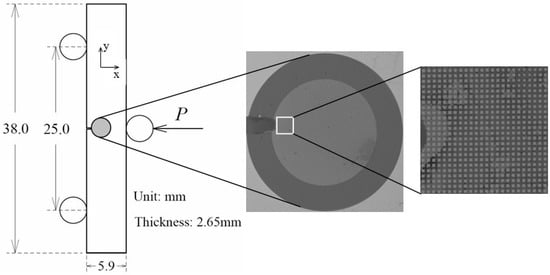
Figure 1.
Geometry of the three-point bending specimen for the in situ SEM test and microscale grating pattern around its notch.
3.2. In Situ SEM Three-Point Bending Test
In situ SEM three-point bending test was performed to observe the crack initiation and propagation, and acquire the images of the specimen with microscale grid. The set-up comprises a palm-sized three-point bending stage manufactured by Deben UK Ltd. (Suffolk, UK) (see Figure 2) and installed in a SEM (S-3400N from Hitachi, Tokyo, Japan) chamber.
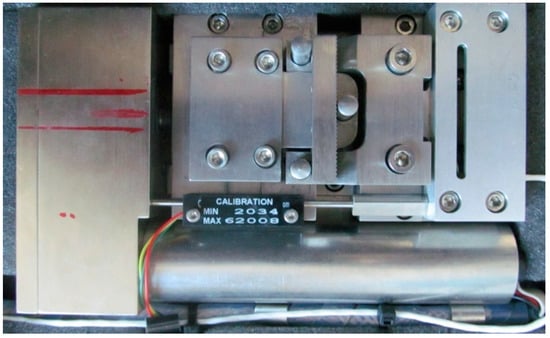
Figure 2.
Deben MICROTEST three-point bending stage for the in situ SEM test.
During the test, the three-point bending load was applied step-by-step under displacement-controlled conditions, with a ramp rate of 8.33 μm/s, until the specimen fractured. As the load was applied, a crack at the notch root was initiated and propagated. After each displacement increment, the loading was paused to acquire SEM images at a specific load level. A magnification of 40×, backscattered electronic imaging mode, and acquisition time of 100.8 ms were used to acquire the SEM images during the three-point bending test. The image size used in the SEM imaging was 2560 pixels × 1920 pixels. The spatial resolution of each pixel was 1.24069 μm. A series of SEM images around the notch root was recorded. The quantitative measurement of the strain fields was performed by using the GPA method.
4. Results and Discussion
4.1. Crack Initiation and Propagation
Figure 3 shows a series of SEM images of crack initiation and propagation in 5A05 aluminum alloy. Figure 3a depicts the appearance of the region around the notch before the three-point loading. The notch root and microscale grid pattern was evidently observed. Figure 3b,c show the region around the notch when the load increased to 150 N and 200 N, respectively. It can be seen that no evident deformation of grids around the notch root was observed at the early stage of loading.
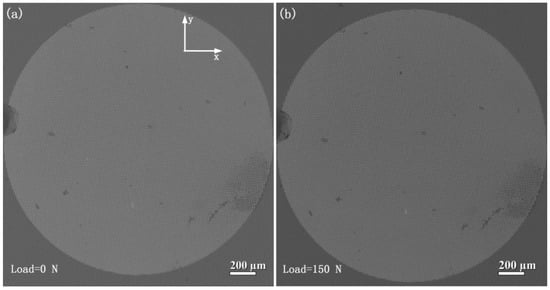
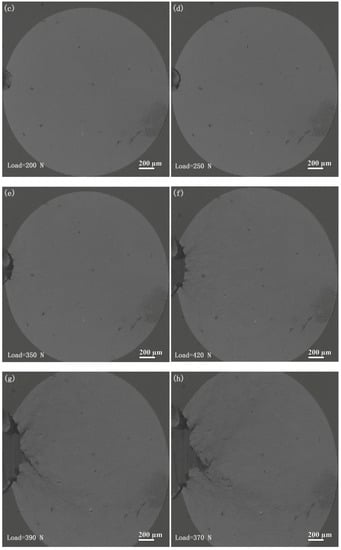
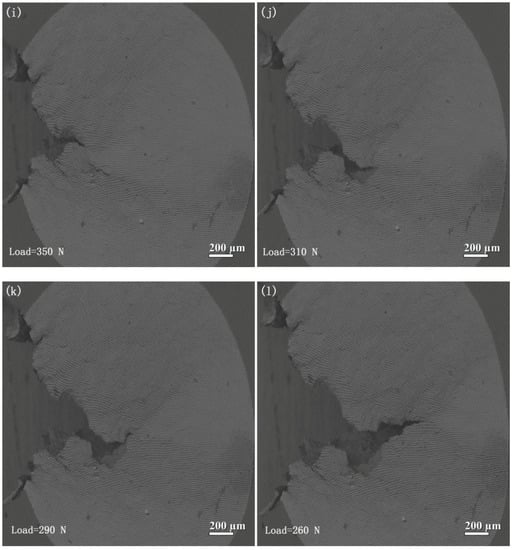
Figure 3.
SEM images around the notch in the three-point bending test (a) before loading (0 N); (b) at 150 N during increasing load; (c) at 200 N during increasing load; (d) at 250 N during increasing load; (e) at 350 N during increasing load; (f) at maximum load 420 N; (g) at 390 N during decreasing load; (h) at 370 N during decreasing load; (i) at 350 N during decreasing load; (j) at 310 N during decreasing load; (k) at 290 N during decreasing load; (l) at 260 N during decreasing load.
When the load increased to 250 N (see Figure 3d), the stresses at several sharp points at the notch root reached the breaking strengths, thereby leading to a few microcracks initiated at these points. Compared with Figure 3a, Figure 3d shows that the notch root was apparently stretched at this time. When the load increased to 350 N (see Figure 3e), these microcracks became more evident. Figure 3f shows the SEM image around the notch at a maximum load of 420 N. It can be seen that the grids around the notch root were distorted severely. The area covered with the grid was stretched in the vertical direction, and shortened in the horizontal direction. The original circle area covered with grids had turned into an ellipse. Compared with Figure 3e, Figure 3f shows that the microcracks at several sharp points at the notch root became wider and grew slightly to the right, particularly for the microcrack in the middle of the notch root.
The load began to decrease after applying a maximum load of 420 N. Figure 3g shows the SEM image when the load decreased to 390 N. It can be seen that the microcrack in the middle of the notch root grew rapidly to the lower right (i.e., approximately 45° from the horizontal direction) and evolved into the main crack. Meanwhile, the microcrack above the middle of the notch root grew rapidly to the upper right (i.e., approximately 45° from the horizontal direction) and became a secondary crack. The growth of the main crack was apparently faster than that of the secondary crack. From Figure 3h–l, it can be seen that the secondary crack did not grow in the subsequent loading process. Figure 3h shows the SEM image when the load decreased to 370 N. It can be seen that the main crack grew toward the upper right. With the increase in displacement and crack propagation, the main crack grew toward the lower right again (see Figure 3i), and a new microcrack initiated in the weakness region of mechanical strength ahead of the main crack. The main crack linked with the new microcrack and grew toward the right (see Figure 3j). Thereafter, the main crack grew toward the upper right again (see Figure 3k), and then toward the right again (see Figure 3l). Therefore, a Z-form of the crack propagation path in the specimen was formed. At the end of the loading, an unstable crack propagation occurred, thereby resulting in the fracture of the specimen.
4.2. Deformation Evolution around a Crack Tip
To further analyze the mechanisms of crack nucleation and propagation in the 5A05 aluminum alloy, the strain fields around the notch and crack tip during the three-point bending process are mapped by using the GPA method.
Figure 4 and Figure 5 show the distribution of the strain fields around the notch before the crack initiation. The color scale indicates strain changes between −25% and 25%. Figure 4 and Figure 5 depict the strain field maps for Figure 3b,c when the load increased to 150 N and 200 N, respectively. From Figure 4a, it can be seen that the normal strain εyy was nearly zero, while the slight tension strain only occurred around the notch root (its average strain was 0.91%) when the load was 150 N. With the increase in load, the tension strain around the notch grew, but the normal strain εyy in most areas remained relatively low (see Figure 5a). It can be seen that two inclined lobes of high strain emanating occurred and pointed to the direction of approximately 45° from the horizontal direction above and below the notch. The average strain in the inclined lobes of high strain emanating was 2.25%. Since both the geometry of the specimen and the applied load were symmetric in terms of the notch, the normal stresses σyy and σxx around the notch were symmetric in terms of the notch. Therefore, the εyy map was symmetric in terms of the notch, which agreed with the result from the electronic speckle pattern interferometry [34]. Figure 4b shows that the normal strain εxx was nearly zero, while the slight compression strain only occurred around the notch root (its average strain was −0.96%) when the load was 150 N. With the increase in load, the compression strain around the notch root increased, but the normal strain εxx in most areas remained relatively low (see Figure 5b). It can be seen that two inclined lobes of high strain emanating occurred, and pointed to the direction of approximately 45° from the horizontal direction above and below the notch. The average strain in the inclined lobes of high strain emanating was −1.63%. The εxx map was also symmetric in terms of the notch, owing to the symmetric distribution of the normal stresses. Figure 4c and Figure 5c illustrate that the shear strain εxy was nearly zero. The change in shear strain εxy was not evident with the increase in load.
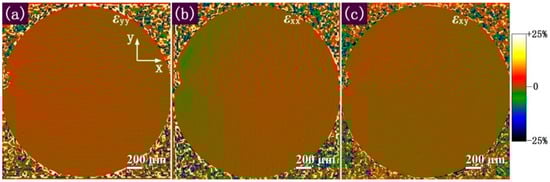
Figure 4.
Strain fields at 150 N during the increasing load corresponding to Figure 3b measured by using the GPA method: (a) εyy strain field; (b) εxx strain field; (c) εxy strain field.
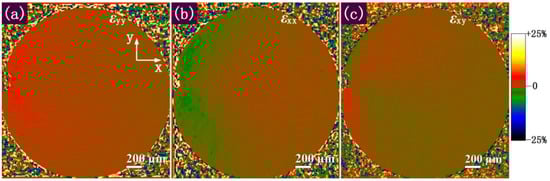
Figure 5.
Strain fields at 200 N during the increasing load corresponding to Figure 3c measured by using the GPA method: (a) εyy strain field; (b) εxx strain field; (c) εxy strain field.
Figure 6 shows the distribution of the strain fields around the crack tip at the crack initiation. From Figure 6a, it can be seen that the εyy map remained symmetric in terms of the notch. The two lobes of high strain emanating grew significantly (its average strain reached 3.97%), but maintained the same shape and orientation. Figure 6b illustrate that the εxx map remained symmetric in terms of the notch. The two lobes of high strain emanating grew significantly (its average strain reached −3.71%), but maintained the same shape and orientation. From Figure 6c, it can be seen that small areas of negative and positive shear strains were observed above and below the notch, respectively. Large areas of positive and negative shear strains were determined in the upper and lower right of the notch, respectively. Since both the geometry of the specimen and the applied load were symmetric in terms of the notch, the shear stress σxy around the notch was antisymmetric in terms of the notch. Therefore, the εxy map was antisymmetric in terms of the notch. Since the shear stress σxy near the edge of the specimen was very small, the normal stresses σyy and σxx around the crack tip were much greater than the shear stress σxy. Therefore, the normal strains εyy and εxx were much greater than the shear εxy. So the normal strains εyy and εxx dominated the strain fields around the crack tip at the crack initiation.
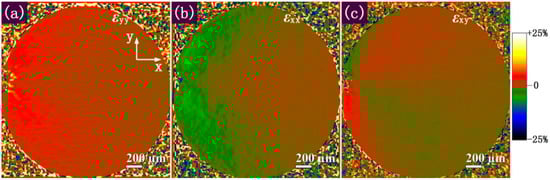
Figure 6.
Strain fields at the stage of crack initiation corresponding to Figure 3d measured by using the GPA method: (a) εyy strain field; (b) εxx strain field; (c) εxy strain field.
Figure 7 shows the distribution of the strain fields around the crack tip when the load increased to a maximum 420 N. Figure 8 presents the distribution of the strain fields around the crack tip when the load decreased to 390 N. Comparing Figure 7a and Figure 8a to Figure 6a, it can be seen that the two lobes of high strain emanating grew rapidly, but maintained the same shape and orientation in the crack propagation process. The average strain in the two lobes of high strain emanating reached 13.66% (see Figure 7a) and 17.25% (see Figure 8a), respectively. The εyy map remained symmetric in terms of the notch. A comparison of Figure 7b and Figure 8b with Figure 6b indicates that the change in εxx was similar to that in εyy in the crack propagation process. With the increase in displacement and crack propagation, the shear stress σxy increased rapidly. Therefore, in the comparison of Figure 7c and Figure 8c with Figure 6c, the shear strain εxy increased rapidly in the crack propagation process. In addition, the εxy map remained antisymmetric in terms of the notch. A comparison of Figure 7 and Figure 8 with Figure 6 shows that the normal strains εyy and εxx and the shear strain εxy increased rapidly. Thus, they dominated the strain fields around the crack tip in the crack propagation process. With the increase in shear stress σxy, a few slip bands occurred along the direction of the maximum shear stress, which were the preferential sites for crack propagation. When the crack encountered the slip bands, it grew along the slip bands which was reported as a low energy channel and would accelerate the crack growth propagation [35], thereby leading to a Z-form of crack propagation path in the specimen.
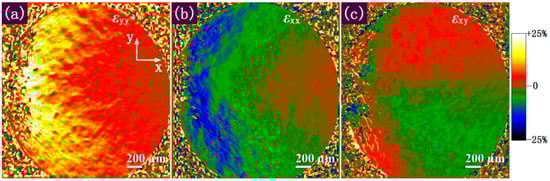
Figure 7.
Strain fields at a maximum load 420 N corresponding to Figure 3f measured by using the GPA method: (a) εyy strain field; (b) εxx strain field; (c) εxy strain field.
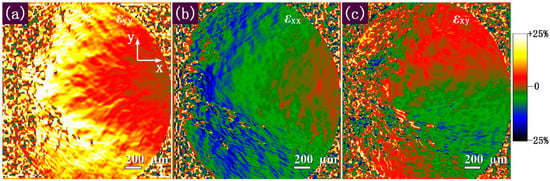
Figure 8.
Strain fields at 390 N during the decreasing load corresponding to Figure 3g measured by using the GPA method: (a) εyy strain field; (b) εxx strain field; (c) εxy strain field.
To verify the precision of the GPA method in the current study, the standard deviations of strain components in a uniform area were calculated. The results show that the standard deviations of εyy, εxx and εxy are 0.27%, 0.31%, and 0.19%, respectively. In addition, the spatial resolution of each pixel is 1.24069 μm, and the pitch size is 12.5 μm in this study, so the grating pitch is about 10 pixels. For the grating pitch of 10 pixels, the relative error of the strain measurement by the GPA method is under 10% [36]. Therefore, the GPA method is accurate and feasible in the current study.
5. Conclusions
Taking the fine square mesh copper grid with 2000 mesh as a mask, the microscale grating pattern was fabricated on the 5A05 aluminum alloy specimen surface via the ion sputtering deposition technology. In situ SEM three-point bending test was employed to investigate the crack initiation and propagation in a 5A05 aluminum alloy. The microscale strain fields around the crack tip were measured by using the geometric phase analysis (GPA) method. The analysis results are as follows.
(1) When the stresses at several sharp points at the notch root reached the breaking strengths, a few microcracks initiated at these points. The microcrack in the middle of the notch root grew rapidly to the lower right (i.e., approximately 45° from the horizontal direction) and evolved into the main crack. With the increase of displacement and crack propagation, a new microcrack initiated in the weakness region of mechanical strength ahead of the main crack, and finally linked with the main crack. A Z-form of the crack propagation path in the specimen was formed. At the end of the loading, an unstable crack propagation occurred, thereby resulting in the fracture of the specimen.
(2) Prior to crack initiation, the normal strain εyy was tensile around the notch and two inclined lobes of high strain emanating occurred and pointed to the direction of approximately 45° from the horizontal direction above and below the notch. The εyy map was symmetric in terms of the notch. The normal strain εxx was compressive around the notch, and two inclined lobes of high strain emanating occurred and pointed to the direction of approximately 45° from the horizontal direction above and below the notch. The εxx map was symmetric in terms of notch. The shear strain εxy was nearly zero, and its change was not evident with the increase in load.
(3) At crack initiation, the εyy and εxx maps maintained the same shape and orientation, while the tension in the horizontal direction and compression in the vertical direction were further strengthened. Small areas of negative and positive shear strains were observed above and below the notch, respectively. Large areas of positive and negative shear strains were determined in the upper and lower right of the notch, respectively. The shear strain εxy map was antisymmetric in terms of the notch. The shear strain εxy was relatively small, and the normal strains εyy and εxx were much greater than the shear εxy. Therefore, the normal strains εyy and εxx dominated the strain fields around the crack tip at the crack initiation.
(4) In the crack propagation process, the normal strains εyy and εxx and shear strain εxy grew rapidly, and maintained the same shape and orientation with the increase of displacement and crack propagation. The normal strains εyy and εxx, and the shear strain εxy dominated the strain fields around the crack tip in the crack propagation process, thereby leading to a Z-form of the crack propagation path in the specimen.
Author Contributions
J.L., C.Z., and Y.X. designed the experiments. J.L., W.L. and X.H. performed the experiments. J.L., W.L. and F.L. analyzed the data. J.L. and C.Z. wrote the paper. Y.X. reviewed the paper prior to submission.
Funding
This research was funded by the National Natural Science Foundation of China (Grant No. 11562016, 11672175, 11762013 and 11762014) and Natural Science Foundation of Inner Mongolia Autonomous Region (Grant No. 2018MS01013 and 2013MS0107).
Acknowledgments
This study was supported by the National Natural Science Foundation of China (Grant No. 11562016, 11672175, 11762013 and 11762014), and Natural Science Foundation of Inner Mongolia Autonomous Region (Grant No. 2018MS01013 and 2013MS0107). This work was also supported by the Special Project of the Western Region’s Talent Cultivation of China Scholarship Council (Grant No. 20145049).
Conflicts of Interest
The authors declare no conflict of interest in this study.
References
- Wang, P.F.; Yang, J.L.; Liu, W.S.; Tang, X.Z.; Zhao, K.; Lu, X.H.; Xu, S.L. Tunable crack propagation behavior in carbon fiber reinforced plastic laminates with polydopamine and graphene oxide treated fibers. Mater. Des. 2017, 113, 68–75. [Google Scholar] [CrossRef]
- Datta, S.; Chattopadhyay, A.; Iyyer, N.; Phan, N. Fatigue crack propagation under biaxial fatigue loading with single overloads. Int. J. Fatigue 2018, 109, 103–113. [Google Scholar] [CrossRef]
- Zhao, C.W.; Xing, Y.M.; Bai, P.C.; Li, J.J.; Liu, Q.L.; Du, Y.G.; Liu, M.H. Crack tip dislocation emission and nanoscale deformation fields in silicon. Appl. Phys. A 2011, 105, 207–210. [Google Scholar] [CrossRef]
- Patil, S.D.; Narasimhan, R.; Mishra, R.K. Observation of kink shear bands in an aluminium single crystal fracture specimen. Scr. Mater. 2009, 61, 465–468. [Google Scholar] [CrossRef]
- Jiang, R.; Pierron, F.; Octaviani, S.; Reed, P.A.S. Characterisation of strain localisation processes during fatigue crack initiation and early crack propagation by SEM-DIC in an advanced disc alloy. Mater. Sci. Eng. A 2017, 699, 128–144. [Google Scholar] [CrossRef]
- Gioacchino, F.D.; Fonseca, J.Q.D. An experimental study of the polycrystalline plasticity of austenitic stainless steel. Int. J. Plast. 2015, 74, 92–109. [Google Scholar] [CrossRef]
- Kasvayee, K.A.; Salomonsson, K.; Ghassemali, E.; Jarfors, A.E.W. Microstructural strain distribution in ductile iron; comparison between finite element simulation and digital image correlation measurements. Mater. Sci. Eng. A 2016, 655, 27–35. [Google Scholar] [CrossRef]
- Zhang, X.H.; Zhang, S.Y.; Zhao, Q.Y.; Zhao, Y.Q.; Li, R.; Zeng, W.D. In-situ observations of the tensile deformation and fracture behavior of a fine-grained titanium alloy sheet. J. Alloys Compd. 2018, 740, 660–668. [Google Scholar] [CrossRef]
- Barrios, A.; Gupta, S.; Castelluccio, G.M.; Pierron, O.N. Quantitative in situ SEM high cycle fatigue: The critical role of oxygen on nanoscale-void-controlled nucleation and propagation of small cracks in Ni microbeams. Nano Lett. 2018, 18, 2595–2602. [Google Scholar] [CrossRef] [PubMed]
- Meille, S.; Saâdaoui, M.; Reynaud, P.; Fantozzi, G. Mechanisms of crack propagation in dry plaster. J. Eur. Ceram. Soc. 2003, 23, 3105–3112. [Google Scholar] [CrossRef]
- Li, B.S.; Shang, J.L.; Guo, J.J.; Fu, H.Z. In situ observation of fracture behavior of in situ TiBw/Ti composites. Mater. Sci. Eng. A 2004, 383, 316–322. [Google Scholar] [CrossRef]
- Chen, Y.F.; Zheng, S.Q.; Tu, J.P.; Xiao, S.L.; Tian, J.; Xu, L.J.; Chen, Y.Y. Fracture characteristics of notched investment cast TiAl alloy through in situ SEM observation. Trans. Nonferrous. Met. Soc. China 2012, 22, 2389–2394. [Google Scholar] [CrossRef]
- Zhang, J.Z.; Zhang, J.Z.; Meng, Z.X. Direct high resolution in situ SEM observations of very small fatigue crack growth in the ultra-fine grain aluminium alloy IN 9052. Scr. Mater. 2004, 50, 825–828. [Google Scholar] [CrossRef]
- Sheng, J.; Li, J.C.; La, P.Q.; Wei, F.; Song, Y.; Wang, K.L. Investigating the tensile properties of micro-nanostructured 304 stainless steel with SEM and in-situ tension. Sci. Adv. Mater. 2017, 9, 1020–1027. [Google Scholar] [CrossRef]
- Cha, G.J.; Li, J.G.; Xiong, S.M.; Han, Z.Q. Fracture behaviors of A390 aluminum cylinder liner alloys under static loading. J. Alloys Compd. 2013, 550, 370–379. [Google Scholar] [CrossRef]
- Zhao, P.J.; Chen, Z.H.; Dong, C.F. Failure analysis based on microvoids damage model for DP600 steel on in-situ tensile tests. Eng. Fract. Mech. 2016, 154, 152–168. [Google Scholar] [CrossRef]
- Rogne, B.R.S.; Kheradmand, N.; Deng, Y.; Barnoush, A. In situ micromechanical testing in environmental scanning electron microscope: A new insight into hydrogen-assisted cracking. Acta Mater. 2018, 144, 257–268. [Google Scholar] [CrossRef]
- Alfreider, M.; Kozic, D.; Kolednik, O.; Kiener, D. In-situ elastic-plastic fracture mechanics on the microscale by means of continuous dynamical testing. Mater. Des. 2018, 148, 177–187. [Google Scholar] [CrossRef]
- Liu, X.W.; Liu, Y.; Jin, B.; Lu, Y.; Lu, J. Microstructure evolution and mechanical properties of a SMATed Mg alloy under In Situ SEM tensile testing. J. Mater. Sci. Technol. 2017, 33, 224–230. [Google Scholar] [CrossRef]
- Jin, H.; Haldar, S.; Bruck, H.A.; Lu, W.Y. Grid method for microscale discontinuous deformation measurement. Exp. Mech. 2011, 51, 565–574. [Google Scholar] [CrossRef]
- Koyama, M.; Tanaka, Y.; Tsuzaki, K. Micrographic digital image correlation coupled with microlithography: Case study of strain localization and subsequent cracking at an FIB notch tip in a laminated Ti-6Al-4V Alloy. Exp. Mech. 2018, 58, 381–386. [Google Scholar] [CrossRef]
- Tong, J.; Lin, B.; Lu, Y.W.; Madi, K.; Tai, Y.H.; Yates, J.R.; Doquet, V. Near-tip strain evolution under cyclic loading: In situ experimental observation and numerical modelling. Int. J. Fatigue 2015, 71, 45–52. [Google Scholar] [CrossRef]
- Hÿtch, M.J.; Putaux, J.L.; Pénisson, J.M. Measurement of the displacement field of dislocations to 0.03 Å by electron microscopy. Nature 2003, 423, 270–273. [Google Scholar] [CrossRef] [PubMed]
- Zhang, H.Y.; Liu, Z.W.; Wen, H.H.; Xie, H.H.; Liu, C. Subset geometric phase analysis method for deformation evaluation of HRTEM images. Ultramicroscopy 2016, 171, 34–42. [Google Scholar] [CrossRef] [PubMed]
- Johnson, C.L.; Snoeck, E.; Ezcurdia, M.; Rodríguez-González, B.; Pastoriza-Santos, I.; Liz-Marzán, L.M.; Hÿtch, M.J. Effects of elastic anisotropy on strain distributions in decahedral gold nanoparticles. Nat. Mater. 2007, 7, 120–124. [Google Scholar] [CrossRef] [PubMed]
- Zhao, C.W.; Xing, Y.M.; Zhou, C.E.; Bai, P.C. Experimental examination of displacement and strain fields in an edge dislocation core. Acta Mater. 2008, 56, 2570–2575. [Google Scholar] [CrossRef]
- Zhang, H.Y.; Wen, H.H.; Liu, Z.W.; Zhang, Q.; Xie, H.M. TEM nano-Moire evaluation for an invisible lattice structure near the grain interface. Nanoscale 2017, 9, 15923–15933. [Google Scholar] [CrossRef] [PubMed]
- Li, J.J.; Zhao, C.W.; Xing, Y.M.; Hou, X.H.; Fan, Z.C.; Jin, Y.J.; Wang, Y. In-situ SEM investigation of sub-microscale deformation fields around a crack-tip in silicon. Opt. Laser Eng. 2012, 50, 1694–1698. [Google Scholar] [CrossRef]
- Wang, Q.H.; Xie, H.M.; Liu, Z.W.; Lou, X.H.; Wang, J.F.; Xu, K.W.; Zhang, Z.H.; Liao, J.H.; Gu, C.Z. Residual stress assessment of interconnects by slot milling with FIB and geometric phase analysis. Opt. Laser Eng. 2010, 48, 1113–1118. [Google Scholar] [CrossRef]
- Dai, X.L.; Xie, H.M.; Wang, Q.H. Geometric phase analysis based on the windowed Fourier transform for the deformation field measurement. Opt. Laser Technol. 2014, 58, 119–127. [Google Scholar] [CrossRef]
- Dai, X.L.; Xie, H.M.; Wang, H.X.; Li, C.W.; Liu, Z.W.; Wu, L.F. The geometric phase analysis method based on the local high resolution discrete Fourier transform for deformation measurement. Meas. Sci. Technol. 2014, 25, 025402. [Google Scholar] [CrossRef]
- Zhu, R.H.; Xie, H.M.; Dai, X.L.; Zhu, J.G.; Jin, A.Z. Residual stress measurement in thin films using a slitting method with geometric phase analysis under a dual beam (FIB/SEM) system. Meas. Sci. Technol. 2014, 25, 095003. [Google Scholar] [CrossRef]
- Hÿtch, M.J.; Houdellier, F.; Huee, F.; Snoeck, E. Dark-field electron holography for the measurement of geometric phase. Ultramicroscopy 2011, 111, 1328–1337. [Google Scholar] [CrossRef] [PubMed]
- Chen, H.H.N.; Su, R.K.L.; Fok, S.L.; Zhang, H.G. Fracture behavior of nuclear graphite under three-point bending tests. Eng. Fract. Mech. 2017, 186, 143–157. [Google Scholar] [CrossRef]
- Tan, C.S.; Sun, Q.Y.; Xiao, L.; Zhao, Y.Q.; Sun, J. Characterization of deformation in primary α phase and crack initiation and propagation of TC21 alloy using in-situ SEM experiments. Mater. Sci. Eng. A 2018, 725, 33–42. [Google Scholar] [CrossRef]
- Zhang, Q.; Liu, Z.; Xie, H.; Ma, K.; Wu, L. Fabrication of thermal-resistant gratings for high-temperature measurements using geometric phase analysis. Rev. Sci. Instrum. 2016, 87, 123104. [Google Scholar] [CrossRef] [PubMed]
© 2018 by the authors. Licensee MDPI, Basel, Switzerland. This article is an open access article distributed under the terms and conditions of the Creative Commons Attribution (CC BY) license (http://creativecommons.org/licenses/by/4.0/).