Article

Monitoring Steel Bolted Joints during a Monotonic Tensile Test Using Linear and Nonlinear Lamb Wave Methods: A Feasibility Study

Department of Mechanics of Materials and Structures, Faculty of Civil and Environmental Engineering, Gdansk University of Technology, Narutowicza 11/12, 80-233 Gdansk, Poland
Metals 2018, 8(9), 683; https://doi.org/10.3390/met8090683
Submission received: 10 August 2018 / Revised: 25 August 2018 / Accepted: 30 August 2018 / Published: 31 August 2018
(This article belongs to the Special Issue Metallic Materials under Dynamic Loading)

Abstract

:
The structural integrity of steel bolted joints may be compromised due to excessive loading. Therefore, condition assessment and the detection of potential defects before they cause a failure have become a major issue. The paper is focused on the condition monitoring of a bolted lap joint subjected to progressive degradation in a tensile test. The inspection used Lamb waves propagated through the overlap area. Wave propagation signals were registered automatically by means of piezoelectric transducers. Two damage indices were defined based on linear and nonlinear features of Lamb waves. The use of a network of piezoelectric transducers and the analysis of multiple signals instead of single ones was proved to effectively monitor the state of the bolted joint. The obtained results showed that the method enabled to detect selected stages of the degradation process and to characterize the reduction of the contact area between the plates in the overlap area.

1. Introduction

Bolted lap joints are widely used to assemble metal or composite elements in mechanical and civil engineering structures. The structural integrity of such connections may be compromised due to excessive loading. Different failure modes can be observed during monotonic and cyclic loads. In general, a lap joint can be damaged as a result of fastener failure (self-loosening of a bolt [1], fracture of a bolt [2]) or rupture in the connected plates (net-tension failure, cleavage failure, shear-out failure, tearing failure, and bearing failure [3,4,5]).
In order to improve the safety and reliability of bolted connections, a variety of different non-destructive techniques have been developed, including vision-based methods [6,7,8], impedance-based methods [9,10,11], and vibration-based methods [12,13]. One of the most effective approaches is based on the phenomenon of ultrasonic wave propagation. Yang and Chang [14,15] developed a structural health monitoring (SHM) system for the detection of bolt loosening in composite panels. They used attenuation patterns of propagating guided waves to assess the fastener integrity. Park et al. [16] applied Lamb waves to detect loose bolts in a bolt-jointed steel plate. It was proved that appropriate processing of registered signals with the use of wavelet transform and support vector machine improved the damage detection capability of the proposed SHM system. Amerini and Meo [17] introduced damage indices intended to assess the loosening state of a bolted lap joint. Both linear and nonlinear ultrasound parameters were investigated. In the case of the linear approach, the index was based on the first-order acoustic moment, while for the nonlinear method, the second harmonics generation and sidebands modulation indices were defined. The experiments were conducted for two configurations, i.e., the loosened state and the fully-fastened bolt. Wang et al. [18] proposed a method to monitor bolt loosening by analyzing the energy of ultrasonic signals acquired in the pitch-catch mode. They tested a steel joint with one bolt tightened by a torque wrench for different torque levels. The obtained results revealed an increase of the signal energy with increasing torque level. Parvasi et al. [19] investigated the feasibility of the time reversal technique for the bolt preload monitoring. A tightness index was defined as the peak amplitude of the focused signal. For experimental verification of the example of a bolted connection specimen, the torque value was used as an indicator of the connection tightness. Rucka and Kedra [20] used a force washer transducer to measure the bolt load instead of using the torque level. As a quantitative indicator of bolt loosening, a modified power spectral moment was used, enabling the evaluation of the bolted joint condition. In recent years, interest in the combination of guided waves and electro-mechanical impedance techniques has grown (e.g., [21,22]). An and Sohn [21] proposed a new damage detection technique utilizing impedance and guided wave signals simultaneously. They tested the applicability of the integrated technique to the detection of bolt loosening in a steel lap joint under varying temperature conditions. Sevillano et al. [22] developed an integrated procedure combining guided waves and impedance signatures. A new damage indicator based on electro-mechanical power dissipation was introduced and its effectiveness in the detection of damage due to loose bolts was tested.
The research reported above concerns the detection of loosening in bolted joints without any external loads. A relatively new idea, which has gained the attention of many researchers, is based on the application of continuous ultrasound monitoring of structural elements subjected to mechanical degradation, caused by both monotonically increasing loading and cyclic loading. Moradi-Marani et al. [23] tested reinforced concrete slabs during four-point monotonic bending tests. Ultrasonic signals were registered by means of external piezoelectric transducers applied to the slab at each load level. The evaluation of mechanical damage growth was performed by the observation of energy changes. Shui et al. [24] examined an adhesive joint subjected to fatigue loading. To monitor fatigue damage, the acoustic nonlinearity parameter based on the fundamental frequency and the second harmonic was used. Omondi et al. [25] presented a study on crack monitoring in a concrete sleeper under bending by the acoustic emission and digital image correlation methods. Failure monitoring of steel-concrete adhesive connection was performed by Rucka [26]. The Sprague and Gears metric was applied for the interpretation of ultrasonic signals acquired during the push-out tests. Many other examples of the use of ultrasonic waves to monitor structural elements under mechanical degradation can be found in the literature; however, limited works deal with the monitoring of bolted lap joint subjected to external loading. Cho and Lissenden [27] monitored fatigue crack growth with the use of Lamb waves. Two specimens were tested: a plate with five open holes and a joint of two plates with five bolts. A transmission coefficient was defined for crack characterization. Recently, Yang et al. [28] presented a study on monitoring composite bolted joints under tensile load. They investigated relations between Lamb wave signals, tightening force, tensile load, and failure modes. Lamb waves were captured at one point of the joint before and after the tensile test as well as during the tensile test for a few selected load levels. As a damage indicator, the ratio of amplitudes of the first symmetric mode to the first antisymmetric mode was proposed.
In the real-time monitoring of structures, the application of permanently attached sensors made of active materials such as a piezoelectric ceramic plays an important role. The PZT (lead zirconate titanate) transducers are small, lightweight and inexpensive. They can act as both actuators and sensors and can be used in several SHM techniques such as the wave propagation method, electro-mechanical impedance method or transfer function method [29]. The PZT transducers can be bonded to the surface of a structure [30,31] or embedded into material [32]. The simplest setup for SHM purposes consists of one actuator and one sensor working in the pulse-echo mode or the pitch-catch mode (e.g., [16,18,19,24,26,28]). In recent studies, the advantages of the installation of a network of piezoelectric transducers and the usage of the multiple signals instead of single ones have been proved, for example in the case of reinforced concrete beams under flexural monotonic and cyclic loading [33,34,35,36].
This study deals with the monitoring of the structural integrity of a bolted lap joint. Measurements of Lamb wave signals were taken automatically during the tensile loading of the joint by means of piezoelectric transducers bonded at few selected points. The linear and nonlinear features of registered signals were extracted and two damage indicators were introduced. The first index utilizing linear characteristics of Lamb waves was based on the signal energy passing through the connection. The second index was based on nonlinear acoustic features manifested by the generation of the second harmonic component in measured signals. The amplitudes of the first and the second harmonics were extracted by means of the wavelet transform. The obtained results showed that the applied methodology has potential for the assessment of the state of health of bolted joints.

2. Materials and Methods

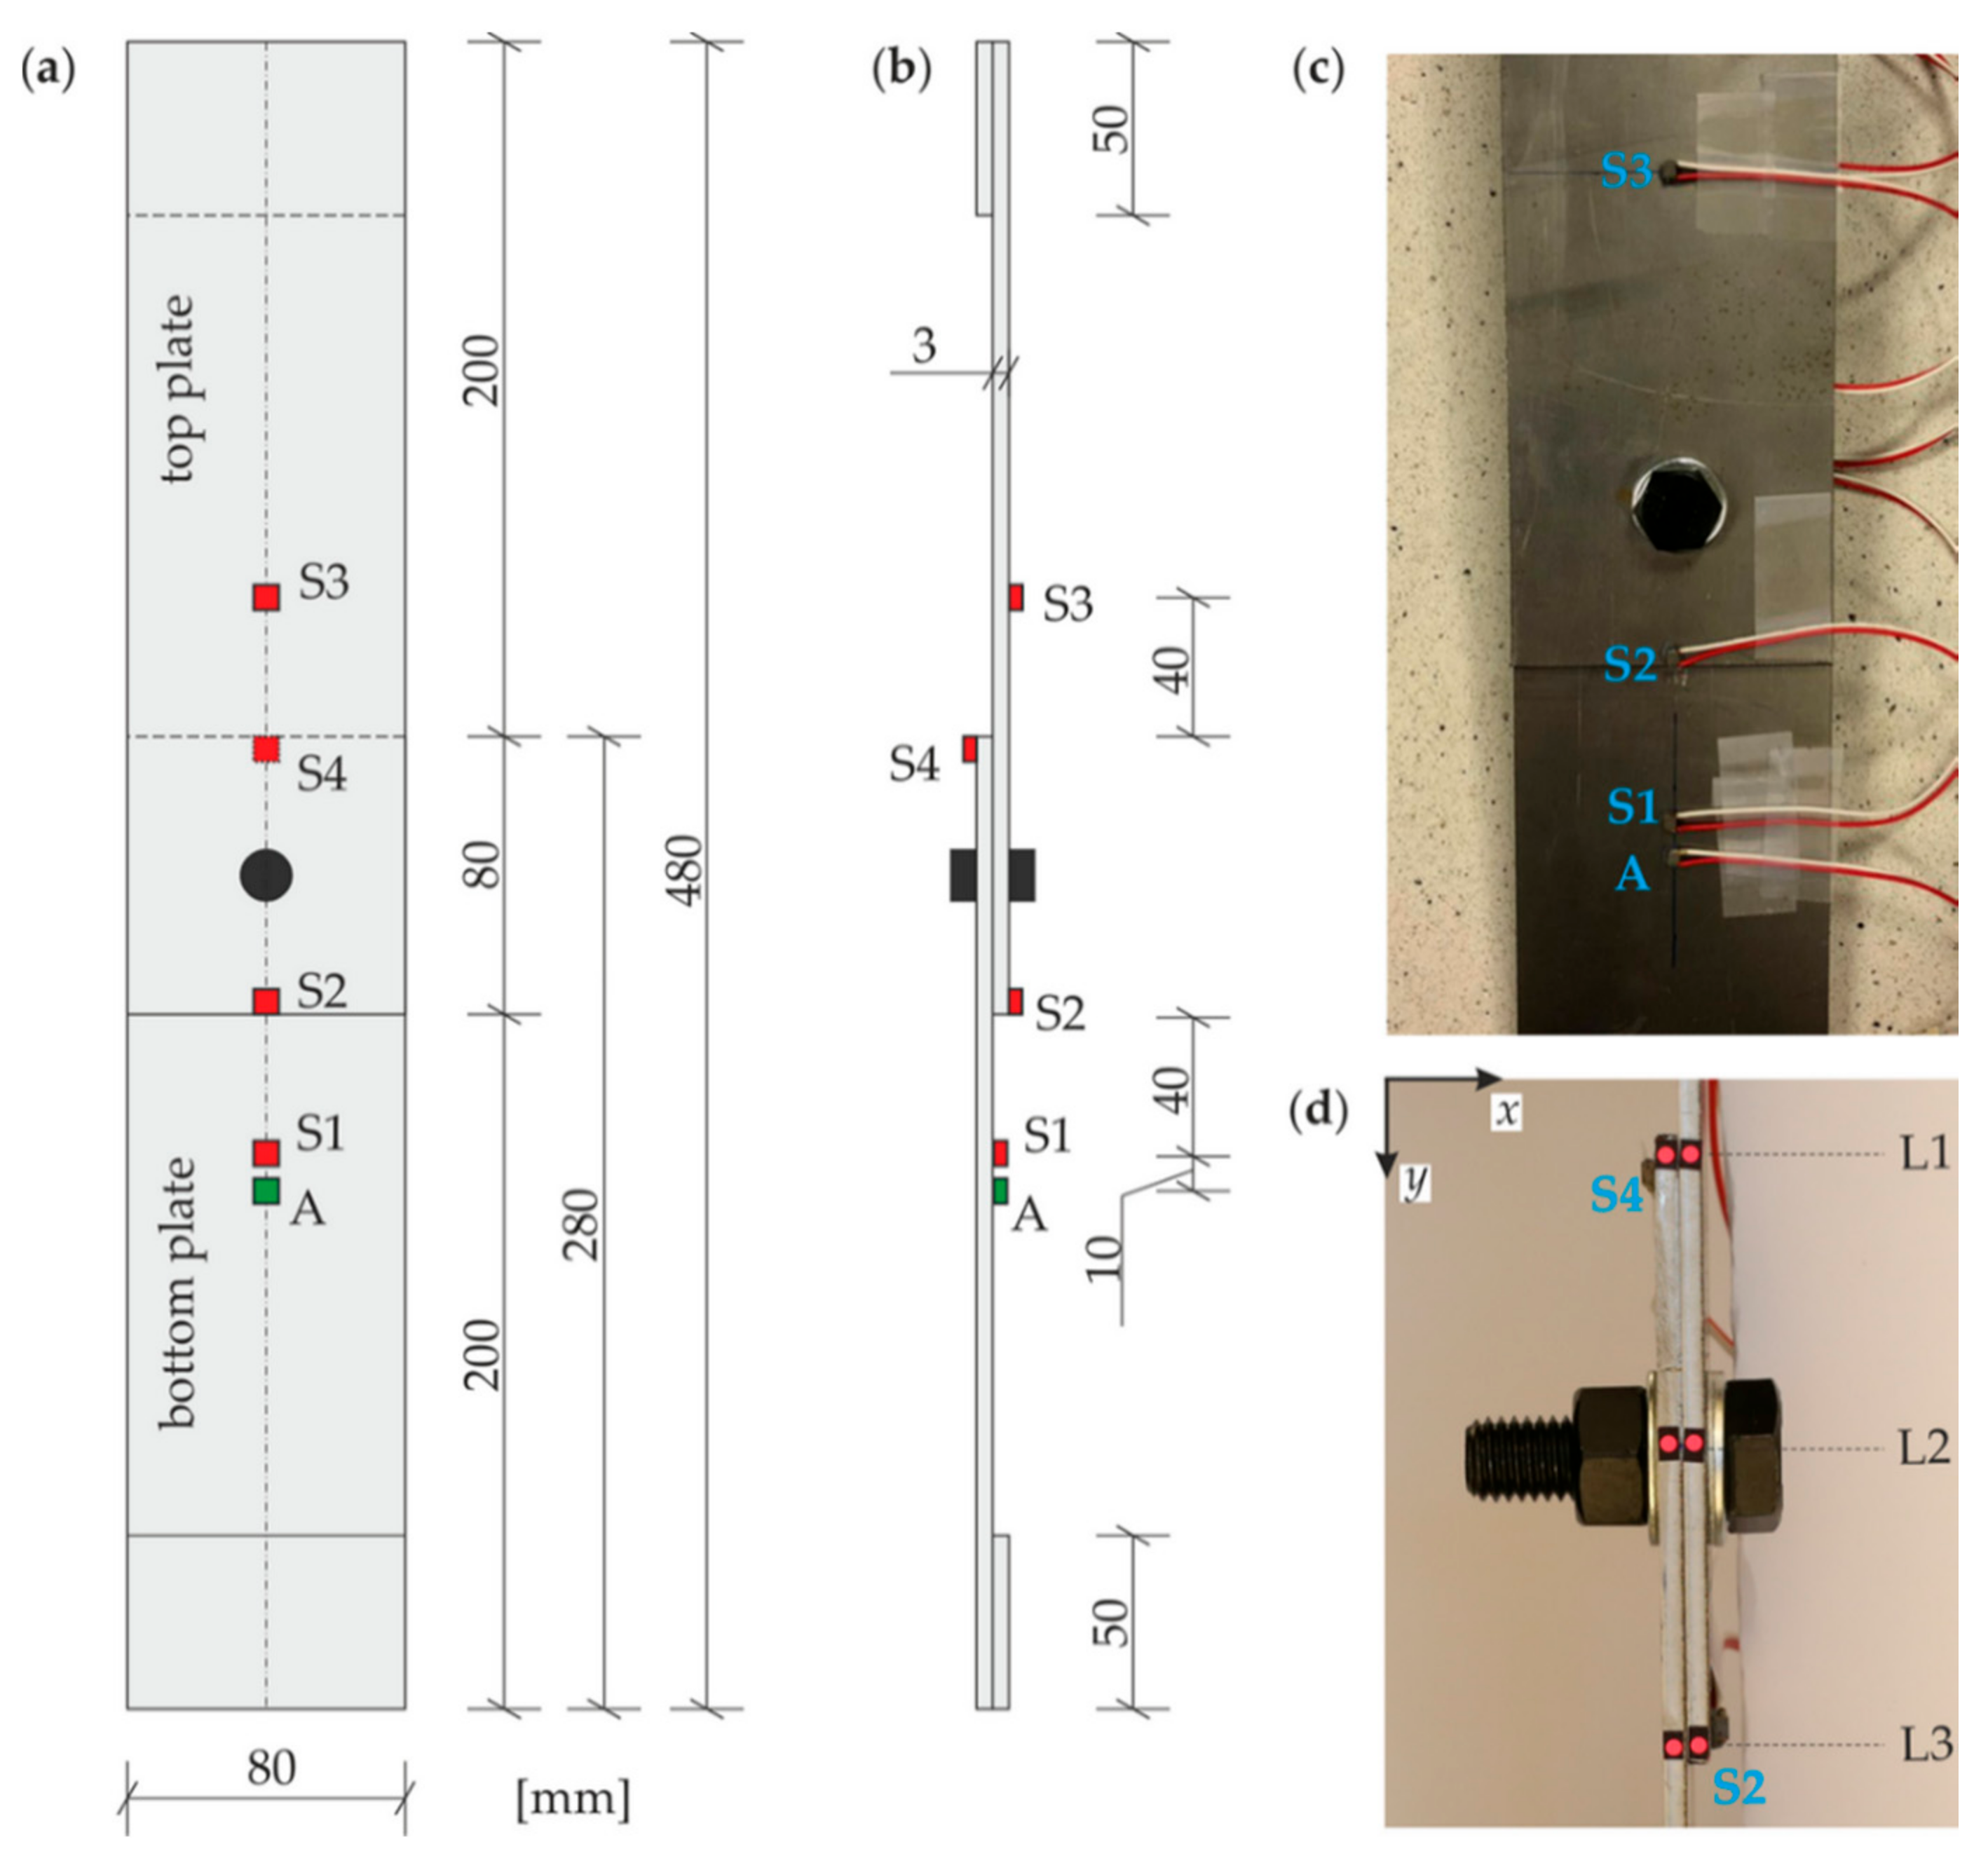
2.1. Description of Samples

Experiments were conducted on a single lap joint. Figure 1 shows the geometry of the tested specimen. The joint consisted of two steel plates with dimensions of 280 mm × 80 mm × 3 mm connected to each other by means of a bolt, a nut, and two washers. The length of the overlap was 80 mm. The bolt of class 10.9 had a diameter of 12 mm and the clearance hole diameter was 13 mm. A tightening torque of 80 Nm was applied to the bolt by a torque wrench. Two end tabs with a thickness of 3 mm were adhesively bonded at the ends of the joint to reduce the load eccentricity.

2.2. Load Tests and Ultrasonic Measurements

The laboratory setup consisted of three parts, namely a testing machine, a camera, and an ultrasonic system (Figure 2). The testing machine Z100 (Zwick Roell AG, Ulm, Germany) was used to apply the monotonic tensile loading. The preload applied to the specimen was equal to 100 N and the speed of the cross-head was 2 mm/min. During the test, photographs were taken every 10 s to measure the relative displacements between the steel plates and to observe damage evolution, while guided waves were excited and registered every 2 s to assess the damage state. Photographs of the front side of the specimen were obtained using an EOS 5D III digital camera (Canon, Tokyo, Japan).
Ultrasonic measurements were conducted by the system consisting of an arbitrary function generator AFG 3022 (Tektronix, Inc., Beaverton, OR, USA), a high-voltage amplifier P200 (FLC Electronics AB, Partille, Sweden), an eight-channel digital oscilloscope PicoScope 4824 (Pico Technology, Saint Neots, UK), and two three-channel signal conditioners Q-AMP3000 (EC Electronics, Krakow, Poland). Multilayer piezoelectric transducers NAC2024 (Noliac, Kvistgaard, Denmark) adhesively bonded using petro wax 080A109 (PCB Piezotronics, Inc., Depew, NY, USA) were used for both the excitation and registration of wave propagation signals. The function generator created an excitation voltage signal, which was amplified 10 times by the high-voltage amplifier. Next, the signal was applied to the piezoelectric actuator, which converted it into a mechanical force. Sensing of waves was achieved by piezoelectric sensors. The propagating stress waves were converted by them into the voltage signals, which after conditioning were registered by the oscilloscope.
The excitation consisted of a 50-cycle sine with a central frequency of 100 kHz modulated by the Hanning window. The frequency of 100 kHz was selected to induce only fundamental Lamb wave modes. The smoothed burst containing 50 cycles was chosen to excite a signal having a spectrum with a relatively narrow band. The bursts were produced in intervals of 2 s and wave propagation signals of a length of 2 ms were collected with a sampling frequency of 10 MHz. The integrated tensile and ultrasonic tests were carried out under constant temperature conditions (22 °C).
Figure 1 shows the arrangement of ultrasonic measurement points. Five multilayer piezoelectric transducers were in this study. The actuator (A) was attached on the bottom plate, at a distance of 5 cm from the edge of the joint. The sensor S1 was attached next to the actuator and it was used to trigger the signal. The other transducers (S2, S3, and S4) registered signals for monitoring purposes. Two of them (S2 and S4) were bonded at the beginning and at the end of the overlap. Their task was to control the degree of the integrity of the joint. The sensor S3 was bonded to the top plate to monitor the overall behavior of the joint in the pitch-catch mode.
Moreover, three pairs of paper markers were applied for optical displacement measurements (cf. [26]). The markers had a diameter of 2 mm and were attached to the joint at three levels (L1, L2, and L3, as indicated in Figure 1d). To track displacements, the image data were processed in the MATLAB® environment (9.3.0.713597, The MathWorks, Inc., Natick, MA, USA) using the author’s own code. The accuracy of the used optical method depends on the resolution of the photograph, and in the performed investigations, one pixel corresponded to 0.05 mm.

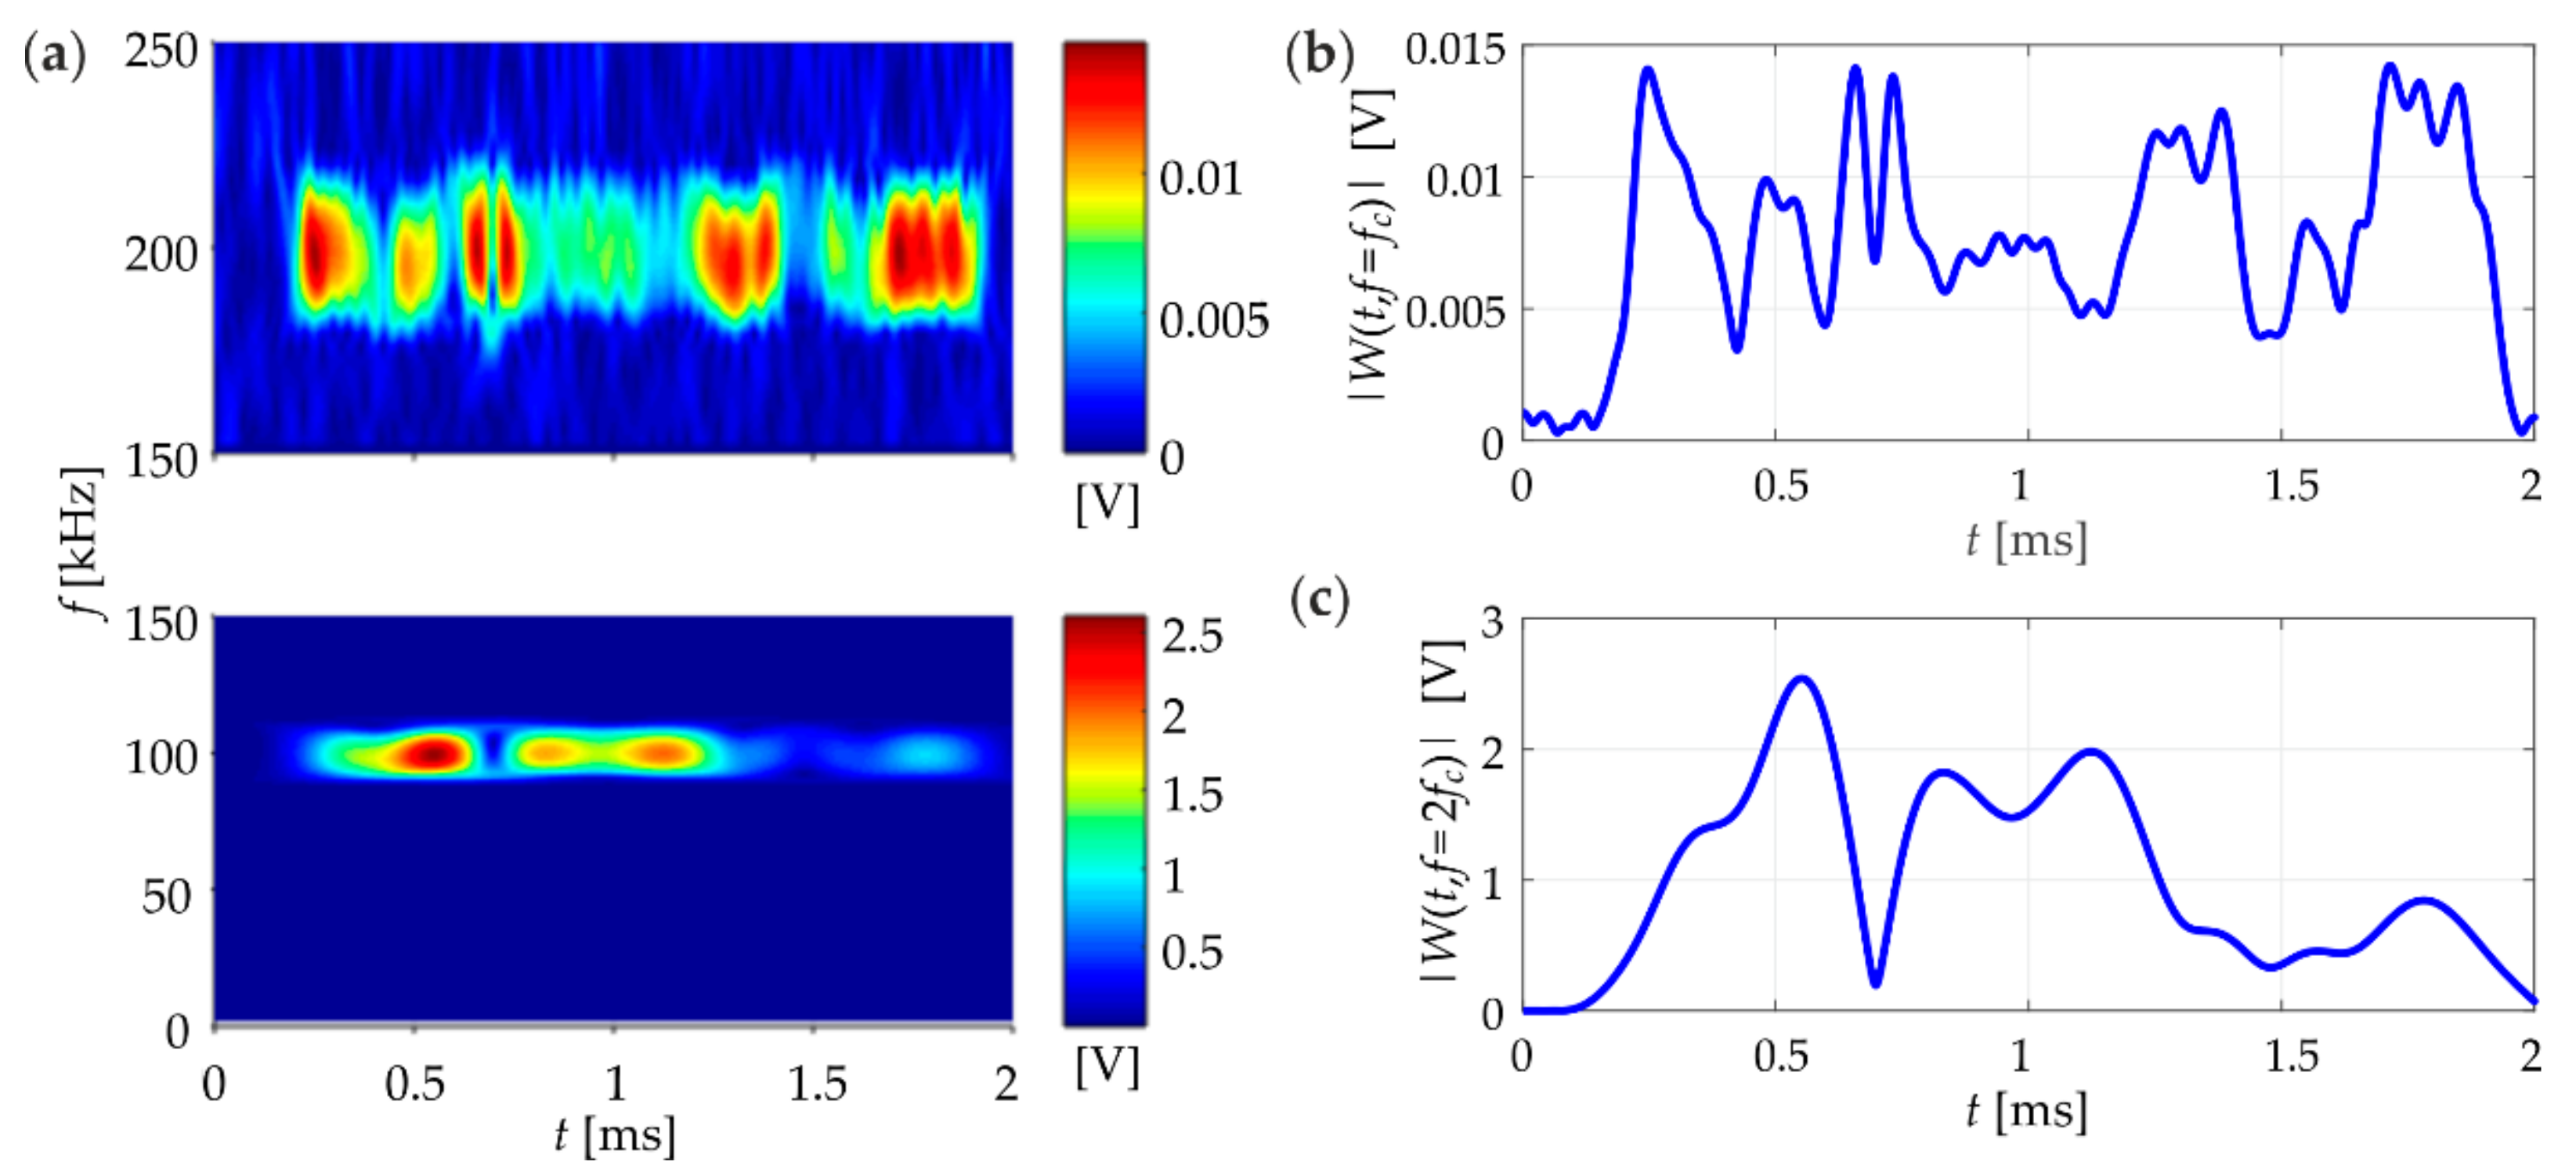
2.3. Processing of Lamb Wave Signals

Subsequently, wave propagation signals captured during the tensile tests were processed. First, the wave energy was calculated according to the following equation:
E = | x ( t ) | 2 d t = 1 2 π | X ( ω ) | 2 d ω
where X ( ω ) denotes the Fourier transform of a time signal x ( t ) .
Next, the continuous wavelet transform (CWT) was applied. For a given signal x ( t ) , the CWT is defined as an inner product of a signal function with the wavelet function ψ ( t ) (e.g., [37,38]):
W ( u , s ) = x ( t ) 1 s ψ ( t u s ) d t = 1 2 π X ( ω ) e i ω u Ψ ( s ω ) d ω
where s denotes the scale parameter, u is the translation parameter, and Ψ ( ω ) is the Fourier transform of the wavelet function ψ ( t ) . In this study, the bump wavelet was used as the wavelet function. The bump wavelet defined in the frequency domain has the form [39]:
Ψ ( s ω ) = e 1 1 1 ( s ω μ ) 2 / σ 2 1 [ ( μ σ ) / s , ( μ + σ ) / s ]
where μ and σ are parameters and 1 [ ( μ σ ) / s , ( μ + σ ) / s ] is the indicator function for the interval ( μ σ ) / s ω ( μ + σ ) / s . Valid values for μ are < 3 , 6 > and those for σ are < 0.1 , 1.2 > . In this paper, the following values for μ and σ were applied: μ = 5 , σ = 0.6 .
The CWT representation is a two-dimensional time-scale image described by the wavelet coefficients W ( u , s ) . To represent the Lamb wave signal in the time-frequency plane, the approximate relation between the scale s and the frequency f can be calculated from the equation:
f = F s
where F is a Fourier factor defined as F = μ / ( 2 π ) for the bump wavelet.

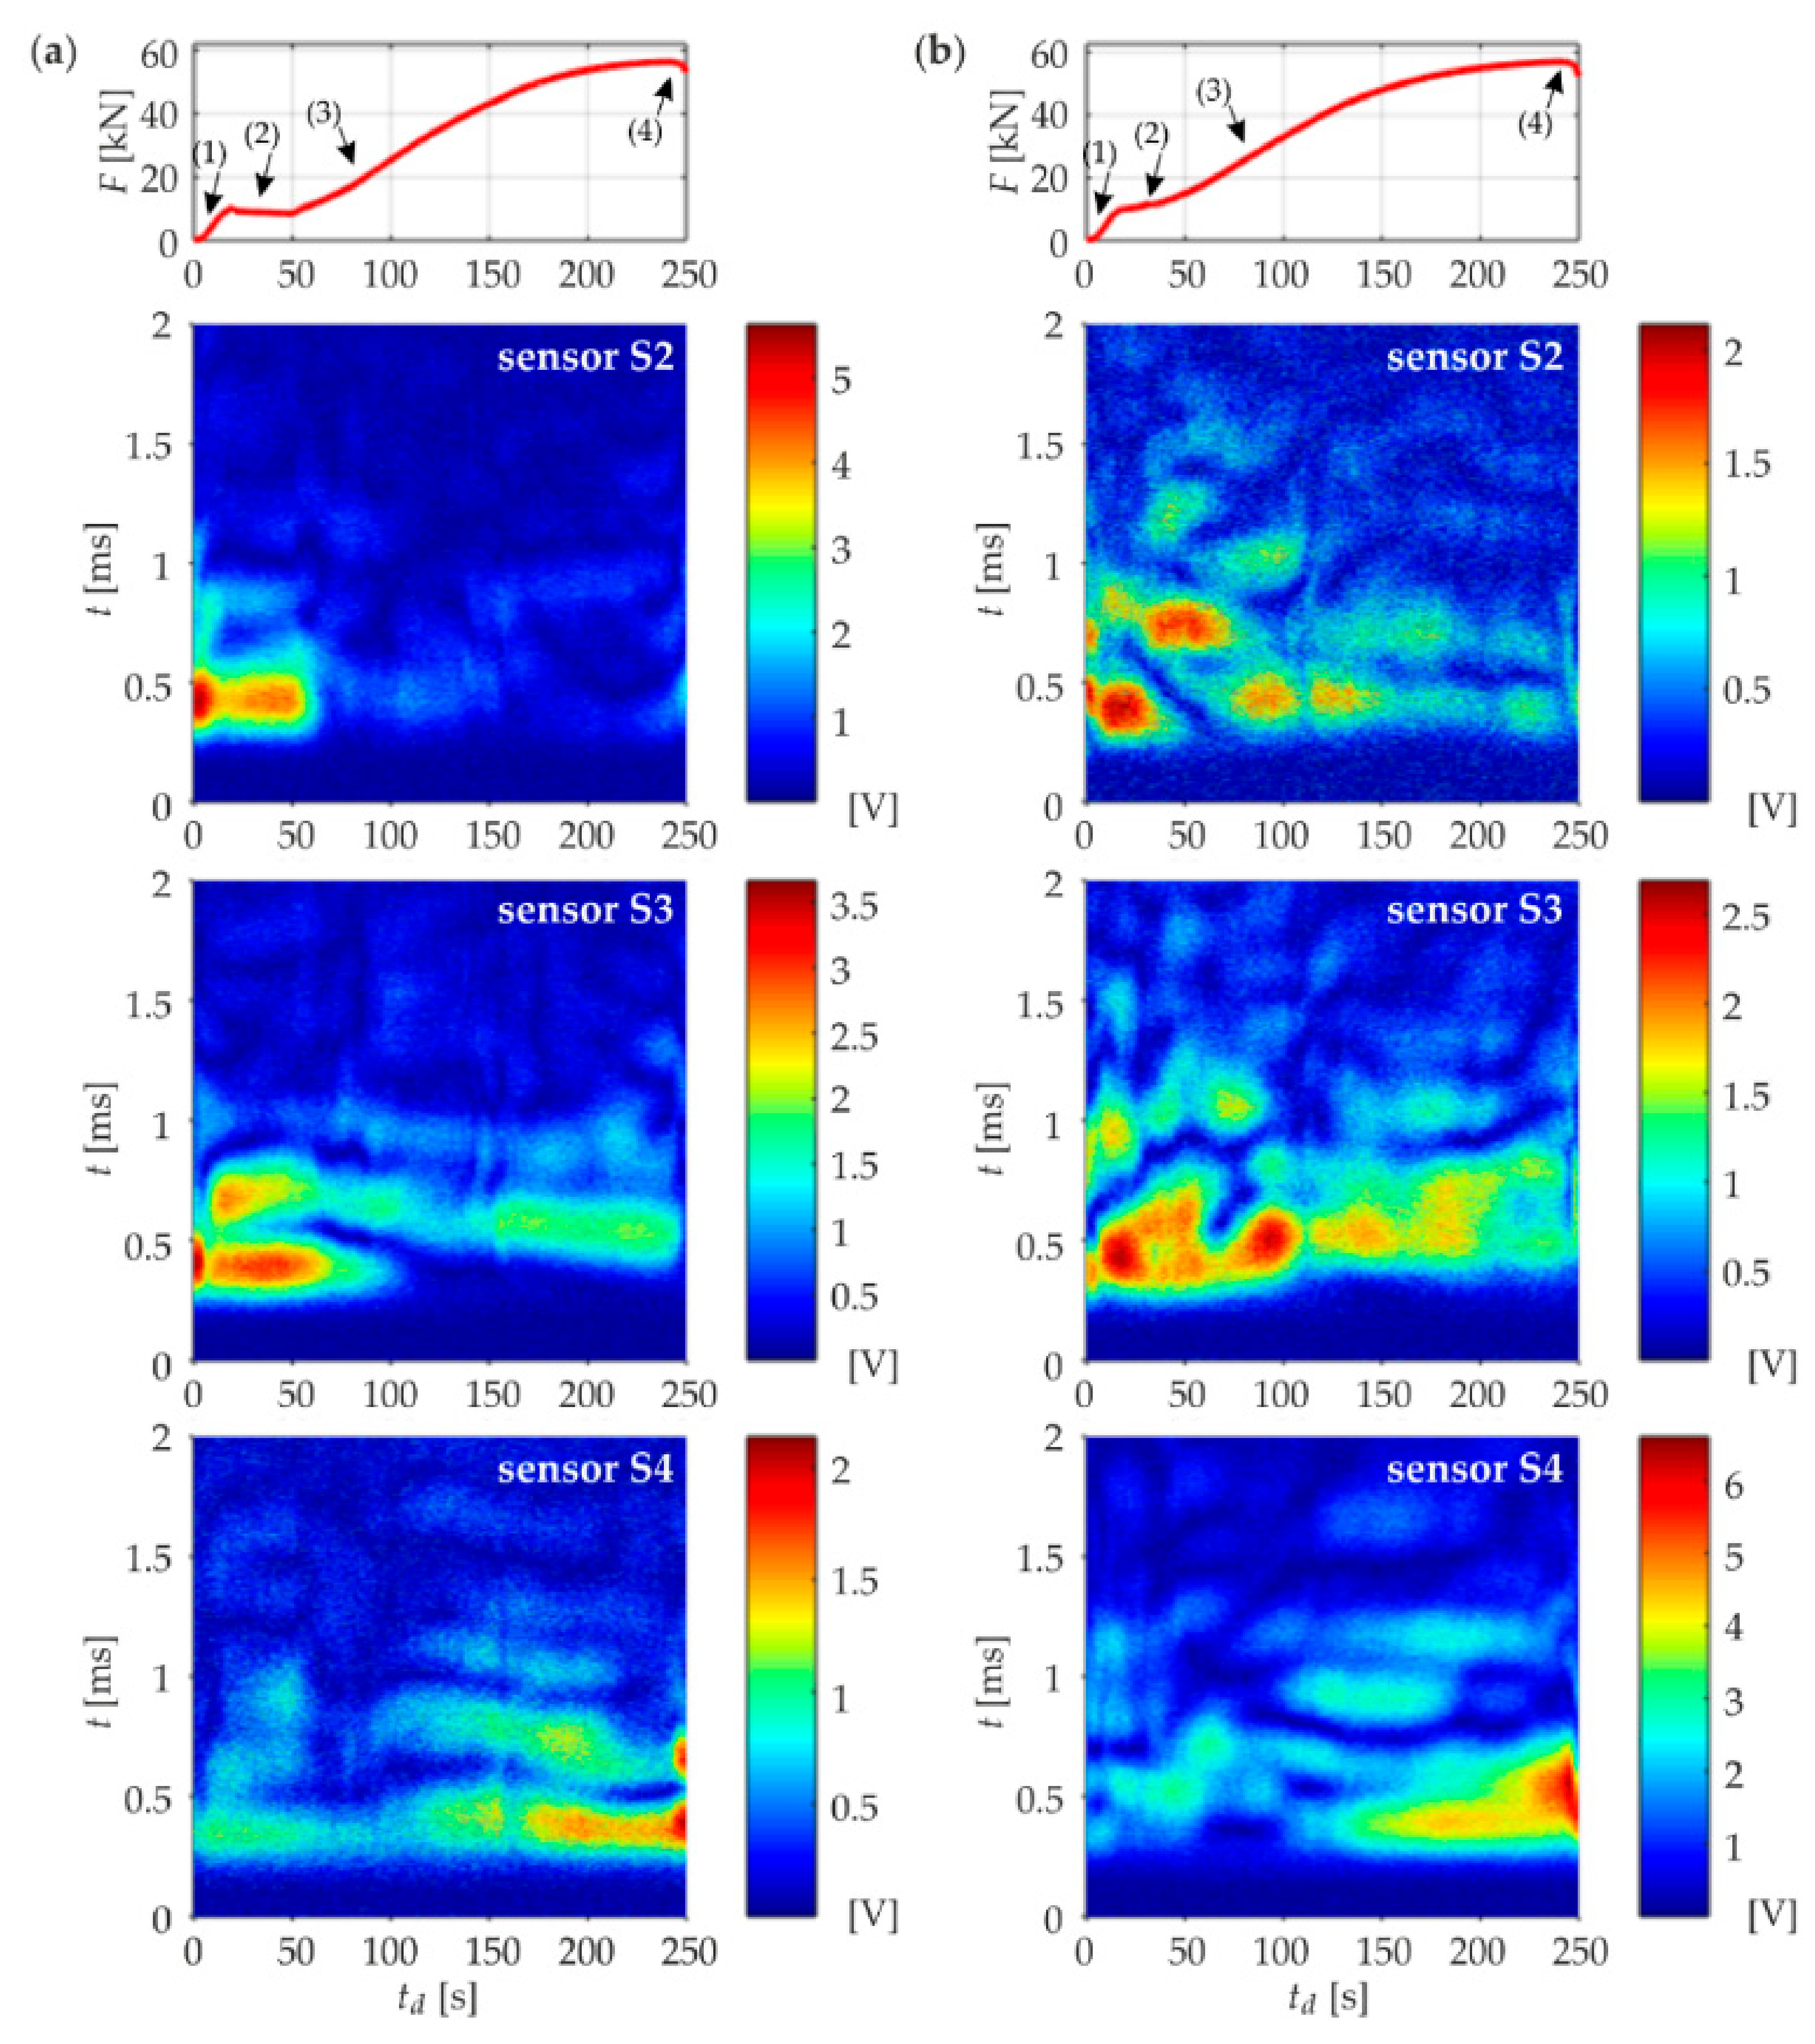
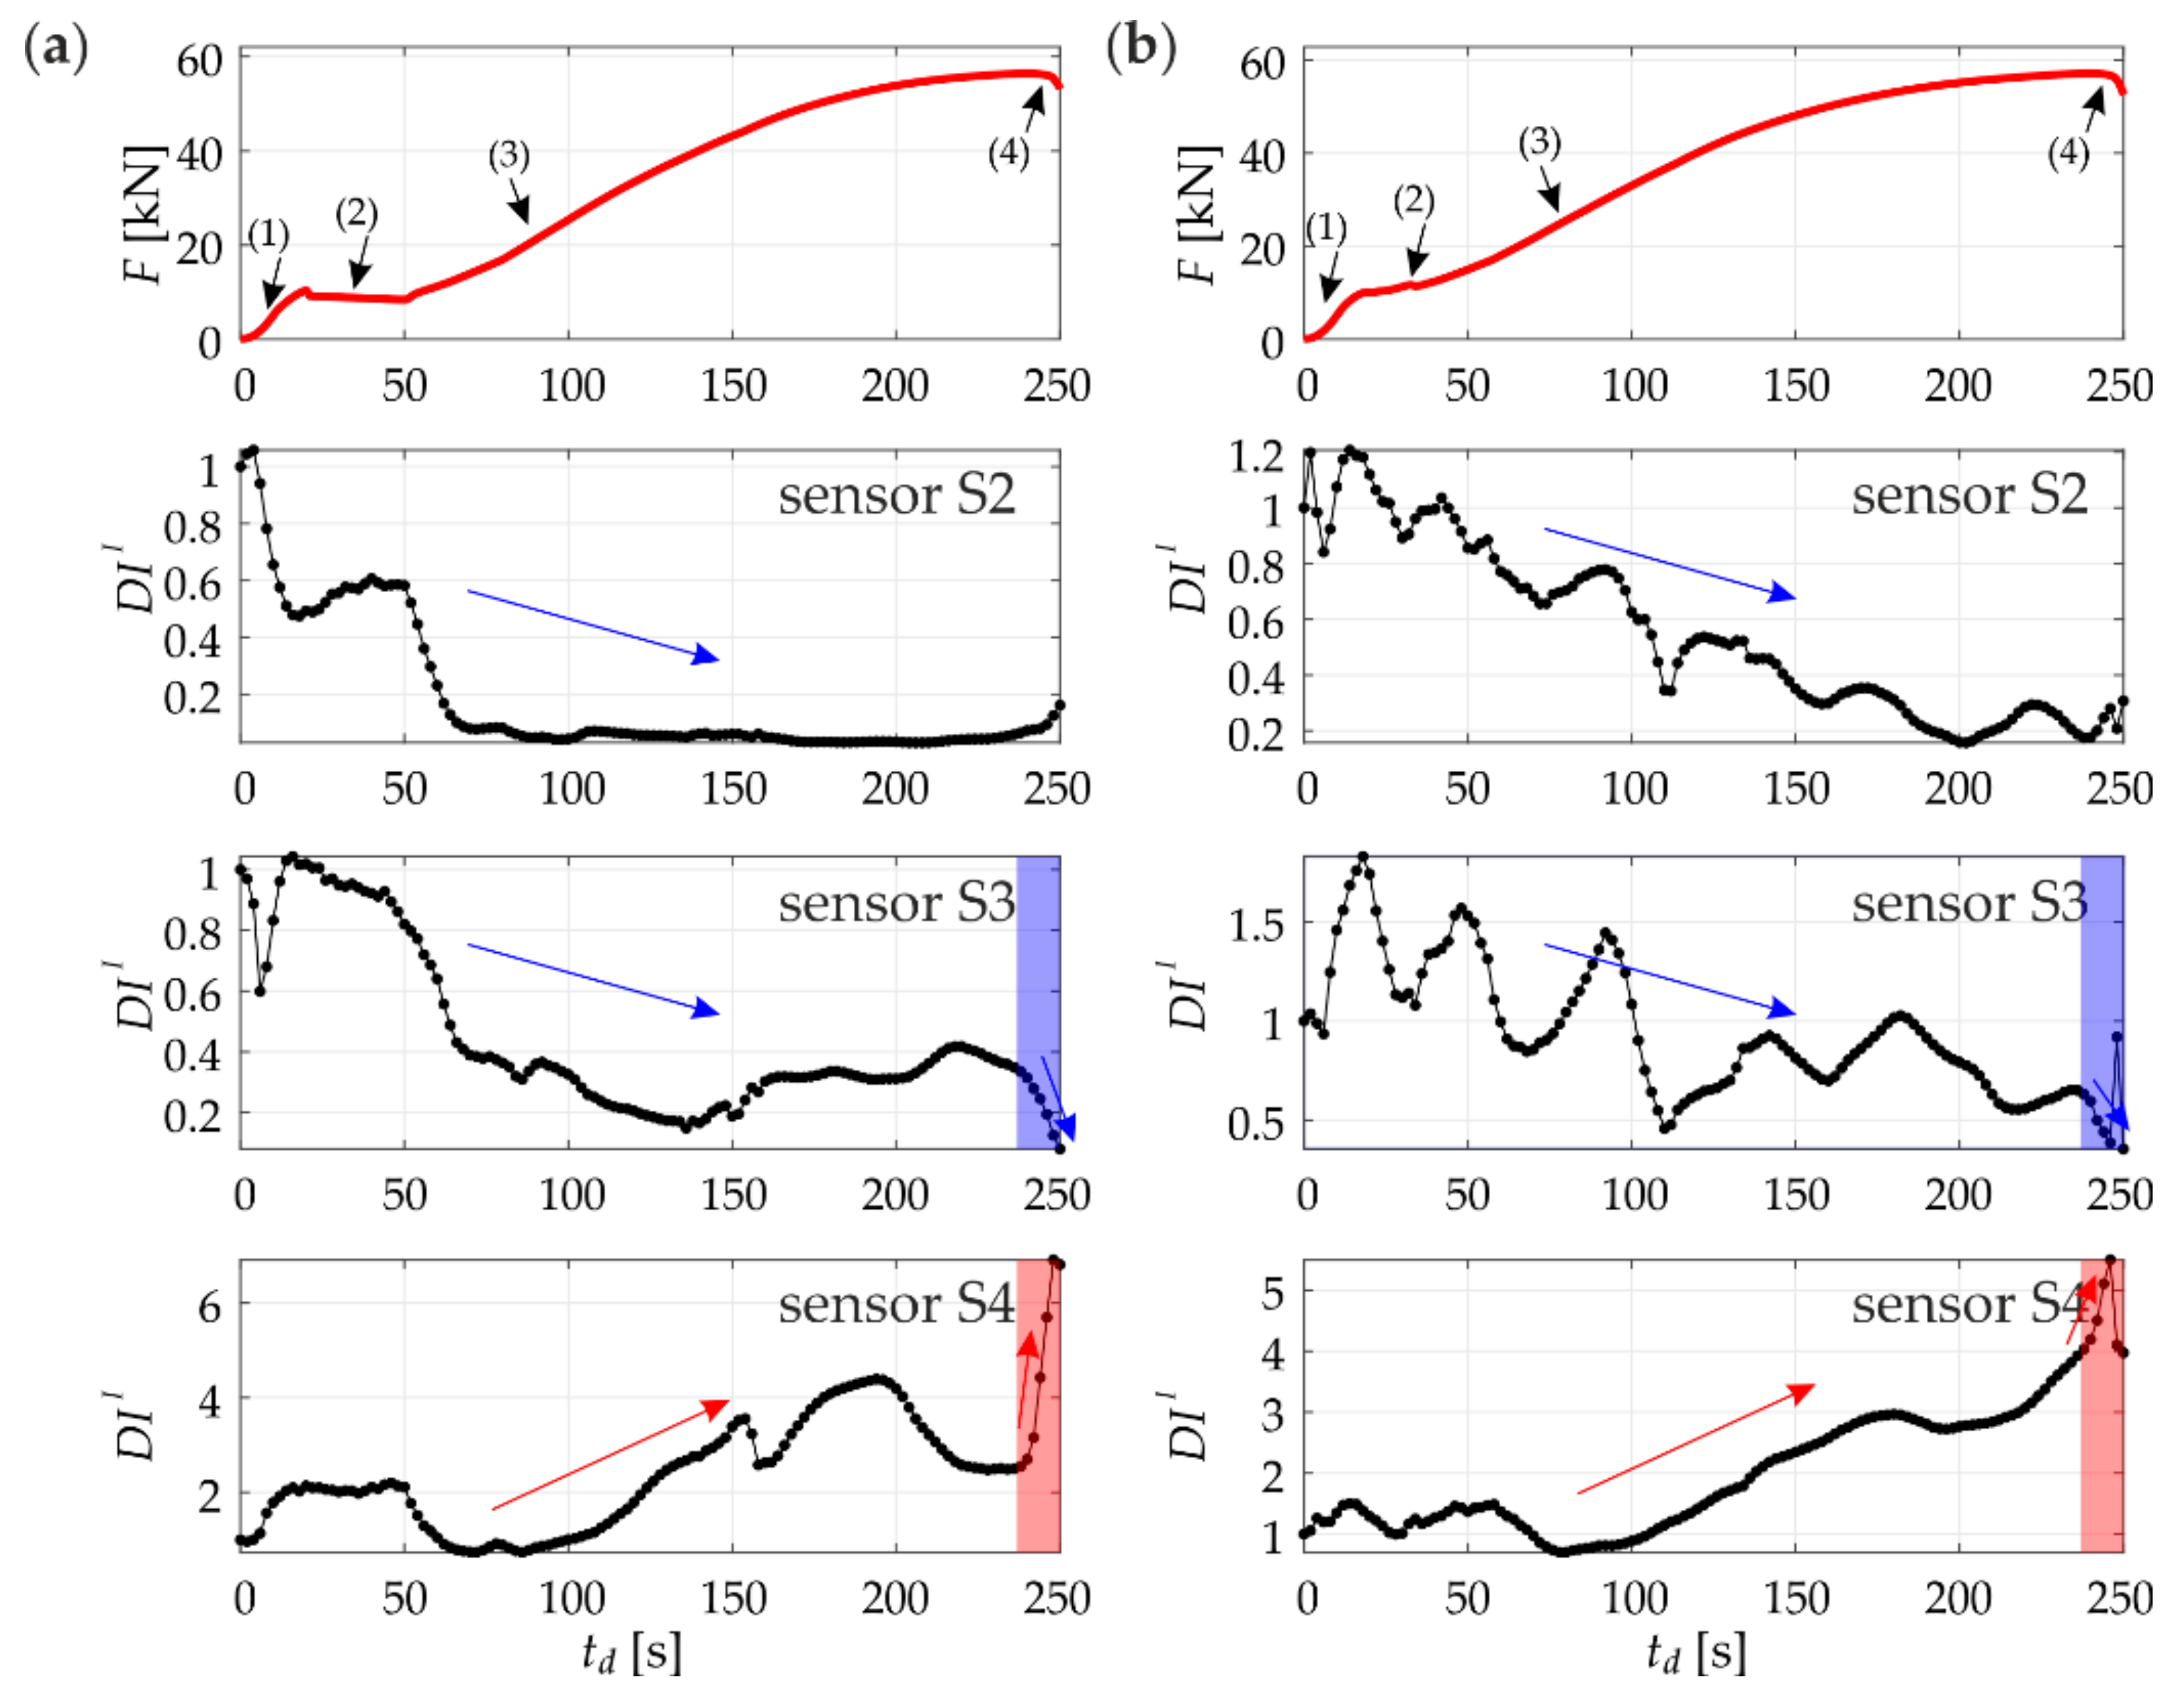
3. Results and Discussion

3.1. Tensile Tests and Failure Modes

Monotonic tensile tests were conducted on two specimens (denoted as #1 and #2) until failure. Figure 3 shows the force-displacement curves for both joints. The shape of the curves is similar. The maximum displacements of the cross-head (u) were 8.215 mm and 8.196 mm for joint #1 and joint #2, while the maximum forces (F) were 56.448 kN and 57.070 kN, respectively. In addition, in the case of joint #2, the relative displacements ( u x and u y ) between the plates in the overlap region were measured using the optical technique. The resulting displacements in x and y directions are shown in Figure 4. The displacement along the y-axis was nearly identical at each of the measured levels and its maximum value was 5.8 mm. In contrast, the displacement in the x direction varied for each level. In the case of upper (L1) level and lower (L3) level, the measured values indicated that the plates moved apart from each other. The maximum value of displacement was 0.9 mm for the upper level and 0.7 mm for the lower level. The displacement of the central level (L2) oscillated around zero and its maximum value was −0.2 mm.
Some characteristic stages can be distinguished on the load-displacement curves during the tensile process (cf. [40,41,42]). Four stages were indicated in Figure 3: (1) slip resistance stage (td = 0–20 s); (2) slip stage (td = 20–50 s); (3) bearing stage (td = 50–240 s), including (3a) elastic deformation and (3b) plastic deformation; and, finally, (4) failure stage (td = 240–250 s) [40,41]. At the first phase of loading, the tested connection behaved as a slip-resistant (friction-type) joint. The applied tensile loading was transferred by friction between contact areas of the plates fastened by the bolt until the slip frictional resistance was achieved. Next, a major slip occurred between the plates until the movement of the connected elements was prevented by the bolt. From that moment, the connection became a bearing-type joint and the load was mainly transferred by means of bearing between the plates and the bolt, and shearing within the bolt. In the bearing stage, initially quasi-elastic deformation of the bolt and plates was created. Next, the plastic deformation and finally the failure stage occurred [41,42].
Figure 5 presents the joints in the testing machine at the stage just before (i.e., 10 s) failure (I) and after failure (II). It can be seen that the connection failed due to the bolt shear. The plates and fasteners after removal from the testing machine are shown in Figure 6. For both joints, the same damage scheme occurred. During the plastic deformation stage, bearing yield occurred in both the plate and bolt and, finally, the bolt was fractured.

3.2. Ultrasonic Tests

Figure 7 shows all wave propagation signals that were registered during the tensile tests. For better visibility, the time histories were plotted as signal envelopes obtained with the use of the Hilbert transform. Particular signals registered for two specimens differ considerably, even a though similar global behavior was observed in the mechanical tests with almost the same maximum force and maximum displacement (see Figure 3). This discrepancy is caused mainly by the initial part of the tensile process, where the slip stage had a different course. After the slip between the connected plates, the contact area and the contact stiffness of the bolted interfaces may be reduced due to the loss of the bolt preload [43,44]. In both specimens, such micro-scale changes at the interface areas could occur in a different way. Since ultrasonic waves are very sensitive to changes caused by reductions in acoustic coupling, the signals are not exactly repeatable.
Despite these differences, similar trends in the maps of the signals illustrated in Figure 7 can be observed. For both joints, the changes in the time-of-flights (TOFs) are visible. They resulted from both the acoustoelastic effect [45,46,47] and the relative movement between the connected elements in the horizontal direction within the overlap area; however, the latest condition was dominant in this research. This effect is particularly noticeable for signals registered by sensors S2 and S3 where the significant increase in the TOF occurred after td = 100 s. The changes in the amplitude values are also visible. In the case of the signals acquired by sensors S2 and S3, there was a high voltage activity at the beginning of the degradation process, i.e., between td = 0 s and td = 50 s for specimen #1, and between td = 0 s and td = 100 s for specimen #2. The amplitudes of these signals decreased with degradation time. On the other side, the signals registered by sensor S4 were characterized by the growing of the amplitude with a progressive state of damage (between td = 100 s and td = 250 s). These time-of-flight and amplitude effects were caused mainly by the reduction of the contact area in the region of the overlap resulting in the increase of the energy dissipation. Comparing with Figure 4 it can be seen that from td = 100 s the optically-measured displacements between plates in the horizontal direction at levels L1 and L3 significantly increased and gaps appeared at both ends of the overlap.
To quantify the differences between Lamb wave signals captured for different stages of the degradation process, the damage index D I I based on the energy ratio was introduced:
D I I = ( E ) i ( E ) 1
where ( E ) i denotes the energy of the current Lamb wave signal x i ( i = 1 , 2 , , n , where n = 126 is the number of registered signals) and ( E ) 1 is the energy of the first (i.e., baseline) signal ( i = 1 ). The energy was calculated according to Equation (1). Figure 8 presents the D I I for each measured signal. For sensors S2 and S3, attached to the top plate, the decrease of the energy ratio was observed. In the case of specimen #1, the decrease occurred suddenly after the slip stage. In the case of specimen #2, where the slip stage was not so clear, the decrease rate was lower; however, it was still noticeable. An opposite trend occurred for the energy of guided waves registered by sensor S4, attached to the bottom plate. Initially, the energy was almost constant (clearly indicating the slip stage in both joints, from td = 20 s to td = 50 s), and a gradual increase was subsequently noticed in the bearing stage. The wave propagation in the bearing stage is determined mainly by the reduction of the acoustic coupling between plates in the region of the overlap. It can be seen in Figure 4 and Figure 5 that the plates moved apart from each other, resulting in a decrease in the contact area. As a result, with a progressive state of damage, less signal energy was transmitted into the top plate, causing the waves to propagate mainly in the bottom plate. Additionally, the rapid change of the D I I (the growth of signals registered by sensor S4 and the reduction of signals registered by sensor S3) can be seen in the last stage of the tensile test. It was highlighted in Figure 8 in blue and red areas, from td = 240 s to td = 250 s. This feature may indicate the pre-failure stage, just before the bolt fracture occurred.
Next, the nonlinear ultrasonic method was applied. To characterize the state of health of the joint, the phenomenon of the higher harmonic generation was utilized. Figure 9a shows the time-frequency representation of the exemplary Lamb wave signal. It can be seen that, beside the fundamental frequency component, the higher harmonic appeared. The relative acoustic nonlinearity parameter can be defined as a ratio of the second harmonic amplitude A 2 to the squared first harmonic amplitude A 1 (e.g., [48,49]):
β = A 2 A 1 2
The amplitudes of the first and second harmonics were extracted by means of the coefficients of the continuous wavelet transform (Figure 9b,c):
A 1 = k = 1 N | W ( t k , f = f c ) |
A 2 = k = 1 N | W ( t k , f = 2 f c ) |
where N denotes the number of elements in the registered signal and f c is the central frequency of the excited wave, i.e., 100 kHz.
Finally, the second damage index D I I I was defined as follows:
D I I I = ( β ) i ( β ) 1
where ( β ) i denotes the acoustic nonlinearity parameter of the current Lamb wave signal and ( β ) 1 is the acoustic nonlinearity parameter of the baseline signal. The damage index D I I I is plotted for each data acquisition step in Figure 10. At the beginning of the loading, the D I I I was almost flat enabling the identification of the slip stage. It is can be also seen that the nonlinearity parameter increased in the case of the signals registered by sensors S2 and S3, situated on the top plate. This is because, as a result of the degradation process, different sources of nonlinearity occurred in the overlap area (i.e., contact-type defects, bearing yield of the plate, as well as the yielding and subsequent fracture of the bolt), and the influence of the nonlinearity increased with progressive damage. Particularly interesting is the D I I I for the signals captured by sensor S4, localized at the beginning of the overlap area (on the bottom plate). It revealed a large zone (highlighted in green in Figure 10) at the end of the degradation process (during the bearing stage, from td = 120 s for specimen #1 and td = 110 s for specimen #2) where the values of the nonlinearity parameter were about 60% of the maximum value. Such a decrease of nonlinearity was caused by the fact that the bottom plate tended to separate.

4. Conclusions

In this paper, a feasibility study of the application of the Lamb wave-based method for the inspection of bolted joint integrity was presented. The effect of the monotonic tensile load on the characteristics of guided waves was investigated experimentally. Utilizing both linear and nonlinear features of Lamb waves, two damage indices were defined.
In the research, one actuator and three sensors were used. It was not possible to obtain the information about the condition state of the joint from a single sensor. The use of multiple piezoelectric transducers in combination with damage indices enabled monitoring of different stages of the degradation process. It was found that the sensors should be situated on both connected elements. Such an arrangement of sensors made it possible to control the energy of the transmitted and reflected waves.
The damage process of tension-bolted joints was very complex, including contact-type defects (i.e., slip and reduction of the contact area between plates), bearing yield of the plate, the yielding and fracture of the bolt. The identification of particular damage sources was not possible; however, some of the stages of degradation could be indicated. First, the slip stage was identified. The reduction in acoustic coupling between plates was also detected using both linear and nonlinear features of Lamb waves. In the case of the linear damage index, a simultaneous gradual increase in the signal energy at one sensor and a decrease at the other was observed. Considering the nonlinear damage index, the zone with the smaller value of the nonlinearity parameter was found at the end of the degradation process on the plate to which the actuator was attached. Additionally, the pre-failure stage was indicated. The energy-based index revealed rapid growth just before the bolt fracture occurred, providing a possible prediction of incoming failure.
The results obtained in this paper revealed the potential of guided waves to monitor bolted joints. However, the presented research is merely preliminary and further experimental studies should be conducted to verify the reliability of the proposed methodology, including an examination of the effects of temperature, various excitation signals and different failure modes on the Lamb wave patterns.

Funding

The author would like to acknowledge the National Science Centre, Poland for the support for this research within project No. 2015/19/B/ST8/00779.

Acknowledgments

The help of Rafał Kedra, Eugeniusz Lilla, and Erwin Wojtczak during the preparation of bolted specimens is also gratefully acknowledged.

Conflicts of Interest

The author declares no conflict of interest.

References

  1. Jiang, Y.Y.; Zhang, M.; Lee, C.H. A Study of Early Stage Self-Loosening of Bolted Joints. J. Mech. Des. 2003, 125, 518–526. [Google Scholar] [CrossRef]
  2. Álvarez, J.A.; Lacalle, R.; Arroyo, B.; Cicero, S.; Gutiérrez-Solana, F. Failure Analysis of High Strength Galvanized Bolts Used in Steel Towers. Metals 2016, 6, 163. [Google Scholar] [CrossRef]
  3. Hoang, T.D.; Herbelot, C.; Imad, A. On failure mode analysis in a bolted single lap joint under tension-shearing. Eng. Fail. Anal. 2012, 24, 9–25. [Google Scholar] [CrossRef]
  4. Heimbs, S.; Schmeer, S.; Blaurock, J.; Steeger, S. Static and dynamic failure behaviour of bolted joints in carbon fibre composites. Compos. Part A Appl. Sci. Manuf. 2013, 47, 91–101. [Google Scholar] [CrossRef]
  5. Wang, Y.B.; Lyu, Y.F.; Li, G.Q.; Liew, J.Y.R. Behavior of single bolt bearing on high strength steel plate. J. Constr. Steel Res. 2017, 137, 19–30. [Google Scholar] [CrossRef]
  6. Park, J.H.; Huynh, T.C.; Choi, S.H.; Kim, J.T. Vision-based technique for bolt-loosening detection in wind turbine tower. Wind Struct. 2015, 21, 709–726. [Google Scholar] [CrossRef]
  7. Cha, Y.J.; You, K.; Choi, W. Vision-based detection of loosened bolts using the Hough transform and support vector machines. Autom. Constr. 2016, 71, 181–188. [Google Scholar] [CrossRef]
  8. Kong, X.; Li, J. Image registration-based bolt loosening detection of steel joints. Sensors 2018, 18, 1000. [Google Scholar] [CrossRef] [PubMed]
  9. Park, G.; Sohn, H.; Farrar, C.R.; Inman, D.J. Overview of Piezoelectric Impedance-Based Health Monitoring and Path Forward. Shock Vib. Dig. 2003, 35, 451–463. [Google Scholar] [CrossRef]
  10. Park, S.; Shin, H.H.; Yun, C.B. Wireless impedance sensor nodes for functions of structural damage identification and sensor self-diagnosis. Smart Mater. Struct. 2009, 18, 055001. [Google Scholar] [CrossRef]
  11. Perera, R.; Pérez, A.; García-Diéguez, M.; Zapico-Valle, J.L. Active Wireless System for Structural Health Monitoring Applications. Sensors 2017, 17, 2880. [Google Scholar] [CrossRef] [PubMed]
  12. Zadoks, R.I.; Yu, X. An investigation of the self-loosening behavior of bolts under transverse vibration. J. Sound Vib. 1997, 208, 189–209. [Google Scholar] [CrossRef]
  13. Huda, F.; Kajiwara, I.; Hosoya, N.; Kawamura, S. Bolt loosening analysis and diagnosis by non-contact laser excitation vibration tests. Mech. Syst. Signal Process. 2013, 40, 589–604. [Google Scholar] [CrossRef] [Green Version]
  14. Yang, J.; Chang, F.K. Detection of bolt loosening in C–C composite thermal protection panels: I. Diagnostic principle. Smart Mater. Struct. 2006, 15, 581–590. [Google Scholar] [CrossRef]
  15. Yang, J.; Chang, F.K. Detection of bolt loosening in C–C composite thermal protection panels: II. Experimental verification. Smart Mater. Struct. 2006, 15, 591–599. [Google Scholar] [CrossRef]
  16. Park, S.; Yun, C.B.; Roh, Y.; Lee, J.J. PZT-based active damage detection techniques for steel bridge components. Smart Mater. Struct. 2006, 15, 957–966. [Google Scholar] [CrossRef]
  17. Amerini, F.; Meo, M. Structural health monitoring of bolted joints using linear and nonlinear acoustic/ultrasound methods. Struct. Heal. Monit. 2011, 10, 659–672. [Google Scholar] [CrossRef]
  18. Wang, T.; Song, G.; Wang, Z.; Li, Y. Proof-of-concept study of monitoring bolt connection status using a piezoelectric based active sensing method. Smart Mater. Struct. 2013, 22, 087001. [Google Scholar] [CrossRef]
  19. Parvasi, S.M.; Ho, S.C.M.; Kong, Q.; Mousavi, R.; Song, G. Real time bolt preload monitoring using piezoceramic transducers and time reversal technique—A numerical study with experimental verification. Smart Mater. Struct. 2016, 25, 085015. [Google Scholar] [CrossRef]
  20. Kędra, R.; Rucka, M. Damage detection in a bolted lap joint using guided waves. Procedia Eng. 2017, 199, 2114–2119. [Google Scholar] [CrossRef]
  21. An, Y.K.; Sohn, H. Integrated impedance and guided wave based damage detection. Mech. Syst. Signal Process. 2012, 28, 50–62. [Google Scholar] [CrossRef]
  22. Sevillano, E.; Sun, R.; Perera, R. Damage detection based on power dissipation measured with PZT sensors through the combination of electro-mechanical impedances and guided waves. Sensors 2016, 16, 639. [Google Scholar] [CrossRef] [PubMed]
  23. Moradi-Marani, F.; Rivard, P.; Lamarche, C.P.; Kodjo, S.A. Evaluating the damage in reinforced concrete slabs under bending test with the energy of ultrasonic waves. Constr. Build. Mater. 2014, 73, 663–673. [Google Scholar] [CrossRef]
  24. Shui, G.; Wang, Y.S.; Huang, P.; Qu, J. Nonlinear ultrasonic evaluation of the fatigue damage of adhesive joints. NDT E Int. 2015, 70, 9–15. [Google Scholar] [CrossRef]
  25. Omondi, B.; Aggelis, D.G.; Sol, H.; Sitters, C. Improved crack monitoring in structural concrete by combined acoustic emission and digital image correlation techniques. Struct. Heal. Monit. 2016, 15, 359–378. [Google Scholar] [CrossRef]
  26. Rucka, M. Failure Monitoring and Condition Assessment of Steel-Concrete Adhesive Connection Using Ultrasonic Waves. Appl. Sci. 2018, 8, 320. [Google Scholar] [CrossRef]
  27. Cho, H.; Lissenden, C.J. Structural health monitoring of fatigue crack growth in plate structures with ultrasonic guided waves. Struct. Heal. Monit. 2012, 11, 393–404. [Google Scholar] [CrossRef]
  28. Yang, B.; Xuan, F.Z.; Xiang, Y.; Li, D.; Zhu, W.; Tang, X.; Xu, J.; Yang, K.; Luo, C. Lamb Wave-Based Structural Health Monitoring on Composite Bolted Joints under Tensile Load. Materials 2017, 10, 652. [Google Scholar] [CrossRef] [PubMed]
  29. Giurgiutiu, V. Structural Health Monitoring with Piezoelectric Wafer Active Sensors; Elsevier/Academic Press: Burlington, VT, USA, 2008; pp. 1–747. ISBN 9780120887606. [Google Scholar]
  30. Wang, D.; Song, H.; Zhu, H. Numerical and experimental studies on damage detection of a concrete beam based on PZT admittances and correlation coefficient. Constr. Build. Mater. 2013, 49, 564–574. [Google Scholar] [CrossRef]
  31. Hu, X.; Zhu, H.; Wang, D. A study of concrete slab damage detection based on the electromechanical impedance method. Sensors 2014, 14, 19897–19909. [Google Scholar] [CrossRef] [PubMed]
  32. Gu, H.; Moslehy, Y.; Sanders, D.; Song, G.; Mo, Y.L. Multi-functional smart aggregate-based structural health monitoring of circular reinforced concrete columns subjected to seismic excitations. Smart Mater. Struct. 2010, 19, 065026. [Google Scholar] [CrossRef]
  33. Karayannis, C.G.; Voutetaki, M.E.; Chalioris, C.E.; Providakis, C.P.; Angeli, G.M. Detection of flexural damage stages for RC beams using Piezoelectric sensors (PZT). Smart Struct. Syst. 2015, 15, 997–1018. [Google Scholar] [CrossRef]
  34. Chalioris, C.E.; Karayannis, C.G.; Angeli, G.M.; Papadopoulos, N.A.; Favvata, M.J.; Providakis, C.P. Applications of smart piezoelectric materials in a wireless admittance monitoring system (WiAMS) to Structures-Tests in RC elements. Case Stud. Constr. Mater. 2016, 5, 1–18. [Google Scholar] [CrossRef]
  35. Karayannis, C.G.; Chalioris, C.E.; Angeli, G.M.; Papadopoulos, N.A.; Favvata, M.J.; Providakis, C.P. Experimental damage evaluation of reinforced concrete steel bars using piezoelectric sensors. Constr. Build. Mater. 2016, 105, 227–244. [Google Scholar] [CrossRef]
  36. Voutetaki, M.E.; Papadopoulos, N.A.; Angeli, G.M.; Providakis, C.P. Investigation of a new experimental method for damage assessment of RC beams failing in shear using piezoelectric transducers. Eng. Struct. 2016, 114, 226–240. [Google Scholar] [CrossRef]
  37. Mallat, S. A Wavelet Tour of Signal Processing: The Sparse Way; Elsevier/Academic Press: Burlington, VT, USA, 2009; pp. 1–805. ISBN 9780123743701. [Google Scholar]
  38. Lilly, J.M.; Olhede, S.C. Higher-order properties of analytic wavelets. IEEE Trans. Signal Process. 2009, 57, 146–160. [Google Scholar] [CrossRef]
  39. Misiti, M.; Misiti, Y.; Oppenheim, G.; Poggi, J.M. Wavelet Toolbox Reference, MATLAB; The MathWorks, Inc.: Natick, MA, USA, 2018; pp. 1–1312. [Google Scholar]
  40. Lu, C.; Ou, Y.; Ma, X.; Mills, J.E. Structural Analysis of Lattice Steel Transmission Towers: A Review. J. Steel Struct. Constr. 2016, 2, 1–11. [Google Scholar] [CrossRef]
  41. Bickford, J.H. Introduction to the Design and Behavior of Bolted Joints (4th Edition)-Non-Gasketed Joints; CRC Press/Taylor & Francis Group: Boca Raton, FL, USA, 2008; pp. 1–515. ISBN 0-8493-8176-2. [Google Scholar]
  42. Kulak, G.L.; Fisher, J.W.; Struik, J.H.A. Guide to Design Criteria for Bolted and Riveted Joints; American Institute of Steel Construction, Inc.: Chicago, IL, USA, 1988; pp. 1–333. ISBN 0471837911. [Google Scholar]
  43. Pai, N.G.; Hess, D.P. Experimental study of loosening of threaded fasteners due to dynamic shear loads. J. Sound Vib. 2002, 253, 585–602. [Google Scholar] [CrossRef]
  44. Liu, J.; Ouyang, H.; Feng, Z.; Cai, Z.; Liu, X.; Zhu, M. Study on self-loosening of bolted joints excited by dynamic axial load. Tribol. Int. 2017, 115, 432–451. [Google Scholar] [CrossRef]
  45. Egle, D.M.; Bray, D.E. Measurement of acoustoelastic and third-order elastic constants for rail steel. J. Acoust. Soc. Am. 1976, 60, 741–744. [Google Scholar] [CrossRef]
  46. Chaki, S.; Bourse, G. Stress level measurement in prestressed steel strands using acoustoelastic effect. Exp. Mech. 2009, 49, 673–681. [Google Scholar] [CrossRef]
  47. Shui, G.; Wang, Y.S.; Gong, F. Evaluation of plastic damage for metallic materials under tensile load using nonlinear longitudinal waves. NDT E Int. 2013, 55, 1–8. [Google Scholar] [CrossRef]
  48. Jhang, K.Y. Nonlinear Ultrasonic Techniques for Non-destructive Assessment of Micro Damage in Material: A Review. Int. J. Precis. Eng. Manuf. 2009, 10, 123–135. [Google Scholar] [CrossRef]
  49. Radecki, R.; Su, Z.; Cheng, L.; Packo, P.; Staszewski, W.J. Modelling nonlinearity of guided ultrasonic waves in fatigued materials using a nonlinear local interaction simulation approach and a spring model. Ultrasonics 2018, 84, 272–289. [Google Scholar] [CrossRef] [PubMed]
Figure 1. Geometry of the investigated bolted joint with indicated locations of piezoelectric transducers: (a) plane view; (b) side view; and photographs of the joint with attached piezoelectric transducers for ultrasonic measurements (c) and markers for optical displacement measurements (d).
Metals 08 00683 g001
Figure 2. Test rig and instrumentation of the bolted joint under tensile loading for Lamb wave-based monitoring.
Metals 08 00683 g002
Figure 3. Force-displacement ( F u ) and force-time ( F t d ) curves of the tested joints (#1 and #2).
Metals 08 00683 g003
Figure 4. Relative displacements between the plates in joint #2.
Metals 08 00683 g004
Figure 5. Bolted joints in the testing machine (I: the stage just before failure and II: the stage after failure): (a) specimen #1; and (b) specimen #2.
Metals 08 00683 g005
Figure 6. Damage modes of the tested joints: (a) specimen #1; and (b) specimen #2.
Metals 08 00683 g006
Figure 7. Envelopes of wave propagation signals registered during the tensile tests: (a) specimen #1; and (b) specimen #2.
Metals 08 00683 g007
Figure 8. Damage index D I I for guided waves registered by sensors S2, S3, and S4 during tensile testing: (a) specimen #1; and (b) specimen #2.
Metals 08 00683 g008
Figure 9. Wavelet transform modulus of an exemplary signal registered during the monitoring process: (a) time-frequency representation; (b) continuous wavelet transform (CWT) coefficient related to the fundamental frequency; and (c) CWT coefficient related to the second harmonic component.
Metals 08 00683 g009
Figure 10. Damage index D I I I for guided waves registered by sensors S2, S3, and S4 during tensile testing: (a) specimen #1; and (b) specimen #2.
Metals 08 00683 g010

