Article

Non-Destructive Electrochemical Testing for Stainless-Steel Components with Complex Geometry Using Innovative Gel Electrolytes

by
Gleidys Monrrabal
1,
Blanca Ramírez-Barat
2,
Asunción Bautista
1,*,
Francisco Velasco
1 and
Emilio Cano
2
1
Materials Science and Engineering Department—IAAB, University Carlos III of Madrid, Leganés, 28911 Madrid, Spain
2
Department of Surface Engineering, Corrosion and Durability, National Center of Metallurgical Research (CENIM-CSIC), 28040 Madrid, Spain
*
Author to whom correspondence should be addressed.
Metals 2018, 8(7), 500; https://doi.org/10.3390/met8070500
Submission received: 6 June 2018 / Revised: 22 June 2018 / Accepted: 25 June 2018 / Published: 29 June 2018

Abstract

:
Corrosion can be a problem for stainless steels in chloride-containing or other aggressive environments, especially when they are formed as components with complex shapes. Monitoring the corrosion performance of the stainless steels during their in-service life is not always an easy task. Traditional electrochemical cells can be difficult to adapt to complex surfaces, and undesired crevices or liquid electrolyte leaks can occur. In the presented work, the possible use of non-destructive techniques with innovative gel electrolytes was investigated using portable cells. The electrolytes were based on agar (used as a gelling agent with ionic conductivity), glycerol (a plasticizer that improves adaptability to complex surfaces), and NaCl or KClO4 salts (which improve the conductivity and control the aggression of the tests). X-ray photoelectron spectroscopy (XPS) and Mott–Schottky analysis were carried out to obtain information about the influence of the electrolyte on the passive layer. The oxygen concentration and conductivity in the gels with various glycerol contents were compared to those in liquid electrolytes. Electrochemical impedance spectroscopy (EIS) measurements were carried out in liquids and gels. The performance of the gel cell on a stainless-steel component with a weld and complex shape was checked. The variation in the sensitivity of gels with and without chlorides to identify corrosion-susceptible regions was tested.

Graphical Abstract

1. Introduction

The corrosion resistance of stainless steels is already the subject of many studies. Their durability is related to a very thin and protective passive film formed on the metal, which comprises a mixture of iron and chromium oxides [1,2]. Their good corrosion resistance, combined with their good mechanical properties over an extremely wide range of temperatures [3], as well as their oxidation resistance at very high temperatures [4], and their ease of maintenance and low life-cycle cost make stainless steels one of the most widely used materials. Hence, stainless steels are often used for very diverse applications, resulting in the possible exposure to aggressive conditions that can compromise their durability. As a result, these materials can suffer problems such as localized attack, showing pitting [5], stress corrosion cracking [6], or crevice corrosion [7], sometimes in an unexpected way. In the often corrosion-prone occluded regions of complex-shaped components, the detection of the attack can be difficult [8], and the evaluation of its intensity becomes especially complex.
Local changes in the initial microstructure of the stainless steels and strain concentrations induced during the forming process [1,9], or the treatment of the surface [10], caused by the thermo-mechanical assembly of the components [11] or generated during service exposure [12], can decrease the passive film’s stability. Chromium carbide grain boundary precipitation (associated with sensitizing), as well as other undesired phase precipitation, can also be a problem for welded stainless-steel components [11,13]. The influence of improperly removed welding oxides is another problem that often appears and which cannot be ignored [14]. In conclusion, the initial corrosion performance of a stainless steel with a given composition can be locally modified by the forming, assembly, or working conditions, and it is necessary to optimize methods that are able to easily provide information on the possible changes in corrosion behavior.
Non-destructive electrochemical techniques can be used for the evaluation of corrosion resistance without affecting the natural development of the process. Electrochemical impedance spectroscopy (EIS) [15], electrochemical noise [16], transient analysis [17], and polarization resistance (Rp) measurements [18] are examples of well-known non-destructive electrochemical methods commonly used for laboratory studies.
There are also experimental studies about the use of non-destructive electrochemical techniques outside of the laboratory, in areas such as the calculation of corrosion rates of steel embedded in concrete structures [19]. However, obtaining information about the corrosion rate of stainless-steel components assembled into industrial machinery or exposed to the atmosphere is often not a simple task. The electrochemical testing of the non-flat, complex surfaces that real components frequently exhibit is difficult to achieve without their modification. Defining the surface under study is the main issue. Successfully fixing a conventional electrochemical cell over a region of the component can also be difficult. Leakage problems involving the electrolyte or generation of undesired crevices with the chosen fixing strategy are very likely to occur.
In recent years, the design of polymer electrolytes with electrochemical characteristics comparable to those of liquid ones became a very challenging endeavor for materials scientists [20] due to their interesting properties. Acceptable conductivity, good electrode–electrolyte contact, simple preparation, and good mechanical properties are some of their most attractive characteristics. Use of semi-solid rather than liquid electrolytes in fields such as energy storage in supercapacitors [21,22] and rechargeable lithium ion batteries is considered to be of great interest.
For corrosion studies, a semi-solid agar medium was used to replicate soil conditions for microbial-influenced attack of underground pipelines [23,24]. In the field of cultural heritage, a gel electrolyte was proposed to perform corrosion studies on metallic artefacts of archeological and historical interest [25,26]. The authors designed a portable cell based on the use of agar as a gelling agent [27]. Successful results were obtained for in situ EIS measurements on stainless-steel and bronze sculptures using this electrolyte [27]. Further recent research succeeded in improving the mechanical properties and adaptability of agar-based gel electrolytes by adding glycerol (which acts as a plasticizer) [28]. The first positive results regarding the usefulness of this cell for carrying out anodic polarization curves on stainless steels in chloride media were already reported [28].
Aiming to contribute to the corrosion monitoring of stainless-steel components with difficult angles and complex geometry, the presented work explored the viability of agar-glycerol electrolytes for carrying out non-destructive electrochemical measurements. Formulations with various salts and amounts of glycerol were considered to check the effect of the electrolyte composition. The performance of the portable cells was tested with measurements in samples in which using cells with liquid electrolytes for monitoring could be quite problematic.

2. Experiments

2.1. Materials

Technical CULTIMED agar, a 1.5% strength gel (with Nikan method) with 700–1100 g/cm3 density, was used to manufacture the electrolyte. Glycerol, NaCl, and KClO4 (all 99% purity) were used. All chemical reagents were purchased from Panreac (San Fernando de Henares, Spain).
Compositions of the gel electrolytes for the electrochemical studies were chosen with 0.5% (w/w) agar and glycerol percentages of 30%, 40%, and 50% (w/w). Previous research [28] showed that gels with plasticizer concentrations lower than 30% are unable to adapt to complex surfaces without cracking, while gels with plasticizer concentrations higher than 50% have problems curing in short times. Additionally, 0.5% NaCl or 1% KClO4 (w/w) were added in order to increase the ionic conductivity of the electrolyte. NaCl is commonly employed as a depassivating agent, and the selected concentration gave the electrolyte an adequate corrosivity for performing the corrosion studies [28]. On the other hand, KClO4 is a non-corrosive salt that increases the conductivity of the media. It was also used in other studies with agar-based electrolytes [29]. These reagents were dissolved in distilled water and heated up to 90 °C under magnetic stirring conditions. The mixtures were continuously stirred for 10 min, and then, they were allowed to cure for 1 h in a controlled environment, where the temperature and relative humidity conditions were kept at 20 °C and 80%, respectively. More information about the gel manufacturing process can be found in a previous publication [28]. Liquid solutions with 0.5% (w/w) NaCl or 1% (w/w) KClO4 were also used as a reference.
Two-millimeter-thick AISI 304 stainless-steel sheets were employed for electrochemical studies on the influence of glycerol concentration and type of salt on the measurements. The composition (w/w) of the stainless steel was 18.66% Cr, 8.06% Ni, 1.82% Mn, 0.30% Si, 0.24% Cu, 1.9% Mo, 0.005% S, 0.048% N, 0.043% C, and Fe for the balance. The surface of the AISI 304 stainless steel was ground up to 600# using SiC paper before the measurements.
In addition to the studies on flat stainless-steel surfaces, the performance of the electrolyte was also checked in a component of an AISI 304 stainless-steel tank from a truck which was used for the transportation of alimentary fats and other products for years (Figure 1). The sample was chosen because it offered regions with complex geometry, a weld, and small pits and cracks in some regions generated during its in-service life; therefore, it presented diverse factors that would be predicted to affect its electrochemical behavior and that were not easy to monitor. The five different regions studied in this section were (a) the outer surface at a distance from the weld where no corrosion damage could be detected (Figure 1a); (b) the inner surface at a distance from the weld where few very small pits could be detected (Figure 1b); (c) the heat-affected zone (HAZ) of the inner surface, where small pits and cracks—probably caused by residual stresses from the welding had made them progress from small pits—could be observed (Figure 1b); (d) the weld at the outer surface (Figure 1a); and (e) the crevice formed between the welded parts, where oxides could be observed at its bottom (Figure 1a).

2.2. Methods

The amount of oxygen present in the studied electrolytes was determined by employing an Orion® Model 97-08 Dissolved Oxygen electrode (Thermo Orion Europe, Witchford, UK). It consisted of two polarized silver electrodes, one acting as a cathode and the other as an anode. The electrodes were immersed in a solution with chlorides, and were separated from the media by a gas-permeable membrane. The oxygen of the media diffused through the membrane and was reduced in the cathode, generating a current proportional to its concentration. The dissolved oxygen electrode was initially immersed in the hot liquid agar/glycerol mixtures with salts, and the gels were allowed to cure with the electrode embedded in them. The measurements of O2 solubility in the liquid electrolytes were performed without previous heating to reproduce the usual testing procedure. Three measurements were performed in each studied electrolyte.
Ionic conductivity of the eight gels (with the various chosen compositions) was determined at room temperature from impedance measurements carried out at high frequencies. The conductivity of the liquid electrolytes was measured using a conductivimeter (Crison Instruments, Alella, Spain), to help the inference in the results of the geometry of the big cell used to carry out the measurements in liquid electrolytes.
X-ray photoelectron spectroscopy (XPS) spectra were recorded using a Fisons MT500 spectrometer (Fison Instruments, East Grinstead, UK) fitted with a hemispherical electron analyzer (CLAM2) and a non-monochromatic Mg Kα X-ray source operating at 300 W (1253.6 eV). The samples were fixed on small flat discs supported on an XYZ manipulator placed in the analysis chamber. Residual pressure in this ion-pumped analysis chamber was maintained below 10−9 Torr during the data acquisition. The spectra were recorded at take-off angles of 90° and a pass energy of 20 eV, which is typical of high-resolution conditions. High resolution spectra were acquired for Cr 2p, Fe 2p, and O 1s photoemission regions. The acquisition area during the measurements was approximately 1 mm2. Six representative electrolyte compositions were chosen in order to study, with XPS, their possible influence on the passive layer formed on the ground surfaces of the stainless steel. After exposures of 1 h to gel electrolytes made either of 0.5% agar or of 0.5% agar + 50% glycerol, and of either 0.5% NaCl or 1% KClO4, the surfaces of the sheets were studied. The surface of the stainless steel before and after 1 h of exposure to liquid electrolytes with 0.5% NaCl or 1% KClO4 was also analyzed for comparison. The binding energies of the obtained spectra were calibrated with reference to the main peak of the C 1s spectrum, at 285 eV. The Peakfit software (SeaSolve Software, Framingham, MA, USA) was employed to analyze the data. The fitting of peaks and their deconvolution in the components corresponding to the various chemical environments of the elements were carried out using Gauss–Lorentz functions, after the subtraction of a Shirley background.
The cell used for electrochemical measurements was based on a traditional three-electrode cell, but specially designed to be portable (Figure 1a). The cell was a modified version of the one proposed by Cano et al. [25]. This cell consisted of a two-piece methacrylate cylinder/cylindrical mold, with a reference electrode, and a counter-electrode (CE) fixed by a nylon screw. The gel electrolyte was cured inside the lowest part of the cell. The lowest part of the mold was removed to leave an exposed gel cylinder, which was placed onto the working electrode. During the measurements, the gel was determined as having a working area of approximately 2 cm2 on the component to be studied, for all the studied regions but the crevice. Inside the crevice, the lateral surfaces of the gel cylinder also wet the metal, and the measured surface was recalculated. A conventional cell with an exposed area of 0.50 cm2 of the working electrode was used for the measurements in liquid electrolyte. The reference electrode was always a saturated calomel electrode (SCE), and the CE was a stainless-steel coiled wire.
The open-circuit potential (OCP) was monitored for 45 min before the Mott–Schottky curves and the EIS measurements were carried out on the flat stainless-steel samples. On the other hand, as these measurements allowed checking that the OCP stabilization of the stainless steel in the gel was very fast, and with the aim of designing a faster monitoring procedure for the sample in Figure 1, the OCP was stabilized for 20 min before performing the electrochemical measurements.
The semiconductive properties of the passive film were determined by employing the Mott–Schottky approach. Non-corrosive electrolytes with KClO4 and various glycerol contents on the flat ground stainless-steel surfaces were used. The Mott–Schottky plots were obtained upon sweeping the potential from 0.6 V to −1.3 V vs. the SCE, at a frequency of 1 kHz. These studies must be carried out in an electrolyte where no corrosion takes place under anodic polarization; as such, gels and liquid solutions with KClO4 were employed.
EIS spectra were acquired at the OCP, over a frequency ranging from 10 kHz to 1 mHz, with five points per decade, and using 10 mVrms as a sinusoidal perturbation. The measurements lasted about 1 h. The impedance spectra were fitted using electrical equivalent circuits with the Zview software (Ametek, Berwyn, PA, USA). Electrolytes with NaCl and with KClO4—liquid solutions and gels with various glycerol contents—were tested on the flat ground AISI 304 sheets. Moreover, EIS measurements were also performed for each region under study defined for the part in Figure 1.
Each electrochemical measurement was repeated 3–4 times on the flat stainless-steel samples with each of the eight electrolytes considered in this part of the study. During the study of the sample in Figure 1, the measurements were repeated twice with each of the two selected electrolytes on the five surfaces defined for the study. In the final case, the size of the sample did not allow an increase in the multiplicity of the tests.

3. Results

3.1. Determination of Oxygen Content and Conductivity of the Electrolytes

There are properties of the gels that can meaningfully affect the corrosion or the passivation processes of the metals when they are exposed to such environments. The ability of the gels to dissolve oxygen [30], as well as their conductivity, can be considered key factors. The results obtained from the measurements of these parameters carried out in gels and in liquid electrolytes allow for a better understanding of the results obtained with other techniques.
When the gel was formulated with only agar and salt, its conductivity was quite similar to that measured for liquid solutions of similar saline concentrations (Table 1). This can be understood bearing in mind that the amount of agar added was much reduced. Moreover, agar comprises agarose, which is an effective gelling agent, and agaropectine, which has an ionic behavior that contributes to the conductivity [31]. The conductivity of the gels with plasticizer was somewhat lower than that of liquid electrolytes with similar amounts of dissolved salts. The component of the gel that caused this decrease seems to be the glycerol (conductivity of the gels with 30% glycerol were about double that of gels with 50% glycerol). However, the use of glycerol in the formulations was essential to improve the mechanical properties of the gels [28], and to provide the plasticity required for many of their planned final applications. Thus, plasticizer additions cannot be avoided for measurements on complex-shaped parts. The salts contributed to the conductivity, though no more than 1% KClO4 can be dissolved in gels with 50% glycerol. The results in Table 1 also prove that the effect on the conductivity of a given medium caused by the addition of 1% KClO4 was similar to that caused by the addition of 0.5% NaCl.
Figure 2 shows the comparative results obtained for the amounts of dissolved oxygen in gel electrolytes and in liquid electrolytes. It can be observed that gel electrolytes presented a lower ability of dissolving oxygen when compared with liquid electrolytes. In gels, the measured amounts of oxygen were roughly half those determined for liquid solutions. This decrease in O2 solubility seems to be mainly related to the presence of agar, as the increase in glycerol up to 50% did not significantly affect the values obtained for the O2 concentration. The salt added (0.5% NaCl or 1% KClO4) did not affect the results either. For passive stainless steels, this decrease in O2 concentration does not have a foreseeable effect on the corrosion kinetics, though it could exert some influence on active processes where the O2 reduction would be the controlling step.

3.2. Effect of the Electrolyte on the Chemical Composition and Electronic Properties of the Passive Film

The effect of the electrolytes on the chemical composition of the passive films formed on stainless steel was assessed using XPS. The results prove that the passive films on AISI 304 stainless steel are always composed of iron and chromium compounds. Figure 3 shows examples of the deconvolution carried out for the Cr 2p3/2, Fe 2p3/2, and O 1s peaks from the XPS spectra. The chromium peak (Figure 3a) was characterized by the presence of Cr(0) with a characteristic energy of 574.3 ± 0.2 eV, while Cr(III) as an oxide and Cr(III) as a hydroxide featured 576.4 ± 0.3 eV and 577.6 ± 0.2 eV, respectively [32]. The Fe 2p3/2 ionization spectrum was deconvoluted into four different contributions (Figure 3b). These contributions were assigned to the presence of Fe(0) with energies of 707.0 ± 0.2 eV, Fe(II) with 710.3 ± 0.2 eV, Fe(III) with 711.4 ± 0.2 eV, and a satellite of Fe(II) with 715.0 ± 0.2 eV [33]. As previously reported, an accurate discrimination among Fe(III) contributions from oxides, hydroxides, or oxihydroxides is a very difficult task [34]. The oxygen peak (Figure 3c) was deconvoluted into three components. The first component (corresponding to Fe and/or Cr oxides) was positioned at 530.0 ± 0.2 eV, the second component (corresponding to Fe and/or Cr hydroxides) was positioned at 531.7 ± 0.2 eV, and the third component (related to adsorbed water [18]) was positioned at 533.0 ± 0.2 eV.
Some informative results obtained from the XPS analysis are plotted in Figure 4 and Figure 5. The results from the air-formed passive layer on the initial ground stainless-steel surface were compared to those obtained after 1 h of exposure at room temperature to three different 0.5% agar-based electrolytes (with 0.5% NaCl, with 50% glycerol and 0.5% NaCl, and with 50% glycerol and 1% KClO4). The results obtained from the study of the passive layers formed in liquid electrolytes (0.5% NaCl and 1% KClO4) were also included in the figures.
Figure 4 shows the atomic ratio of the oxidized and elemental metals obtained from the areas of the Fe 2p and Cr 2p photoemission peaks from the passive layer. From this ratio, qualitative information related to the thickness of the passive layer can be worked out [2]. Obtained results suggest that the passive layers on surfaces in contact with the gel electrolytes presented relatively similar thicknesses, and were slightly thinner than the passive film corresponding to the initial steel. On the contrary, surfaces in contact with liquid electrolytes exhibited the thickest passive films. The thickness of the passive layer was especially high after being in contact with the NaCl liquid electrolyte. It seems that the oxide/hydroxide formation reactions were better promoted in liquid media when compared with the gels. This result could be related to the lower oxygen concentrations in the gels (Figure 2) that could limit the process of oxide formation on their surfaces.
The ratio between the oxides and hydroxides contained in the studied passive layers was calculated from the deconvolution of the oxygen peaks, and they are plotted in Figure 4. For all studied surfaces, the amounts of hydroxides detected were higher than those corresponding to the oxides. These ratios between hydroxides/oxides are often found for XPS studies of passive stainless steels [35], and they are clearly related to the higher sensitivity of the technique to the compounds comprising the outermost layers of the material. From the ratio of hydroxides to oxides, it can be deduced that gel electrolytes promoted the presence of hydroxides in the passive film. This could be related to the fact that the gels had a lower ability of dissolving oxygen, thus causing oxide formation (Figure 2).
Moreover, the amounts of Fe and Cr species in the passive layers are usually considered a good indicator of their protective nature [2]. In Figure 5, the relative amounts of Fe and Cr compounds in the oxide layer are plotted. The air-formed passive layer on the initial steel mainly comprised iron compounds. The Fe(III)/Fe(II) ratio was about 1, being compatible with the fact that the iron cations were mainly in the form of magnetite. Fe3O4 is traditionally assumed to be the most common iron oxide in the passive layers of stainless steels [34,36]. Exposure to the various tested electrolytes tended to decrease the Fe(II) percentage in the passive layer. This fact could perhaps suggest the presence of Fe2O3 in the passive layer [37]. However, in the case of the passive layer exposed to gel electrolytes, the formation of Fe(III) hydroxides was also highly probable, due to the high amount of hydroxyl anions detected (Figure 4). The Fe(III)/Fe(II) ratio that can be deduced from the results in Figure 5 was higher after gel exposure than after liquid exposure, which was coherent with a meaningful presence of Fe(III) hydroxides in the outer region of the passive layer after gel exposure. On the other hand, the Fe(III)/Fe(II) ratios that can be calculated from the results in Figure 5 were higher in electrolytes with NaCl than in electrolytes with KClO4, with the difference being more noticeable after liquid exposure. These results suggest that the higher aggression of the NaCl promoted a higher oxidation level of the iron cations.
The exposure to the studied electrolytes increased the chromium cation percentage in the passive layer. The increase in Cr(III) was related both to oxide and hydroxide compounds. The Cr(III) percentage did not differ significantly when considering gel and liquid electrolytes.
A relevant conclusion that can be drawn from the comparison of results in Figure 4 and Figure 5 corresponding to samples exposed to gels with NaCl (without glycerol and with 50% glycerol) is that the presence of glycerol in the gel did not change either the thickness or the chemical composition of the passive layer. Moreover, although the results showed that the contact of the metal with gel electrolytes produced a modification of passive layer, it needed to be very fast to be in accordance with the previously reported fast stabilization of OCP in gel electrolytes [28].
The protective ability of the passive films formed on stainless steels does not only depend on the chemical nature of the film, but also on their stoichiometry. The dopant density of the compounds forming the passive film plays an important role in corrosion resistance [1], and can help achieve a better understanding of the eventual performance of stainless steels in corrosive environments. The Mott–Schottky method is a valid tool to determine the dopant density (N) in the surface oxides. This approach assumes that the charge distribution at the semiconductor/solution interface is usually determined by measuring electrode capacitance (C), as a function of electrode potential [1,34]. N can be calculated from the slope of the plots of experimental C−2 versus E, using the following expression:
  1 C 2 = 2 ε ε 0 N ( E E F B k T e ) ,
where e is the electron charge (1.602 × 10⁻¹⁹ C), ε is the dielectric constant of the passive film (usually taken as 15.6 for oxides formed on stainless steel [13,16,17]), ε0 is the vacuum permittivity (8.854 × 10⁻¹⁴ F/cm), k is the Boltzmann constant (1.38 × 10⁻²³ J/K), T is the absolute temperature, and EFB is the flat-band potential. This expression can be used for the calculation of donor densities (Nd), as well as of acceptor densities (Na).
Representative results from the curves obtained for the Mott–Schottky analysis of the studied gel electrolytes are shown in Figure 6. A curve obtained for the KClO4 liquid electrolyte was also included in the figure for comparison. The values of the C−2 parameter for a given E were clearly higher for surfaces exposed to the gel electrolytes than for those exposed to liquid ones. Moreover, these values tended to increase with increasing glycerol content of the gels.
For all results obtained in the gel electrolytes, three mean slope regions can be identified (Figure 6). The negative slope corresponds to compounds in the passive film with p-type semiconductivity, while the positive slopes found for potentials higher than −0.6 V vs. SCE correspond to compounds with n-type semiconductivity. The XPS results (Figure 4 and Figure 5) showed that the passive film comprised chromium and iron oxides, as well as chromium and iron hydroxides. Cr2O3 and Cr-rich Fe-Cr spinels behave as p-type semiconductors [37]. Hence, the negative slopes in curves, such as those in Figure 6, are used to calculate the doping density of chromium or chromium-rich oxides [38], that is to say, Na.
On the other hand, iron oxides assumed to be present in the passive layers (Figure 5) usually behave as n-type semiconductors due to the presence of Fe(II) cations in Fe(III) positions due to oxygen vacancies [39]. Thus, the doping density of the iron oxides in the passive layers of stainless steels was calculated from the positive slope defined at high values of E [38]. These values are hereafter termed Nd2.
The existence of another positive slope clearly defined at medium potentials for passive layers exposed to gels allows Nd1 to be calculated. The existence of two positive slopes in the Mott–Schottky curves was already reported in the literature by other authors studying stainless-steel surfaces [40]. The existence of a double slope reflects the existence of two donor levels in the passive layer [41]. Some authors attempted relating the origin of an additional donor level to various factors such as a non-homogenous doping distribution over the semiconductor [42] or the electrochemical behavior of spinels [40]. The contribution of hydroxides to the semiconductivity was often neglected in many of the previously published studies, but some authors reported results that seemed to prove that hydroxides have n-type semiconductivity [43,44]. Hence, bearing in mind that the presence of hydroxides in the passive layers is favored in gel electrolytes (Figure 4), and that the donor level at medium values of E is not well defined in the Mott–Schottky curves performed in liquid electrolyte (Figure 6), the hypothesis that hydroxides are related to Nd1 becomes feasible.
The Na and Nd values estimated from the slope of the straight lines of C−2 vs. E of the passive films formed in various electrolytes are shown in Figure 7. As the positive slope at medium values of E was not clearly defined for measurements carried out in liquid electrolytes, perhaps due to the lower amount of hydroxides in their surface (Figure 4), no value corresponding to Nd1 was included in the figure.
The order of magnitude obtained for the charge-carrier densities (Figure 7) is close to that reported in the literature for stainless steel in alkaline electrolytes (1020–1021 at/cm3) [36,45]. Obtained Na and Nd values were higher in liquid electrolytes than in gel electrolytes. Hence, the thicker passive layers formed in liquid electrolytes (Figure 4) were more disordered than the thinner ones formed in gels. It was demonstrated that the more ordered, less defective passive layers are related to higher corrosion resistance [10]. As chromia acts as main barrier for ion diffusion, the decrease in Na value for gel electrolytes can be considered relevant and related to the lower amount of iron oxides formed in the passive layer (Figure 4 and Figure 5). It is logical that less conductive, passive layers tend to grow less and become thinner than more conductive, passive layers when exposed to similar environments. However, the possible influence of the lower O2 content of the medium on the thickness of the oxide layer cannot be forgotten.
In Figure 7, a slight decrease in Na and Nd1 of the passive layers is also visible with increasing glycerol content, but it can be considered almost negligible.

3.3. Non-Destructive Electrochemical Measurements in Gel Electrolytes with Various Compositions

Measurements of OCP are relatively simple, but at the same time, they provide useful information about the passive or active states of the studied systems. The stable values obtained for flat surfaces using various electrolytes are summarized in Table 2. When the OCP of the systems with liquid electrolytes were compared to that obtained with gels with the lowest glycerol content, it can be seen that the values were higher (less negative) for liquids. This fact can be related to the smaller oxygen concentration caused by the agar presence in the electrolyte (Figure 2). The lower oxygen content in agar electrolytes tended to shift the cathodic reaction to lower (more negative) potentials, also lowering the E value at which the anodic and cathodic processes reached equilibrium, that is to say, decreasing OCP [46]. As the glycerol content increased in the gels, the OCP also tended to increase (became less negative). This trend can be related to the effects that the changes in the conductivity of the media (Table 1) can have on the OCP, as a less conductive media increases the ohmic drop between the working electrode and the CE, shifting the measured OCP to higher values [47].
EIS is a more complex non-destructive electrochemical technique that can also be used for corrosion monitoring. EIS measurements were carried out in electrolytes with NaCl, as well as those with KClO4. Figure 8a shows some examples of Bode diagrams obtained using electrolytes with NaCl. An equivalent circuit generated through frequency fitting from all studied spectra is shown in Figure 8b. The validity of this equivalent circuit to simulate the electrochemical behavior of passive stainless steels was previously demonstrated [34,48]. Processes having various time scales are commonly represented in equivalent diagrams by the resistive–capacitive (RC) delay sections with various values of R and C. Constant phase elements (CPEs) are used to simulate the capacitive behavior of elements in the circuit in a more realistic way. Re is the resistance of the electrolyte used to perform the measurement. The resistance, R1, and the constant phase element, CPE1, dominating at medium frequencies, are commonly associated with the electrochemical behavior of the passive layer [2,49]. The resistance, R2, and the constant phase element, CPE2, dominating at low frequencies, are attributed to resistance of the charge-transfer process and to the double-layer capacitive effect.
Table 3 displays the average values obtained from the EIS spectra for the electrochemical parameters of the systems, with the corresponding variations resulting from experimental measurements also included. A trend of increasing R1 with increasing glycerol content can be observed. A slight increase in R2, which is related to the corrosion rate of the stainless steel, is also quite clear. The evolution in R2 with glycerol content agrees with the icorr evolution results obtained from polarization curves [28].
The obtained results prove that the three studied gels with various glycerol contents can be used for the non-destructive electrochemical monitoring of stainless steels. Gels with 50% glycerol can easily lead to corrosion rates slightly lower than those obtained in liquid electrolytes for passive stainless steels; as such, electrolytes with lower plasticizer content seem more adequate for accurate monitoring. Gels with 30% glycerol exhibit an adequate mechanical stability for their comfortable use in a portable cell, and their EIS results are very similar to those obtained in liquid electrolytes. However, 40%-glycerol gels offer better adaptability [28], and seem to be the better option for the testing of very complex-shaped parts.
The performance of electrochemical gels with KClO4 addition proved to be as adequate as that of gels with NaCl for portable cells. These results highlight the possibility of selecting the desired aggression of the medium for corrosion studies.

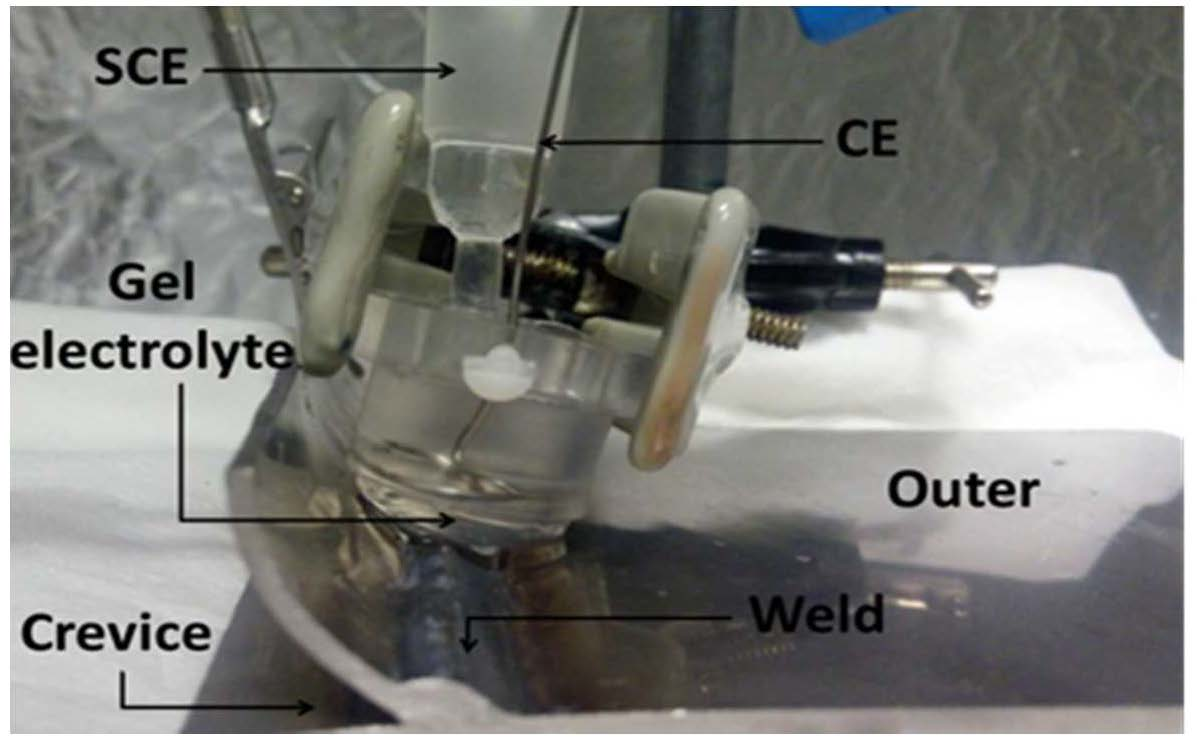
3.4. Measurements in a Complex-Shaped Stainless-Steel Part

In order to validate the use of the gel cell for the corrosion monitoring of stainless-steel surfaces with complex geometry by means of non-destructive techniques, OCP and EIS measurements were carried out on the stainless-steel part shown in Figure 1. An electrolyte with 40% glycerol was selected because of the high complexity of the part in several regions, and measurements with NaCl, as well as those with KClO4, were performed to obtain comparable information about the differences in sensitivity that gels with both salts exhibited. The measured values of OCP for the five studied surfaces defined for the part in Figure 1 are given in Table 4. The results are the mean of two measurements carried out in the two close areas of each surface. The repeatability of the measurements proved to be very good.
All measured OCP values (Table 4) can be considered as typical of stainless steels in a passive state for the studied media (Table 2). The lowest OCP value, the only one that cannot be clearly referred to as typical of passive stainless steels, was found in measurements carried out on the weld. However, though the OCP is a very easily obtained parameter, its reliability for monitoring the corrosion performance of out-of-laboratory structures is limited, as several factors can affect its value [47].
Examples of the EIS spectra corresponding to some of the studied surfaces of the part in Figure 1 are plotted in Figure 9a. The equivalent circuit shown in Figure 8b also proved adequate for the fitting of all obtained spectra, except those corresponding to the measurements carried out inside the crevice. For these cases, a different equivalent circuit was needed to simulate the experimental results (Figure 9b). This more complex impedance behavior can be related to the fact that the thin passive layer covering the surface of the metals was replaced by a thicker oxide layer. Fitting the electrochemical response of this layer required an additional R–CPE pair in the equivalent circuit, which could be related to electrochemical reactions taking place between the oxide and the medium [48], also causing an ohmic drop and a capacitive effect. Additional components in the new equivalent circuit are labeled as CPE1−a and R1−a.
The mean values for the parameters obtained from the fitting of the EIS spectra are displayed in Table 5. The kinetic value of the processes was always controlled by the slowest process, that is the one defined at low frequencies, as R2 was always much higher than other resistances. The obtained R2 values confirm the worst corrosion behavior for the crevice and weld regions. A good corrosion performance of the surfaces defined as inner and outer surfaces was assured in the absence of very corrosive species in the environment. Obviously, to obtain additional information about the corrosion probability for these regions, destructive testing, which was already explored in another publication [28], would be necessary. On the other hand, for the HAZ, the passivity seems to be less stable than in regions further away from the weld, as the presence of small amounts of chlorides in the medium, for instance, can increase the corrosion rate.
The results shown in this section suggest that gels with the addition of NaCl seem to be more capable of detecting regions with higher susceptibility to corrosion failure than gels with KClO4. On the other hand, gels with KClO4 allow the monitoring of surfaces where the risk of contamination from depassivating ions needs to be completely eliminated. The use of NaCl or KClO4 in the gels should always be in agreement with the aggression of the environment that the components under study are exposed to.

4. Conclusions

The results presented in this paper prove that non-destructive electrochemical measurements can be carried out in various regions of complex-shaped stainless-steel components using the proposed gel electrolytes. Relevant information about the corrosion performance for in-use industrial or structural components can be obtained using the proposed approach.
Other relevant conclusions that can be drawn from the results presented in this work are listed as follows:
  • The performance of the electrochemical gel cell with the addition of KClO4 proved to be as adequate as that with NaCl, though the presence of chlorides in the gel seems to be more capable of detecting regions with a susceptibility to developing corrosive attack. These results open the door for the selection of desired aggression for monitoring conditions.
  • For passive stainless steels analyzed with non-destructive techniques, 30%-glycerol gels offer results closer to those obtained in liquid electrolytes, but 40%-glycerol electrolytes can become especially advisable for testing on very complex surfaces. 50% glycerol can easily lead to corrosion rates somewhat lower than those obtained in liquid electrolytes for passive stainless steels.
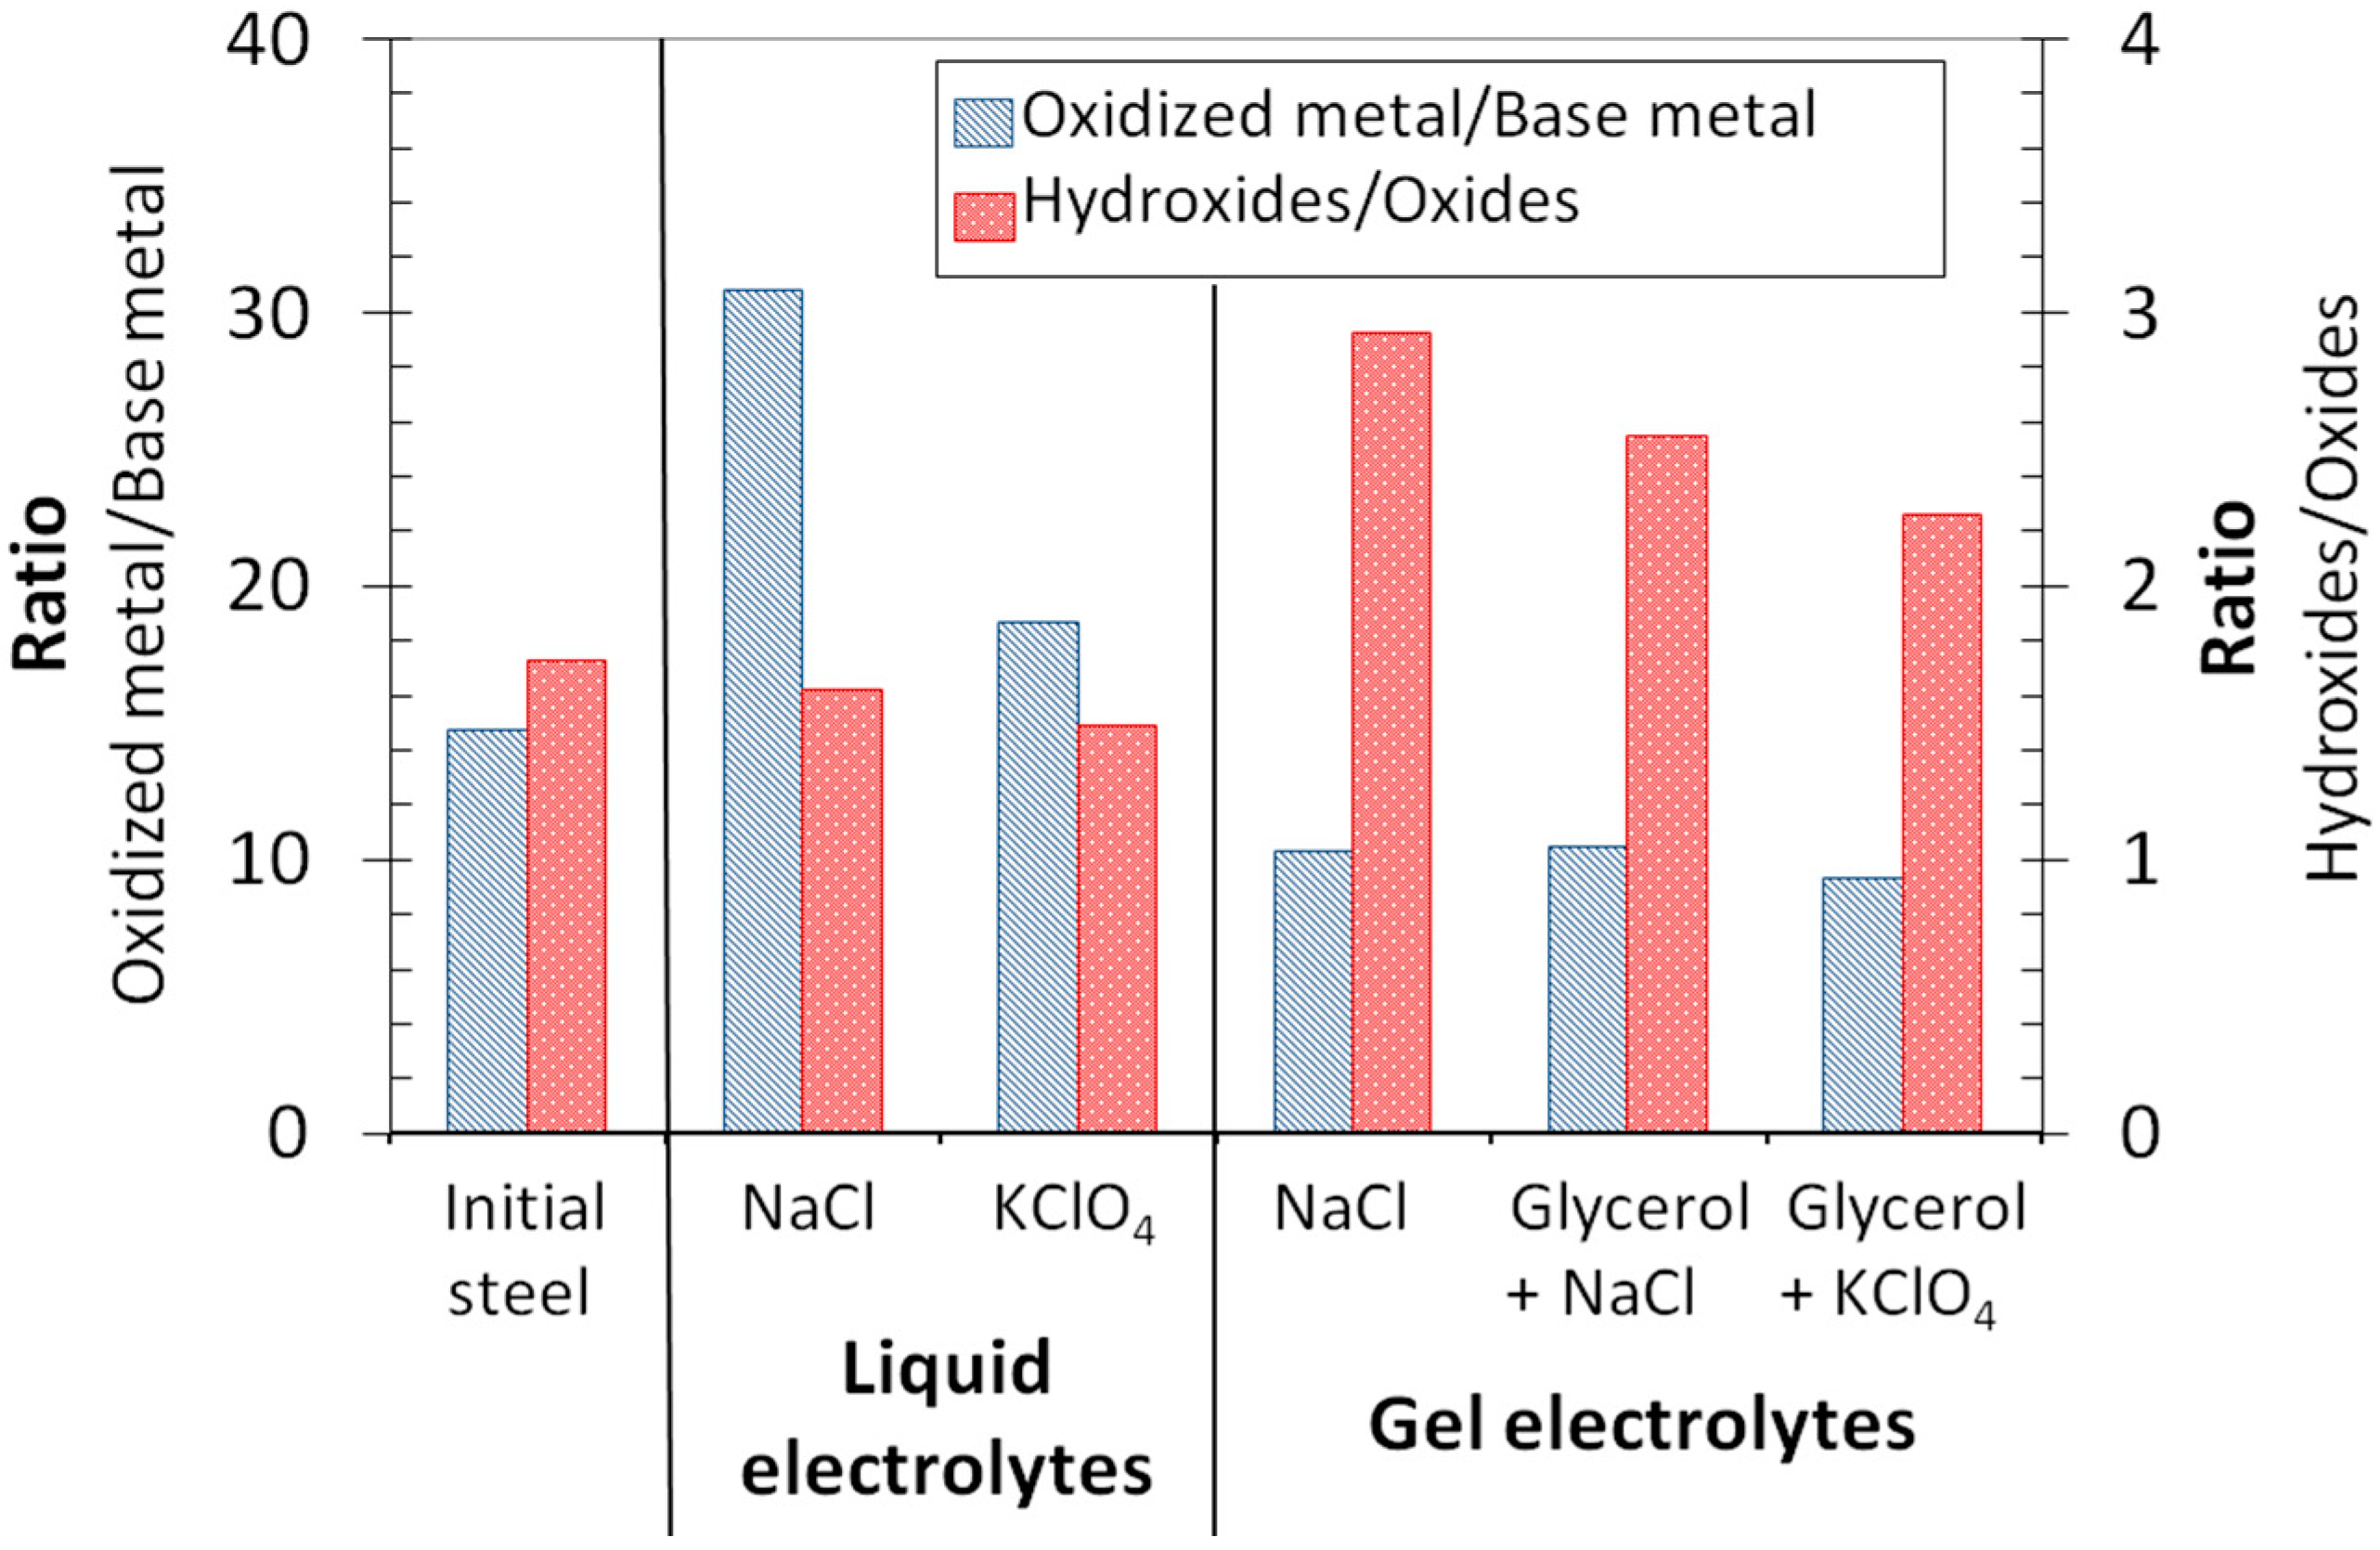
  • The cation distribution determined using XPS for the passive layers in contact with liquid and gel electrolytes was relatively similar, although it could be considered slightly Fe-poorer after exposure to gel electrolytes. Passive layers in contact with gel electrolytes were thinner and richer in hydroxides than those formed in liquid electrolytes.
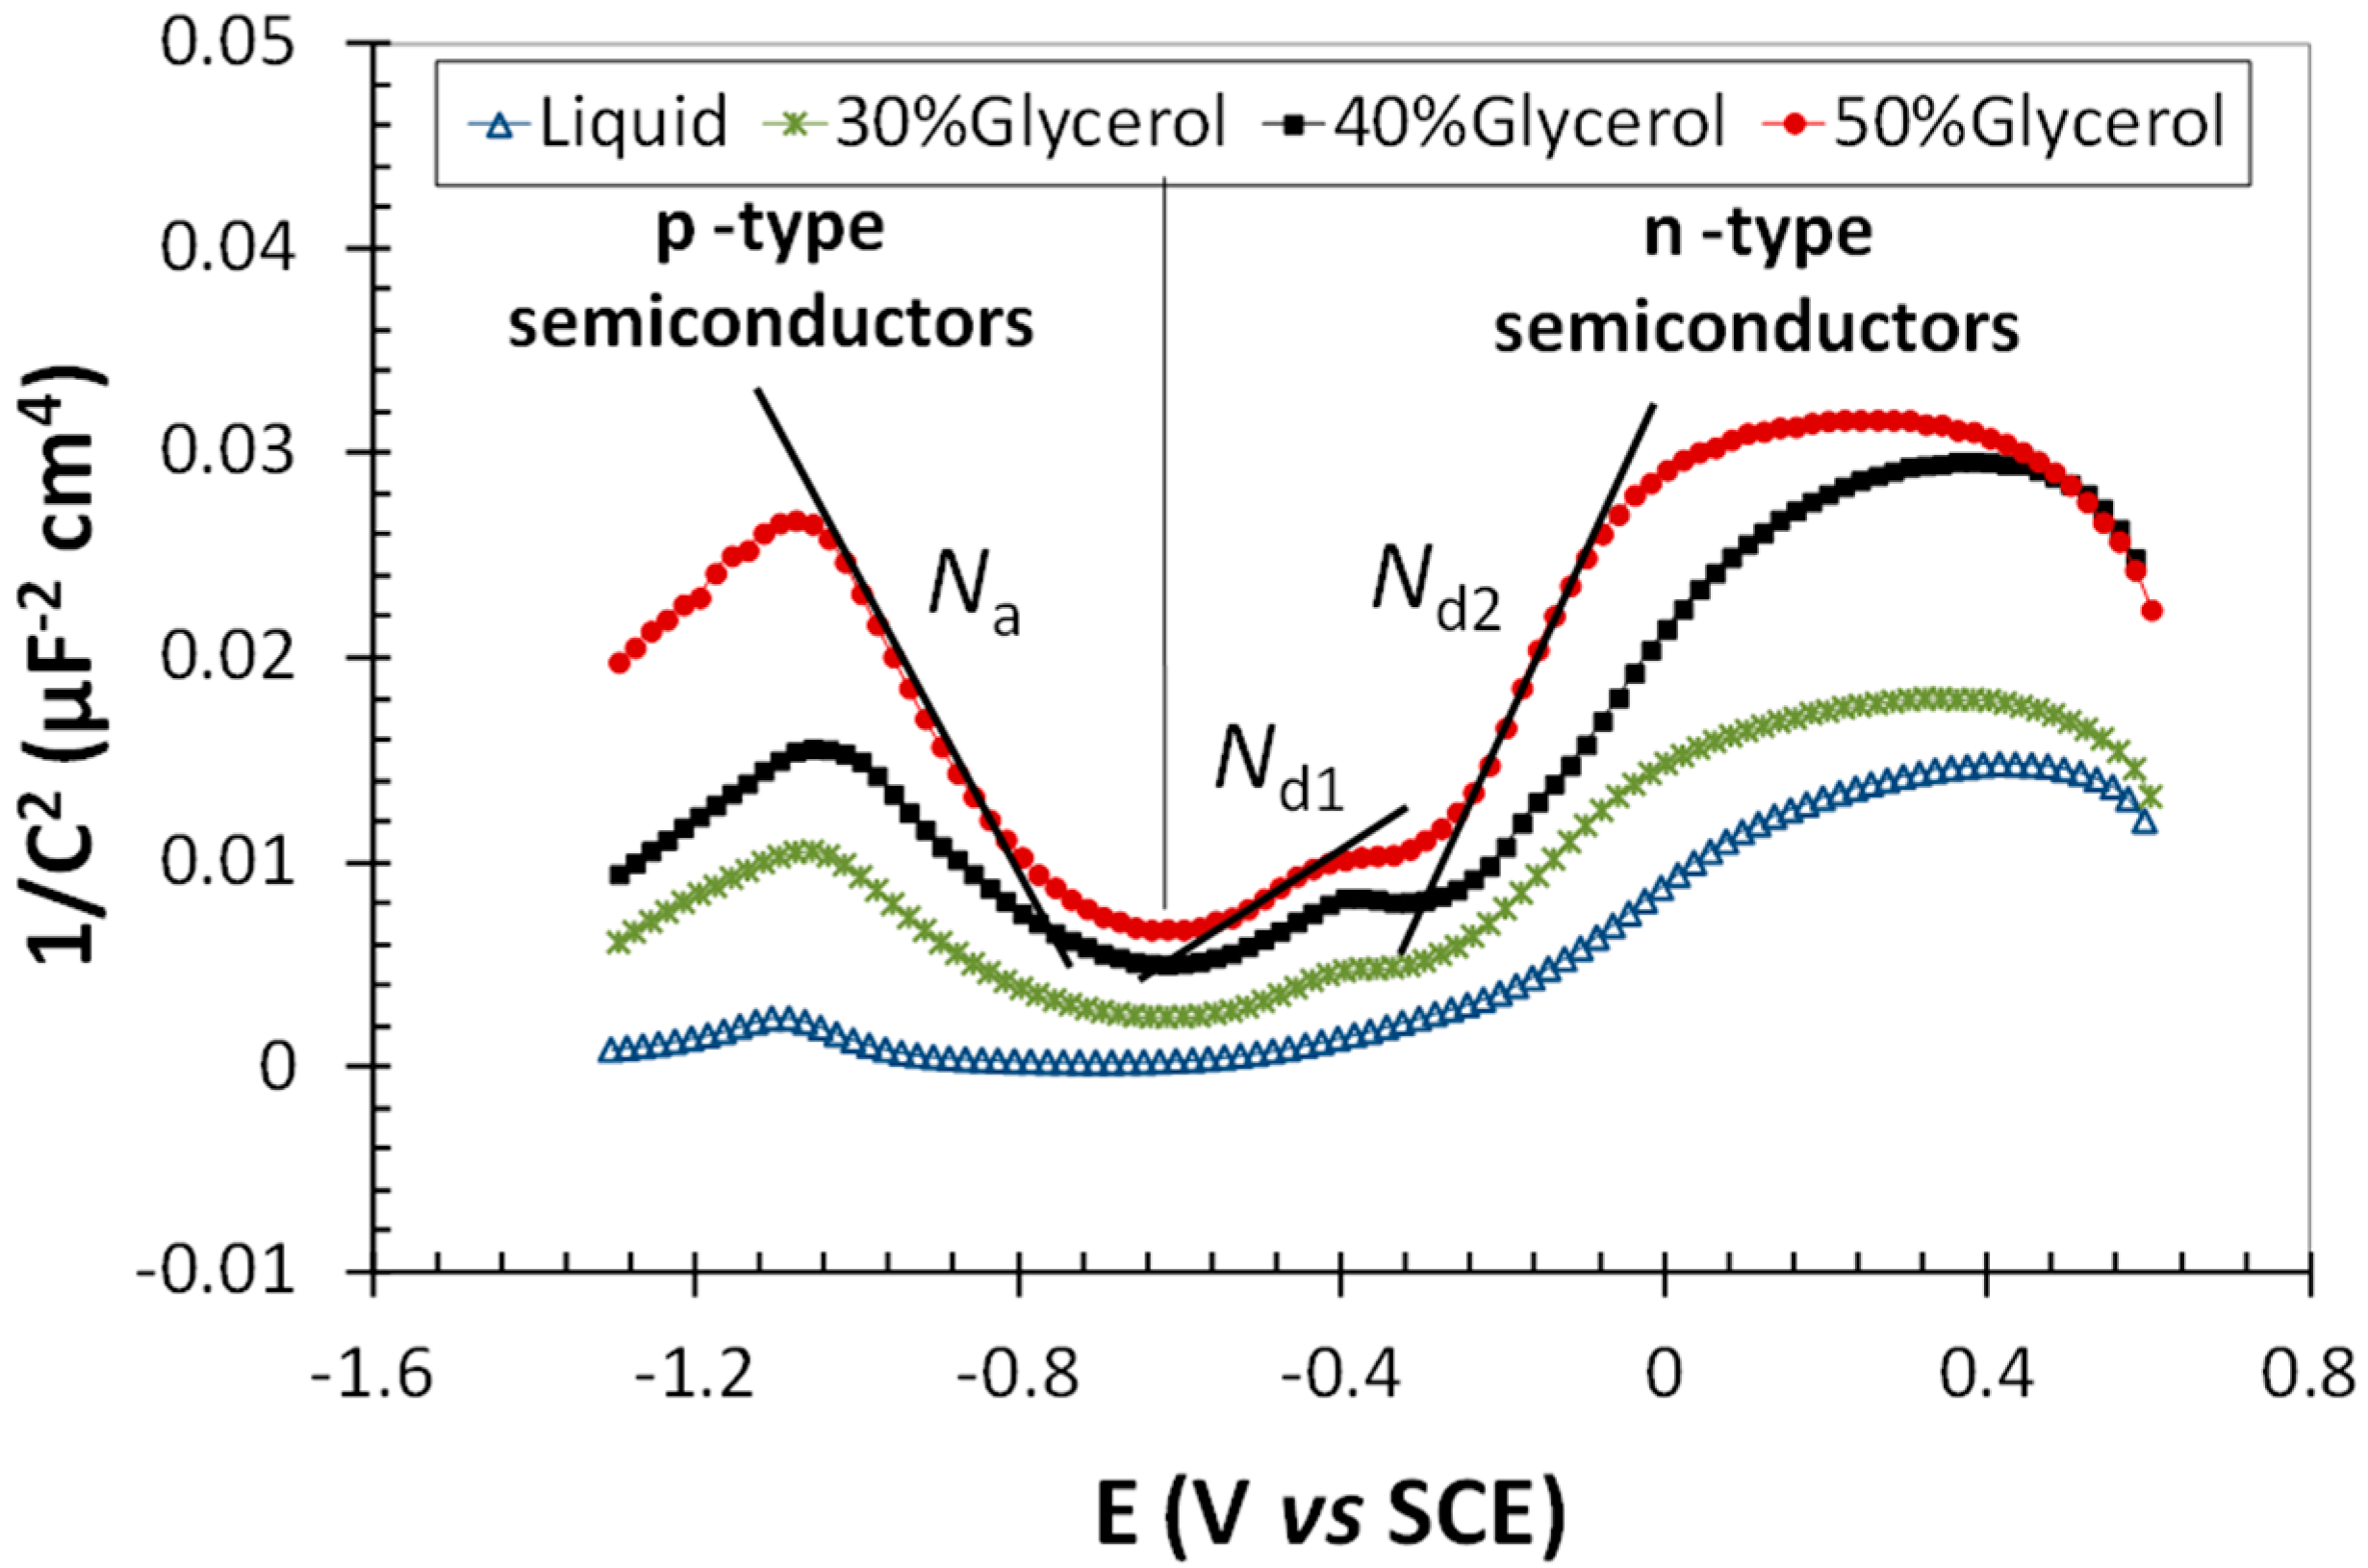
  • Mott–Schottky analyses carried out with gel electrolytes containing KClO4 proved that less defective, passive layers tended to be formed in gels rather than in liquid electrolytes.

Author Contributions

Conceptualization, A.B., E.C. and B.R.-B.; Methodology, A.B.; Validation, F.V.; Formal Analysis, G.M.; Investigation, G.M. and B.R.-B.; Resources, E.C. and F.V.; Writing-Original Draft Preparation, A.B. and G.M.; Writing-Review & Editing, A.B., E.C., B.R.-B. and F.V.; Visualization, G.M.; Supervision, A.B. and E.C.; Funding Acquisition, E.C. and F.V.

Funding

This research was funded by the Spanish Ministry of Economy (MINECO) project grant numbers TRA2014-56471-C4-2-R and HAR2014-54893-R (CREMEL II)), and Interreg SUDOE (project grant number SOE1/P1/E0307 (KrEaTive Habitat)).

Conflicts of Interest

The authors declare no conflict of interest.

References

  1. Rifai, M.; Yuasa, M.; Miyamoto, H. Enhanced corrosion resistance of ultrafine-grained Fe-Cr alloys with subcritical Cr contents for passivity. Metals 2018, 8, 149. [Google Scholar] [CrossRef]
  2. Bautista, A.; Blanco, G.; Velasco, F.; Gutiérrez, A.; Soriano, L.; Palomares, F.J.; Takenouti, H. Changes in the passive layer of corrugated austenitic stainless steel of low nickel content due to exposure to simulated pore solutions. Corros. Sci. 2009, 51, 785–792. [Google Scholar] [CrossRef]
  3. Gardner, L.; Insausti, A.; Ng, K.T.; Ashraf, M. Elevated temperature material properties of stainless steel alloys. J. Constr. Steel Res. 2010, 66, 634–647. [Google Scholar] [CrossRef] [Green Version]
  4. Jin, X.; Chen, S.; Rong, L. Effects of Mn on the mechanical properties and high temperature oxidation of 9Cr2WVTa Steel. J. Nucl. Mater. 2017, 494, 103–113. [Google Scholar] [CrossRef]
  5. Bellezze, T.; Viceré, A.; Giuliani, G.; Sorrentino, E.; Roventi, G. Study of localized corrosion of AISI 430 and AISI 304 batches having different roughness. Metals 2018, 8, 244. [Google Scholar] [CrossRef]
  6. Zanotto, F.; Grassi, V.; Balbo, A.; Monticelli, C.; Zucchi, F. Stress-corrosion cracking behaviour of lean-duplex stainless steels in chloride/thiosulphate environments. Metals 2018, 8, 237. [Google Scholar] [CrossRef]
  7. Aoyama, T.; Sugawara, Y.; Muto, I.; Hara, N. In situ monitoring of crevice corrosion morphology of type 316L stainless steel and repassivation behavior induced by sulfate ions. Corros. Sci. 2017, 127, 131–140. [Google Scholar] [CrossRef]
  8. Jankauskas, A.; Mazeika, L. Ultrasonic guided wave propagation through welded lap joints. Metals 2016, 6, 315. [Google Scholar] [CrossRef]
  9. Bautista, A.; Alvarez, S.M.; Velasco, F. Selective corrosion of duplex stainless steel bars in acid. Part 2: Effect of the surface strain and numerical analysis. Mater. Corros. 2015, 66, 357–365. [Google Scholar] [CrossRef]
  10. Lv, J.; Guo, W.; Liang, T.; Yang, M. The effects of ball milling and surface enriched chromium on microstructures and corrosion resistance of AISI 304 stainless steel. Mater. Chem. Phys. 2017, 197, 79–86. [Google Scholar] [CrossRef]
  11. Amaro Vicente, T.; Oliveira, L.A.; Correa, E.O.; Barbosa, R.P.; Macanhan, V.B.P.; Alcântara, N.G. Stress corrosion cracking behaviour of dissimilar welding of AISI 310S austenitic stainless steel to 2304 duplex stainless steel. Metals 2018, 8, 195. [Google Scholar] [CrossRef]
  12. Almuaili, F.A.; McDonald, S.A.; Withers, P.J.; Cook, A.B.; Engelberg, D.L. Strain-induced reactivation of corrosion pits in austenitic stainless steel. Corros. Sci. 2017, 125, 12–19. [Google Scholar] [CrossRef]
  13. Mohammed, G.R.; Ishak, M.; Aqida, S.N.; Abdulhadi, H.A. Effects of heat input on microstructure, corrosion and mechanical characteristics of welded austenitic and duplex stainless steels: A review. Metals 2017, 7, 39. [Google Scholar] [CrossRef]
  14. Bautista, A.; Blanco, G.; Velasco, F.; Martínez, M.A. Corrosion performance of welded stainless steels reinforcements in simulated pore solutions. Constr. Build. Mater. 2007, 21, 1267–1276. [Google Scholar] [CrossRef]
  15. Brytan, Z.; Niagaj, J.; Reiman, Ł. Corrosion studies using potentiodynamic and EIS electrochemical techniques of welded lean duplex stainless steel UNS S82441. Appl. Surf. Sci. 2016, 338, 160–168. [Google Scholar] [CrossRef]
  16. Aballe, A.; Bautista, A.; Bertocci, U.; Huet, F. Measurement of the noise resistance for corrosion applications. Corrosion 2001, 57, 35–42. [Google Scholar] [CrossRef]
  17. Birbilis, N.; Nairn, K.M.; Forsyth, M. On the electrochemical response and interfacial properties of steel-Ca(OH)2 and the steel-concrete system measured using galvanostatic pulses. Electrochim. Acta 2004, 49, 4331–4339. [Google Scholar] [CrossRef]
  18. Okeniyi, J.O.; Loto, C.A.; Popoola, A.P.I. Effects of Phyllanthus muellerianus Leaf-Extract on Steel-Reinforcement Corrosion in 3.5% NaCl-Immersed Concrete. Metals 2016, 6, 255. [Google Scholar] [CrossRef]
  19. Kwon, S.J.; Lee, H.S.; Park, D.J. A Novel In-situ corrosion monitoring electrode for reinforced concrete structures. Electrochim. Acta 2017, 259, 1129–1144. [Google Scholar] [CrossRef]
  20. Pablos, J.L.; García, N.; Garrido, L.; Guzmán, J.; Catalina, F.; Corrales, T.; Tiemblo, P. Highly efficient mixed Li+ transport in ion gel polycationic electrolytes. J. Memb. Sci. 2018, 545, 133–139. [Google Scholar] [CrossRef]
  21. Ma, G.; Feng, E.; Sun, K.; Peng, H.; Li, J.; Lei, Z. A novel and high-effective redox-mediated gel polymer electrolyte for supercapacitor. Electrochim. Acta 2014, 135, 461–466. [Google Scholar] [CrossRef]
  22. Ping, Z.; XiaoJing, L.; Anye, R.; Peng, G. Preparation of a novel porous gel electrolyte and its application in micro supercapacitor. J. Electroanal. Chem. 2016, 782, 154–160. [Google Scholar] [CrossRef]
  23. Spark, A.J.; Cole, I.; Law, D.; Ward, L.P. The effect of pseudomonas fluorescens on buried steel pipeline corrosion. Environ. Sci. Technol. 2017, 51, 8501–8509. [Google Scholar] [CrossRef] [PubMed]
  24. Spark, A.J.; Cole, I.; Law, D.; Marney, D.; Ward, L.P. Investigation of agar as a soil analogue for corrosion studies. Mater. Corros. 2016, 67, 7–12. [Google Scholar] [CrossRef]
  25. Cano, E.; Crespo, A.; Lafuente, D.; Ramirez-Barat, B. A Novel Gel Polymer Electrolyte Cell for In-Situ Application of Corrosion Electrochemical Techniques. Electrochem. Commun. 2014, 41, 16–19. [Google Scholar] [CrossRef]
  26. Ramírez-Barat, B.; Cano, E. The use of agar gelled electrolyte for in situ electrochemical measurements on metallic cultural heritage. Electrochim. Acta 2015, 182, 751–762. [Google Scholar] [CrossRef] [Green Version]
  27. Ramírez-Barat, B.; Cano, E.; Letardi, P. Advances in the design of a gel-cell electrochemical sensor for corrosion measurements on metallic cultural heritage. Sens. Actuators B Chem. 2018, 261, 572–580. [Google Scholar] [CrossRef]
  28. Monrrabal, G.; Guzmán, S.; Hamilton, I.E.; Bautista, A.; Velasco, F. Design of gel electrolytes for electrochemical studies on metal surfaces with complex geometry. Electrochim. Acta 2016, 220, 20–28. [Google Scholar] [CrossRef]
  29. Nwanya, A.C.; Amaechi, C.I.; Udounwa, A.E.; Osuji, R.U.; Maaza, M.; Ezema, F.I. Complex impedance and conductivity of agar-based ion-conducting polymer electrolytes. Appl. Phys. A 2015, 119, 387–396. [Google Scholar] [CrossRef]
  30. Groisman, A.S.; Khomutov, N.E. Solubility of oxygen in electrolyte solutions. Russ. Chem. Rev. 1990, 59, 707–727. [Google Scholar] [CrossRef]
  31. Lahaye, M.; Rochas, C. Chemical structure and physico-chemical properties of agar. Hydrobiologia 1991, 221, 137–148. [Google Scholar] [CrossRef]
  32. Biesinger, M.C.; Payne, B.P.; Grosvenor, A.P.; Lau, L.W.M.; Gerson, A.R.; Smart, R.S.C. Resolving surface chemical states in XPS analysis of first row transition metals, oxides and hydroxides: Cr, Mn, Fe, Co and Ni. Appl. Surf. Sci. 2011, 257, 2717–2730. [Google Scholar] [CrossRef]
  33. Langevoort, J.C.; Sutherland, I.; Hanekamp, L.J.; Gellings, P.J. On the oxide formation on stainless steels AISI 304 and Incoloy 800H investigated with XPS. Appl. Surf. Sci. 1987, 28, 167–179. [Google Scholar] [CrossRef]
  34. Freire, L.; Carmezim, M.J.; Ferreira, M.G.S.; Montemor, M.F. The passive behaviour of AISI 316 in alkaline media and the effect of pH: A combined electrochemical and analytical study. Electrochim. Acta 2010, 55, 6174–6181. [Google Scholar] [CrossRef]
  35. Díaz, B.; Freire, L.; Montemor, M.F.; Nóvoa, X.R. Oxide film growth by CSV on AISI 316L: A combined electrochemical and analytical characterization. J. Braz. Chem. Soc. 2013, 24, 1246–1258. [Google Scholar] [CrossRef]
  36. Haikiki, N.E.; Da Cunha, M. Electronic structure of passive films formed on molybdenum-containing ferritic stainless steels. J. Electrochem. Soc. 1996, 143, 3088–3094. [Google Scholar] [CrossRef]
  37. Ningshen, S.; Mudali, U.K.; Mittal, V.K.; Khatak, H.S. Semiconducting and passive film properties of nitrogen-containing type 316LN stainless steels. Corros. Sci. 2007, 49, 481–496. [Google Scholar] [CrossRef]
  38. Paredes, E.C.; Bautista, A.; Alvarez, S.M.; Velasco, F. Influence of the forming process of corrugated stainless steels on their corrosion behaviour in simulated pore solutions. Corros. Sci. 2012, 58, 52–61. [Google Scholar] [CrossRef] [Green Version]
  39. Guo, H.X.; Lu, B.T.; Luo, J.L. Study on the passivation and erosion-enhanced corrosion resistance by Mott-Schottky analysis. Electrochim. Acta 2006, 52, 1108–1116. [Google Scholar] [CrossRef]
  40. Hakiki, N.E.; Montemor, M.F.; Ferreira, M.G.S.; Da Cunha Belo, M. Semiconducting properties of thermally grown oxide films on AISI 304 stainless steel. Corros. Sci. 2000, 42, 687–702. [Google Scholar] [CrossRef]
  41. Taveira, L.V.; Montemor, M.F.; Da Cunha, M.; Ferreira, M.G.; Dick, L.F.P. Influence of incorporated Mo and Nb on the Mott–Schottky behaviour of anodic films formed on AISI 304L. Corros. Sci. 2010, 52, 2813–2818. [Google Scholar] [CrossRef]
  42. Williamson, J.; Isgor, O.B. The effect of simulated concrete pore solution composition and chlorides on the electronic properties of passive films on carbon steel rebar. Corros. Sci. 2016, 106, 82–95. [Google Scholar] [CrossRef]
  43. König, U. About the influence of the electronic properties of passive layers on the corrosion rate. Mater. Sci. Forum 1995, 79, 192–194. [Google Scholar] [CrossRef]
  44. Gaben, G.; Vuillemin, B.; Oltra, R. Influence of the chemical composition and electronic structure of passive films grown on 316L SS on their transient electrochemical behaviour. J. Electrochem. Soc. 2004, 151, B595–B604. [Google Scholar] [CrossRef]
  45. Hamadou, L.; Aïnouche, L.; Kadri, A.; Yahia, S.A.A.; Benbrahim, N. Electrochemical impedance spectroscopy study of thermally grown oxides exhibiting constant phase element behaviour. Electrochim. Acta 2013, 113, 99–108. [Google Scholar] [CrossRef]
  46. Nguyen, W.; Duncan, J.F.; Devine, T.M.; Ostertag, C.P. Electrochemical polarization and impedance of reinforced concrete and hybrid fiber-reinforced concrete under cracked matrix conditions. Electrochim. Acta 2018, 271, 319–336. [Google Scholar] [CrossRef] [Green Version]
  47. González, J.A.; Benito, M.; Bautista, A.; Ramírez, E. Inspección y diagnóstico de las estructuras de hormigón armado. Rev. Metal. 1994, 30, 271–282. [Google Scholar]
  48. Abreu, C.M.; Cristobal, M.J.; Losada, R.; Nóvoa, X.R.; Pena, G.; Perez, M.C. Long-term behaviour of AISI 304L passive layer in chloride containing medium. Electrochim. Acta 2006, 51, 1881–1890. [Google Scholar] [CrossRef]
  49. Luo, H.; Dong, C.F.; Li, X.G.; Xiao, K. The electrochemical behaviour of 2205 duplex stainless steel in alkaline solutions with different pH in the presence of chloride. Electrochim. Acta 2012, 64, 212–220. [Google Scholar] [CrossRef]
Figure 1. Welded part from a stainless-steel tank studied with the portable gel cell: (a) portable gel cell and outer surface of the tank; (b) inner surface of the tank, where small cracks and pits had appeared during its in-service life.
Metals 08 00500 g001
Figure 2. Amount of oxygen dissolved in the various electrolytes under study.
Metals 08 00500 g002
Figure 3. Examples of the deconvolution carried out for the spectral peaks of (a) Cr 2p3/2, (b) Fe 2p3/2, and (c) O 1s from the X-ray photoelectron spectroscopy (XPS) spectra of the passive films. The peaks shown in the images correspond to stainless steel after being exposed for 1 h to the agar + glycerol electrolyte with 0.5% NaCl.
Metals 08 00500 g003
Figure 4. Ratios derived from the fitting of peaks of the XPS spectra of the stainless-steel surfaces before and after being in contact with the liquid and gel electrolytes.
Metals 08 00500 g004
Figure 5. Relative amounts of cations detected using XPS for the passive layer formed on stainless steels in air and after being exposed to the liquid and gel electrolytes.
Metals 08 00500 g005
Figure 6. Examples of the Mott–Schottky curves obtained in the liquid and gel electrolytes with 1% KClO4.
Metals 08 00500 g006
Figure 7. Effect of liquid and gel electrolytes with 1% KClO4 on acceptor densities (Na) and donor densities (Nd) for the compounds comprising the passive layer.
Metals 08 00500 g007
Figure 8. (a) Electrochemical impedance spectroscopy (EIS) spectra obtained for electrolytes with 0.5% NaCl, and (b) equivalent circuit generated by fitting the experimental spectra.
Metals 08 00500 g008
Figure 9. (a) EIS spectra obtained for three of the tested regions under study for the piece in Figure 1 (outer surface, weld, and crevice), using gels with 40% glycerol and KClO4; (b) equivalent circuit required for an adequate simulation of the measurements carried out inside the crevice with gels with NaCl and with KClO4.
Metals 08 00500 g009
Table 1. Conductivity of electrolytes with 0.5% NaCl or 1% KClO4 at room temperature.
SaltConductivity (mS/cm)
LiquidGel (0.5% Agar)
0% Glycerol30% Glycerol40% Glycerol50% Glycerol
0.5% NaCl9.4 ± 0.211 ± 0.54.6 ± 0.33.2 ± 0.12.1 ± 0.1
1% KClO48.6 ± 0.18.1 ± 0.74.9 ± 0.53.3 ± 0.42.5 ± 0.5
Table 2. Open-circuit potential (OCP) values obtained for AISI 304 stainless steel in various electrolytes with 0.5% NaCl and 1% KClO4.
HeadingSaltLiquidGel (0.5%Agar)
30% Glycerol40% Glycerol50% Glycerol
OCP
mV vs. saturated calomel electrode (SCE)
NaCl−40 ± 18−108 ± 5−21 ± 59 ± 5
KClO439 ± 9−56 ± 6−62 ± 433 ± 9
Table 3. Electrochemical parameters obtained from electrochemical impedance spectroscopy (EIS) measurements after fitting to an equivalent circuit, in electrolytes with 0.5% NaCl and 1% KClO4. CPE—constant phase elements.
ElectrolyteR1
(Ω·cm2)
CPE1-T
(µF·cm−2·sn−1)
n1R2
(MΩ·cm2)
CPE2-T
(µF·cm−2·sn−1)
n2
NaClLiquid135 ± 717 ± 40.94 ± 0.057 ± 28 ± 40.84 ± 0.05
30% Glycerol36 ± 127 ± 50.86 ± 0.067 ± 535 ± 150.82 ± 0.04
40% Glycerol118 ± 621 ± 150.82 ± 0.0510 ± 514 ± 40.89 ± 0.08
50% Glycerol271 ± 6314 ± 50.85 ± 0.0115 ± 29 ± 10.87 ± 0.01
KClO4Liquid171 ± 2724 ± 70.92 ± 0.045 ± 27 ± 20.83 ± 0.08
30% Glycerol289 ± 1020 ± 10.85 ± 0.014.4 ± 0.122 ± 10.84 ± 0.01
40% Glycerol313 ± 1228 ± 60.81 ± 0.014.6 ± 0.420 ± 10.88 ± 0.02
50% Glycerol373 ±1014 ± 20.86 ± 0.0253 ± 2010 ± 20.86 ± 0.03
Table 4. OCP measurements performed in the various regions under study for the piece in Figure 1, using gels with 1% NaCl or with 0.5% KClO4.
Salt in the GelOCP (mV vs. SCE)
OuterInnerHeat-Affected Zone (HAZ)WeldCrevice
NaCl−727−32−192−63
KClO45−623−85−44
Table 5. Electrochemical parameters obtained from fitting EIS measurements carried out in various regions of the part shown in Figure 1, using a gel electrolyte with 40% glycerol.
Salt in the GelSurfaceElectrochemical Parameters from the EIS Measurements
R1
(Ω·cm2)
CPE1-T
(µF·cm−2·sn−1)
n1R1−a
(kΩ·cm2)
CPE1−a-T
(µF·cm−2·sn−1)
n1−aR2
(MΩ·cm2)
CPE2-T
(µF·cm−2·sn−1)
n2
KClO4Outer137160.92---21200.91
Inner11590.90---34210.90
HAZ4750.90---17250.88
Weld127140.79---1.5350.77
Crevice226280.684.7190.840.27640.75
NaClOuter5660.99---11230.86
Inner160120.9---32150.91
HAZ9190.95---3.5190.80
Weld206780.68---0.20320.86
Crevice368280.692.6260.800.33290.86

