Abstract
The tundish with heating instrumentation is attracting more and more attention in continuous casting processes for maintaining a pre-determined constant pouring temperature under a given casting speed, which is beneficial for an improved and consistent steel product quality. However, the fluid flow, temperature distribution and the removal behaviors of non-metallic inclusions in it will be much different from that in a conventional tundish, due to the implementation of the heating practice. In the present work, to reduce the non-metallic inclusion amounts in billets of the second and sixth strands in a seven-strand tundish with channel type induction heating, the flow field profiles and temperature profiles of molten steel in this tundish have been investigated using hydrodynamic modeling coupled with mathematical simulation under isothermal and non-isothermal situations, respectively. The results of the isothermal experiment indicate that the prototype tundish has severe “short-circuiting flow” in the second and sixth strands, which might have caused the increased inclusion amounts in the billets of the two strands. The flow field of the tundish can be greatly improved by changing the channel design and adding two high dams at each side of the tundish. Compared with the prototype structure A0, the average residence time of the optimized case C5 is prolonged by 55.49% (from 501 to 779 s); the dead zone volume fraction is reduced by 66.18% (from 45.57% to 15.41%); and the flow of each strand becomes more consistent with lower standard deviation. The non-isothermal experiments show that the fluid presents an obvious rising tendency when it flows out from the heating induction channel. The larger the temperature difference inside and outside the channel is, the more consistent the fluid flow between different strands and the more homogeneous the flow field in the whole tundish. For the prototype tundish structure, when the temperature difference is 5 °C, the dead zone is basically eliminated, and the minimum residence time is prolonged by 789% (from 38 to 338 s), compared with the 0 °C of temperature difference. A mathematic model has been proposed accordingly, which can explain well the hydraulic phenomena. The inclusion removal rates of different cases were compared by mathematical simulation, and their removal mechanism was studied, as well.
1. Introduction
Industrial practice and continuous casting theory show that a low superheat degree of constant temperature casting plays an active role in improving the billet quality and stabilizing the operation of continuous casting, while controlling the temperature of molten steel in the tundish is one of the most effective means [1]. However, with casting proceeding, the temperature of molten steel in both the ladle and tundish will inevitably drop due to heat loss from radiation and convection of refractory lining, especially during ladle exchange and casting end. Therefore, the temperature compensation technology of the tundish has been paid more and more attention in the production process of high quality special steel in the recent years. At present, the main technologies for the temperature compensation are plasma gun and channel type induction heating (CTIH), the latter of which is studied in the paper.
There are two chambers in this kind of tundish, one pouring chamber and the other the discharging chamber, which are separated by a refractory wall. The induction heater is installed inside the wall with a channel to connect the two chambers. The heating operation for temperature compensation of liquid steel is illustrated in Figure 1 [1]. According to the electromagnetic induction principle, as the induction coil is supplied with medium frequency alternating current, the main magnetic flux in the iron core will be established. Consequently, the induced current will be generated in the electrical conductive molten steel, which will produce joule heat to heat the molten steel passing through the induction channel. The heated molten steel flows out to the discharging chamber of tundish and mixes with the molten steel there. Therefore, the temperature of molten steel in the discharging chamber can be kept at a pre-determined value. In the actual casting process, when the temperature of molten steel drops to a certain value, the induction heating device will be automatically turned on and adjust the electric power according to the temperature of molten steel to ensure a constant and uniform temperature in the discharging chamber.
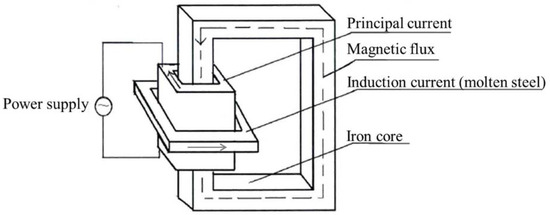
Figure 1.
Schematics of the channel type induction heating (CTIH) principle of the tundish.
The CTIH technology of the tundish has been verified in production to have many advantages such as high heating efficiency, easy control of the temperature, convenient installation and maintenance. However, the following issues should be considered for steel plants with its adoption: (a) its unique geometry with the induction channel involved; (b) the heating power is usually variable in operation as mentioned above or even in power-off state, which is simply based on the pouring temperature of molten steel from the ladle or the need for steel grades, etc. For example, in the early stage of casting, it does not work due to the high molten steel temperature; while in the later stage of casting, its electric power will be increased step by step with the decrease in the temperature of molten steel, which will result in the change of the temperature difference inside and outside the induction channel and the change of fluid flow accordingly. In addition, for plain carbon steel, the induction device usually remains in the power-off state. For cost-efficient control in sequence casting, an overall improved fluid flow pattern in the tundish should be designed based on the geometrical and operational characteristics of this kind of new vessel.
A seven-strand tundish with a symmetrical induction heating channel has been commissioned recently in a steel plant of China, which is used to produce high-quality bearing and spring steels at lower, but constant pouring temperature. It has been proven practically in test production that the temperature of liquid steel leaving the ladle furnace can be decreased by 10–15 °C compared with the original process with the conventional tundish, and the casting temperature can be kept at the given temperature within ±2 °C. However, it was also observed in the following industrial tests that the billets from the second and sixth strands contained more non-metallic inclusions than other strands, which is suspected to be related to the improper tundish structure while adopting the heating channel. Therefore, it is of great necessity to optimize its structure and improve the flow field of molten steel in order to decrease the overall amount of non-metallic inclusions in billets.
For the conventional tundishes, many investigations [2,3,4,5,6,7,8,9,10,11] have been performed in the past three decades by changing their shapes and flow control devices such as a dam, weir, turbulence inhibitor and baffle with inclined holes to improve its flow field. These studies also indicate that hydrodynamic modeling [12,13,14], combined with mathematical simulation [15,16,17,18,19], is a useful method to study the flow field and temperature profile of molten steel in the tundish. As the effect of the temperature decrease of molten steel with casting on its flowing state is usually ignored, isothermal cold water is frequently adopted to model the molten steel. However, for a tundish with induction heating, different heating conditions will exert various temperature differences, so an isothermal cold water model is not enough to reflect its actual flowing behavior. Therefore, a non-isothermal experiment should be also performed in the present study.
There have been fewer studies on the induction heating tundish to the present. The earliest one began from a patent proposed by Ueda et al. [20] in 1984. In the same year, Mabuchi et al. [21] investigated the flow characteristics of molten steel by performing the residence time distribution (RTD) in the tundish with induction heating. They found that the molten steel and inclusions lifted upward under the action of buoyancy due to the induction heating. Later on, Miura et al. [22] performed some industrial tests on the induction heating tundish of the No. 2 continuous caster at Yawata Works and found that the inclusion removal ratio was increased and the surface quality of slab was significantly improved, which was attributed to the contribution of both the electromagnetic force and buoyancy-driven flow.
In recent years, Wang et al. [23,24] developed a mathematical model mainly to simulate the joule heating and temperature distribution in an “H-type” channel tundish with 800, 1000 and 1200 kW of induction heating power, respectively. Their results indicated that the heat loss of molten steel could be compensated effectively by joule heating, and the temperature distribution became more homogeneous in the tundish with induction heating. Yue et al. [25] developed a magneto-hydrodynamic model to study the flow and heat transfer in a twin-channel induction heating tundish and showed that electromagnetic force had a significant effect on the flow of molten steel.
From the summary above, it can be seen that the previous studies mainly focused on the effect of induction heating and electromagnetic force on the flow of molten steel, while few on the effect of induction channel position and heating time, especially for multi-strand tundishes. In the present work, the structure of a seven-strand induction heating tundish is comprehensively optimized by a physical model combined with a mathematical simulation method under both isothermal and non-isothermal conditions, which is expected to make an effective improvement of the multi-strand induction heating tundish with special intention to decrease the non-metallic inclusion amounts in the second and sixth strand billets; meanwhile, the flow characteristic and behavior of molten steel in the tundish with induction heating will be revealed, which is beneficial to the better application of this innovative vessel in industry.
To verify the optimized results, the removal ratios of different particle sizes of inclusions are also numerically simulated and their removal mechanism discussed.
2. Physical Modelling
2.1. Description of the Tundish
An industrial sized seven-strand metallurgical tundish with induction heating was used as prototype to design the experimental water model. Its schematic is shown in Figure 2, in which Figure 2a–c represents the solid view, top view and partial view of the tundish, respectively. The geometrical size of the prototype tundish is listed in Table 1 and the operating parameters in Table 2. The pouring chamber and discharging chamber are connected by the coupled heating channels. The molten steel flows into the discharging chamber only through the channel.
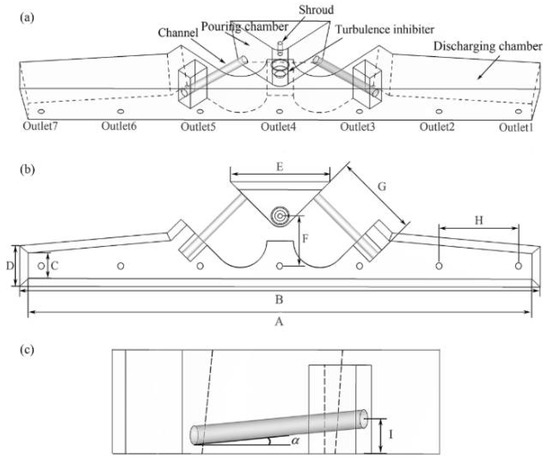
Figure 2.
Schematics of the tundish: (a) solid view, (b) top view and (c) partial view.

Table 1.
Geometry of the prototype tundish.
Table 2.
Operating parameters of the prototype tundish.
The experimental scale factor is 1:3. According to a similar principle, the geometrical and dynamic similarities need to be guaranteed between the prototype tundish and the model one [6,7]. For the dynamic similarity, fluid flow characteristics can be decided by the Reynolds number Re and Froude number Fr. The experimental work of Koria and Singh [7] indicated that the magnitude of Re in different scale tundishes was very similar under the turbulent flow conditions. Therefore, the essential conditions for dynamic similarity between the prototype and the model can be expressed as:
where m represents the model of the tundish and p represents the prototype.
The Froude number is defined as:
where u is the flow velocity, g is the acceleration of gravity and L is the characteristic length.
Thus, the main geometrical and operation parameters between the model and prototype can be formulated with scale factor λ as follows:
where V is the volume of the tundish and Q is the volumetric flow rate of the molten steel.
Substituting in the data in Table 1 and Table 2, Vm and Qm can be obtained as 0.234 m3 and 2.545 × 10⁻⁴ m3/s, respectively.
The motion behavior of molten steel in the tundish depends on the natural convection and forced convection, which are controlled by the buoyancy force and inertia force, respectively. Therefore, the dimensionless Archimedes number (Ar) can describe the convection pattern as the ratio of buoyancy force to inertia force [8]. According to the similarity principle:
The Ar is expressed as:
where Gr is the Grashof number and Re is Reynolds number:
where ν is the kinematic viscosity.
Substituting Equation (6) into Equation (5), Ar is obtained as:
where β is the thermal expansion coefficient and ΔT is the temperature difference of fluid inside and outside the channel.
Substituting βp = 3.9 × 10⁻⁴ (1/°C), βm = 3.48 × 10⁻⁴ (1/°C) [5] and the relationship of L, u between the model and prototype in Equation (3) into Equations (4) and (7), the following formula can be obtained as:
Equation (8) is used to calculate the temperature difference of the fluid in the model, corresponding to the induction heating effect in the prototype.
2.2. Method and Criteria of Hydrodynamic Modelling
2.2.1. Experimental Setup and Method
The traditional stimulation-response method [2,3,5,6,7] was applied to the 1:3 reduced scale Pexiglass hydrodynamic model with ambient temperature water and heated water. Water was put in a model ladle on the top of the tundish and flowed into the pouring chamber of the tundish through the ladle shroud, then into the discharging chamber only by the induction channel illustrated in Figure 2. When the water levels in both the ladle and tundish in the hydrodynamic system were controlled to be stable for more than 20 min, the saturated KCl solution of 75 mL was injected as a pulse tracer at a side port mounted at the upper position of the ladle shroud; meanwhile, the conductivities of water at the submerged entry nozzle (SEN) of 1st–4th strands (the tundish is symmetrical; only four strands is enough) were online measured by a conductivity meter with a time interval of 1.0 s. All the conductivity data were collected by a recorder (DJ800, IWHR, Beijing, China) and input into a computer to obtain residence time distribution (RTD) curves, and then, these data were further processed to calculate the flow characteristics of fluid. Each experiment was repeated three times, and the characteristic parameters take their average values from the three times.
The theoretical mean residence time (921.54 s) is calculated by [3]:
The actual average residence time is calculated by:
For a specific strand j of the multi-strand tundish, Cj(ti) is the molar concentration of the tracer measured in this strand at given time ti and is the actual average residence time of strand j (j = 1, 2, 3, 4). As for the whole tundish, the average residence time, , is the average value of four strands, in which C(ti) is calculated by the average molar concentration of the tracers of four strands as:
According to the modified mixing model of flow [2,9], the volume fraction of plug flow Vp, dead zone Vd and well-mixed zone Vm can be determined by:
where tmin is the minimum residence or breakthrough time of the tracer and tpeak is the time to attain the peak concentration.
The flow consistency between strands is expressed by the standard deviation S in Equation (13) in this paper:
where represents the measured value of strand j for a certain parameter, is the averaged value of four strands and n is the total number of strands, n = 4. Herein, the standard deviations , and of the average residence time, minimum residence time and peak time were calculated, respectively, by the above equation. The smaller the value of S, the more consistent the fluid flowing among different strands.
To observe the fluid flowing, the ink was added from the position where KCl was injected in the experiment, and its dispersion was recorded by the camera.
2.2.2. Schemes of the Physical Experiments
(1) Non-isothermal experimental work
The molten steel is heated when it flows through the induction channel. Various heating effects can be obtained by different electric powers. To observe the influences of induction heating on the liquid flow and temperature field, non-isothermal experiments with various temperature differences ( = 0, 5, 10, 20, 30 °C) of fluid between inside and outside the induction channel were firstly carried out for the structure of the prototype tundish. Applying the ambient temperature water to model the molten steel without being heated in the tundish (outside the induction channel), various temperatures of hot water were injected from the induction channel inlet to simulate the effect of induction heating. The experimental scheme is given in Table 3.
Table 3.
Scheme of the non-isothermal experiment.
(2) Isothermal experimental work
When the induction heating of the tundish runs for a period of time, the temperature difference of molten steel inside and outside the induction channel will reduce until it disappears. At that time, the molten steel in the tundish will tend to isothermal flow. In addition, the induction heating operation is usually used for some special steel grades such as bearing and spring steels for economical consideration. For normal steel grades, the heating function of channels will be kept in a power-off state. Under this case, the flow of molten steel through the channel is also isothermal. Therefore, for the structural optimization of a tundish with induction heating, the isothermal experiment of the hydrodynamic model is also of great necessity. In the present work, it is described by Part B and Part C, respectively. Figure 3 illustrates the top view of the tundish structure in Part B, in which the channel inclination and the height of the added dam h are chosen as variables. The degree of dam inclination is designed as 45°, and the distance from the right dam to the third outlet J is fixed as 750 mm. The experimental scheme is listed in Table 4.
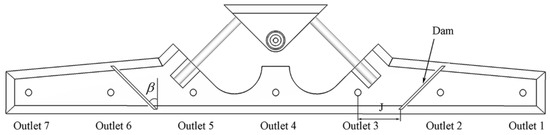
Figure 3.
Top view of the optimization structure of the isothermal experiment Part B.
Table 4.
Scheme of the isothermal experiment Part B.
In Part C, the height of the channel exit (I) was risen to 590 mm with 0° of inclination. Dams were symmetrically installed between Outlets 2 and 3 and between Outlets 5 and 6 as in Figure 4. Choosing the distances (a) from Dam 1 to Outlet 3 and (b) from Dam 2 to Outlet 2 and the heights of the dams (c and d), as variables, the experimental scheme is in Table 5.
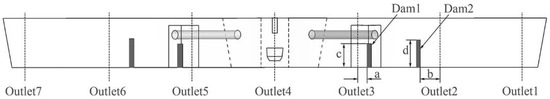
Figure 4.
Front view of the optimized tundish structure in the isothermal experiment Part C.
Table 5.
Scheme of the isothermal experiment Part C.
3. Mathematical Model
A mathematical model containing four main equations, as the continuity equation, momentum conservation equation, i.e., Navier-Stokes equation, the standard k-ε transport equations for the turbulent model and the energy conservation equation [15,16,18,19], has been developed to calculate the flow field profiles and temperature profiles of molten steel in the prototype and optimized tundish under the non-isothermal and isothermal conditions at casting speed as 0.8 m/min for a billet section of 200 mm × 200 mm.
3.1. Control Equations
The major governing equations are as follows:
(1) Continuity equation:
(2) Momentum conservation equation:
where ρ is the density, is the fluid velocity, is the effective viscosity, is the pressure, is the gravitational accelerate and represents the spatial coordinates for i and j directions.
(3) Turbulent equations:
where is the turbulence kinetic energy and is the turbulent kinetic energy dissipation rate. and represent the Schmidt number for k and ε. The generation rate of turbulence energy and effective viscosity is calculated as follows:
The constants of the k-ε two-equation turbulence model are taken as: , , , , .
(4) Energy equation:
where is the temperature and is the effective thermal conductivity.
(5) Species transport equation:
where C is the concentration of the tracer and t is time. Under the flow field of fluid, the effective mass-diffusion coefficient De can be calculated as follows:
3.2. Assumptions and Boundary Conditions
3.2.1. Main Assumptions
- (i)
- Molten steel is treated as a three-dimensional steady incompressible viscous fluid. The physical properties of the molten steel such as density, viscosity, specific heat and thermal conductivity are shown in Table 6.
Table 6. Physical properties of molten steel [23].
- (ii)
- The influences of slag layer and re-oxidation are ignored, and the slag-steel surface is treated as a free surface. The stopper rod is assumed to have no effect on the fluid flowing.
- (iii)
- The induction heating effect is simulated by changing the temperature of molten steel at the induction channel exit.
3.2.2. Boundary Condition and Solution Method
The simulation domain includes the pouring chamber, channels and discharging chamber of the tundish. The velocity inlet boundary condition has been applied at the inlet of the tundish, and its value is determined to be 0.62 m/s by the operating parameters of the tundish. The outflow boundary condition is taken at the outlet, and the flow rate weighting of each outlet is set as one. The solid walls in the tundish are taken to be no-slip boundaries and near wall using a standard wall function. The heat loss of the tundish is caused by heat radiation and conduction. The values of heat flux through the slag layer, side walls, bottom wall and channel wall of the tundish are shown in Table 7.
Table 7.
Values of heat flux [23].
The commercial CFD software FLUENT 14.5 (ANSYS, Pittsburgh, PA, USA, 2012) has been employed to perform the calculation, in which the velocity fields of the isothermal condition are calculated with the steady state solution, while those with induction heating are calculated with transient state solution. The SIMPLE algorithm is used for pressure velocity coupling in the momentum equation. The convergence criteria for scaled residuals are set to be less than 10−5. Once the flow field is converged to steady state, the solver is converted to the transient state to solve the transient tracer dispersion. The injection time of tracers at the inlet is set as 1 s. After that, its concentration variation with time is computed at the outlet plane of the tundish to obtain the RTD curve.
3.3. Condition for Inclusions Behavior Simulation
The movement of non-metallic inclusions in the molten steel has been simulated with the Euler-Lagrange approach. According to the law of action and reaction, the non-metallic inclusion suspended in the molten steel suffers various forces, such as gravity , buoyancy , drag , lift , added mass and Brownian forces [24]. The force balance of an inclusion in molten steel is expressed as:
where is the density of the inclusion, is its diameter and is movement velocity.
To simplify the calculation, the inclusion is assumed to be an inert spherical solid with a constant density of 3900 kg/m3, and its size will not change even if a collision happens; the motion of inclusions does not influence the macroscopic flow pattern.
Considering the chaotic effect of the turbulent motion, the random walk model is applied to the calculation of the inclusion track. The inclusion is assumed to be removed only through the absorption of the slag layer. When it reaches the solid wall, a non-perfect elastic collision will occur [26,27,28]. Four particular sizes of inclusions of 5, 10, 30 and 50 μm in diameter and 70 in original number for every particle size are counted to compare their removal ratios. The removal ratio was calculated as the percentage trapped by the slag layer in the total number of inclusion particles for each particular size, which is described as:
4. Results and Discussions
4.1. Results of the Non-Isothermal Experiment
As the structure of the tundish is symmetric, half of its geometry, i.e., Strands 1–4 (corresponding to tundish Outlets 1–4 in Figure 2, Figure 4 and Figure 5), is investigated. In the non-isothermal experiment, the flow characteristics of fluid under the conditions of = 0, 5, 10, 20, 30 °C were studied to reveal the influence of induction heating on fluid flow for the structure of the prototype tundish. Their characteristic parameters are presented in Table 8, in which and represent the minimum breakthrough time and the peak concentration time of the whole tundish, while and represent those of Strand 2, respectively; they are selected to compare with the whole tundish because the position of Strand 2 is close to the induction channel, and its flow has a large influence on the whole tundish. The ,, and in Table 8 are parameters for the whole tundish. The typical RTD curves of these experimental cases are illustrated in Figure 5.
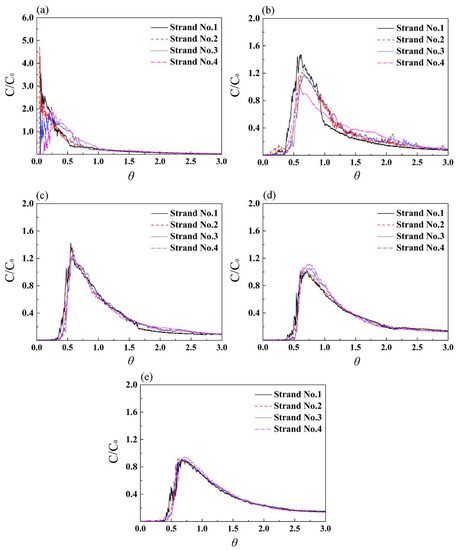
Figure 5.
RTD curves of non-isothermal experiment at different ΔT: (a) case A0, ΔT = 0 °C; (b) A1, 5 °C; (c) A2, 10 °C; (d) A3, 20 °C; (e) A4, 30 °C.
Table 8.
Characteristic parameters of non-isothermal experiment cases.
From Table 8, the value of of Strand 2 is close to of the whole tundish in most cases, verifying that the flow of Strand 2 has a large influence on the characteristics of the whole tundish. For the condition of ΔT = 0 °C (case A0), is only 38 s. The reason can be explained by the RTD curves of Figure 5a. The peak concentration C/C0 of Strand 2 exceeds 4.5, much higher than other strands, and shows a sharp shape, which suggests that most tracer directly flows out from Outlet 2. From Table 8 and Figure 5, and of the other cases are greatly delayed, and the is obviously reduced when ΔT increases. The dead zones of cases A3 and A4 were wholly eliminated with their .
Comparing cases A1–A4, with the increase of , their dimensionless concentration C/C0 decreases, and the RTD curves of four strands become more coincident. The standard deviations (S) in Table 8 are also relatively small for these cases. To explain the above phenomena, the ink dispersions of cases A0 and A4 were tracked as in Figure 6 and Figure 7, respectively.
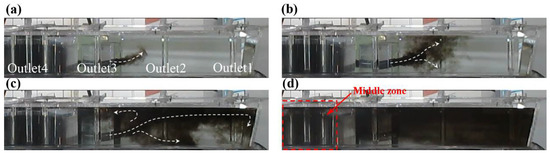
Figure 6.
Ink dispersion behavior in the prototype case A0: (a) 23 s, (b) 38 s, (c) 101 s, (d) 205 s.
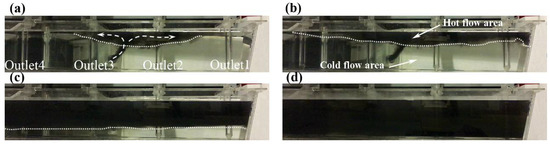
Figure 7.
Ink dispersion behavior in the case A4: (a) 56 s, (b) 76 s, (c) 311 s, (d) 585 s.
For case A0, as marked by the dashed line, the black ink first spreads upwards due to the effect of the tilted channel (Figure 6a). At 38 s, part of the tracer disperses to the liquid surface, while some reaches Outlet 2, generating “short-circuiting flow”. Under this circumstance, the molten steel can stay only a short time in the tundish; thus, the inclusions in it are not able to float sufficiently. The dead zone volume () in case A0 reaches 45.57% (Table 8), suggesting that approximately half of the fluid in the tundish flows slowly. From Figure 6c,d, a little ink could be observed in the “middle zone” marked as the red dash square, while most ink concentrated on the right side of the tundish. This fact indicates that the “middle zone” is the main source of the dead zone. Besides, the , and present 91.01, 61.39 and 88.15, respectively, showing that the flow characteristics among different strands have a big difference. Therefore, it is of great necessity to optimize the inner structure of the prototype tundish under the condition of ΔT = 0.
Different from case A0, the ink in case A4 firstly floats towards the liquid surface following the hot water flow from the channel (Figure 7a) due to the driving of buoyancy, which is called “upward flow”, and then gathers and spreads out the whole liquid surface (Figure 7b); no short-circuiting flow occurs in this process. Owing to the density difference, the cold flow will stay at the bottom of the tundish. When the hot flow gathers to a certain degree, it gradually sinks (Figure 7c) due to the heat exchange with the cold flow at the interface, until the whole tundish is filled up with ink (Figure 7d). During this period, the ink takes a longer time before reaching Outlet 2; thus, the is significantly prolonged, compared with case A0. Moreover, the hot flow can fill up the whole tundish (Figure 7d); thus the of case A4 is equal to 0.0. With the decrease of ΔT, the effect of buoyancy on hot flow reduces; thus the thermal exchange between hot flow and cold flow becomes fast, which makes of cases A1 and A2 shorter than case A4.
4.2. Results of the Isothermal Experiment
(1) Part B
The flow characteristic parameters of isothermal experiment Part B are presented in Table 9, and their RTD curves are shown in Figure 8.
Table 9.
Flow characteristic parameters in isothermal experiment Part B.
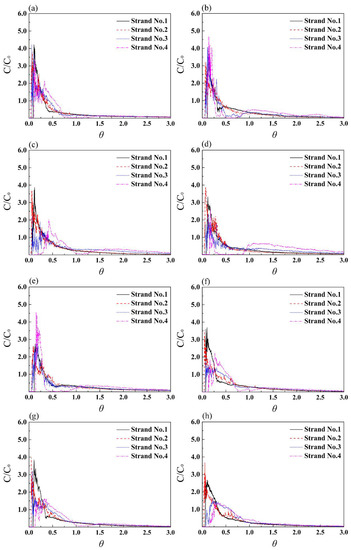
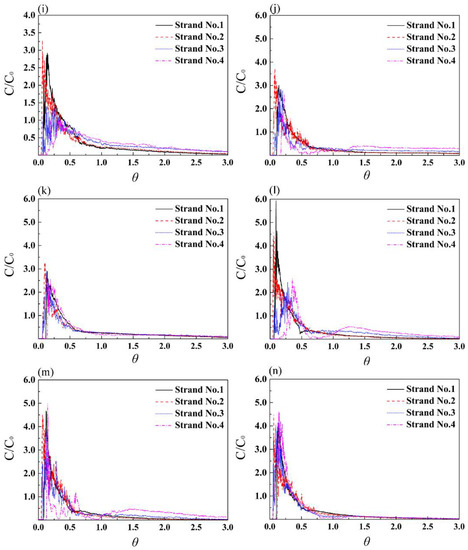
Figure 8.
RTD curves of isothermal experiment Part B: (a–n) correspond to cases B1–B14.
Comparing prototype case A0 (channel inclination 5°) with B3 (−5°), B6 (10°), B9 (−10°) and B12 (0°), their tmin,2 remains at appropriately 40 s, indicating that the channel inclination angle has less effect on the flow of strand 2. This is because the distance from the channel exit to Outlet 2 is short; only varying of the channel angle is not enough to change the flow trajectory of fluid. Comparing the tmin and Vd of these cases with different dam heights at a constant channel inclination, such as cases A0–B2, B3–B5, B6–B8, B9–B11 and B12–B14, as in Figure 9, it is seen that 160 mm of dam has a better effect on prolonging tmin than 80 mm of dam except for case B8 (α = 10°, I = 440 mm, h = 160 mm).
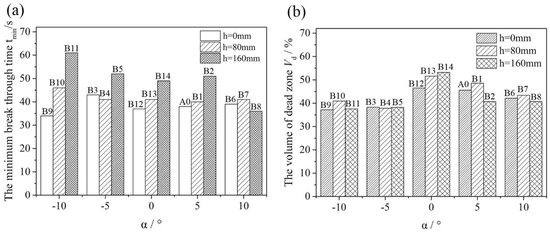
Figure 9.
Comparison of the minimum break through time (a) and the volume of dead zone (b) in isothermal experiments.
Figure 10 shows the ink dispersion behavior of case B8. As the dam is lower, the ink from the channel can pass across the dam and reaches the second outlet as in Figure 10b,c. This result indicates that the flow characteristics of the fluid can be optimized by elevating the heights of dam and induction channel. In addition, the Vd of cases B1–B14 remains at 37.19–53.18% (Figure 9b); no obvious improvement in Vd has been shown, compared with the prototype structural case A0 (Vd = 45.57%). For this reason, the other schemes for the optimization of the tundish have been presented with an elevated channel and dam, which is given in the following experiment Part C.
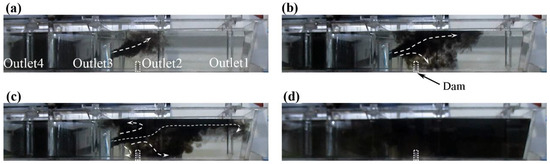
Figure 10.
Ink dispersion behavior in case B8: (a) 30 s, (b) 68 s, (c) 95 s, (d) 309 s.
(2) Part C
The flow characteristic parameters in isothermal experiment part C are shown in Table 10, and their RTD curves are in Figure 11.
Table 10.
Flow characteristic parameters of tundish in isothermal experiment Part C.
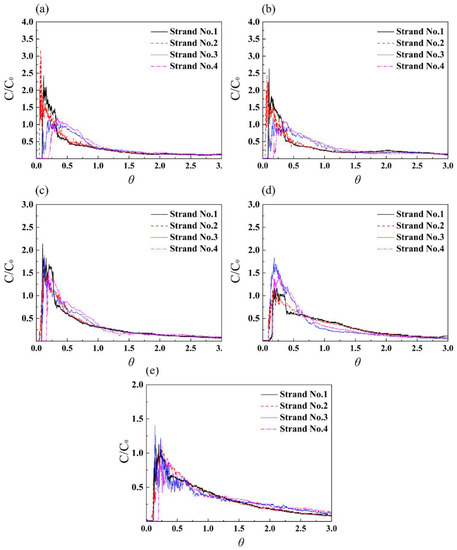
Figure 11.
RTD curves of isothermal experiment Part C: (a–e) represent cases C1–C5.
Compared with the prototype case A0, the , and of case C1 (α = 0°, I = 590 mm, without dam) are delayed by 8 s, 17 s and 135.15 s, respectively; the is decreased to 30.90% and is increased to 14.33%. Meanwhile, the peak concentration of every strand in the RTD curves is reduced, which indicates that the tracer has spread for a period of time before it flows out of the tundish. The dispersion behavior of ink in this case is shown in Figure 12. Due to the elevation of the induction channel, the tracer goes far from Outlet 2 and closer to the liquid surface, which will prolong its residence time in the tundish and shorten the floatation distance of non-metallic inclusions.
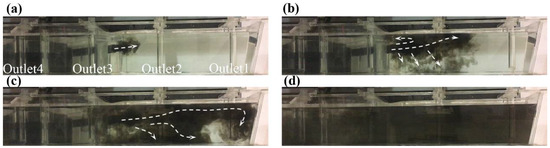
Figure 12.
Ink dispersion behavior in case C1: (a) 25 s, (b) 49 s, (c) 106 s, (d) 321 s.
From the RTD curves, the peak concentration of Strand 2 is further reduced by cases C2 (one dam) and C3 (one dam), due to the dam’s set between Outlet 2 and Outlet 3. The case C3 (α = 0°, I = 590 mm, b = 225 mm, d = 245 mm) has a little advantage over case C2 in improving fluid flow of the tundish because of the closer distance from this dam to Outlet 2. Compared with case A0, the and of case C3 are delayed by 4 s and 79 s, respectively; the flow of each strand becomes more consistent as the , and are reduced.
From Table 9, the and of cases C4 (α = 0°, I = 590 mm, a = 240 mm, b = 375 mm, c = 245 mm, d = 510 mm) and C5 (α = 0°, I = 590 mm, a = 240 mm, b = 375 mm, c = 510 mm, d = 510 mm) are delayed to a larger extent than cases C1–C3 when double dams are set between Outlet 2 and Outlet 3, and the is further decreased. Compared with case A0, the and of case C5 are delayed by 39 s and 204 s, respectively, and the is reduced by 30.16%. Moreover, the consistency of every flow is also obviously improved with the , and reducing to 42.67, 42.70 and 38.40, respectively. In addition, the C/C0 of Strand No.1 and Strand No. 2 is reduced to below 1.5, far lower than the 4.7 in case A0. The ink dispersion behavior in case C5 is shown in Figure 13. When it flows out from the channel, Dam 2 stops the ink from directly flowing to Outlet 2 (Figure 13b), while Dam 1 guides it to the “middle zone” of the tundish near Outlet 4 (Figure 13c). This flow pattern will contribute to inclusion removal in molten steel; thus, it is chosen as the optimal solution for the improvement of the industrial tundish.
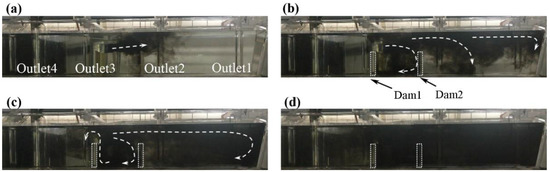
Figure 13.
Ink dispersion behavior in case C5: (a) 33 s, (b) 79 s, (c) 135 s, (d) 226 s.
4.3. Results of Mathematical Simulation
(1) Mathematical Model Verification
Figure 14 shows the comparison of RTD curves of case A0 in the numerical calculation and physical experiment. Obviously, their profiles and the peak concentrations generally remain consistent. The comparison of tracer dispersion behavior is presented in Figure 15. The flow wave profiles are pretty similar at both 38 s and 101 s, which also suggests the effectiveness of the mathematical model.
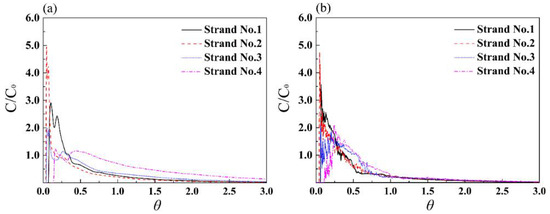
Figure 14.
Comparison of RTD curves of case A0 between simulation (a) and experiment (b).
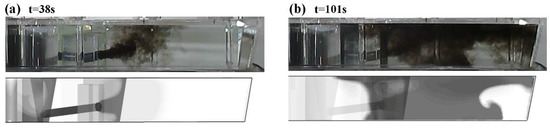
Figure 15.
Tracer dispersion comparison between experiment (upper) and simulation (below) for case A0: (a) 38 s, (b) 101 s.
(2) Velocity Field and Temperature Field with Induction Heating
Although the “upward flow” caused by the induction heating is beneficial for the improvement of flow field as indicated in the physical experiments, however, we do not know how long it will last with the heating. The temperature difference of fluid inside and outside the channel will decrease as the heating proceeds at the same electric power, which may lead to a decayed “upward flow”. To clarify the change, the velocity field and temperature field of fluid in case A1 (ΔT = 5 °C) after heating 100 s, 500 s and 5000 s at the same electric power were simulated in the present study. Figure 16 shows the comparison of velocity field of the molten steel in the vertical planes passing through the center of the channel (Figure 16a) and all the outlets (Figure 16b). Figure 17 is the comparison of the temperature field of the vertical plane passing through all the outlets at different moments.
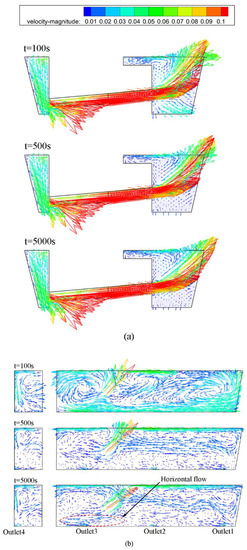
Figure 16.
Velocity fields of vertical planes of case A1: (a) vertical plane passing through the center of channel; (b) vertical plane passing through all the outlets.
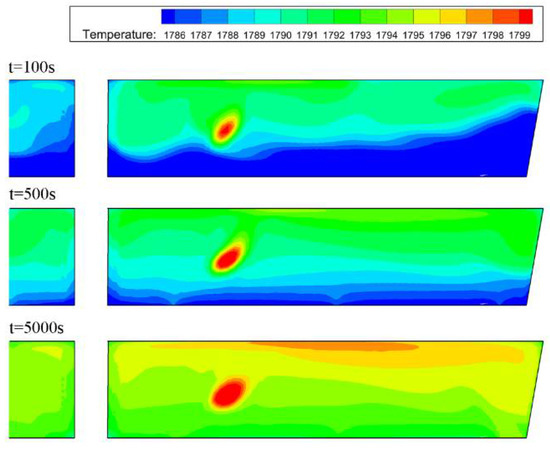
Figure 17.
Temperature fields of vertical plane passing through all the outlets.
From the outflow angle of molten steel by the induction channel exit, it is obvious that the rising trend of “upward flow” is weakened with time (Figure 16a). Due to the impact of the strong “upward flow”, several vortexes form in the tundish at 100 s (Figure 16b), and the temperature difference of molten steel from the tundish bottom to the top is larger (Figure 17); the lower temperature zones (1786–1788 K) occupy a larger area. However, with the extension of heating time, the area shrinks. When the heating time reaches 5000 s, the zone below 1791 K disappears, and the temperature difference of the whole tundish decreases. Under this circumstance, the rising trend of “upward flow” will weaken, and the fluid in the tundish will gradually transform into an isothermal flowing mode. This also suggests that the electric power of induction heating in industrial practice needs to be modified after running a period of time in order to obtain the “upward flow”.
(3) Flow Field without Induction Heating
The hydrodynamic results of experiment have indicated that the cases C1–C5 have a beneficial effect on the optimization of the flow field of the tundish, and thus, part of them is taken hereby for discussion. The velocity fields of the front side plane (the plane passing through the inner boundary “A” of the tundish in Figure 2b and perpendicular to the bottom surface) of cases A0, C1 and C5 are compared in Figure 18 and those of the bottom surface of these cases in Figure 19.
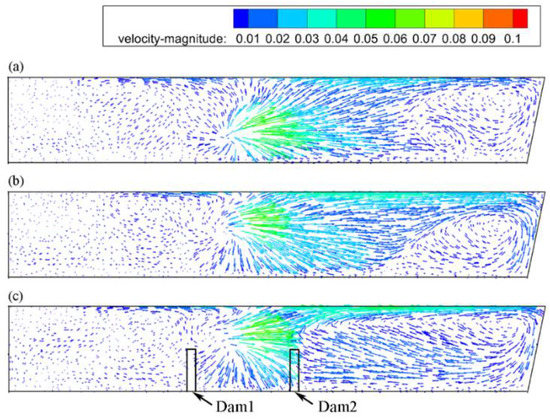
Figure 18.
Velocity fields of the front side plane: (a) case A0, (b) C1, (c) C5.
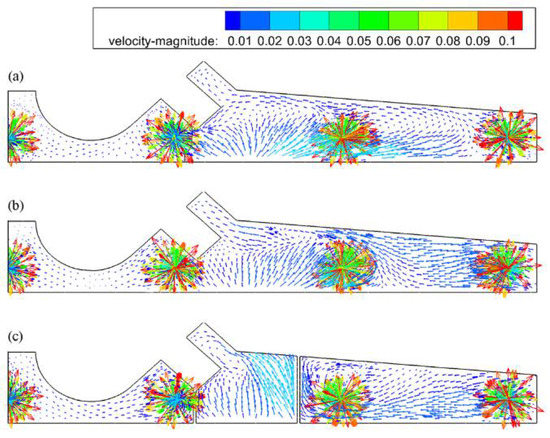
Figure 19.
Velocity fields of the bottom surface: (a) case A0, (b) C1, (c) C5.
As shown in Figure 18 and Figure 19, different cases present various velocity fields in both the front side surface and bottom surface. In the prototype case A0, the fluid from the channel exit partly flows upwards to the top surface of the tundish and diffuses to the space between Outlet 1 and Outlet 2, while the other arrives at the front side surface between Outlet 2 and Outlet 3, then directly flows to Outlet 2 at a speed of appropriately 0.03 m/s, which will generate the “short-circulating flow” at Outlet 2. The velocity of fluid between Outlet 3 and Outlet 4 is very small, being below 0.01 m/s.
In case C1, the velocity of fluid is around 0.02 m/s when it flows to Outlet 2 (Figure 18b), generally slower than case A0 due to the elevation of the induction channel exit. Additionally, the fluid has a greater tendency to flow upward and forms the clockwise circulation in the upper region of Outlet 1 and Outlet 2 (Figure 18b). For case C5, because of the obstacle of Dam 2, most fluid does not directly flow to Outlet 2, while it flows upwards firstly through Dam 2, then downwards to the tundish interior as shown in Figure 18c. The result is in agreement with the ink modelling in Figure 13. This flow pattern will prolong the residence time of the molten steel and shorten the floating distance of non-metallic inclusions, as well as further improve the cleanliness of molten steel.
4.4. Inclusion Removal Behavior
To assess the optimized tundish structure and the effect of induction heating on the non-metallic inclusions, the removal ratios of different sizes of inclusions in cases A0, C1, C3, C4, C5 and A4 (with induction heating) were simulated, and the results are presented in Figure 20.
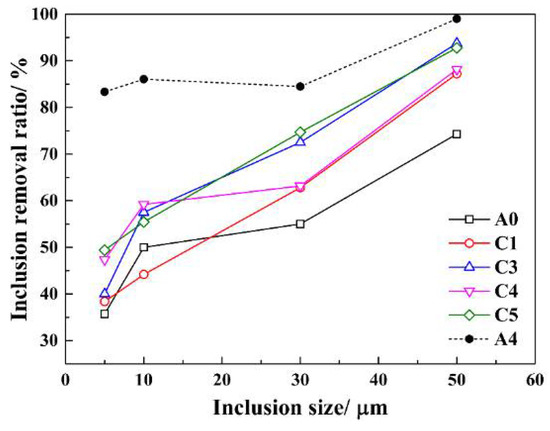
Figure 20.
Comparison of removal ratios of different sizes of inclusions under various cases.
It is seen that the removal ratio of inclusions generally increases with its increasing size. For the cases without induction heating, the removal ratios of 5 and 10 μm of inclusions are below 60%. The reason can be explained by the Stokes law [29]. The smaller the inclusion size is, the slower the speed to remove from the tundish.
Comparing these cases, the removal effect of cases C3 and C5 is generally superior to C1 and C4, and obviously superior to case A0, as the setting of the dam prolongs the residence time of molten steel in the tundish and shortens its floating distance.
To further explain the removal mechanism of different particle sizes of inclusions, their motion track lines in case A0 were simulated and shown in Figure 21. The number of track lines in the channel is fixed as 25 for every particle size.
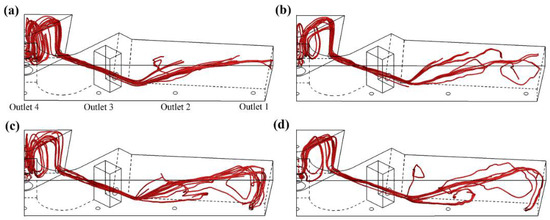
Figure 21.
Path of different sizes of inclusions in case A0: (a) 50 μm, (b) 30 μm, (c) 10 μm, (d) 5 μm.
It is obvious that their motions vary after outflowing from the channel. The inclusions of 50 μm in size move upwards to the liquid surface and will be trapped by the slag layer; thus, its removal ratio is higher than the other sizes. However, for the inclusions in 5 and 10 μm, although some of them can arrive at the top surface of molten steel, they will again return to the molten steel if the slag cannot absorb them quickly and effectively, from Figure 21c,d. Moreover, some of them cannot float to the top surface, which may be driven by the “short-circulating flow” directly to Outlet 2 (without dam in case A0). This is also the reason why the removal ratios of 5- and 10-μm inclusions in case A0 are lower than those in cases C3–C5 with dams.
From Figure 21, the removal ratio of every particle size of inclusions can be significantly improved by induction heating (case A4), especially for small-sized inclusions. The removal ratios of 5- and 10-μm inclusions exceed 80%, while 50-μm inclusions are removed almost completely. This is due to the “upward flow” from induction heating directly carrying these inclusions to the top surface of the tundish and making them entrapped by the slag. The above studies also indicate that the inner structure of the tundish not only affects the flowing of molten steel, but also the removal of inclusions; thus, it is of great necessity to optimize it.
It should be pointed out that the calculated values of the removal ratios of inclusions in number may be larger than the actual due to the simplified model assumption. The removal process of inclusions mainly consists of three linked steps, which are growing, floating up and separating. The separating process, as the last step of inclusion removal, is even the restrictive link in many cases. This process is closely related to the speed of inclusions floating to the slag, the interfacial tension between inclusions and the slag layer and the physical and chemical performances of the slag [30,31,32,33]. In our present study, these factors have not been taken into consideration. We assume that the inclusion will be removed as long as it reaches the free surface; thus, the removal ratio might be larger than the actual. However, this simulation can be used to explain the removal mechanism and compare the differences among various cases. By the above physical modelling and numerical simulation, case C5 has been chosen as the optimized structure for industrial improvement, and its profitable effect has been confirmed, which will be reported in further work.
5. Conclusions
Hydrodynamic modeling and mathematical simulation have been carried out to reveal the fluid flow and inclusion removal behavior for an innovative casting tundish with channel type induction heating. The reasonable structural parameters in the seven-strand tundish with consideration of the channel heating effect have been given based on both isothermal and non-isothermal service situations. The main conclusions can be summarized as follows:
- (1)
- The non-isothermal experiment and mathematical simulation show that the fluid presents an obvious rising tendency when it flows out from the heating induction channel. The larger the temperature difference inside and outside the channel is, the more consistent will be the fluid flows among different strands, and the more homogeneous the flow field in the tundish. For the prototype tundish, when the temperature difference is 5 °C, the dead zone is basically eliminated, and the residence time of fluid is prolonged by 300 s. The rising trend of fluid will decay with the further elongation of the heating time to 5000 s. Under this case, the non-isothermal flow will be developed into an isothermal flow.
- (2)
- The isothermal experiments suggest that the prototype tundish has severe “short-circuiting flow” in the second and sixth strands, which has led to the increased number of inclusions in the local billets. Changing the channel inclination and setting dams exerts little effect on the flow characteristics of fluid when the height of the channel exit is lower than 440 mm and the dead zone volume of the tundish remains as 37.19–53.18%. When the channel exit is elevated to 590 mm and the inclination remains at zero degrees, the flow field of the tundish can be greatly improved by adding two high dams at each side of the tundish. Compared with the prototype structure, the average residence time of the optimized case C5 is prolonged by 278 s, and the dead zone volume fraction is reduced by 30.16%.
- (3)
- The removal ratio of inclusions can be improved by the optimization of flow fields with consideration of the heating channel effect. The motion tracks of various sizes of inclusions differ at the exit of the channel. The larger size inclusions move upwards to the liquid surface and are directly trapped by the slag layer, while the small sizes cannot be absorbed by the top slag completely due to the back flow observed, which partly explains the reason for the small size inclusions being difficult to remove. It is shown that induction heating can significantly improve the removal ratio of different sizes of inclusions due to the thermal buoyancy force, especially for small-sized inclusions.
Author Contributions
H.T. wrote this manuscript and designed and performed some of the experiments. L.G. performed some experiments and analyzed the data. G.W., H.X. and H.Y. performed some experiments and simulations. J.Z. guided the whole study and revised the manuscript.
Acknowledgments
This research was financially supported by Beijing Natural Science Foundation (No. 2182038) and the National Key Research and Development Program of China (No. 2017YFB0304000).
Conflicts of Interest
The authors declare no conflict of interest.
References
- Mao, B.; Tao, J.M.; Jiang, T.X. Tundish channel type induction heating technology for continuous casting. Contin. Cast. 2008, 5, 4–8. [Google Scholar]
- Singh, V.; Ajmani, S.K.; Pal, A.R.; Singh, S.K.; Denys, M.B. Single strand continuous caster tundish furniture comparison for optimal performance. Ironmak. Steelmak. 2012, 39, 171–179. [Google Scholar] [CrossRef]
- Mazumdar, D.; Guthrie, R.I.L. The physical and mathematical modelling of continuous casting tundish systems. ISIJ Int. 1999, 39, 524–547. [Google Scholar] [CrossRef]
- Merder, T.; Warzecha, M. Optimization of a six-strand continuous casting tundish: Industrial measurements and numerical investigation of the tundish modifications. Metall. Trans. B 2012, 43, 856–868. [Google Scholar] [CrossRef]
- Sheng, D.Y.; Kim, C.S.; Yoon, J.K. Water model study on convection pattern of molten steel flow in continuous casting tundish. ISIJ Int. 1998, 38, 843–851. [Google Scholar] [CrossRef]
- Tang, H.Y.; Yu, M.; Li, J.S. Numerical and physical simulation on inner structure optimization of a continuous casting tundish and its metallurgical effect. J. Univ. Sci. Technol. B 2009, 31, 38–42. [Google Scholar]
- Koria, S.C.; Singh, S. Physical modeling of the effects of the flow modifier on the dynamics of molten steel flowing in a tundish. ISIJ Int. 1994, 34, 784–793. [Google Scholar] [CrossRef]
- Hsiao, T.C.; Peng, S.H.; Cheng, N.L. Steel continuous casting tundish—A type non-isothermal metallurgical reactor. J. Northeast. Univ. 2000, 21, 408–411. [Google Scholar]
- Tang, H.Y.; Li, J.S.; Gao, J.G.; Ning, J.C.; Zuo, Z.; Tian, H.P. Effect of flow control devices of tundish on cleanliness of billets. J. Iron. Steel. Res. Int. 2008, 15, 499–504. [Google Scholar]
- Yang, X.M.; Liu, S.X.; Jiao, J.S.; Zhang, M.; Duan, J.P.; Li, L.; Liu, C.Z. Hydrodynamic modeling and mathematical simulation of flow field and temperature profile for molten stainless steel in an asymmetrical T-type single-strand continuous casting tundish with arch or round hole(s) at dam bottom. Steel. Res. Int. 2012, 83, 269–287. [Google Scholar] [CrossRef]
- Zhong, L.C.; Li, B.K.; Zhu, Y.X. Fluid flow in a four-strand bloom continuous casting tundish with different flow modifiers. ISIJ Int. 2007, 47, 88–94. [Google Scholar] [CrossRef]
- Wang, B.; Zhang, J.; Fan, J.; Zhao, S.; Fang, Y.S. An water modeling of twin–roll strip casting. J. Iron. Steel. Res. Int. 2006, 13, 14–17. [Google Scholar] [CrossRef]
- Qi, X.; Bao, Y. Physical simulation of liquid steel flowage in tundish for six-strand billet and metallurgical effect. J. Iron. Steel. Res. 2006, 18, 11–15. [Google Scholar]
- Zhong, L.C.; Zhang, L.; Huang, Y.W.; Yang, S.B.; Zhu, Y.X.; Jiang, M.F. Influence of various turbulence inhibitor on fluid flow behavior in tundish. J. Iron. Steel. Res. 2002, 12, 6–9. [Google Scholar]
- Chakraborty, S.; Sahai, Y. Effect of varying ladle stream temperature on the melt flow and heat transfer in continuous casting tundishes. ISIJ Int. 1991, 31, 960–967. [Google Scholar] [CrossRef]
- Chakraborty, S.; Sahai, Y. Mathematical modelling of transport phenomena in continuous casting tundishes II. Transient effects owing to varying ladle stream temperature. Ironmak. Steelmak. 1992, 19, 488–494. [Google Scholar]
- Jha, P.K.; Rao, P.S.; Dewan, A. Effect of height and position of dams on inclusion removal in a six strand tundish. ISIJ Int. 2008, 48, 154–160. [Google Scholar] [CrossRef]
- Joo, S.; Han, J.W.; Guthrie, R.I.L. Inclusion behavior and heat-transfer phenomena in steelmaking tundish operations part 2. Mathematical model for liquid steel in tundishes. Metall. Trans. B. 1993, 24, 767–777. [Google Scholar] [CrossRef]
- Debroy, T.; Sychterz, J.A. Numerical calculation of fluid flow in a continuous casting tundish. Metall. Trans. B. 1985, 16, 497–504. [Google Scholar] [CrossRef]
- Ueda, T.; Ohara, A.; Sakurai, M. A Tundish Provided with a Heating Device for Molten Steel. EU Patent 84301814.4, 3 March 1984. [Google Scholar]
- Mabuchi, M.; Yoshii, Y.; Nozaki, T.; Kakiu, Y.; Kakihara, S.; Ueda, N. Investigation of the purification of molten steel by using tundish heater: Development on the controlling method of casting temperature in continuous casting V. ISIJ Int. 1984, 70, 118. [Google Scholar]
- Miura, R.; Nisihara, R.; Tanaka, H.; Takasaki, Y.; Imoto, T. Tundish induction heater of No. 2 continuous caster at Yawata works. ISIJ Int. 1995, 81, T30–T33. [Google Scholar]
- Wang, Q.; Li, B.K.; Tsukihashi, F. Modeling of a thermo-electromagneto-hydrodynamic problem in continuous casting tundish with channel type induction heating. ISIJ Int. 2014, 54, 311–320. [Google Scholar] [CrossRef]
- Wang, Q.; Shi, Y.M.; Li, Y.M.; Li, B.K. Inclusions behavior and removal in tundish with induction heating. J. Northeast. Univ. 2014, 35, 1442–1446. [Google Scholar]
- Yue, Q.; Zhang, C.B.; Pei, X.H. Magnetohydrodynamic flows and heat transfer in a twin-channel induction heating tundish. Ironmak. Steelmak. 2016, 44, 227–236. [Google Scholar] [CrossRef]
- Zhang, L.; Taniguchi, S.; Cai, K. Fluid flow and inclusion removal in continuous casting tundish. Metall. Trans. B 2000, 31, 253–266. [Google Scholar] [CrossRef]
- Sahai, Y.; Emi, T. Melt flow characterization in continuous casting tundishes. ISIJ Int. 1996, 36, 667–672. [Google Scholar] [CrossRef]
- Lei, H.; Geng, D.; He, J.A. Continuum model of solidification and inclusion collision-growth in the slab continuous casting caster. ISIJ Int. 2009, 49, 1575–1582. [Google Scholar] [CrossRef]
- Sheng, D.Y.; Söder, M.; Jönsson, P.; Jonsson, L. Modeling micro-inclusion growth and separation in gas-stirred ladles. Scand. J. Metall. 2002, 31, 134–147. [Google Scholar] [CrossRef]
- Chikama, H.; Shibata, H.; Suzuki, M.; Emi, T. In-situ observation of solidification by using a confocal laser microscope. CAMP ISIJ 1995, 8, 1128–1133. [Google Scholar]
- Chikama, H.; Shibata, H.; Emi, T.; Suzuki, M. In-situ real time observation of planar to cellular to dendritic transition of crystals growing in Fe-C alloy melts. Mater. Trans. 2007, 37, 620–626. [Google Scholar] [CrossRef]
- Yin, H.; Shibata, H.; Emi, T.; Suzuki, M. In-situ observation of collision, agglomeration and cluster formation of alumina inclusion particles on steel melts. ISIJ Int. 1997, 37, 936–945. [Google Scholar] [CrossRef]
- Yin, H.; Shibata, H.; Emi, T.; Suzuki, M. Characteristics of agglomeration of various inclusion particles on molten steel surface. ISIJ Int. 2007, 37, 946–955. [Google Scholar] [CrossRef]
© 2018 by the authors. Licensee MDPI, Basel, Switzerland. This article is an open access article distributed under the terms and conditions of the Creative Commons Attribution (CC BY) license (http://creativecommons.org/licenses/by/4.0/).