Article

Dependence of Macro- and Micro-Properties on α Plates in Ti-6Al-2Zr-1Mo-1V Alloy with Tri-Modal Microstructure

1
School of Material Science and Engineering, China University of Mining and Technology, Xuzhou 221116, China
2
School of Materials Science and Engineering, Northwestern Polytechnical University, Xi’an 710072, China
*
Author to whom correspondence should be addressed.
Metals 2018, 8(5), 299; https://doi.org/10.3390/met8050299
Submission received: 30 March 2018 / Revised: 22 April 2018 / Accepted: 23 April 2018 / Published: 26 April 2018

Abstract

:
Tri-modal microstructure is often the target microstructure of titanium alloy components. In this study, the parameters, such as volume fraction, size of primary equiaxed α (αp), secondary lamellar α (αs) and thin α plates (αt) in tri-modal microstructure of Ti-6Al-2Zr-1Mo-1V alloy are adjusted by double heat treatment procedures. The properties of these constituent phases and their effect on the macro-properties are then investigated. The results show that the hardness of primary α (αp) varies slightly with heat treatment routes. The hardness of α plates region including αs and αt increases with increasing αt volume fraction and not with decreasing thickness of αs and αt. Using volume average of the thickness of αs and αt as effective thickness (teff), the hardness of α plates region and teff follow the Hall-Petch relationship. Meanwhile, as αt volume fraction increases, colony structure of αs is gradually destroyed, which makes each αs have large deformation degree by multiple directions slip. When volume fraction ratio of αp, αs and αt is about 1:1:1, αp and αs can undergo relatively large deformation and αt can contribute relatively large strength to the alloy and therefore the alloy has both good strength and ductility.

1. Introduction

Titanium alloys are widely used to produce key bearing components, such as bulkhead [1] and landing gear forgings [2] in the aviation and aerospace industries. To meet the severe working conditions, excellent mechanical properties are required for these components. Mechanical properties are essentially dependent on the microstructures of titanium alloys. Tri-modal microstructure of titanium alloys (consisting of primary equiaxed α, αp, secondary lamellar α, αs, and transformed β matrix with thin α plates, αt, and residual β phase) which possesses the properties advantages of both bi-modal and widmanstätten microstructures, could meet the high service requirement and is often the target microstructure of titanium alloy components [3,4].
In tri-modal microstructure, there exist three α phases, namely αp, αs and αt, which are normally obtained by multiple processing steps, such as near-β rolling followed by solution and aging treatments [4], near-β forging and subsequent high and low temperature heat treatments [5]. In each processing step, these α phases would undergo complex transformations including precipitation, dissolve, and growth. After a series of transformations, the morphology, size, volume fraction and distribution of the three α phases would present different features and have different effects on the mechanical properties of final material. Moreover, the transformations of the three α phases are interrelated and therefore the evolutions of their parameters interact with each other. For example, as the deformation or heat treatment temperatures increase in the (α + β) phase field, the volume fraction of αp decreases and the volume fraction of αs increases correspondingly due to allotropic α/β phase transformation [6]. This interaction is more complex for tri-modal microstructure as compared to bi-modal and widmanstätten microstructures, since it has more types of α phase. Besides, the composition and defect density in α phases would also vary during their transformations. Normally, αp has a higher content of α stable element than αs due to alloy element partitioning effect [7,8], while αs contains a higher initial dislocation density compared to αp [9,10]. Due to the difference in solid solution and dislocation strengthening, α phases in tri-modal microstructure would show different properties. The properties evolution of α phases combined with the variation of their morphology, size, volume fraction and distribution would have complex effect on macroscopic properties of titanium alloys. Therefore, to obtain high-performance tri-modal microstructure, it is urgent to understand the evolution of three α phases and their effects on the mechanical properties of titanium alloys.
By now, some efforts have been spent on investigating the evolution of tri-modal microstructure. It is found that volume fraction of αp in tri-modal microstructure is influenced by the forging temperature and the subsequent heat treatment; however, to maintain about 15% αp in the final tri-modal microstructure, the forging temperature should at 10–20 °C below the β-transus temperature, namely near-β forging [3]. The volume fraction and thickness of αs are mainly affected by the difference of deformation or heat treatment temperatures between the first and second processing steps during producing tri-modal microstructure [11]. However, the evolution of αt in transformed β matrix and its correlation with αp and αs needs further investigation.
The evolution of α phases in tri-modal microstructure have a significant effect on the mechanical properties of titanium alloys. As the content of αp in tri-modal microstructure increases, the ultimate tensile strength (UTS) of the alloy decreases and the elongation increases [12]. However, it is pointed that when the content of αp is approximate 15–20%, tri-modal microstructures have the best comprehensive mechanical properties, since too much αp is detrimental to some mechanical properties, such as fracture toughness and resistance to the crack propagation [3,5]. Therefore, it is more important to study the effect of α plates on the mechanical properties of titanium alloys. Thin α plates are much harder than β phase due to their small size and hard to deform [13]. Besides, thin α plates produce a high number of α/β interfaces and have an attractive reinforcing effect to alloy [14]. While, large amount of dislocations can be activated and accumulated in thick α plates, which is helpful to improve the ductility of alloy [15]. Semiatin et al. [16] and Chen et al. [17] found that the thickness of α plates and the strength of titanium alloys follows a Hall-Petch relationship. These works investigated the effect of α plates thickness on the mechanical properties of titanium alloys. However, there exist αs and αt with different thicknesses in tri-modal microstructure and their effects on the mechanical properties of titanium alloys still need further study.
In this paper, tri-modal microstructures of TA15 (Ti-6Al-2Zr-1Mo-1V) alloy with about 20% αp and varied αs and αt contents are produced by double heat treatment procedures. The hardness of the microstructural constituents is investigated by indentation tests. The macroscopic properties of the alloy are studied based on the content, size, distribution, and properties of the microstructural constituents. It will deepen the understanding of the effect of microstructure on properties and provide a basis for microstructural design of titanium alloys.

2. Materials and Methods

The experimental material in this study is a TA15 alloy. The chemical composition (wt %) of the alloy is 6.69 Al, 2.26 Zr, 1.77 Mo, 2.25 V, 0.14 Fe, and balance Ti. The β-transus temperature of the alloy is 985 °C identified by a metallographic technique. The TA15 alloy is received in hot rolled plate form and the initial microstructure of the alloy consists of approximately 50% αp within the transformed β matrix.
To obtain tri-modal microstructures, double heat treatment procedures (as listed in Table 1) are carried out on TA15 alloy samples machined from the as-received plate. The samples are cuboid and their size is 130 mm × 25 mm × 11 mm. During procedure of first step heat treatment (FSH), the samples coated with a borosilicate glass paste were first heated to 965 °C in the near-β temperature range at a rate of 12 °C/min, soaked for 30 min to achieve thermal equilibration and then air cooled. Subsequently, during procedure of second step heat treatment (SSH), the samples were reheated to 10, 25 and 40 °C below the FSH temperature and then water quenched for S1, S2 and S3, respectively. The sample S4 was not carried out the SSH and was used to compare with the samples S1, S2 and S3. Finally, all the samples were annealed at 810 °C for 1 h and air cooled to stabilize microstructures.
After heat treatment, the samples were sectioned using wire-electrode cutting to produce metallographic samples. Metallographic preparation of the samples was carried out by mechanical grinding with SiC paper, polishing with colloidal silica and etching with the corrosive solution of 13% HNO3 + 7% HF + 80% H2O. The microstructures were examined by VEGA TESCAN scanning electron microscope (SEM, TESCAN, Brno, Moravia, Czech Republic) equipped with energy dispersive X-ray spectrometer (EDX) and FEI Tecnai F30 transmission electron microscope (FEI, Hillsboro, OR, USA). The parameters of the microstructural feature were measured by IPP software packages (6.0, MC, Rockville, MD, USA). The aspect ratio of αp was determined by the ratio of its average horizontal and vertical intercept lengths.
The hardness of the microstructural constituents, namely αp and α plates region including αs and αt was examined by indentation tests. Indentation experiments were carried out using a Switzerland CSM instrument (CSM, Peseux, Neuenburg, Switzerland) with a Berkovich indenter. The maximum loads for αp and α plates are 25 mN and 200 mN, respectively. To avoid the effect of grain boundary, the indentation tests were performed at the center of each microstructural constituents. For each microstructural constituent, five indentation tests were carried out and the averaged value was taken as the result. The indentation load-displacement curves were used to calculate the hardness of microstructural constituents based on the Oliver-Pharr method [18]:
H = P/Ac
where P is the applied indentation load and the Ac is the contact area between an indenter and indented material at load P.
Uniaxial tension tests were used to determine the strength and elongation of the heat treated TA15 sample. The gauge length of the tensile samples is 35 mm and the thickness is 2 mm. Tension tests were performed at room temperature at a velocity of 2 mm/min using a CMT-5205 electric universal testing machine (SANS, Shenzhen, Guangdong, China). The strains were measured with a contact extensometer. The testing procedure was according to ISO 6892. Three tensile samples per heat treatment condition were tested for an average value of the UTS and elongation.

3. Results and Discussion

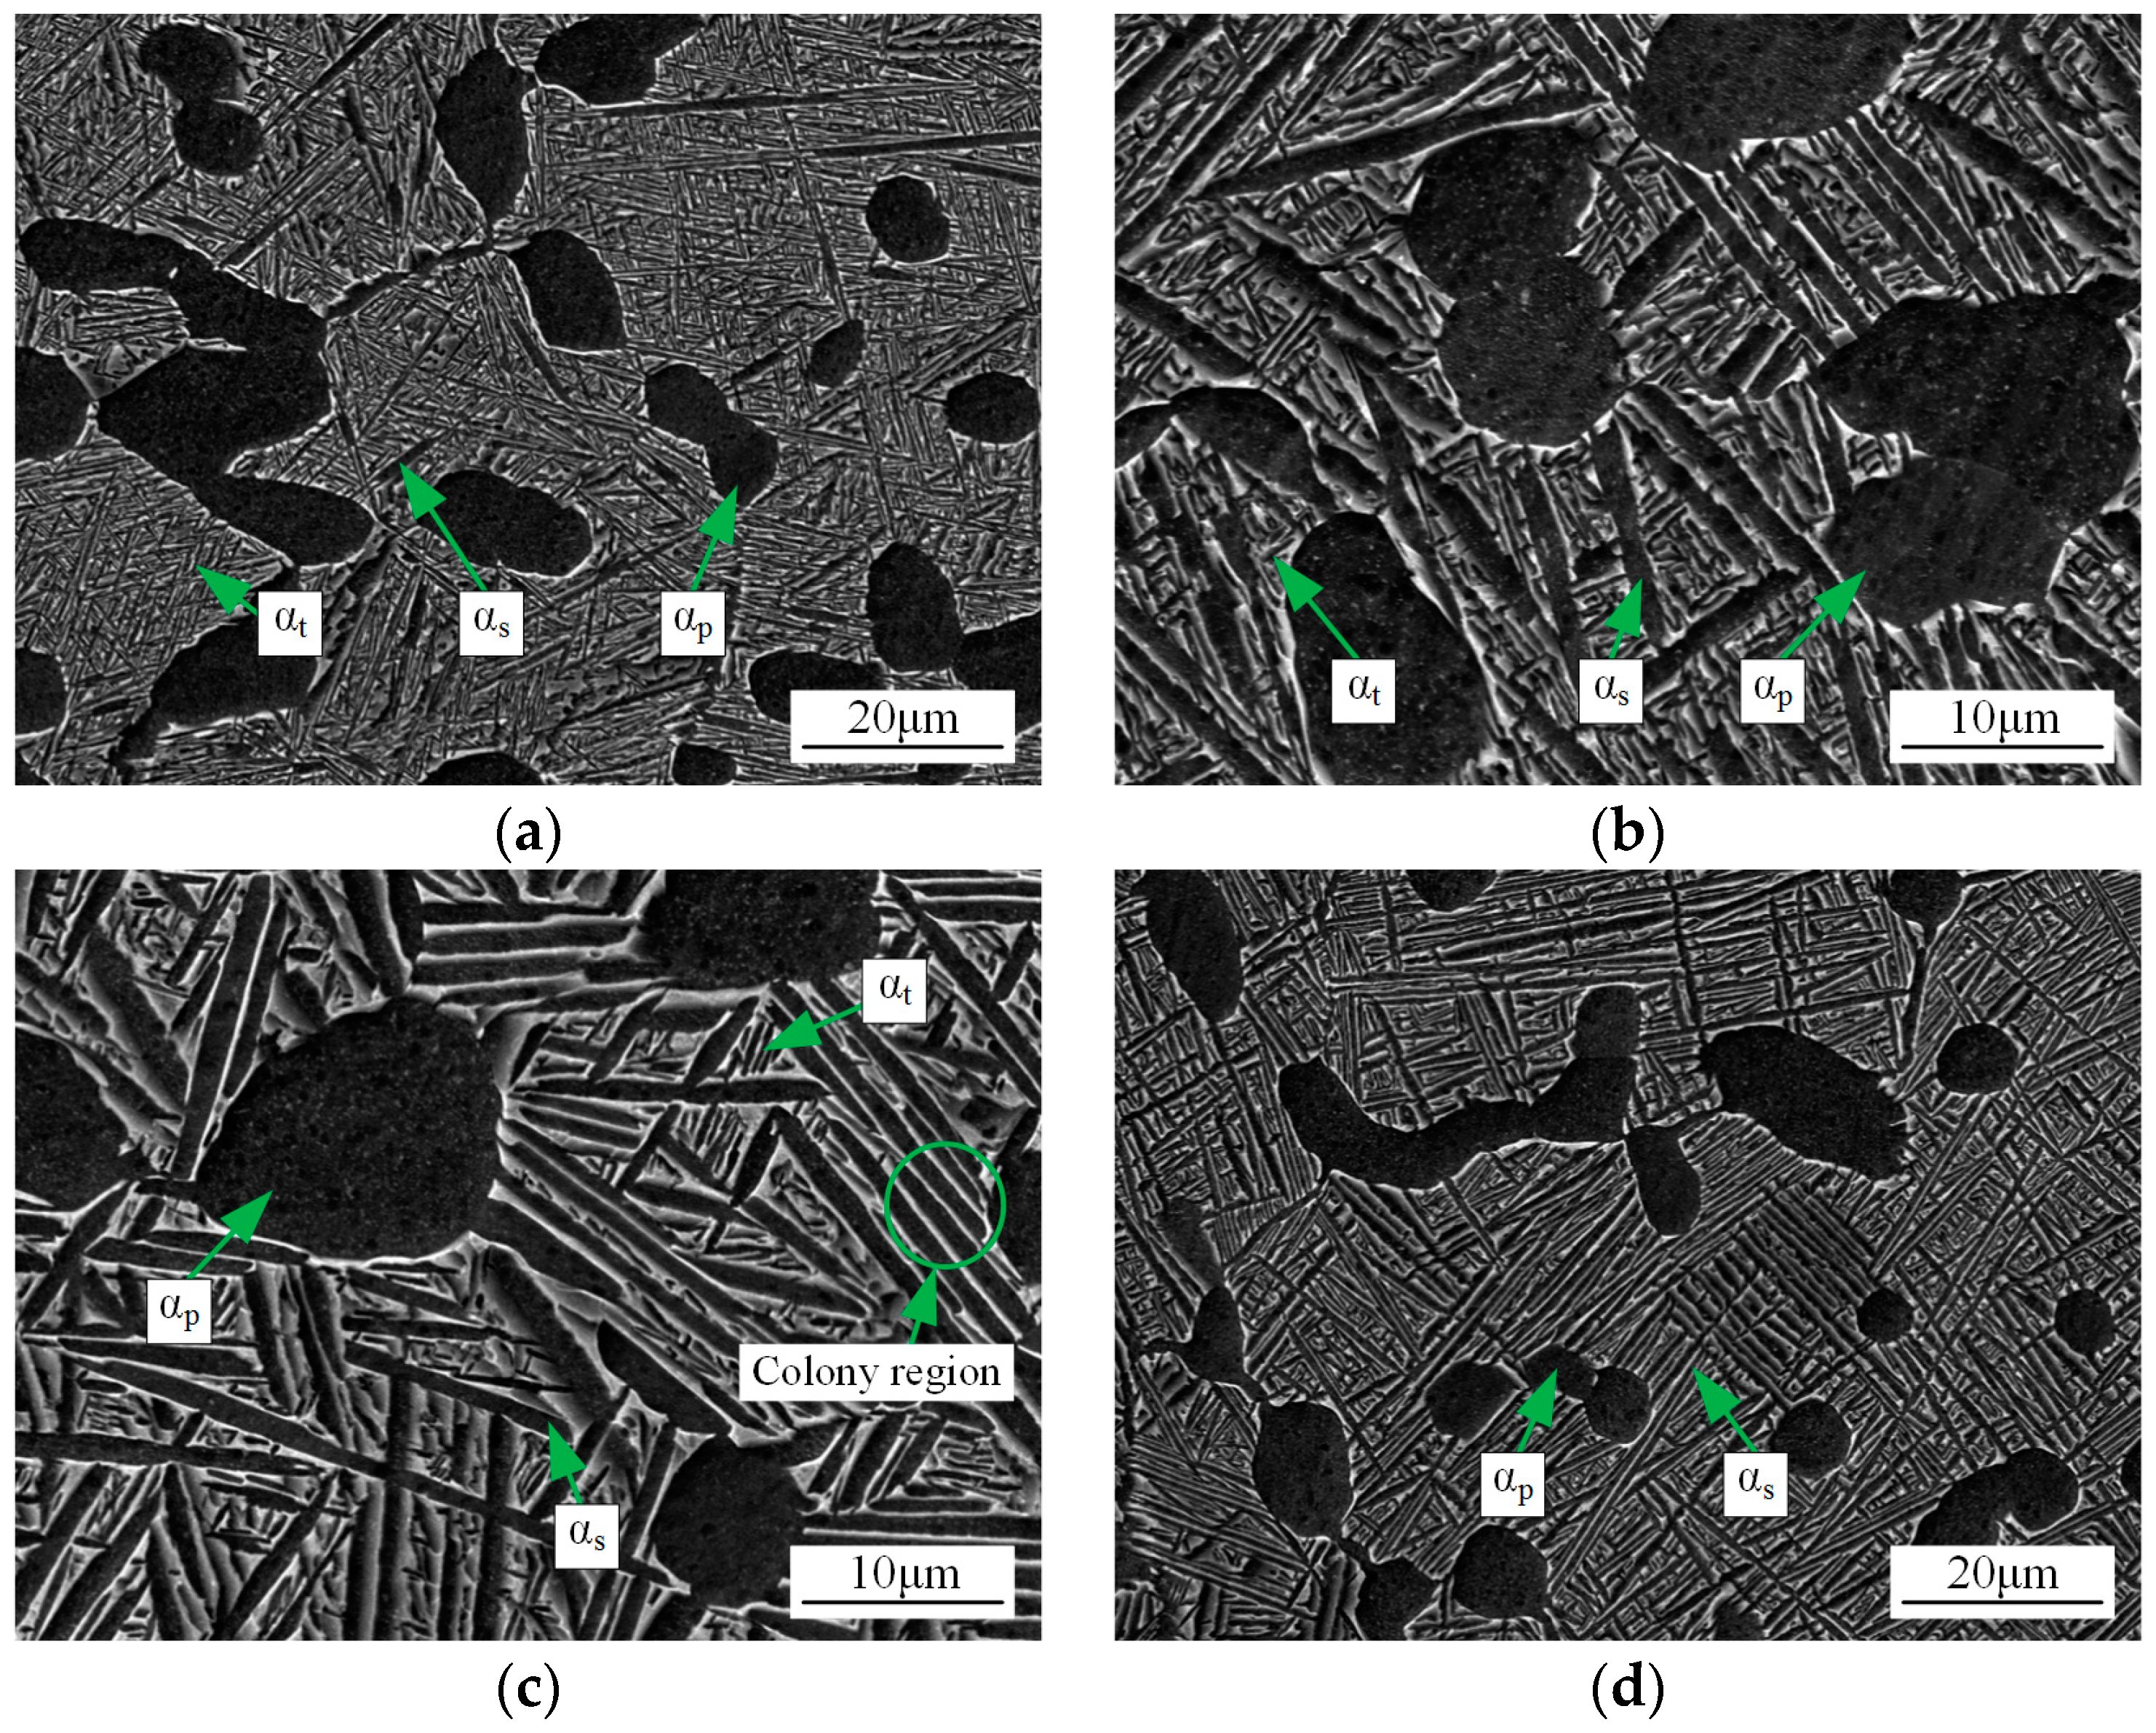
3.1. Microstructural Investigation

The microstructures of the alloy after different heat treatment routes are shown in Figure 1. After FSH and SSH, the microstructure consists of αp, αs and transformed β matrix with αt and residual β phase, which is tri-modal microstructure (see Figure 1a–c for S1, S2 and S3, respectively). The bi-modal microstructure consisting of αp and transformed β matrix is achieved for S4 (see Figure 1d).
The sample S4 undergoes FSH and annealing. It is well known that when two phase titanium alloys are air cooled from (α + β) phase field, bi-modal microstructure is obtained [8]. The volume fraction of αp is mainly determined by heat treatment temperature and annealing may increase αp volume fraction to some extent [19]. The lamellar αs would precipitate during air cooling process after heat treatment. These αs plates are parallel to each other and form colony. Since the FSH of the four samples is same, the microstructures of samples S1, S2 and S3 are similar to S4 after FSH.
During heating procedure of SSH, αp and αs in bi-modal microstructure gradually transform to β phase. However, the transformation degree of these two α phases are different. During formation of bi-modal microstructure, Al which is the main α stable element in TA15 alloy, is enrichment in αp as compared to αs. The energy dispersive X-ray analysis shows that the average Al content is 8.01 ± 0.26 wt % in αp and is 6.49 ± 0.29 wt % in αs. In fact, the Al content in each αp particle is inhomogeneous. The interior of αp particle has a higher Al content than rim part [20]. The higher Al content makes αp more stable. Therefore, during heating procedure of SSH, the transformation degree of αs is larger than αp. The αs may transform to β phase completely and partly αp would be retained when heating temperature of SSH approaches to that of FSH. Therefore, the microstructure may be αp, αs and high-temperature β matrix at SSH temperature. After SSH, the samples were water quenched to room temperature. The high cooling rate of water quenching would inhibit the growth of αp and αs and lead to transformation of high-temperature β phase to martensitic microstructure. During the final annealing, the martensitic microstructure would decompose into thin α plate and αp and αs would grow. Through above process routes, tri-modal microstructures are obtained.
The measured microstructural parameters are given in Table 2. The volume fraction and size of αp are relatively larger in S1, S2 and S3 as compared to that in S4. On one hand, the volume fraction and size of αp are decreased during heating of SSH due to α → β transform. On the other hand, water quenching after SSH provides driving force for growth of αp during annealing. The coupling effect results in that the volume fraction and size of αp are larger in S1, S2 and S3. The aspect ratio of αp varies little with heat treatment routes. The volume fraction of αs decreases with increasing SSH temperature and the volume fraction of αt increases correspondingly. The decrease rate of αs volume fraction increases as SSH temperature increases. When SSH temperature is 10 °C below the FSH temperature, the volume fraction of αs is very small (5.12%). The thicknesses of both αs and αt increase with SSH temperature due to larger driving force for their growth provided by water quench after higher temperature.
It is interesting to note that a part of α colony can keep their morphology having no αt between αs at lower SSH temperature (see Figure 1c). As SSH temperature increases, almost all αt distributes between αs and the colony structure is destroyed (see Figure 1b). This indicates that each αs in α colony has different stabilities and the high stability and low stability αs are alternatively distributed in α colony. The low stability αs transforms to β phase during heating procedure of SSH and then αt is formed between high stability αs during annealing.

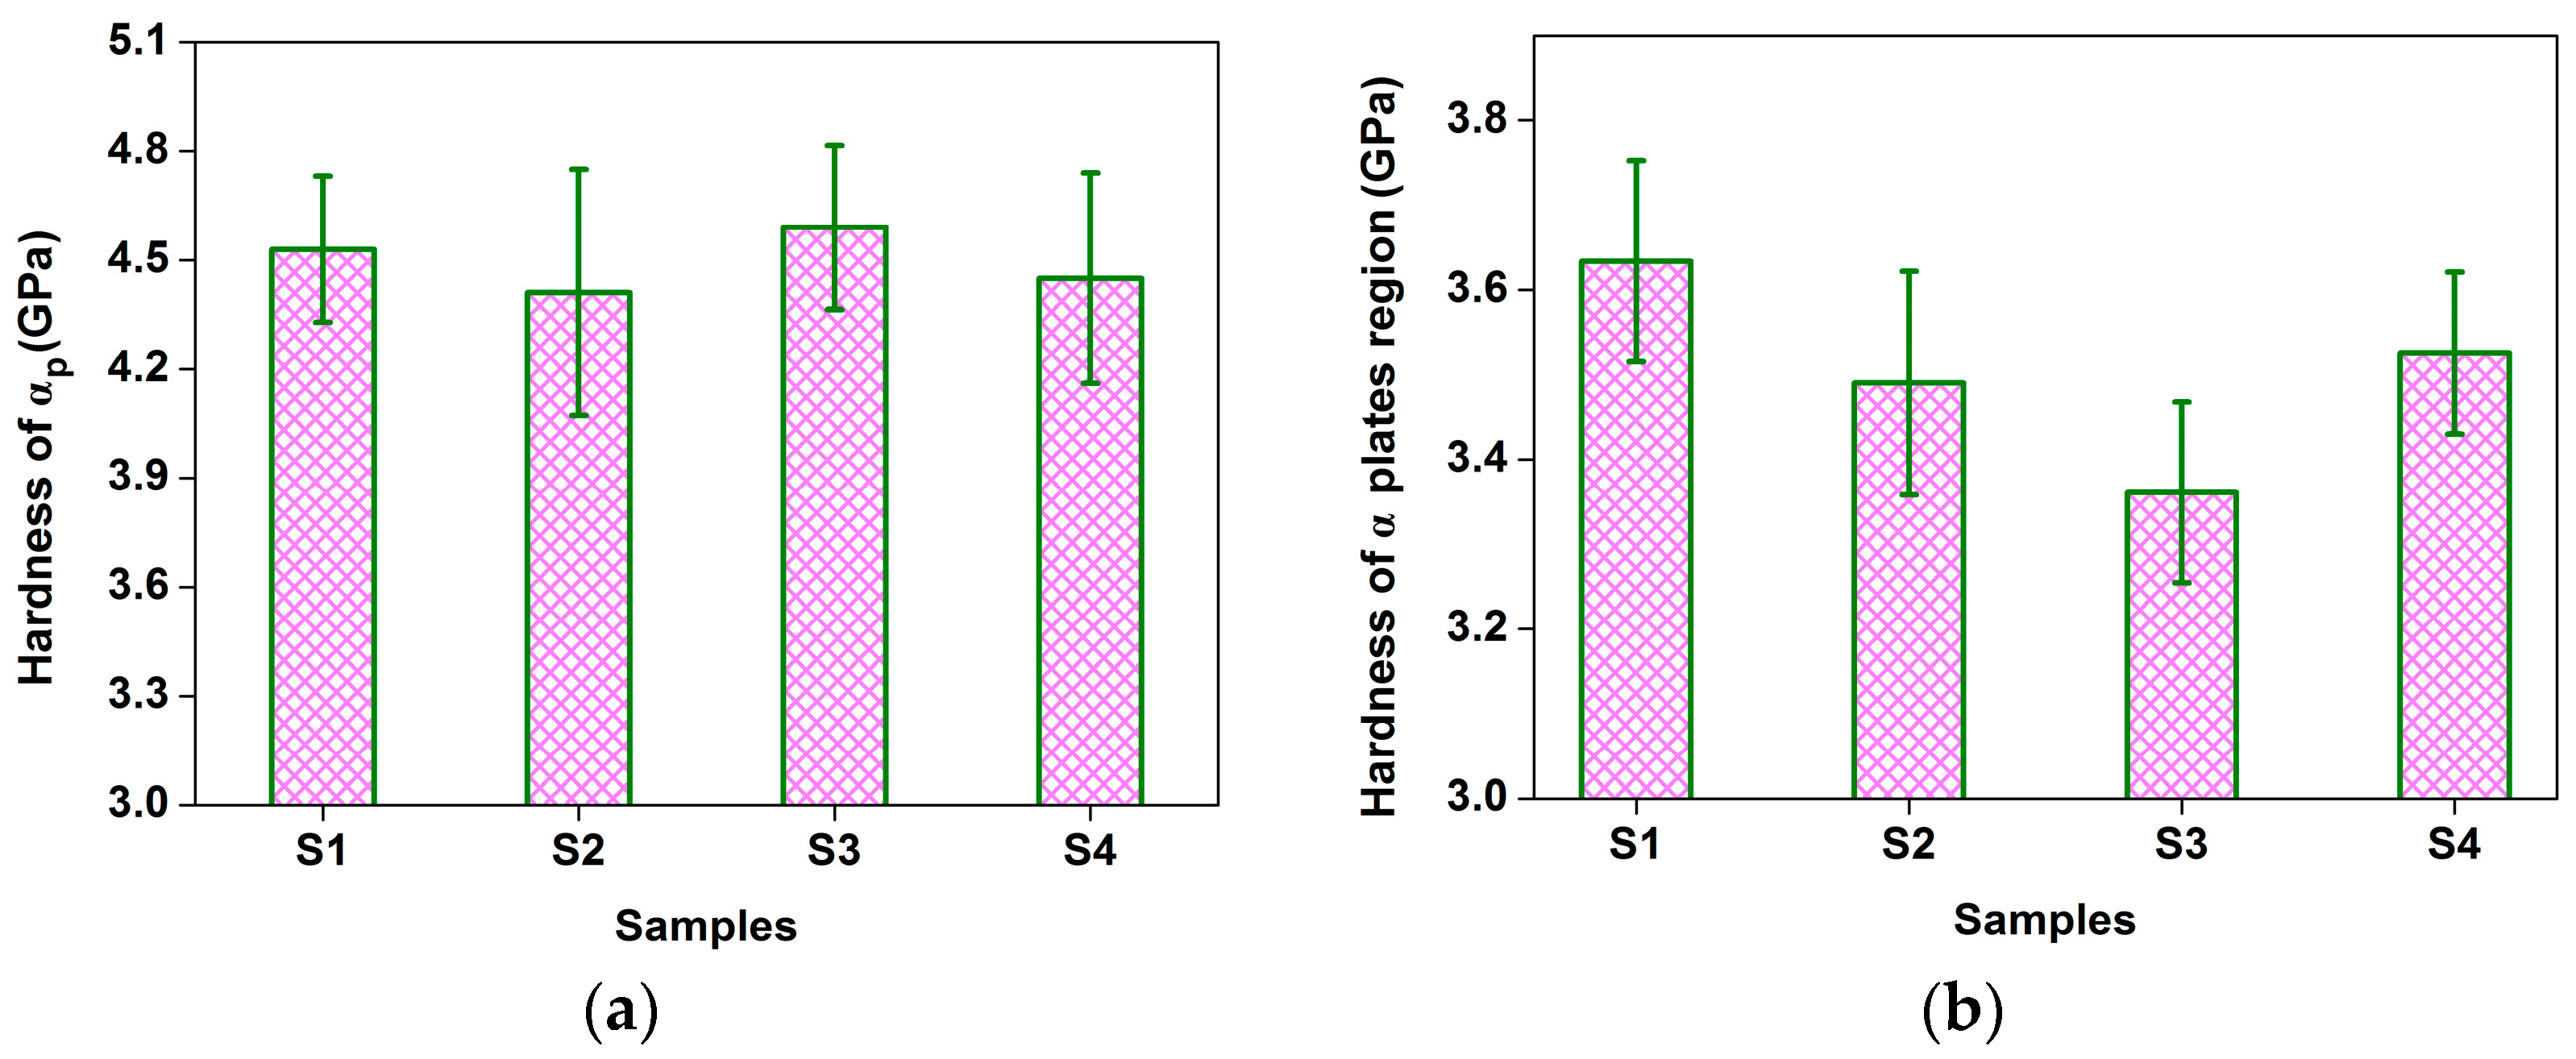
3.2. Microscopic Properties

The mechanical properties of the constituent phases may evolve with their volume fraction, size, and morphology. To understand the evolution of microscopic properties, indentation tests are separately performed on αp and α plates region, as shown in Figure 2. Size restriction is a critical issue during indention tests on constituent phases. The plastic zone size of impression should large enough to cover constituent phases. However, large impression plastic zone may be influenced by neighboring phases. The size of impression plastic zone is about twice of the impression size [21]. As shown in Figure 2, the size of impression is about 4 μm and 11 μm for αp and α plates region, respectively. Therefore, as compared to the size of the constituent phases in Figure 1, the plastic zone with twice of impression sizes can completely locate in the corresponding constituent phases and have no influence of neighboring phases.
The hardness of constituent phases is given in Figure 3. The calculated hardness of αp is about 4.5 GPa and varies slightly with heat treatment routes (Figure 3a). However, nanoindentation results show that the average hardness of αp in TA15 alloy is 6.44 GPa which is much larger that the result of this work [22]. The inconsistent results are attributed to the hardness dependent on indentation depth. It was found that the hardness of αp particles in Ti-6Al-4V increases with decreasing indentation depth [23]. In Reference [22] the indentation depth is 70 nm which is less than that of this work (about 500 nm). Therefore, it can be concluded that the hardness difference is caused by the different indentation depths.
The average harness of α plates region increases from 3.36 GPa to 3.63 GPa as SSH temperature increases and that of S4 is between S1 and S2 (Figure 3b). The strength of titanium alloy and the thickness α plates follow the Hall-Petch relationship [16,17]. Using hardness instead of strength, the Hall-Petch relationship can be expressed as [24]:
H = Hm + kHt−1/2
where H is the overall hardness of the tested material, Hm is the matrix hardness, kH is the Hall-Petch constant, t is the thickness of α plates. Therefore, thin α plate would have higher hardness. However, in tri-modal microstructure of this research, the thickness of αs and αt increases with SSH temperature (Table 2) and their hardness increases at the same. This is related to the volume fraction of αs and αt. As shown in Table 2, the volume fraction of αs decreases and that of αt increases with SSH temperature. Therefore, the volume fraction of αs and αt should be considered in analyzing the hardness of α plates region in tri-modal microstructure. Combined the contribution of thickness and volume fraction of αs and αt, the effective thickness teff is defined as:
teff = fαstαs + fαttαt
where tαs and tαt are the thickness of αs and αt, respectively. fαs and fαt are the volume fraction of αs and αt in α plates region, respectively. The harness of α plates as a function of teff is given in Figure 4. It is clear that the Hall-Petch relationship is well followed. Therefore, it can be concluded that the harness of α plates increases with decreasing teff.

3.3. Macroscopic Properties

The engineering stress-strain curves of TA15 alloy after different heat treatment routes are displayed in Figure 5 and the macroscopic properties are given in Table 3. It is obvious from Figure 5 and Table 3 that the UTS of the alloy increases from about 995 MPa (sample S3) to 1080 MPa (sample S1) with increasing SSH temperature and the UTS of S4 is 1055 MPa between that of S1 and S2. The elongation of alloy basically has an opposite variation rule with UTS. The sample S1 has lowest elongation (13.1%) and S4 has an intermediate elongation (14.2%). However, the sample S2 have both higher UTS (1025 MPa) and elongation (17.1%) as compared to S3. The variation of UTS and elongation is caused by the difference of microstructural constituents and is further investigated in the next sections.

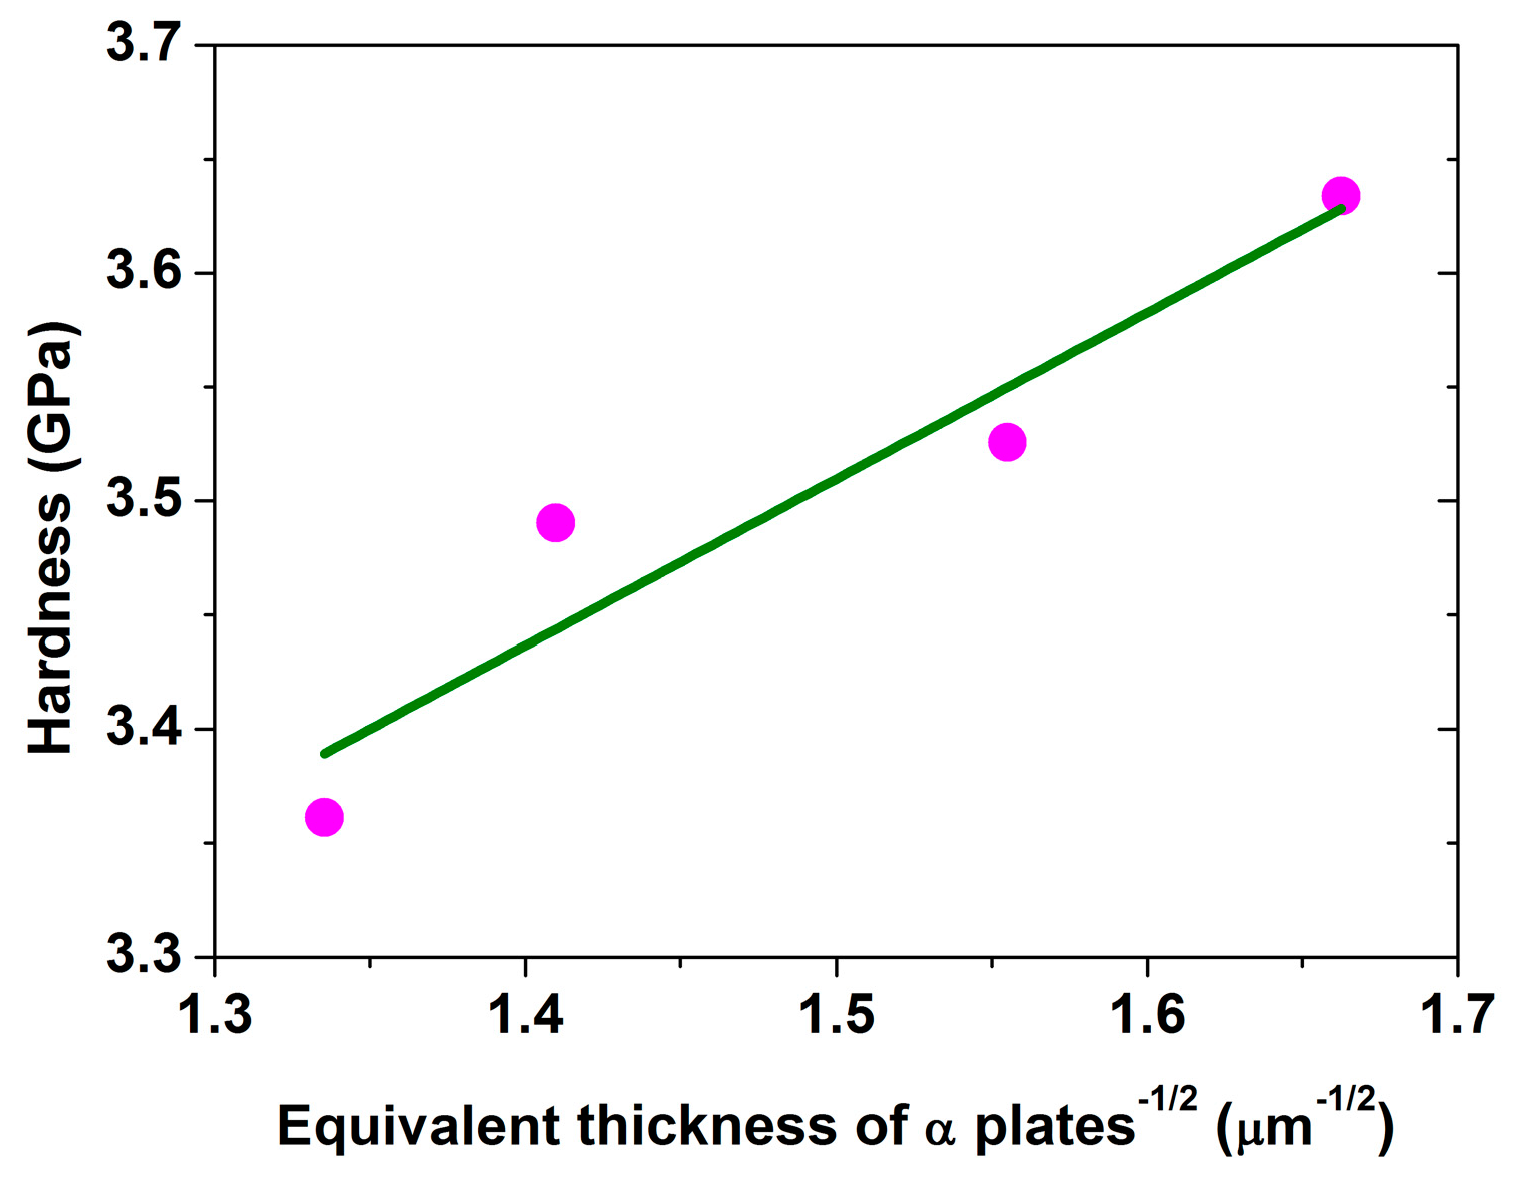
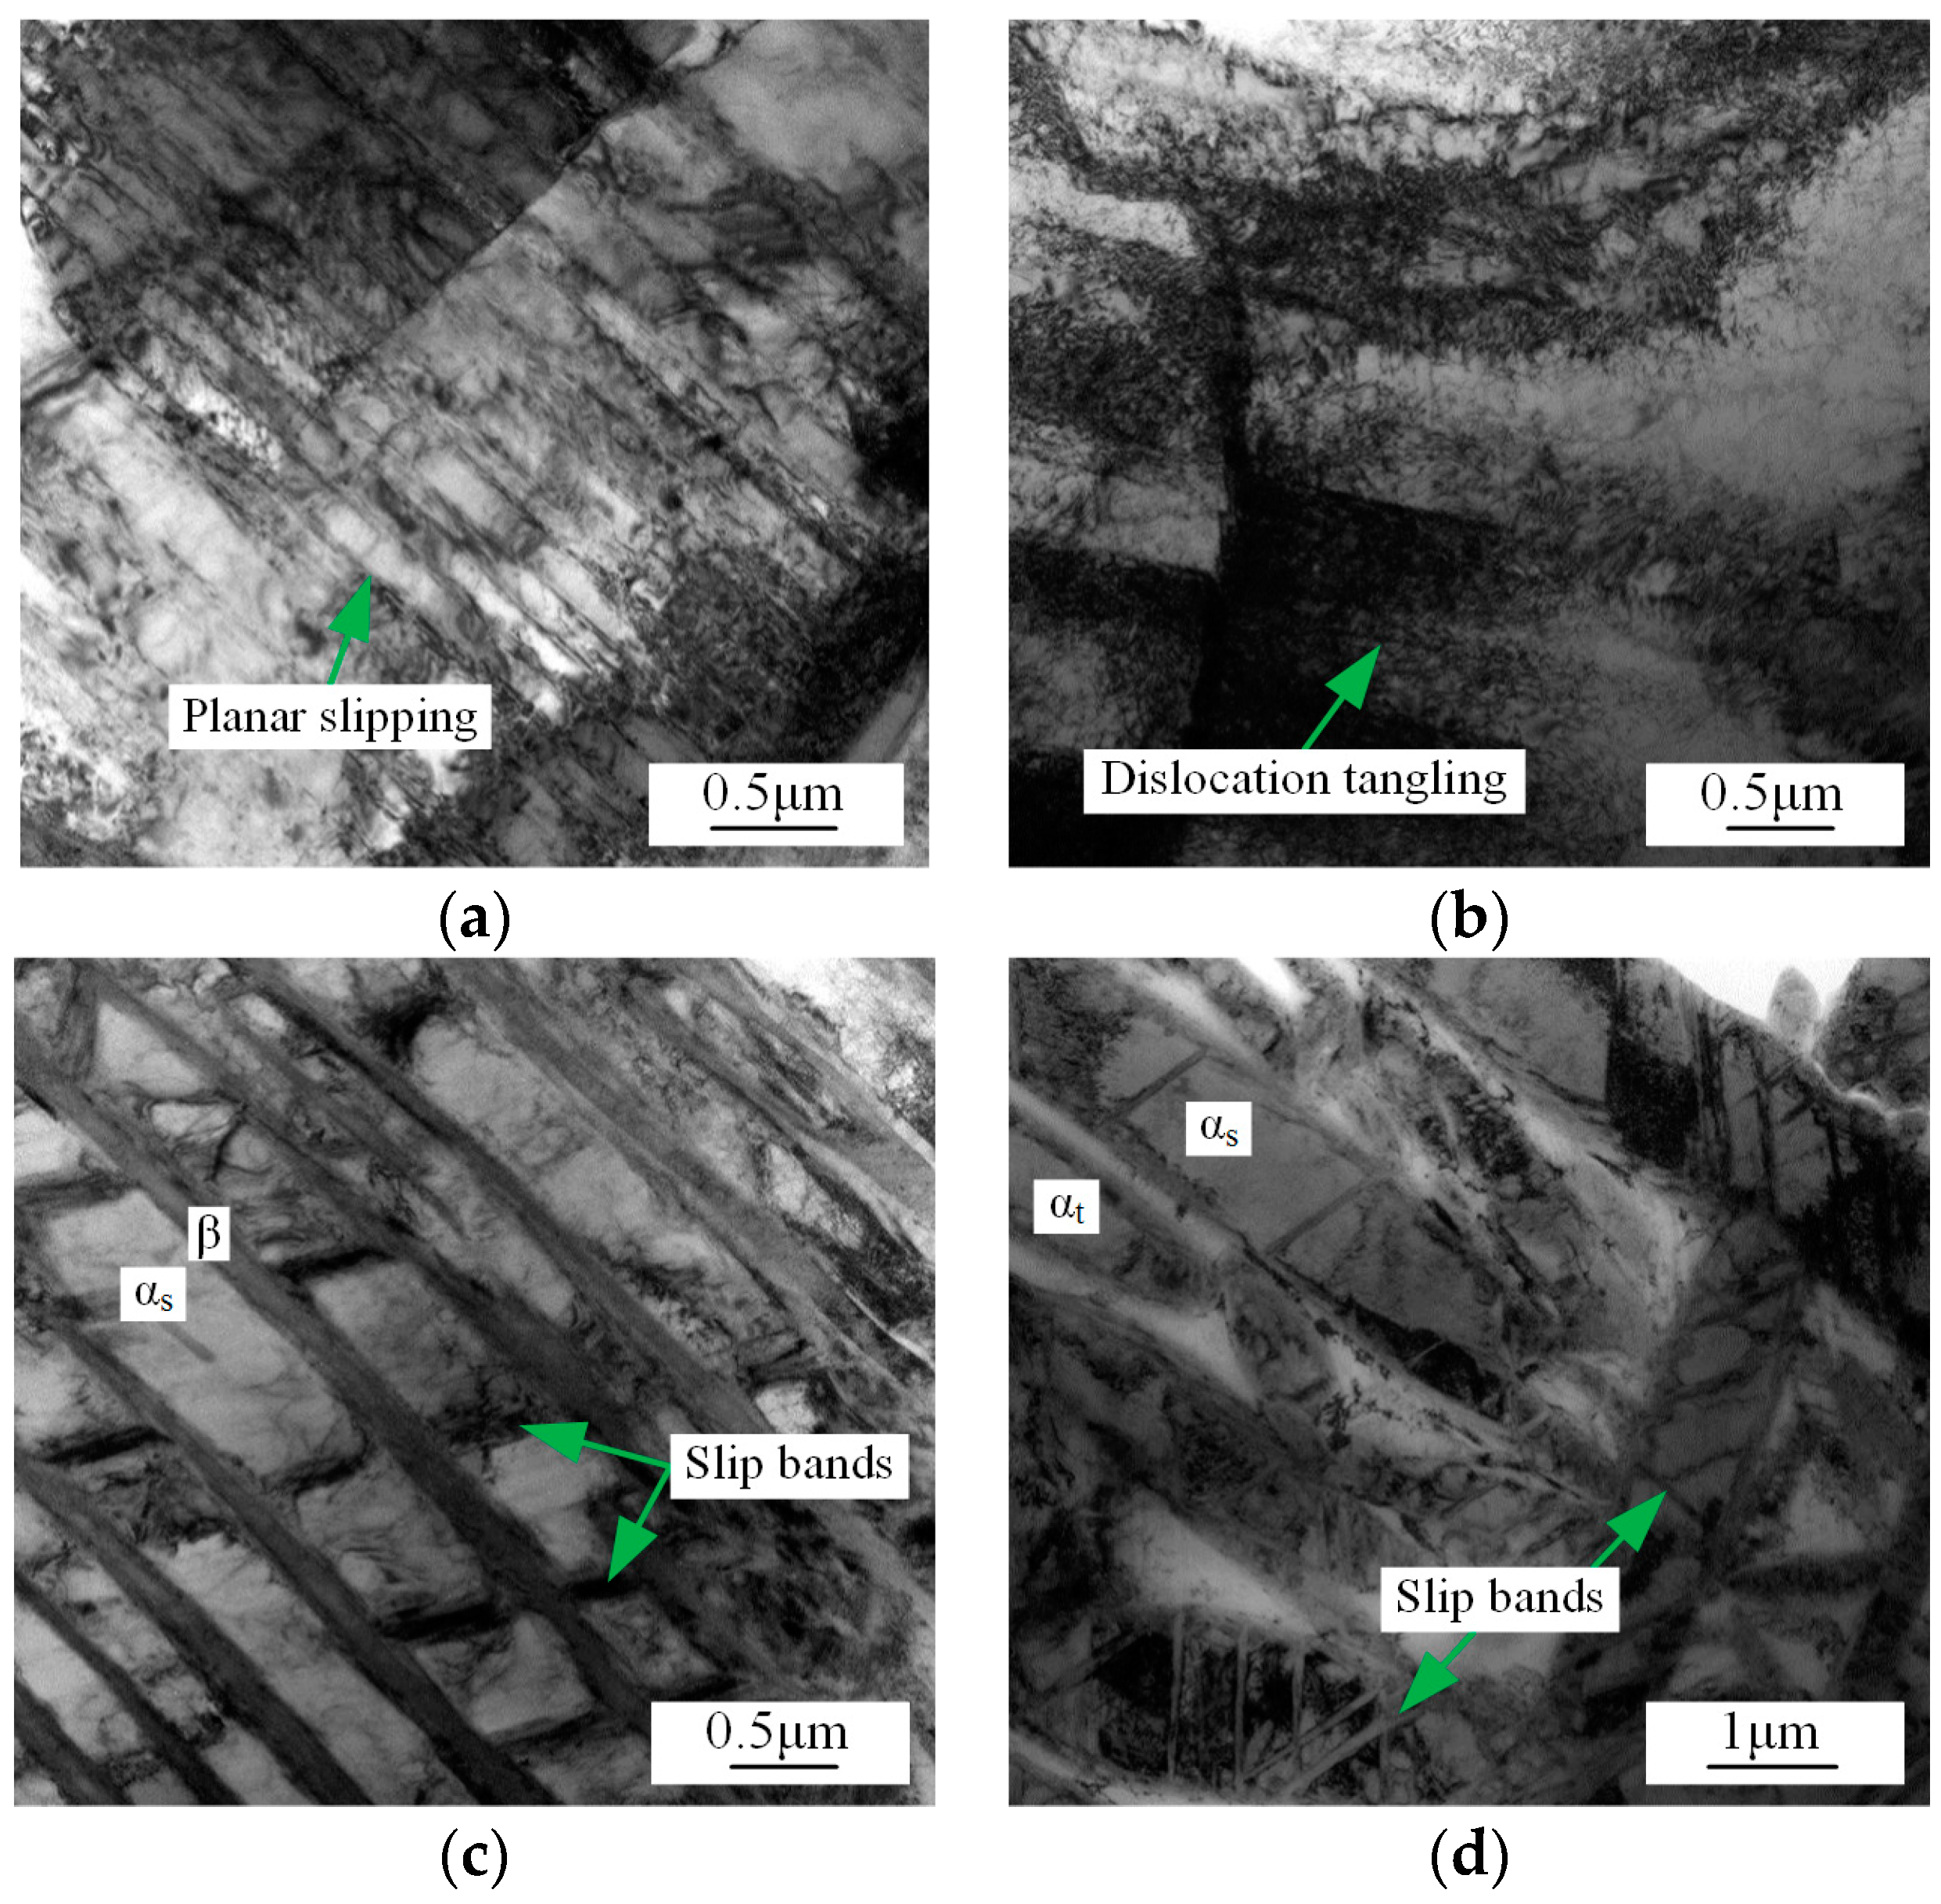
3.4. Effect of Microstructure on Macroscopic Properties

The microstructural constituents essentially determine the macroscopic properties of the alloys. It is easy to understand that higher hardness of both αp particles and α plate region would lead to high UTS of the alloy. Since the volume fraction and hardness of αp particles are similar and the hardness of α plate region decreases with increasing effective thickness of α plate, the UTS of alloy decreases in the order of S1, S4, S2 and S3 mainly due to the increase of effective thickness of α plate (Figure 5). Normally, alloys with high hardness have low ductility [25]. However, this may not suit to tri-modal microstructures since S2 has both high UTS and elongation as compared to S3.
The ductility of the alloy is mainly determined by the deformation amount of microstructural constituents. The deformation amount of microstructural constituents can be analyzed by the microstructures closed to the fracture surface as presented in Figure 6. The αp particles are elongated in the direction parallel to the tensile direction and the αs and αt plates are kinked in the deformed microstructures of the four samples. Although the deformation mode of the three α phases in the four samples is similar, their deformation amount is different. The deformation amount of αp particles can be analyzed by their aspect ratio. The statistical aspect ratio of αp particles is 2.47, 2.83, 2.62 and 2.42 for S1 to S4 after tensile deformation, respectively. Therefore, the increments of aspect ratio as compared to the corresponding initial microstructure (Figure 1) are 96%, 121%, 117% and 105% for S1 to S4. Large aspect ratio increment indicates large deformation amount of αp particles. Therefore, the deformation amount of αp particles increases in the order of S1, S4, S3 and S2. The deformation amount of αs and αt plates increases with kinking degree. In sample S1, only small part of αt undergoes kinking deformation and most of αt has an inconspicuous deformation (Figure 6a). In sample S2, almost all αs plates are kinked. Some αs plates are curved to “S” shape indicating emergence of severely kinking deformation. Some αt plates in S2 also undergo obvious kink deformation, although they are generally hard to deform (Figure 6b). In sample S3, kinking deformation of αs plates occurs in some location. However, some αs plates that keep the colony morphology are relatively straight indicating a small deformation degree (Figure 6c). In sample S4, α colony deforms as a single grain [26] and each αt plates in colony have similar small deformation degree (Figure 6d). Therefore, the deformation amount of α plate region increases in the order of S1, S4, S3 and S2. The deformation amount order of α plates is consistent with that of αp particles, since these microstructural constituents should deform compatibly during the deformation of alloy.
To further understand the deformation of each microstructural constituents, TEM images of deformed microstructure are shown in Figure 7. The αp particles are deformed by planar slipping and dislocation tangling in the four samples (Figure 7a,b). The α colony in S4 is sheared and the direction of shear slip bands in each α plate is same (Figure 7c) since there exists Burgers orientation relationship between αs and β phase and thus slip can easily transfer between α plates [27]. However, the slip directions of two neighboring αs plates in S2 are different. Moreover, shear slip bands in each αs plates have multiple directions and are denser than that in S4 (Figure 7d) indicating that large deformation of αs in S2 occurs. At the same time, αt also experiences a certain degree of deformation. These observations are consistent with the deformation amount analysis of Figure 6. Therefore, the deformation amount of both αp and α plates increases in the order of S1, S4, S3 and S2 and the elongation of the samples increases with same order. Besides, as shown in Table 2, the volume fractions of αp, αs and αt in S2 are 23.54%, 25.46% and 26.83%, respectively and their ratio is close to 1:1:1. Therefore, it can be concluded that when the volume fraction ratio between αp, αs and αt is about 1:1:1, the alloy would have high elongation.

4. Conclusions

1. Double heat treatment procedure can be used to tailor the microstructural constituents in tri-modal microstructure of TA15 alloy. The volume fraction and size of αp are relatively larger in the sample undergoing both FSH and SSH as compared to that only carrying out FSH. The volume fraction of αs decreases and that of αt increases with increasing SSH temperature. While, the thickness of both αs and αt increases with increasing SSH temperature.
2. The hardness of αp varies slightly with heat treatment routes. The hardness and effective thickness of α plates obtained by volume averaging of thickness of αs and αt follow the Hall-Petch relationship. Therefore, the hardness of α plates and the strength of the alloy increase with decreasing effective thickness of α plates.
3. The ductility of the alloy is determined by the deformation amount of microstructural constituents. As αt volume fraction increases, colony structure of αs is gradually destroyed, which makes each αs have large deformation degree by multiple directions slip. When volume fraction ratio of αp, αs and αt is about 1:1:1, αp and αs can have relatively large deformation and αt can contribute relatively large strength to the alloy and therefore the alloy has both good strength and ductility.

Author Contributions

Zhe Ji performed the experiments, wrote the paper, and contributed to all activities; Chengjin Shen and Fuxiang Wei analyzed the data; Hongwei Li conceived and designed the experiments.

Acknowledgments

The work was supported by the Fundamental Research Funds for the Central Universities of China under Grant (number 2015QNA04).

Conflicts of Interest

The authors declare no conflict of interest.

References

  1. Yang, H.; Fan, X.G.; Sun, Z.C.; Guo, L.G.; Zhan, M. Recent developments in plastic forming technology of titanium alloys. Sci. China Technol. Sci. 2011, 54, 490–501. [Google Scholar] [CrossRef]
  2. Huang, C.W.; Zhao, Y.Q.; Xin, S.W.; Zhou, W.; Li, Q.; Zeng, W.D. Effect of microstructure on torsion properties of Ti-5Al-5Mo-5V-3Cr-1Zr alloy. Mater. Sci. Eng. A 2017, 682, 202–210. [Google Scholar] [CrossRef]
  3. Zhou, Y.G.; Zeng, W.D.; Yu, H.Q. An investigation of a new near-beta forging process for titanium alloys and its application in aviation components. Mater. Sci. Eng. A 2005, 393, 204–212. [Google Scholar] [CrossRef]
  4. Hosseini, R.; Morakabati, M.; Abbasi, S.M.; Hajari, A. Development of a trimodal microstructure with superior combined strength, ductility and creep-rupture properties in a near alpha titanium alloy. Mater. Sci. Eng. A 2017, 696, 155–165. [Google Scholar] [CrossRef]
  5. Sun, Z.C.; Wang, X.Q.; Zhang, J.; Yang, H. Prediction and control of equiaxed α in near-β forging of TA15 Ti-alloy based on BP neural network: For purpose of tri-modal microstructure. Mater. Sci. Eng. A 2014, 591, 18–25. [Google Scholar] [CrossRef]
  6. Yu, W.X.; Li, M.Q.; Luo, J. Effect of deformation parameters on the precipitation mechanism of secondary α phase under high temperature isothermal compression of Ti-6Al-4V alloy. Mater. Sci. Eng. A 2010, 527, 4210–4217. [Google Scholar] [CrossRef]
  7. Matsumoto, H.; Yoneda, H.; Sato, K.; Kurosu, S.; Maire, E.; Fabregue, D.; Konno, T.J.; Chiba, A. Room-temperature ductility of Ti-6Al-4V alloy with α′ martensite microstructure. Mater. Sci. Eng. A 2011, 528, 1512–1520. [Google Scholar] [CrossRef]
  8. Lütjering, G. Influence of processing on microstructure and mechanical properties of (α+β) titanium alloys. Mater. Sci. Eng. A 1998, 243, 32–45. [Google Scholar] [CrossRef]
  9. Picu, R.C.; Majorell, A. Mechanical behavior of Ti-6Al-4V at high and moderate temperatures-Part II: Constitutive modeling. Mater. Sci. Eng. A 2002, 326, 306–316. [Google Scholar] [CrossRef]
  10. Qin, D.Y.; Lu, Y.F.; Guo, D.Z.; Zheng, L.; Liu, Q.; Zhou, L. Tensile deformation and fracture of Ti-5Al-5V-5Mo-3Cr-1.5Zr-0.5Fe alloy at room temperature. Mater. Sci. Eng. A 2013, 587, 100–109. [Google Scholar] [CrossRef]
  11. Gao, P.F.; Yang, H.; Fan, X.G.; Yan, S.L. Microstructural features of TA15 titanium alloy under different temperature routes in isothermal local loading forming. Mater. Sci. Eng. A 2012, 540, 245–252. [Google Scholar] [CrossRef]
  12. Gao, P.F.; Fan, X.G.; Yang, H. Role of processing parameters in the development of tri-modal microstructure during isothermal local loading forming of TA15titanium alloy. J. Mater. Process. Technol. 2017, 239, 160–171. [Google Scholar] [CrossRef]
  13. Sadeghpour, S.; Abbasi, S.M.; Morakabati, M.; Bruschi, S. Correlation between alpha phase morphology and tensile properties of a new beta titanium alloy. Mater. Des. 2017, 121, 24–35. [Google Scholar] [CrossRef]
  14. Li, C.L.; Mi, X.J.; Ye, W.J.; Hui, S.X.; Yu, Y.; Wang, W.Q. Effect of solution temperature on microstructures and tensile properties of high strength Ti-6Cr-5Mo-5V-4Al alloy. Mater. Sci. Eng. A 2013, 578, 103–109. [Google Scholar] [CrossRef]
  15. Huang, C.W.; Zhao, Y.Q.; Xin, S.W.; Zhou, W.; Li, Q.; Zeng, W.D. Effect of microstructure on tensile properties of Ti-5Al-5Mo-5V-3Cr-1Zr alloy. J. Alloys Compd. 2017, 693, 582–591. [Google Scholar] [CrossRef]
  16. Semiatin, S.L.; Bieler, T.R. The effect of alpha platelet thickness on plastic flow during hot working of Ti-6Al-4V with a transformed microstructure. Acta Mater. 2001, 49, 3565–3573. [Google Scholar] [CrossRef]
  17. Chen, X.; Zeng, W.D.; Wang, W.; Liang, X.B.; Zhang, J.W. Coarsening behaviour of lamellar orthorhombic phase and its effect on tensile properties for the Ti-22Al-25Nb alloy. Mater. Sci. Eng. A 2014, 611, 320–325. [Google Scholar] [CrossRef]
  18. Oliver, W.C.; Pharr, G.M. An improved technique for determining hardness and elastic modulus using load and displacement sensing indentation experiment. J. Mater. Res. 1992, 7, 1564–1583. [Google Scholar] [CrossRef]
  19. Zhu, S.; Yang, H.; Guo, L.G.; Fan, X.G. Effect of cooling rate on microstructure evolution during α/β heat treatment of TA15 titanium alloy. Mater. Charact. 2012, 70, 101–110. [Google Scholar] [CrossRef]
  20. Gao, X.X.; Zeng, W.D.; Zhang, S.F.; Wang, Q.J. A study of epitaxial growth behaviors of equiaxed alpha phase at different cooling rates in near alpha titanium alloy. Acta Mater. 2017, 122, 298–309. [Google Scholar] [CrossRef]
  21. Delincé, M.; Jacques, P.J.; Pardoen, T. Separation of size-dependent strengthening contributions in fine-grained dual phase steels by nanoindentation. Acta Mater. 2006, 54, 3395–3404. [Google Scholar] [CrossRef]
  22. He, D.; Zhu, J.C.; Lai, Z.H.; Liu, Y.; Yang, X.W.; Nong, Z.S. Residual elastic stress-strain field and geometrically necessary dislocation density distribution around nano-indentation in TA15 titanium alloy. Trans. Nonferrous Met. Soc. China 2013, 23, 7–13. [Google Scholar] [CrossRef]
  23. Viswanathan, G.B.; Lee, E.; Maher, D.M.; Banerjee, S.; Fraser, H.L. Direct observations and analyses of dislocation substructures in the α phase of an α/β Ti-alloy formed by nanoindentation. Acta Mater. 2005, 53, 5101–5115. [Google Scholar] [CrossRef]
  24. Moon, J.; Kim, S.; Jang, J.; Lee, J.; Lee, C. Orowan strengthening effect on the nanoindentation hardness of the ferrite matrix in microalloyed steels. Mater. Sci. Eng. A 2008, 487, 552–557. [Google Scholar] [CrossRef]
  25. Zhao, Y.H.; Liao, X.Z.; Cheng, S.; Ma, E.; Zhu, Y.T. Simultaneously increasing the ductility and strength of nanostructured alloys. Adv. Mater. 2006, 18, 2280–2283. [Google Scholar] [CrossRef]
  26. Ambard, A.; Guétaz, L.; Louchet, F.; Guichard, D. Role of interphases in the deformation mechanisms of an α/β titanium alloy at 20 K. Mater. Sci. Eng. A 2001, 319, 404–408. [Google Scholar] [CrossRef]
  27. Liang, Y.J.; Wang, H.M. Influence of prior-β-grain size on tensile strength of a laser-deposited α/β titanium alloy at room and elevated temperatures. Mater. Sci. Eng. A 2015, 622, 16–20. [Google Scholar] [CrossRef]
Figure 1. Microstructures of TA15 alloy samples under different heat treatment routes: (a) S1, (b) S2, (c) S3, (d) S4.
Metals 08 00299 g001
Figure 2. Load-indentation depth curves of different constituent phases: (a) αp, (b) α plates region.
Metals 08 00299 g002
Figure 3. Hardness of different constituent phases: (a) αp, (b) α plates region.
Metals 08 00299 g003
Figure 4. The hardness as a function of equivalent thickness of α plates.
Metals 08 00299 g004
Figure 5. Engineering stress-strain curves of TA15 alloy under different heat treatment routes.
Metals 08 00299 g005
Figure 6. Microstructures near the fracture surface of TA15 alloy tensile samples under different processing routes: (a) S1, (b) S2, (c) S3, (d) S4.
Metals 08 00299 g006
Figure 7. TEM images of deformed microstructure in TA15 alloy: (a) planar slipping bands in αp particles, (b) dislocation tangling in αp particles, (c) shear slip bands of αs in sample S4, (d) dense shear slip bands of αs in sample S2.
Metals 08 00299 g007
Table 1. Double heat treatment routes of TA15 alloy samples.
Sample No.First Step Heat TreatmentSecond Step Heat Treatment
S1965 °C/20 min/AC 1955 °C/20 min/WQ 2
S2940 °C/20 min/WQ
S3925 °C/20 min/WQ
S4-
1 AC—air cool; 2 WQ—water quench.
Table 2. Parameters of microstructural features in different samples.
SamplesParameters of αpParameters of αsParameters of αt
VF 1 (%) Size (μm)Aspect RatioVF (%) Thickness (μm)VF (%) Thickness (μm)
S119.24 ± 1.2411.55 ± 1.121.26 ± 0.135.12 ± 0.421.36 ± 0.1654.28 ± 6.070.41 ± 0.08
S223.54 ± 1.1912.32 ± 0.951.28 ± 0.0925.46 ± 1.561.10 ± 0.0926.83 ± 1.780.39 ± 0.09
S321.75 ± 1.8112.56 ± 0.881.21 ± 0.1147.17 ± 3.890.88 ± 0.116.24 ± 0.490.38 ± 0.07
S416.22 ± 0.8611.19 ± 1.241.18 ± 0.0858.72 ± 5.620.59 ± 0.07--
1 VF—Volume fraction.
Table 3. Tensile properties of TA15 alloy samples.
Sample NumberUTS (MPa)Elongation (%)
S11080 ± 3213.1 ± 1.48
S21025 ± 2317.1 ± 1.44
S3995 ± 2715.9 ± 1.52
S41055 ± 3114.2 ± 1.33

