Experimental Investigation of Laser Ablation Characteristics on Nickel-Coated Beryllium Copper


Department of Mechanical and Automotive Engineering, Kongju National University, Cheonan 31080, Korea
Metals 2018, 8(4), 211; https://doi.org/10.3390/met8040211
Submission received: 26 February 2018
/
Revised: 16 March 2018
/
Accepted: 22 March 2018
/
Published: 25 March 2018
(This article belongs to the Special Issue Metallic Materials and Manufacturing)
Abstract
:As electronic products are miniaturized, the components of the spring contact probe are made very fine. Current mechanical processing may make it difficult to perform micro-machining with a high degree of precision. A laser is often used for the high precision micro-machining due to its advantages such as a contact-free process, high energy concentration, fast processing time, and applicability to almost every material. The production of micro-electronics using nickel-coated copper is rapidly increasing and laser material processing is becoming a key processing technology owing to high precision requirements. Before applying laser material processing, it is necessary to understand the ablation characteristics of the materials. Therefore, this study systematically investigates the ablation characteristics of nickel-coated beryllium copper. Key laser parameters are pulse duration (4~200 ns) and the total accumulated energy (1~1000 mJ). The processed workpiece is evaluated by analyzing the heat affected zone (HAZ), material removal zone (MRZ), and roundness. Moreover, the surface characteristics such as a burr, spatter, and roundness shapes are analyzed using scanning electron microscope (SEM).
1. Introduction
Spring contact probes are used to test printed circuit boards, semiconductors, and other electronic components. The spring contact probes consist of a plunger, barrel, and internal spring [1]. While the barrel and internal spring are relatively standardized in their manufacturing processes, the manufacturing process of the plunger is not standardized due to the variety in their shape. In mass production, plungers are stamped together and each plunger is connected with a plunger connecting arm. These connecting arms are removed to cut the plungers into pieces. Mechanical cutting is currently used. However, this may have disadvantages such as engaging mechanical force, accumulating mechanical stress, and damaging the body of plungers. In addition, a cutting tool wears out over time. Due to these disadvantages, the manufacturing process may result in poor cut quality so that the production yield decreases and inspection performance deteriorates.
To overcome these disadvantages caused by the mechanical cutting, a laser is intensively used [2,3,4,5,6,7], since laser processing has advantages such as a contact-free process, high energy concentration, fast processing time, and applicability to almost every material. Due to these advantages, laser material processing is actively studied for a variety of cutting and drilling processes [1,8,9,10,11,12,13,14,15,16,17,18,19,20]. Conventional laser cutting and drilling processes can be modified to the laser spot cutting to efficiently remove the connecting arms [1]. Lee et al. [1] have applied laser spot cutting on the plunger and the applicability of the laser spot cutting was tested. In this study, the penetration and material removal zone were measured, and the laser parameters for a good cut quality were selected and validated. Even though the pulse duration of the laser used in Lee’s study could be varied from 4 ns to 200 ns, it was limited only to the laser pulse duration of 200 ns.
While maintaining the electrical conductivity of electronic products, in order to prevent effects of corrosion and wear, a nickel coating is often used [21]. The nickel coating is good in color and has relatively low discoloration. In addition, the nickel coating has advantages such as a suitable hardness and good mechanical anti-corrosive effect. Therefore, the nickel coating is widely used. For example, it is used in electronic products such as ultra-small capacitors, inductors, and resistors [22,23]. Also, it is used as a material for spring contact probes to evaluate the conductivity of semiconductor devices [1,24]. Although the production of high-precision compact electronic products using nickel-coated copper is increasing rapid, systematic studies for processing nickel-coated copper with lasers are relatively sparse. Especially before applying laser material processing, it is necessary to preferentially understand the materials used and the laser interaction characteristics. In this study, the ablation characteristics for the nickel-coated beryllium copper are studied.
This paper is organized as follows. First, experimental specimens, set-up, and laser parameters are explained. Second, the analysis method is explained. Third, the experimental results and analysis are described. Finally, conclusions are summarized.
2. Experiment
2.1. Material and Experimental Method
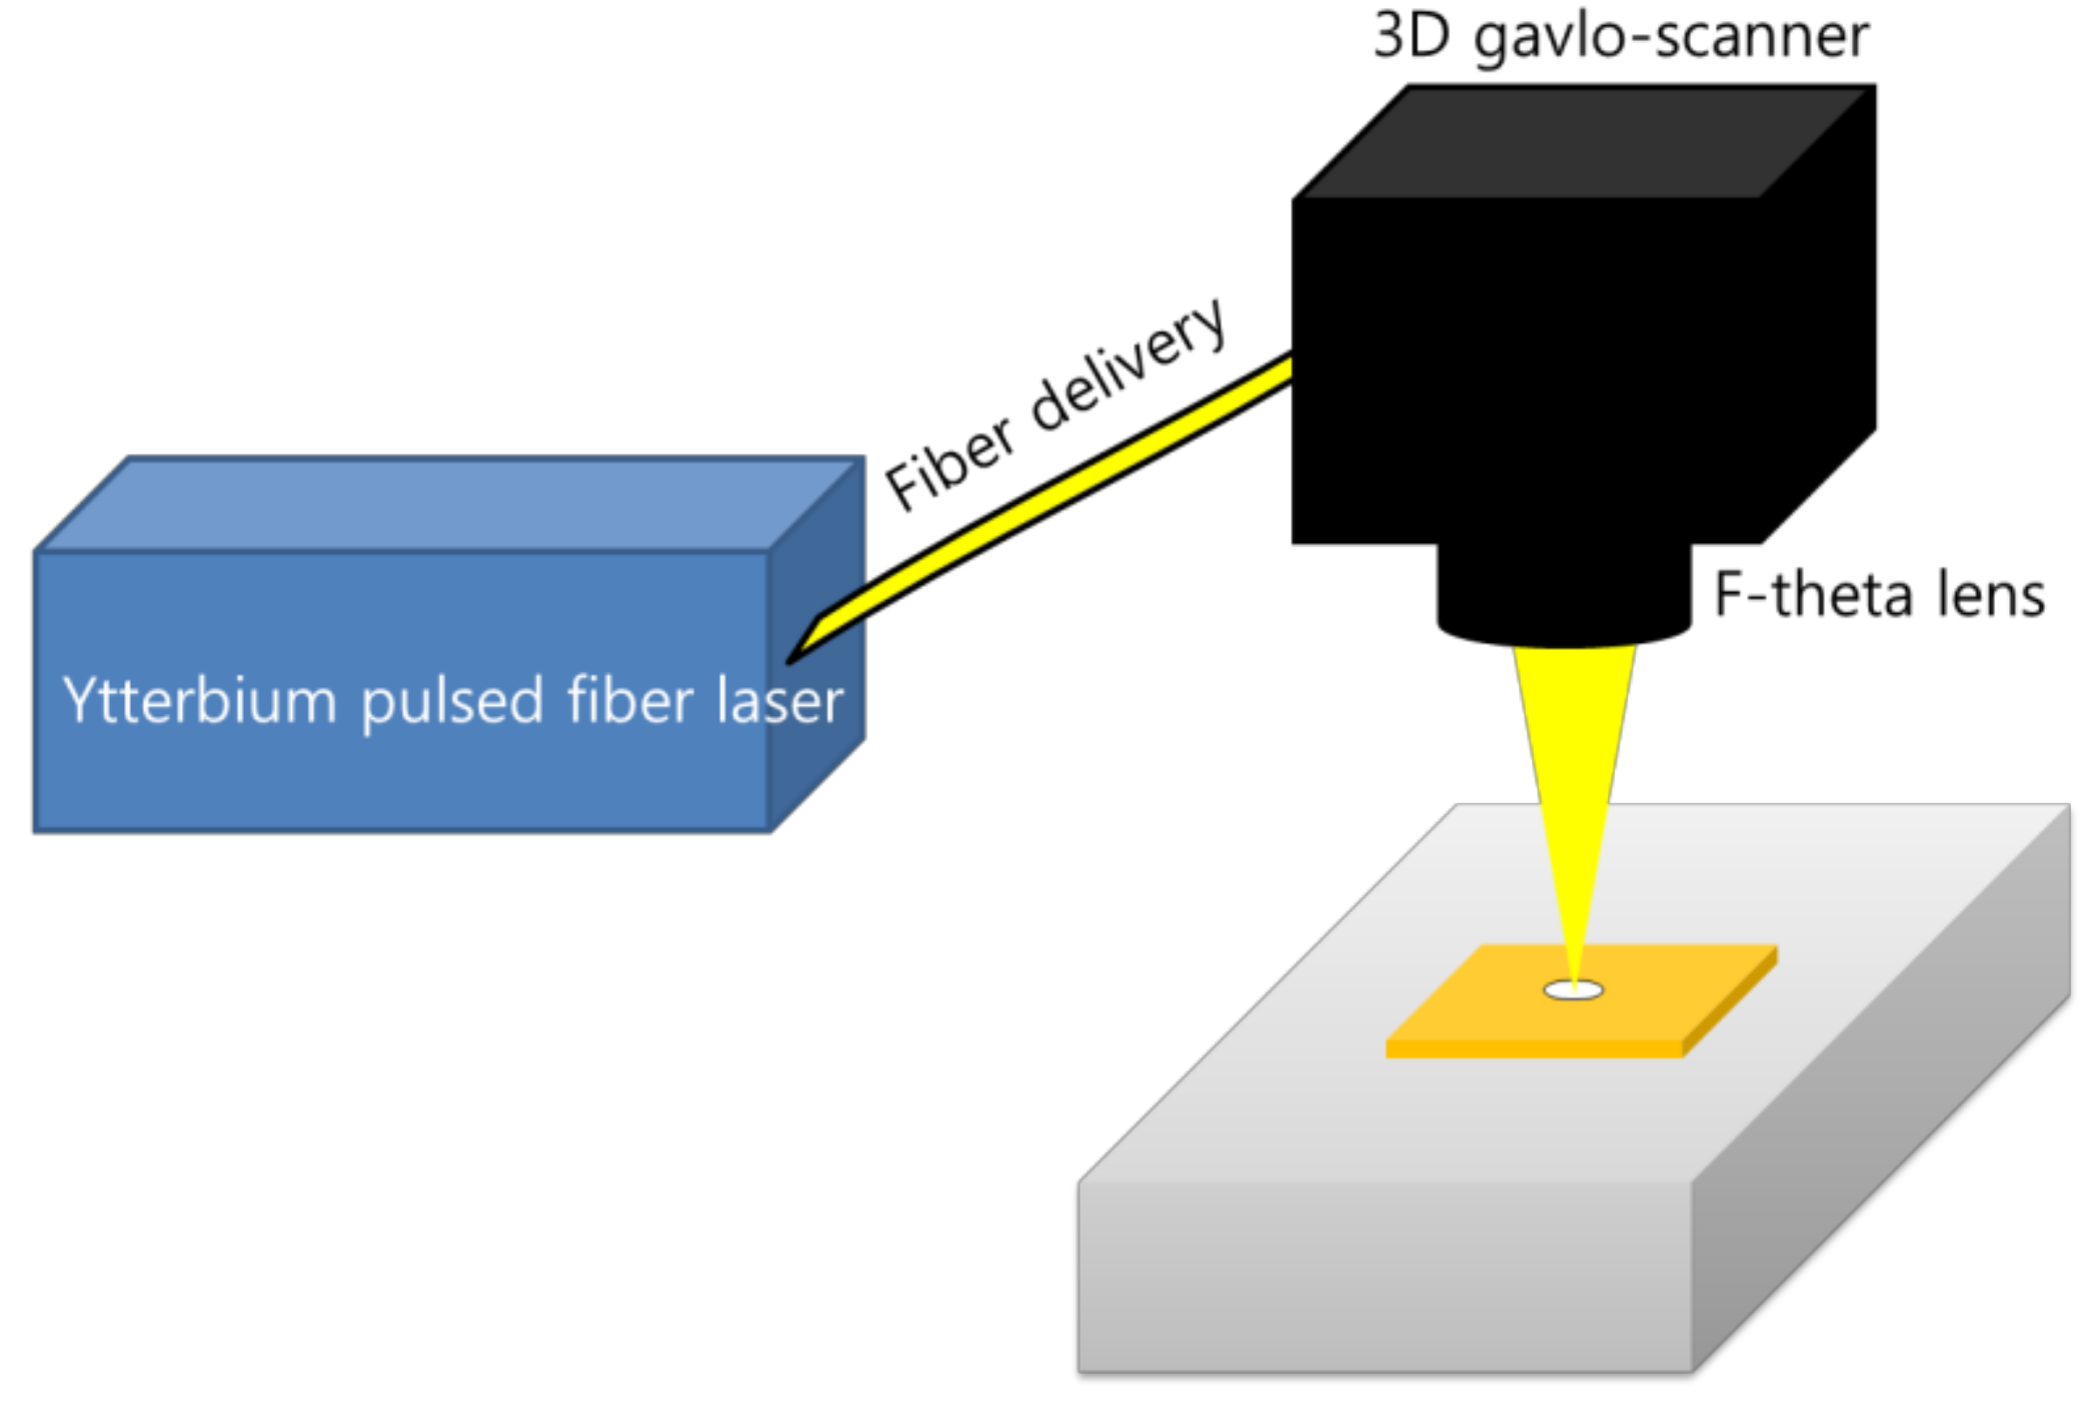
Nickel of 0.5 µm thick was coated on the top and bottom surfaces of a beryllium copper (BeCu) specimen of 45 µm thick. Thus, the total thickness of the specimen used in this experiment is 46 μm. BeCu is a copper alloy with 1.8~2% beryllium and has been used intensively in DC probing [25]. The configuration of the experimental equipment is shown in Figure 1. This experiment used an ns pulsed ytterbium fiber laser (IPG-YLPM) (IPG photonics, Oxford, MA, USA.) with a wavelength of 1064 nm and maximum average output laser power of 20 W. The laser beam was focused on the top surface of the workpiece. The spot size was 30 μm at the focal position. The laser beam had a Gaussian distribution. This fiber laser was connected to a 3D galvo-scanner (RAYLASE AS-12Y) (Raylase, Wessling, Germany), which was able to send the laser the desired pattern at high speeds and was controlled by a computer. In order to obtain high productivity, the average maximum output laser power was used since high laser power typically leads to a high processing speed. For lasers with relatively long pulses such as the nanosecond laser, heat damage is applied not only to the processing area, but also to the edge of the area. As a result, the melting phenomenon occurs secondarily at the hole edge. Therefore, in order to have a good quality cut, it is necessary to find a set of parameters that have a narrow heat affect zone (HAZ) and reduced burr.
Regarding the parameters, the value of the laser parameters applied to the specimen is shown in Table 1. While changing the pulse duration (Δt) to 4 ns~200 ns, the total accumulated energy (ETotal) remained at the same value, by adjusting the number of pulses and the repetition rate. Since the pulse duration is different, the time required to transfer the heat energy varies. As a result, the surface phenomenon appears differently. The pulse energy is calculated by the following Equation (1):
In the above equation, is the generated pulse energy per one pulse, is the average laser power, is the pulse duration, is the peak power, and is the repetition rate. Basically, the pulse energy is inversely proportional to the repetition rate. The total irradiated laser energy (ETotal) is expressed by the following Equation (2):
In the above equation, is the number of pulses, and in order to obtain the same total energy for each pulse duration, it is necessary to adjust the number of pulses.
2.2. Analysis Method
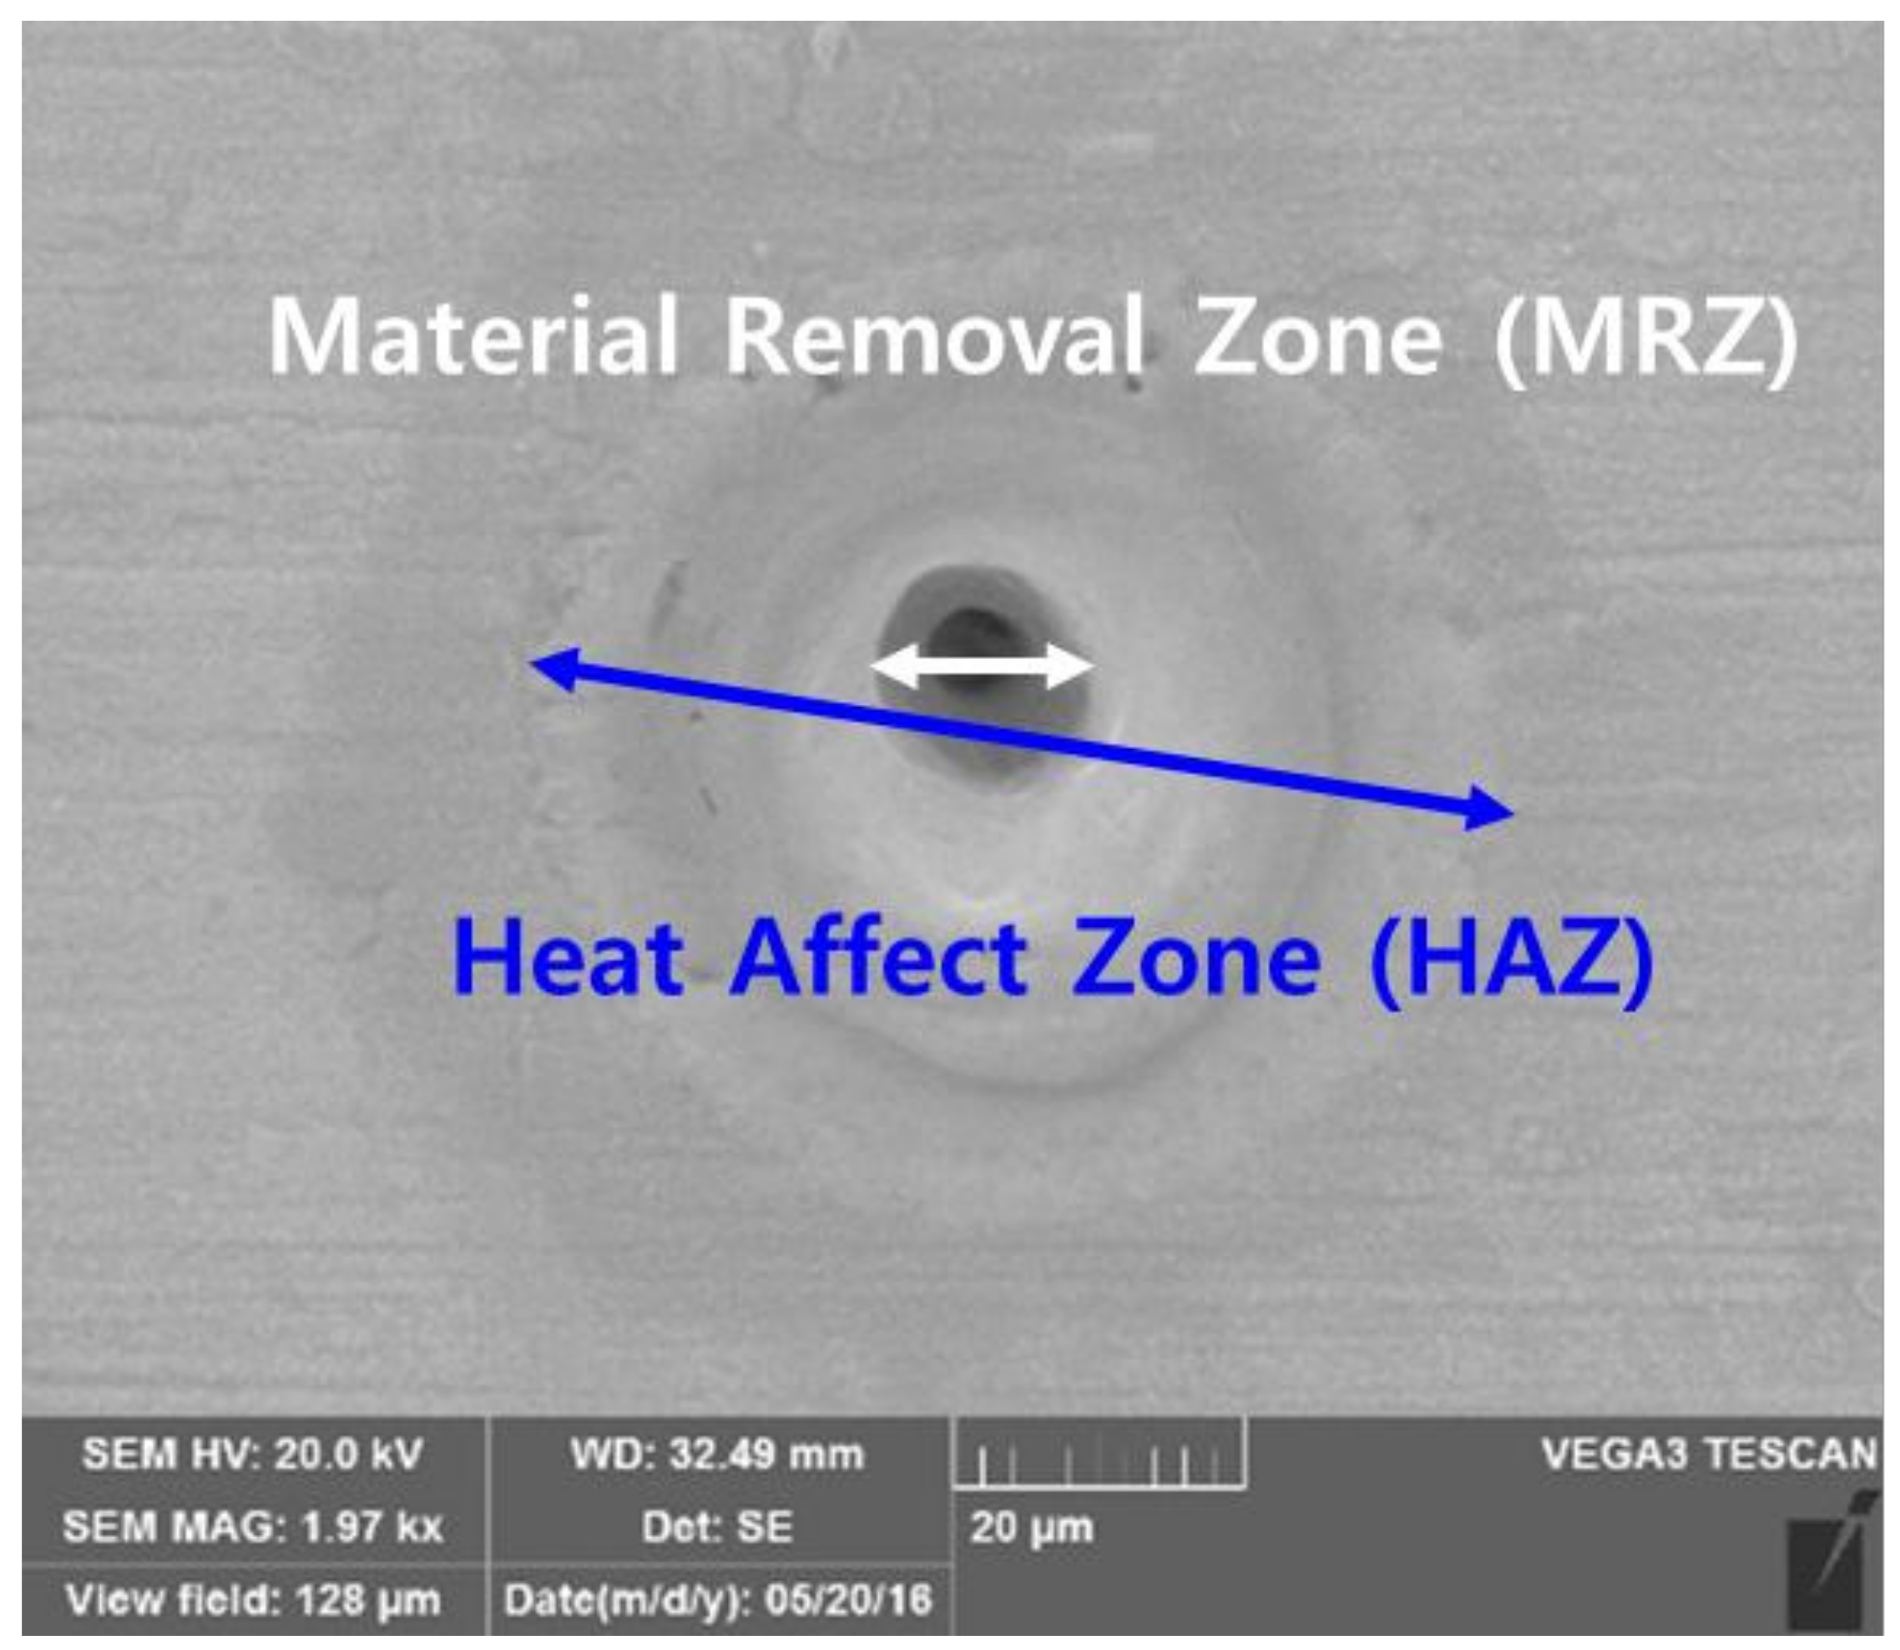
After the experiments were conducted in accordance with the parameter table, in order to confirm the experimental results, a scanning electron microscope (SEM) (Zeiss, Oberkochen, Germany) was used to observe the surface of the sample. The heat affected zone (HAZ) and the top of the material removal zone (MRZ top) were measured. If penetrated, the bottom of the material removal zone (MRZ bottom) was also measured. Figure 2 shows the MRZ and the HAZ after laser radiation. The HAZ is defined as a melting trace around the crater due to the heat generated during laser irradiation. The MRZ refers to the hole of the material that is removed due to melting and evaporation during the laser-material interaction. During laser-material interaction, a recoil pressure is formed due to melting and evaporation processes. This recoil pressure moves molten material away from the center of a laser-material interaction zone to the edge of the MRZ. This molten material re-solidifies a crater-shaped layer around the hole edge, which is defined as the burr [26,27,28,29].
Roundness was also measured to evaluate the quality. Roundness refers to the degree that a cross-sectional contour shape resembles an ideal perfect circle. Roundness is affected by pulse duration (Δt), total accumulated energy (ETotal), repetition rate (f), and a number of pulses (#). The roundness measurement is shown in Figure 3. To measure the roundness, this study assumes that the Gaussian beam is homogenous and the incoming laser beam is perpendicular to the surface of workpieces. First, the circumscribed circle and the inscribed circle were drawn concentrically on the contour of the hole. Second, the distance between the two circles was measured. As this interval tends to zero, it is close to a perfect circle. The measured roundness was tabulated as a percentage to facilitate comparison using Equation (3):
In the above equation, is the radius of the inscribing circle in the contour shape, and is the radius of the circumscribing circle. As the calculated value is larger, it is close to the perfect circle.
3. Results and Discussions
3.1. Heat Affected Zone, Material Removal Zone, and Roundness
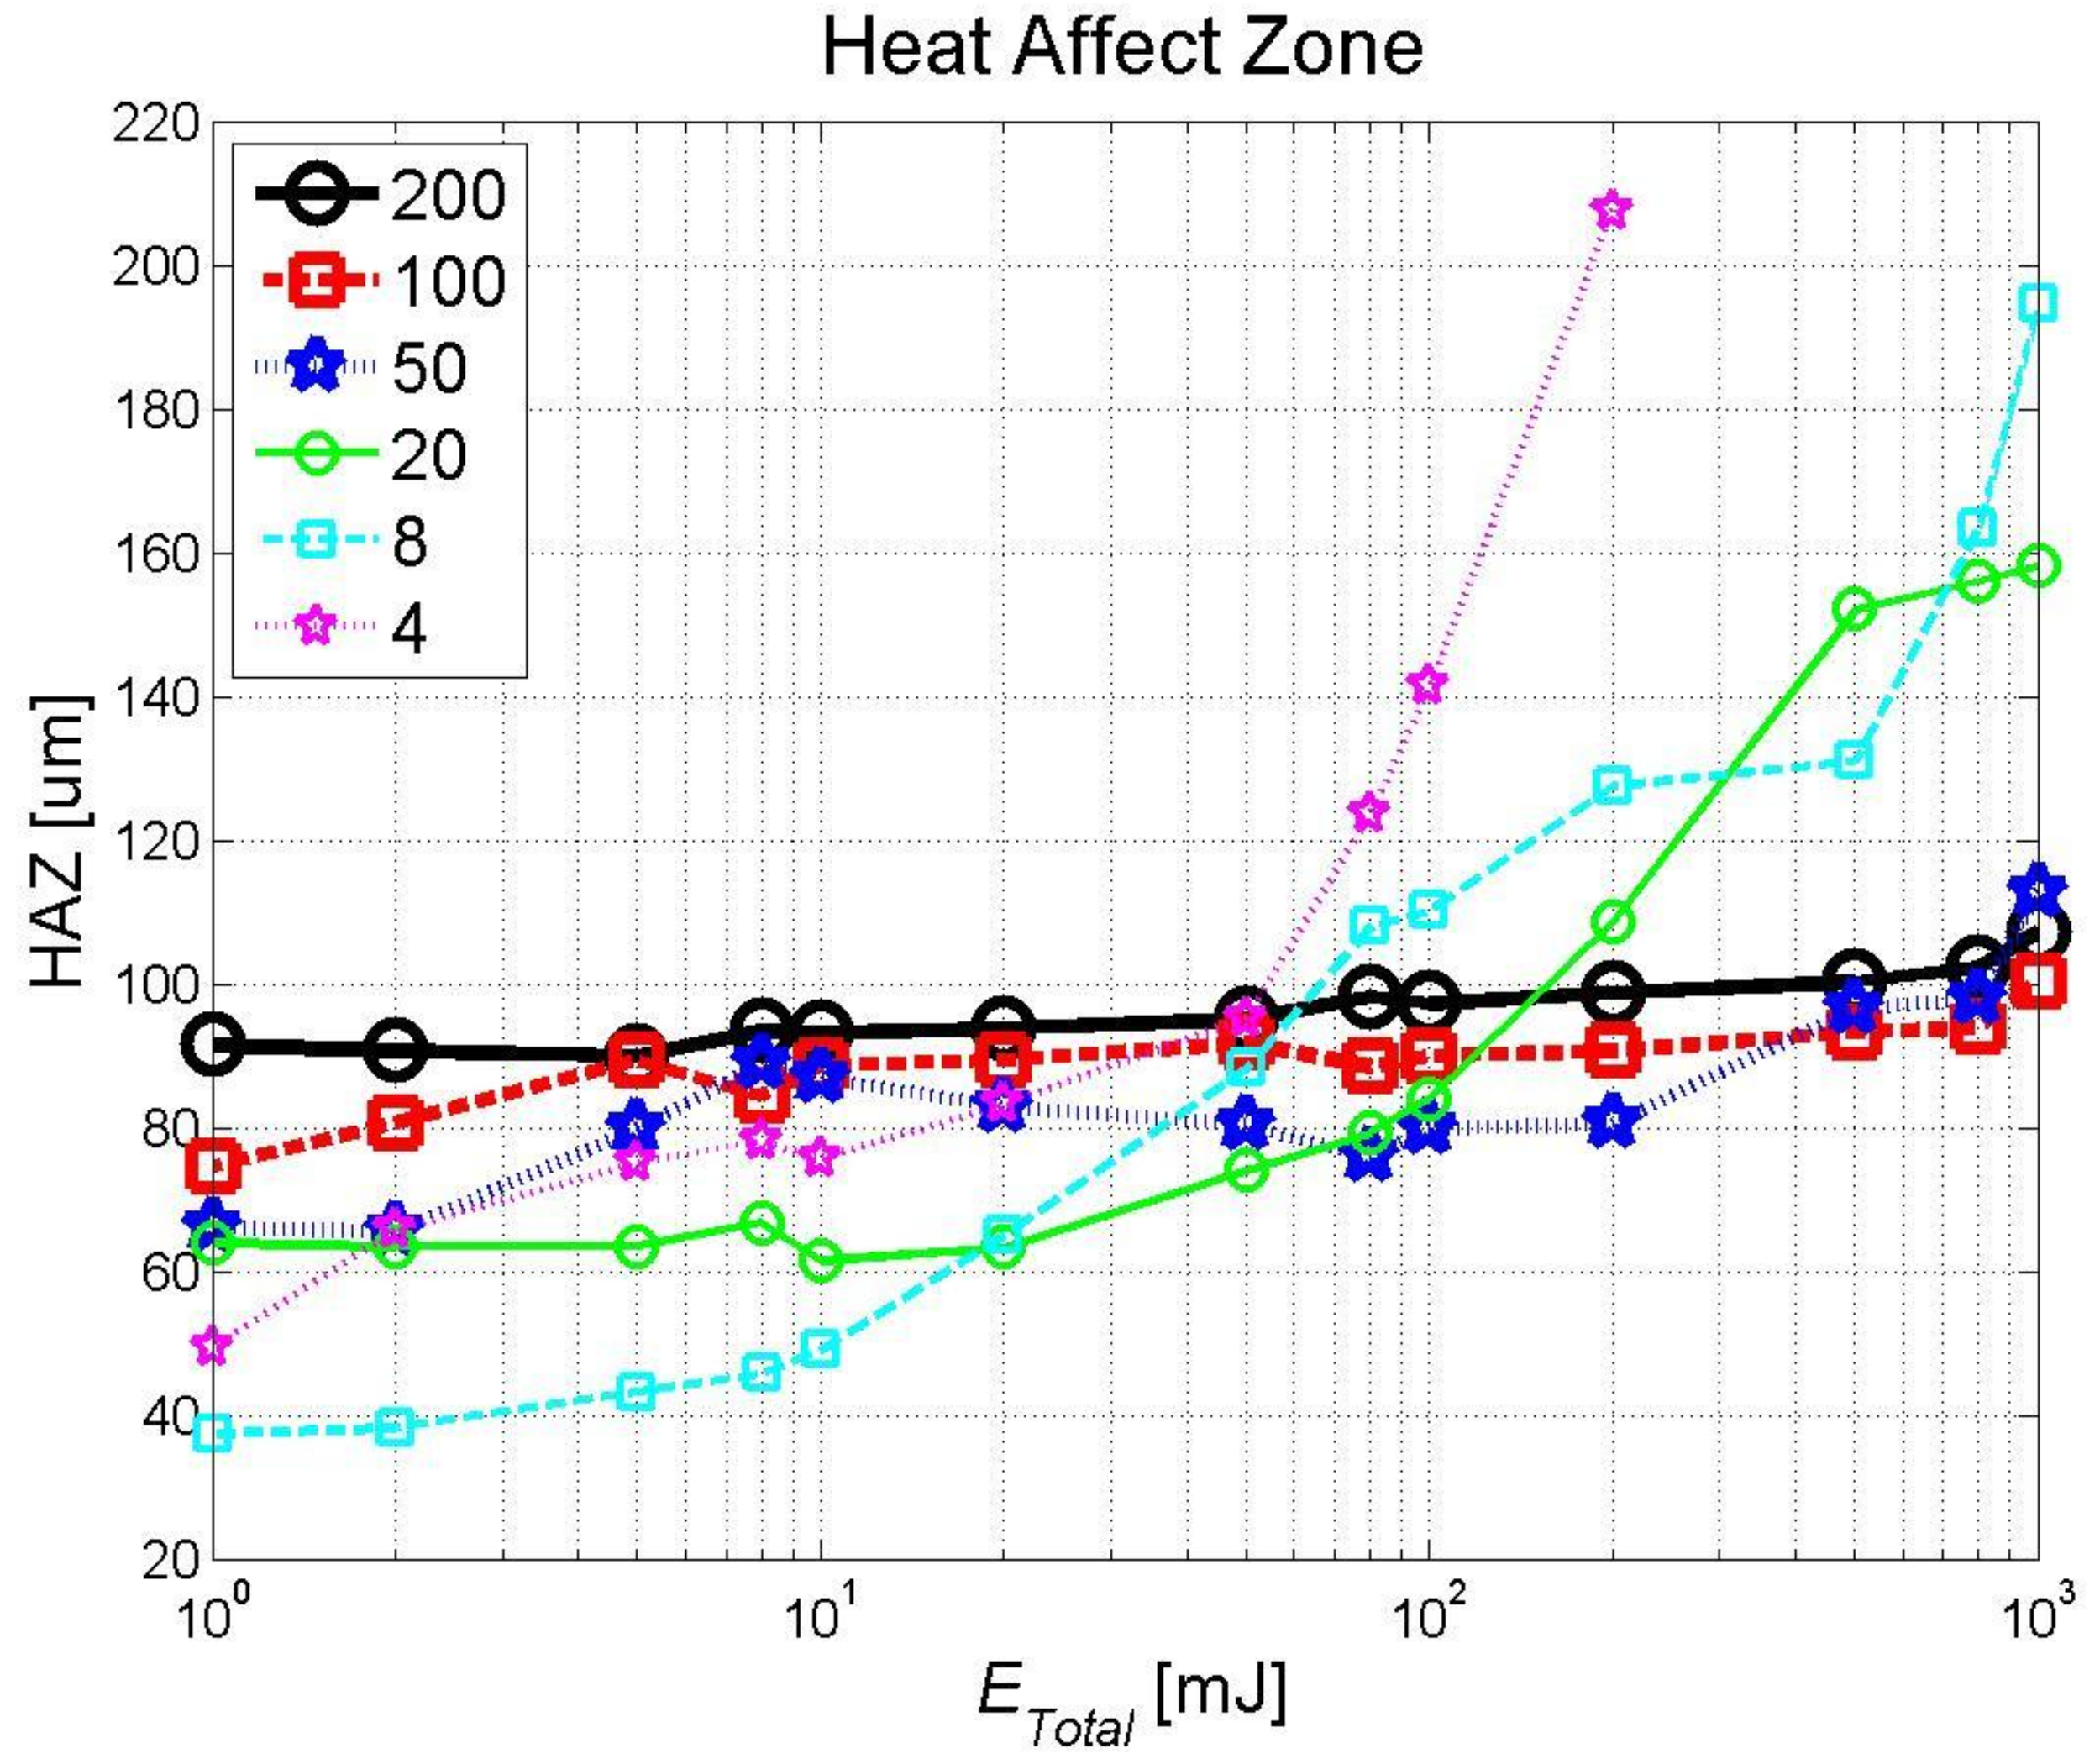
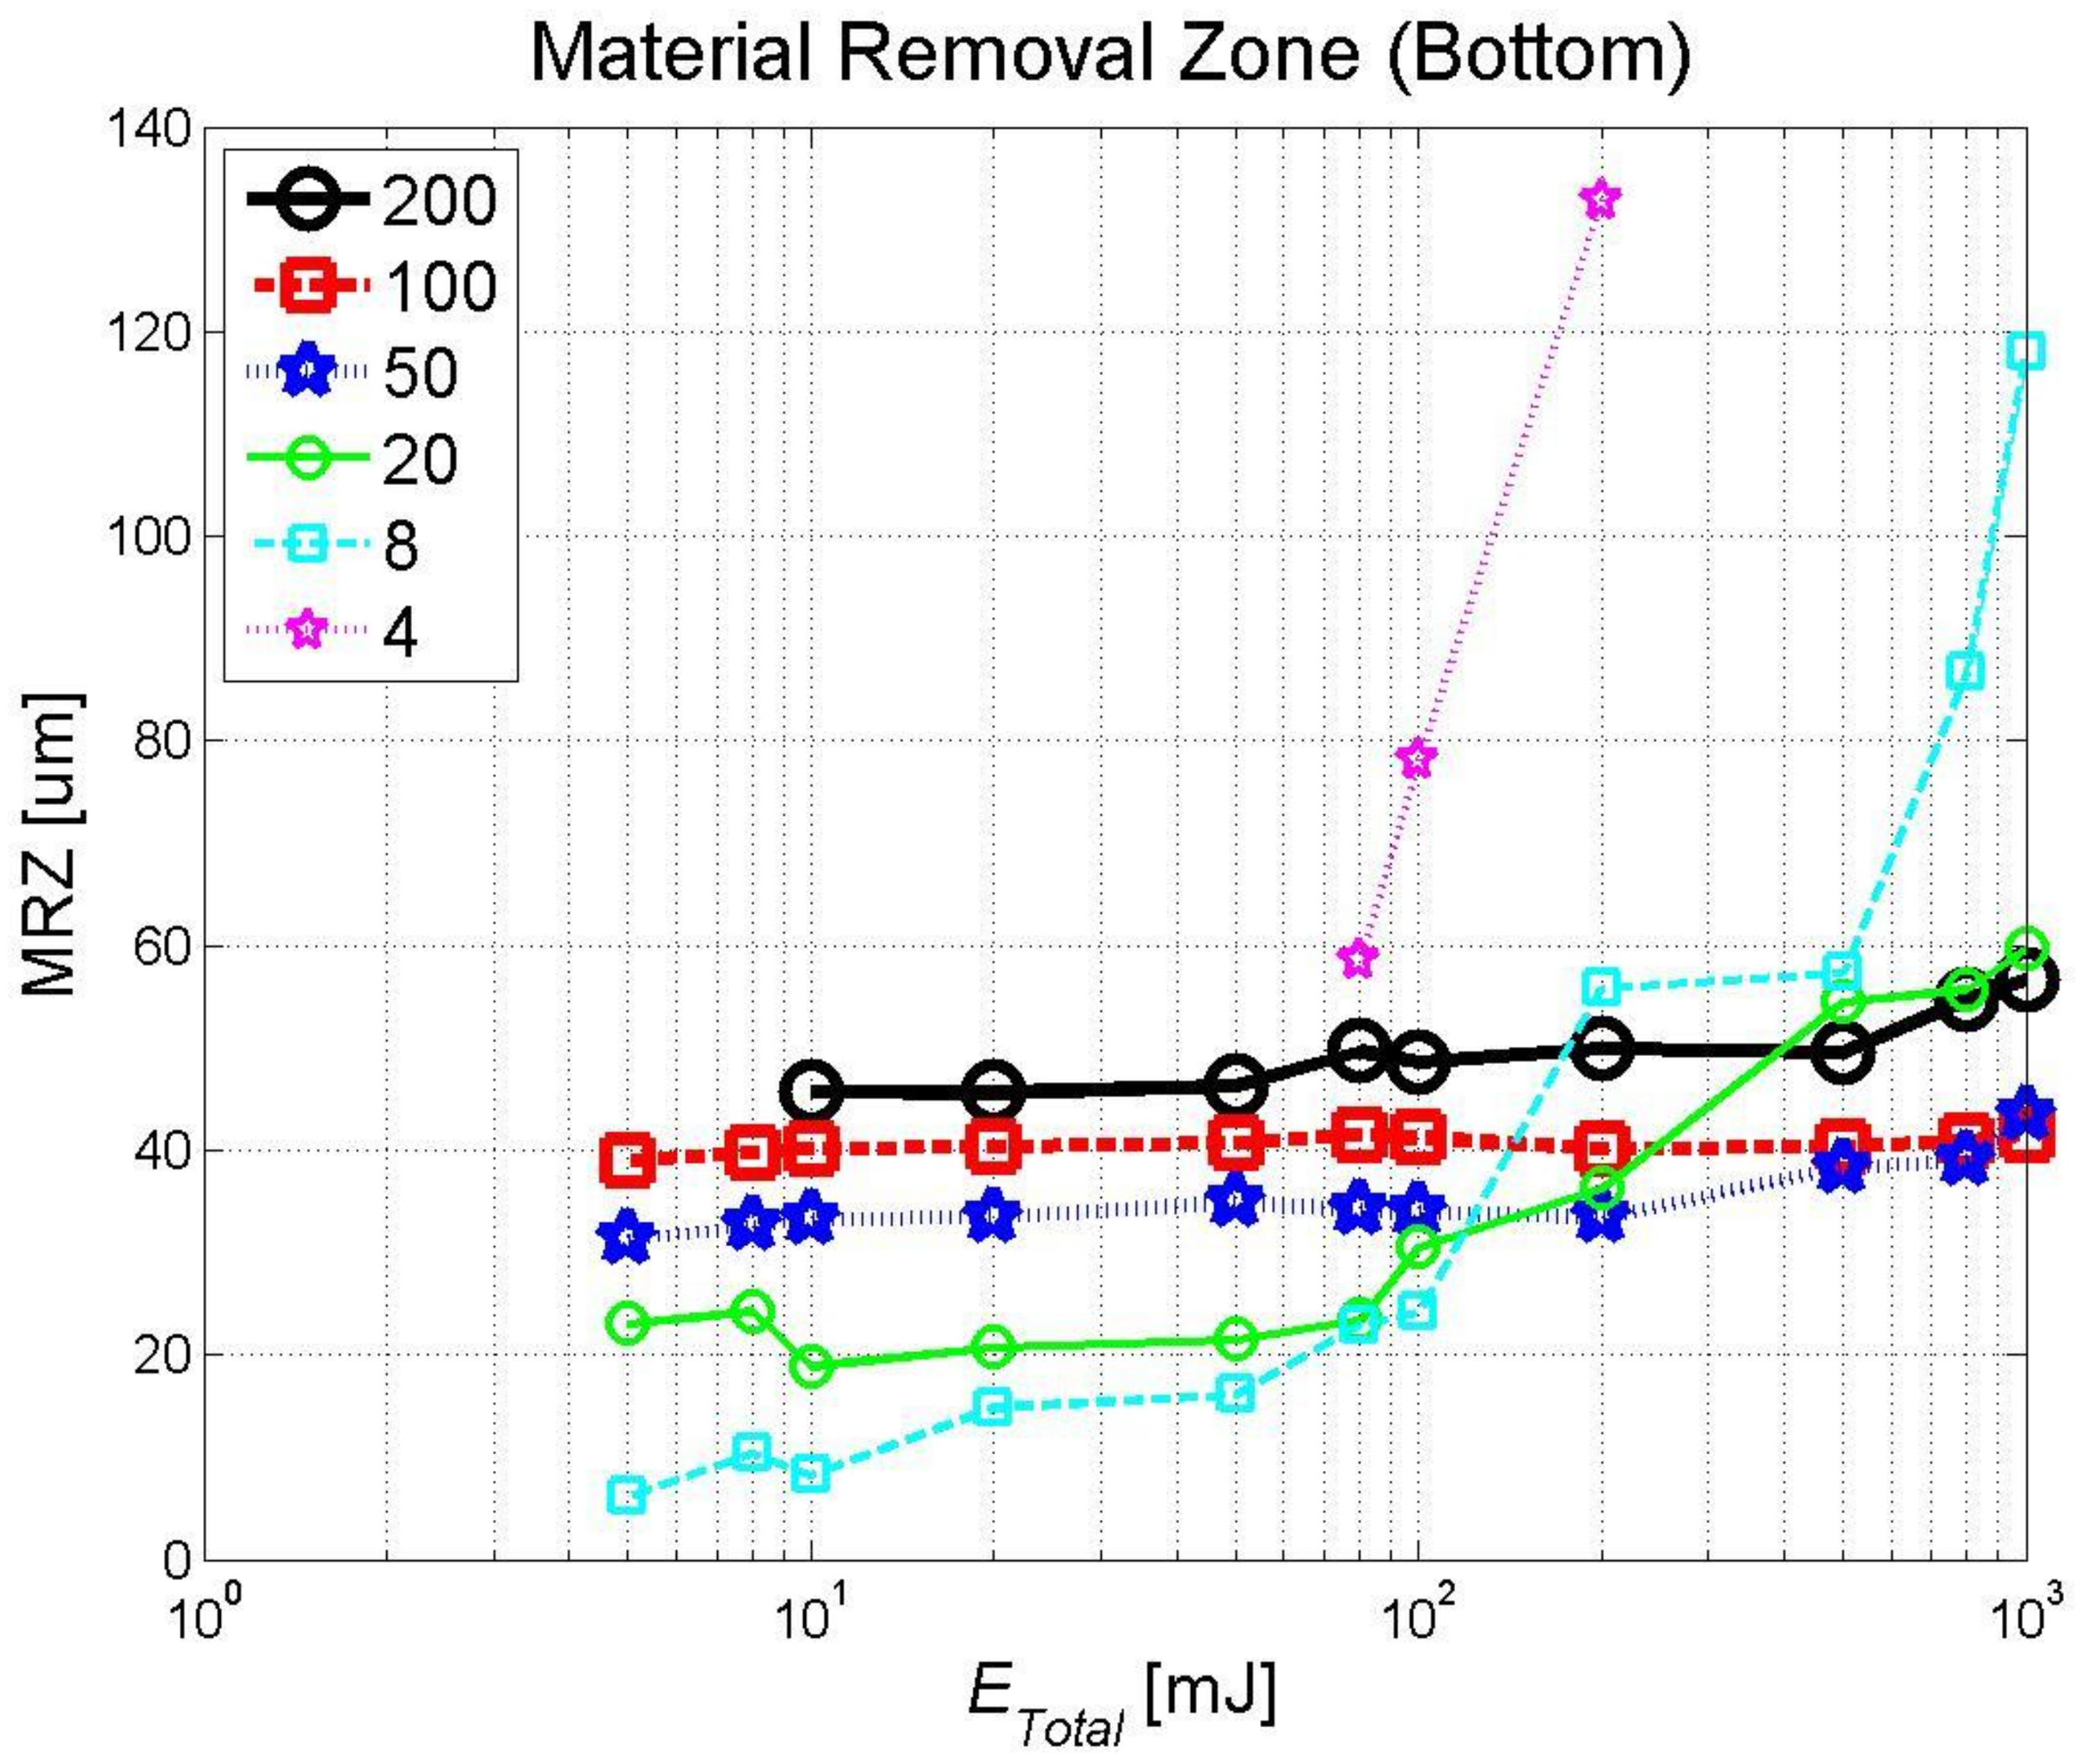
The size of the heat affected zone (HAZ) and the size of the top and bottom material removal zones (MRZ top, bottom) are measured and plotted. Figure 4, Figure 5 and Figure 6 show the HAZ, MRZ Top, and MRZ bottom graphs in order. The x-axis (ETotal) is expressed as a logarithmic scale. For reference, the series with Δt = 4 ns mostly lacked measurements because there was no trace on the surface or the number of laser pulses on the parameters exceeded the number of pulses possible for the experimental equipment. As a result, with the current experimental conditions, the experiment could be done. For the MRZ Bottom graph, non-penetrating measurements are excluded. In Figure 4, Figure 5 and Figure 6, it can be seen that the size of HAZ and MRZ (Top, Bottom) increases as ETotal increases across all graphs. Also considering the HAZ and MRZ (Top, Bottom) graphs, the change in the HAZ and MRZ (Top, Bottom) size is relatively small in the section where ETotal = 10 mJ or less for all Δt. Moreover, in the HAZ and MRZ (Top, Bottom) graphs, Δt can be classified as long pulses (Δt = 50, 100, 200 ns) and short pulses (Δt = 4, 8, 20 ns). The hole sizes of the long pulses increase steadily with little deviation as ETotal increases. On the other hand, the short pulses have a large deviation of hole sizes and the sizes rise sharply as ETotal increases.
In order to analyze the degree of change for the HAZ and MRZ (Top, Bottom) values by Δt, the HAZ variation (ΔHAZ) and the MRZ variation (ΔMRZ) according to the ETotal change are obtained. ΔHAZ is calculated from Equation (4):
ΔMRZ is calculated from Equation (5):
The ΔMRZ at the top surface is expressed as Δ(MRZ)Top and the ΔMRZ at the bottom surface is expressed as Δ(MRZ)Bottom. Each variation is summarized in Table 2. Based on this table, each variation is shown in Figure 7. First, in the case of ΔHAZ, ΔHAZ is 15.66 μm at Δt = 200 ns, which is the smallest of all the Δt series. At Δt = 100 and 50 ns, ΔHAZ is 25.93 and 46.58 μm, respectively. At Δt = 20, 8, and 4 ns, ΔHAZ is 89.31, 157.1, and 158.1 μm, respectively, which are relatively large values compared to those at Δt = 200, 100, and 50 ns. Secondly, in the case of MRZ Top, Δ(MRZ)Top is 19.22 μm at Δt = 200 ns. Δ(MRZ)Top is 14.69 μm at Δt = 100 ns, which is the smallest of all Δt series. At Δt = 50 ns, Δ(MRZ)Top is 28.84µm. At Δt = 20, 8 and 4 ns, Δ(MRZ)Top is 54.58, 123.0, and 125.2 µm, respectively. Especially, the values at Δt = 8, 4 ns are relatively large compared to the values at Δt = 200, 100, and 50 ns. Thirdly, in the case of MRZ Bottom, Δ(MRZ)Bottom is 10.96 μm at Δt = 100 ns. Δ(MRZ)Bottom is 2.362 μm at Δt = 100 ns, which is the smallest of all Δt series. At Δt = 50 ns, Δ(MRZ)Bottom is 12.01 μm. At Δt = 20, 8, 4 ns, Δ(MRZ)Bottom is 36.68, 111.7 and 74.31 μm respectively. Especially, the values at Δt = 8, 4 ns are relatively greater than the values at Δt = 200, 100, and 50 ns. In this analysis of the variation graph, it is clearly confirmed that ΔHAZ, Δ(MRZ)Top and Δ(MRZ)Bottom values tend to increase as the pulse duration decreases. This trend is related to the pulse energy and repetition rate. The material removal process, which is caused by two forms such as vaporization and liquid melt expulsion, can affect the observed trend. Heat is accumulated more on the workpiece during pulsed laser material processing if the repetition rate increases, even though pulse energy decreases [30]. If more heat is accumulated, the material removal is attributed to vaporization more than liquid melt expulsion. Thus, the vaporization may contribute more than melt expulsion to remove the material if shorter laser pulses, having a relatively lower pulse energy and higher repetition rate, are used. Since the material could be removed more efficiently and effectively by vaporization than melt expulsion, the difference observed in Table 2 and Figure 7 can be explained.
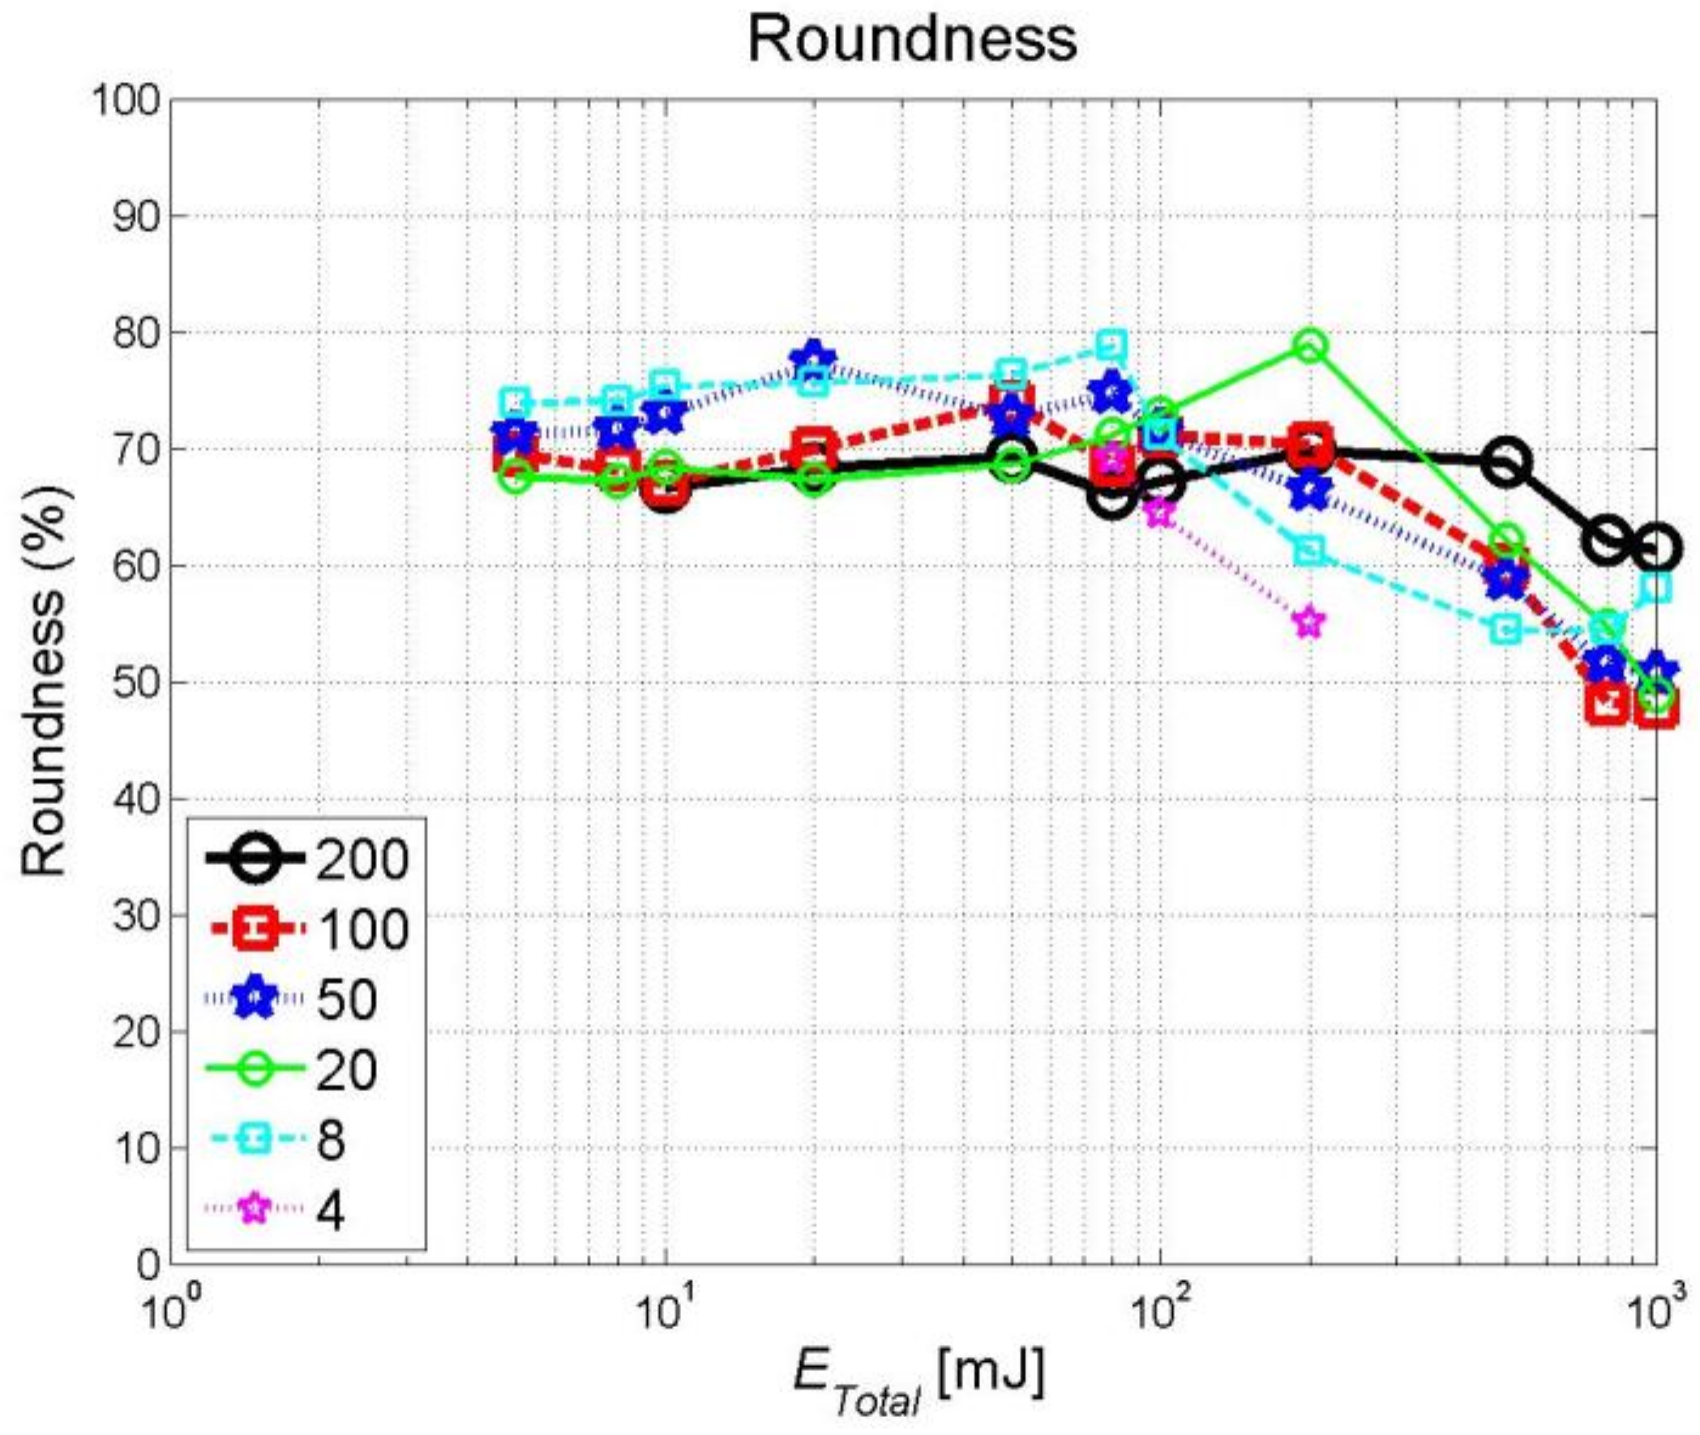
Table 3 shows roundness values. For reference, in all the Δt series, the section with low ETotal is not penetrated, and only a small amount of melting trace is generated, so the roundness could not be measured and the value is excluded. These excluded values are expressed as ‘X’ in the table. Also, at Δt = 4 ns series, the measured values of ETotal = 500, 800, and 1000 mJ are not shown. Because the number of laser pulses on the parameter exceeded the number of pulses that can be set for the experimental equipment, the experiment could not be done with the current experimental conditions. Therefore, these values are excluded and are expressed as ‘No Exp’ in the table. Figure 8 is a graph of roundness according to Δt series. At Δt = 200 ns series, roundness is almost constant regardless of ETotal. At Δt = 100 ns series, the roundness is almost constant at ETotal = 200 mJ or less, but the roundness is decreased at 500 mJ or more. At Δt = 50 ns series, the roundness is almost constant at ETotal = 100 mJ or less, but the roundness is decreased at 200 mJ or more. At Δt = 20 ns series, the roundness is almost constant at ETotal = 200 mJ or less, but the roundness is decreased at 500 mJ or more. At Δt = 8 ns series, the roundness is almost constant at ETotal = 100 mJ or less, but the roundness is decreased at 200 mJ or more. Overall, the roundness value can be confirmed to decrease as the ETotal increases. This is because, if the number of repetitive pulses is small (i.e., low ETotal), the surface will be relatively flat and radiate transmitted heat symmetrically. However, as the number of pulses increases (i.e., high ETotal), the molten portion of the material will become larger and the molten surface will be relatively rugged, resulting in an asymmetric heat transfer.
3.2. Observation of Surface Characteristics
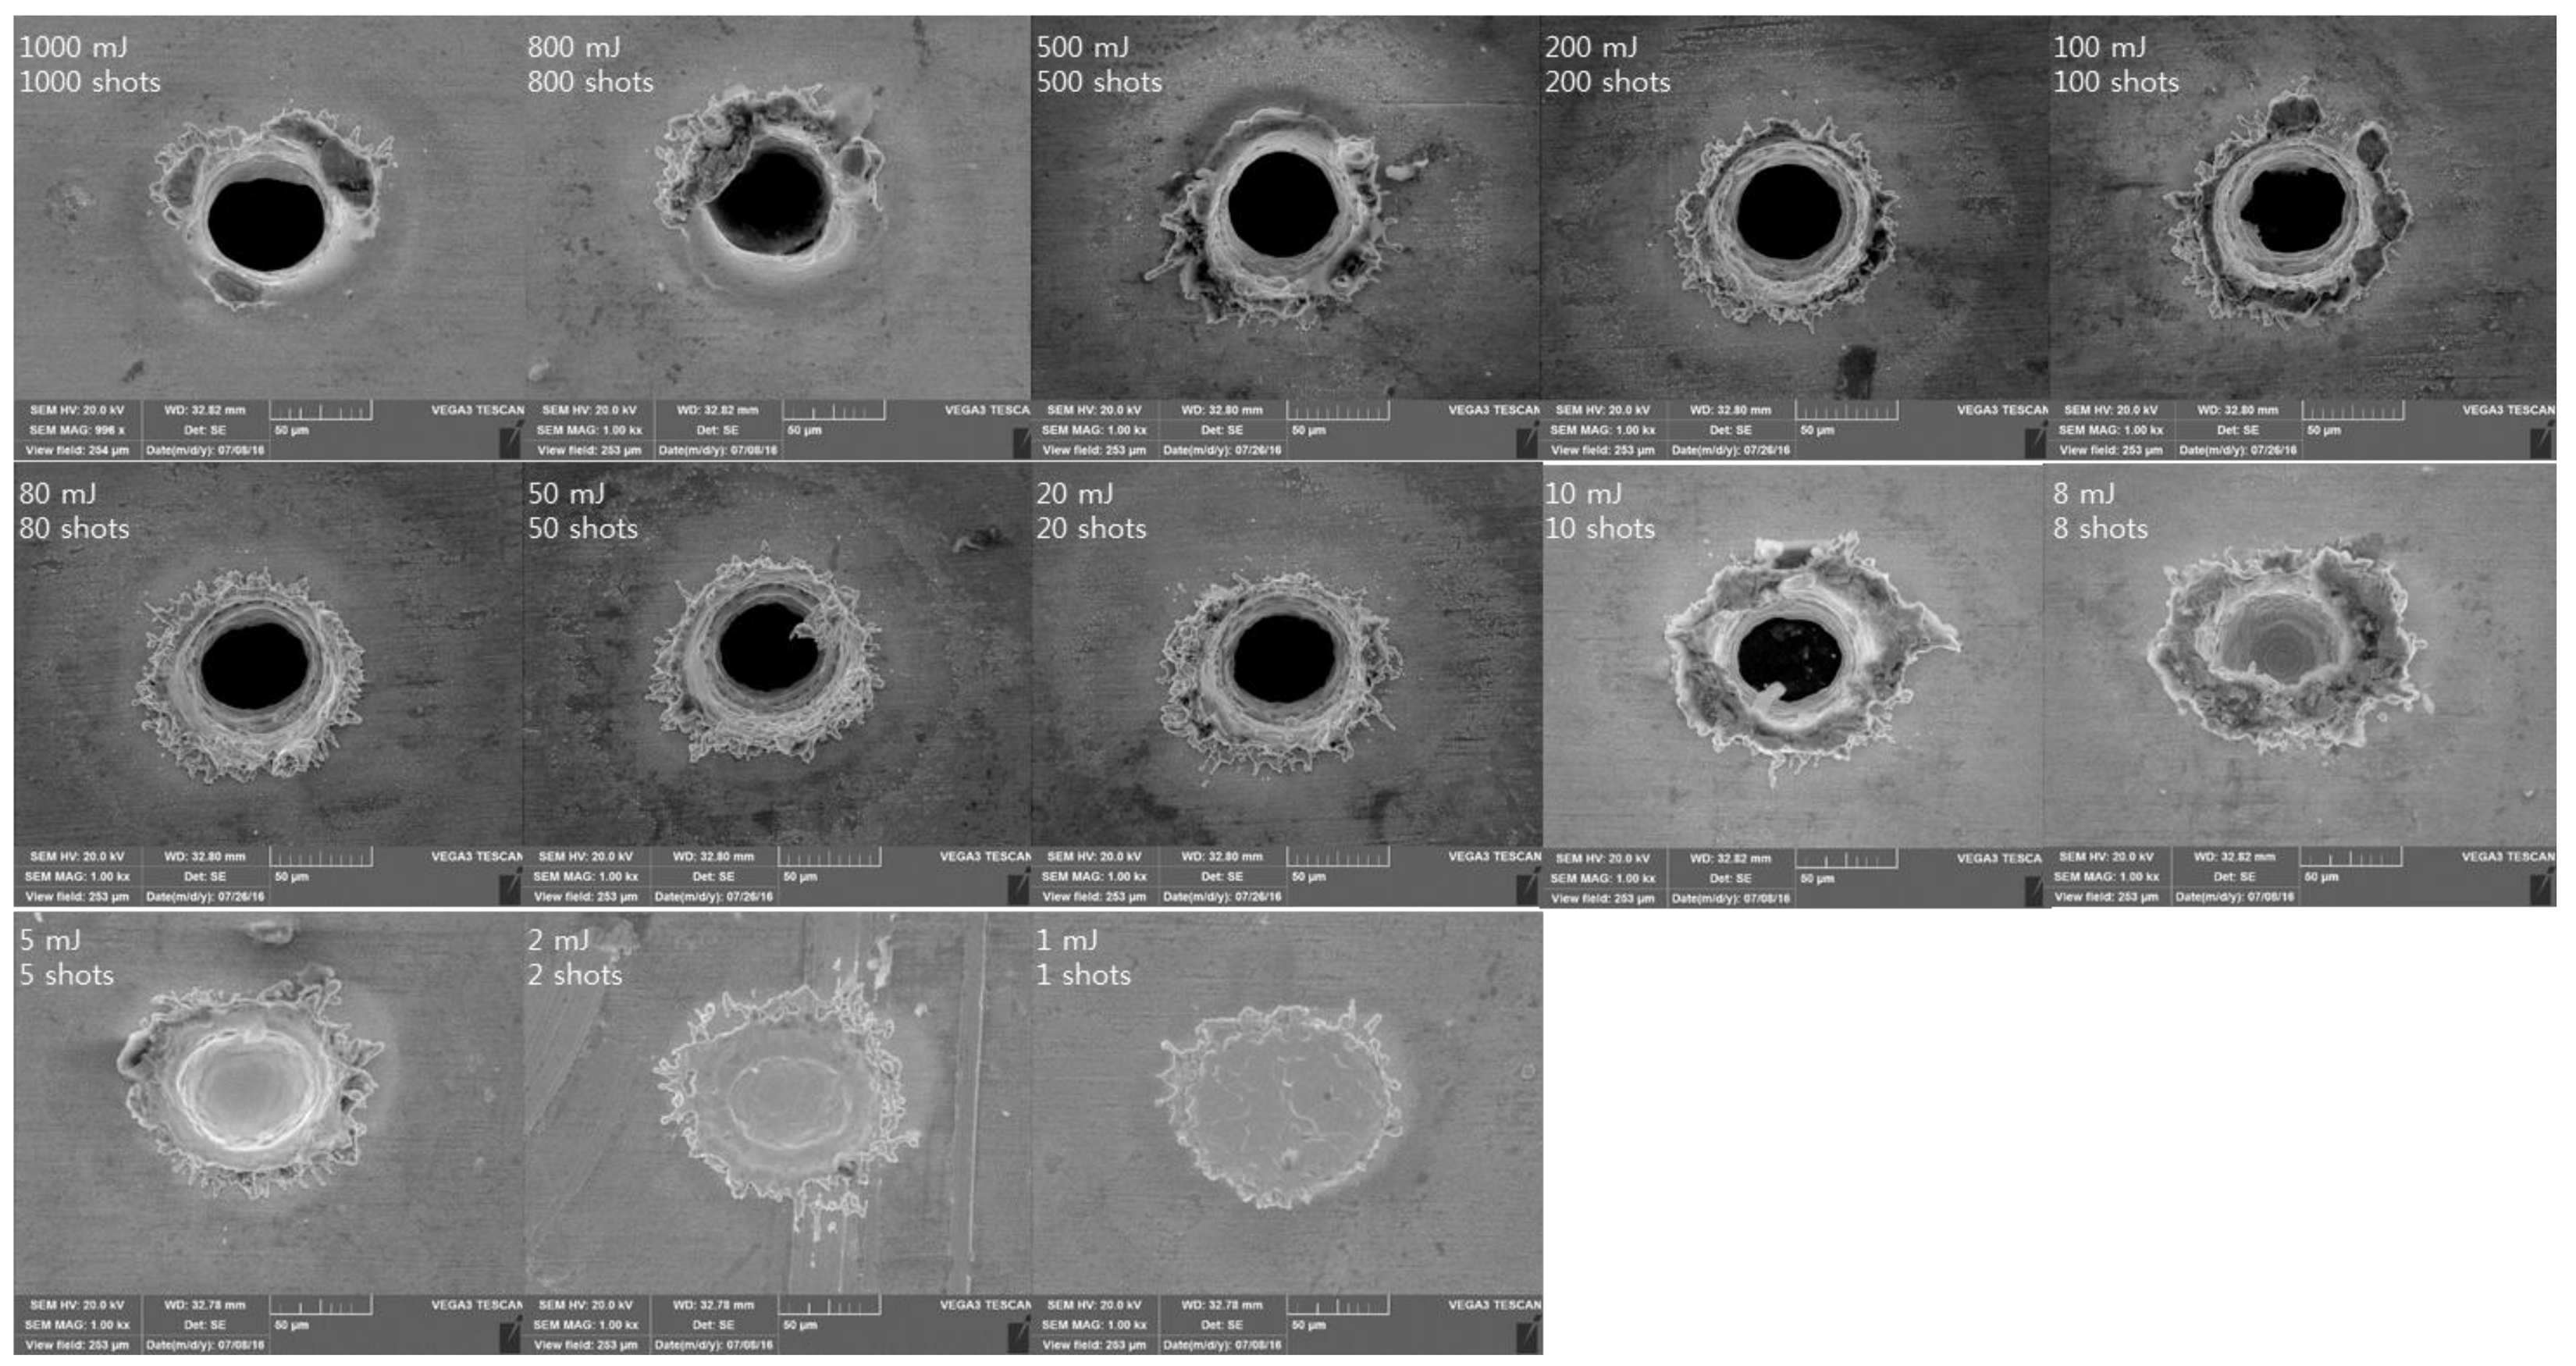
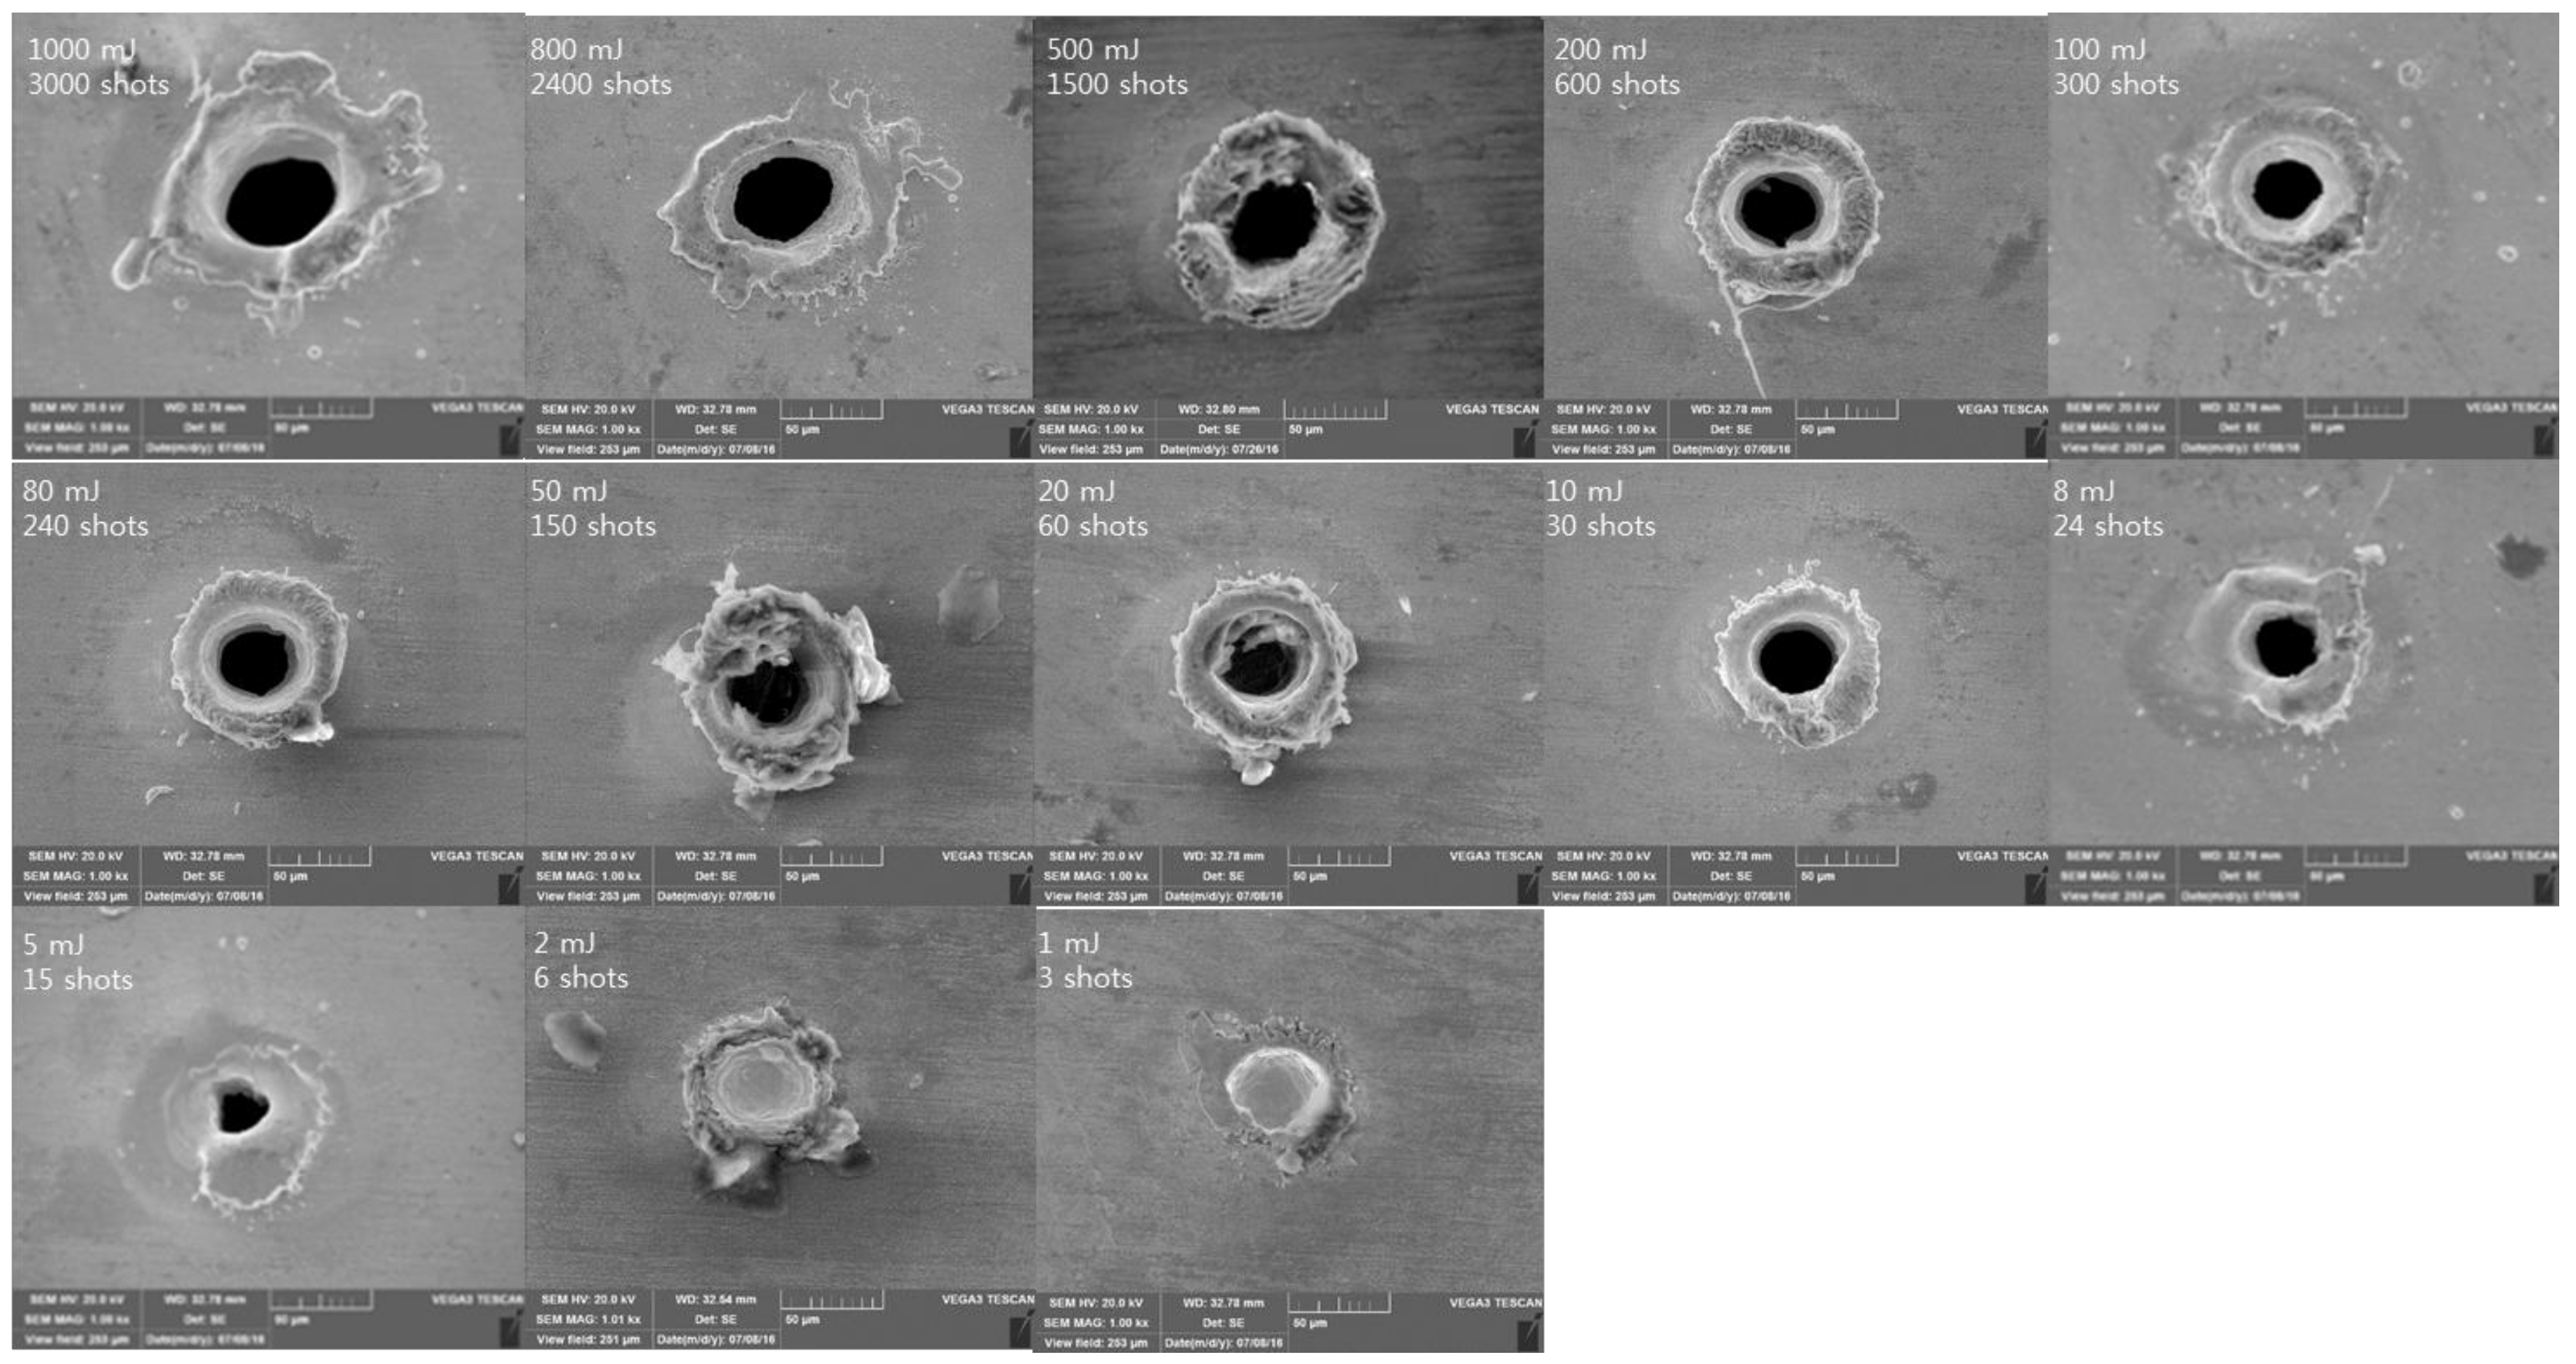
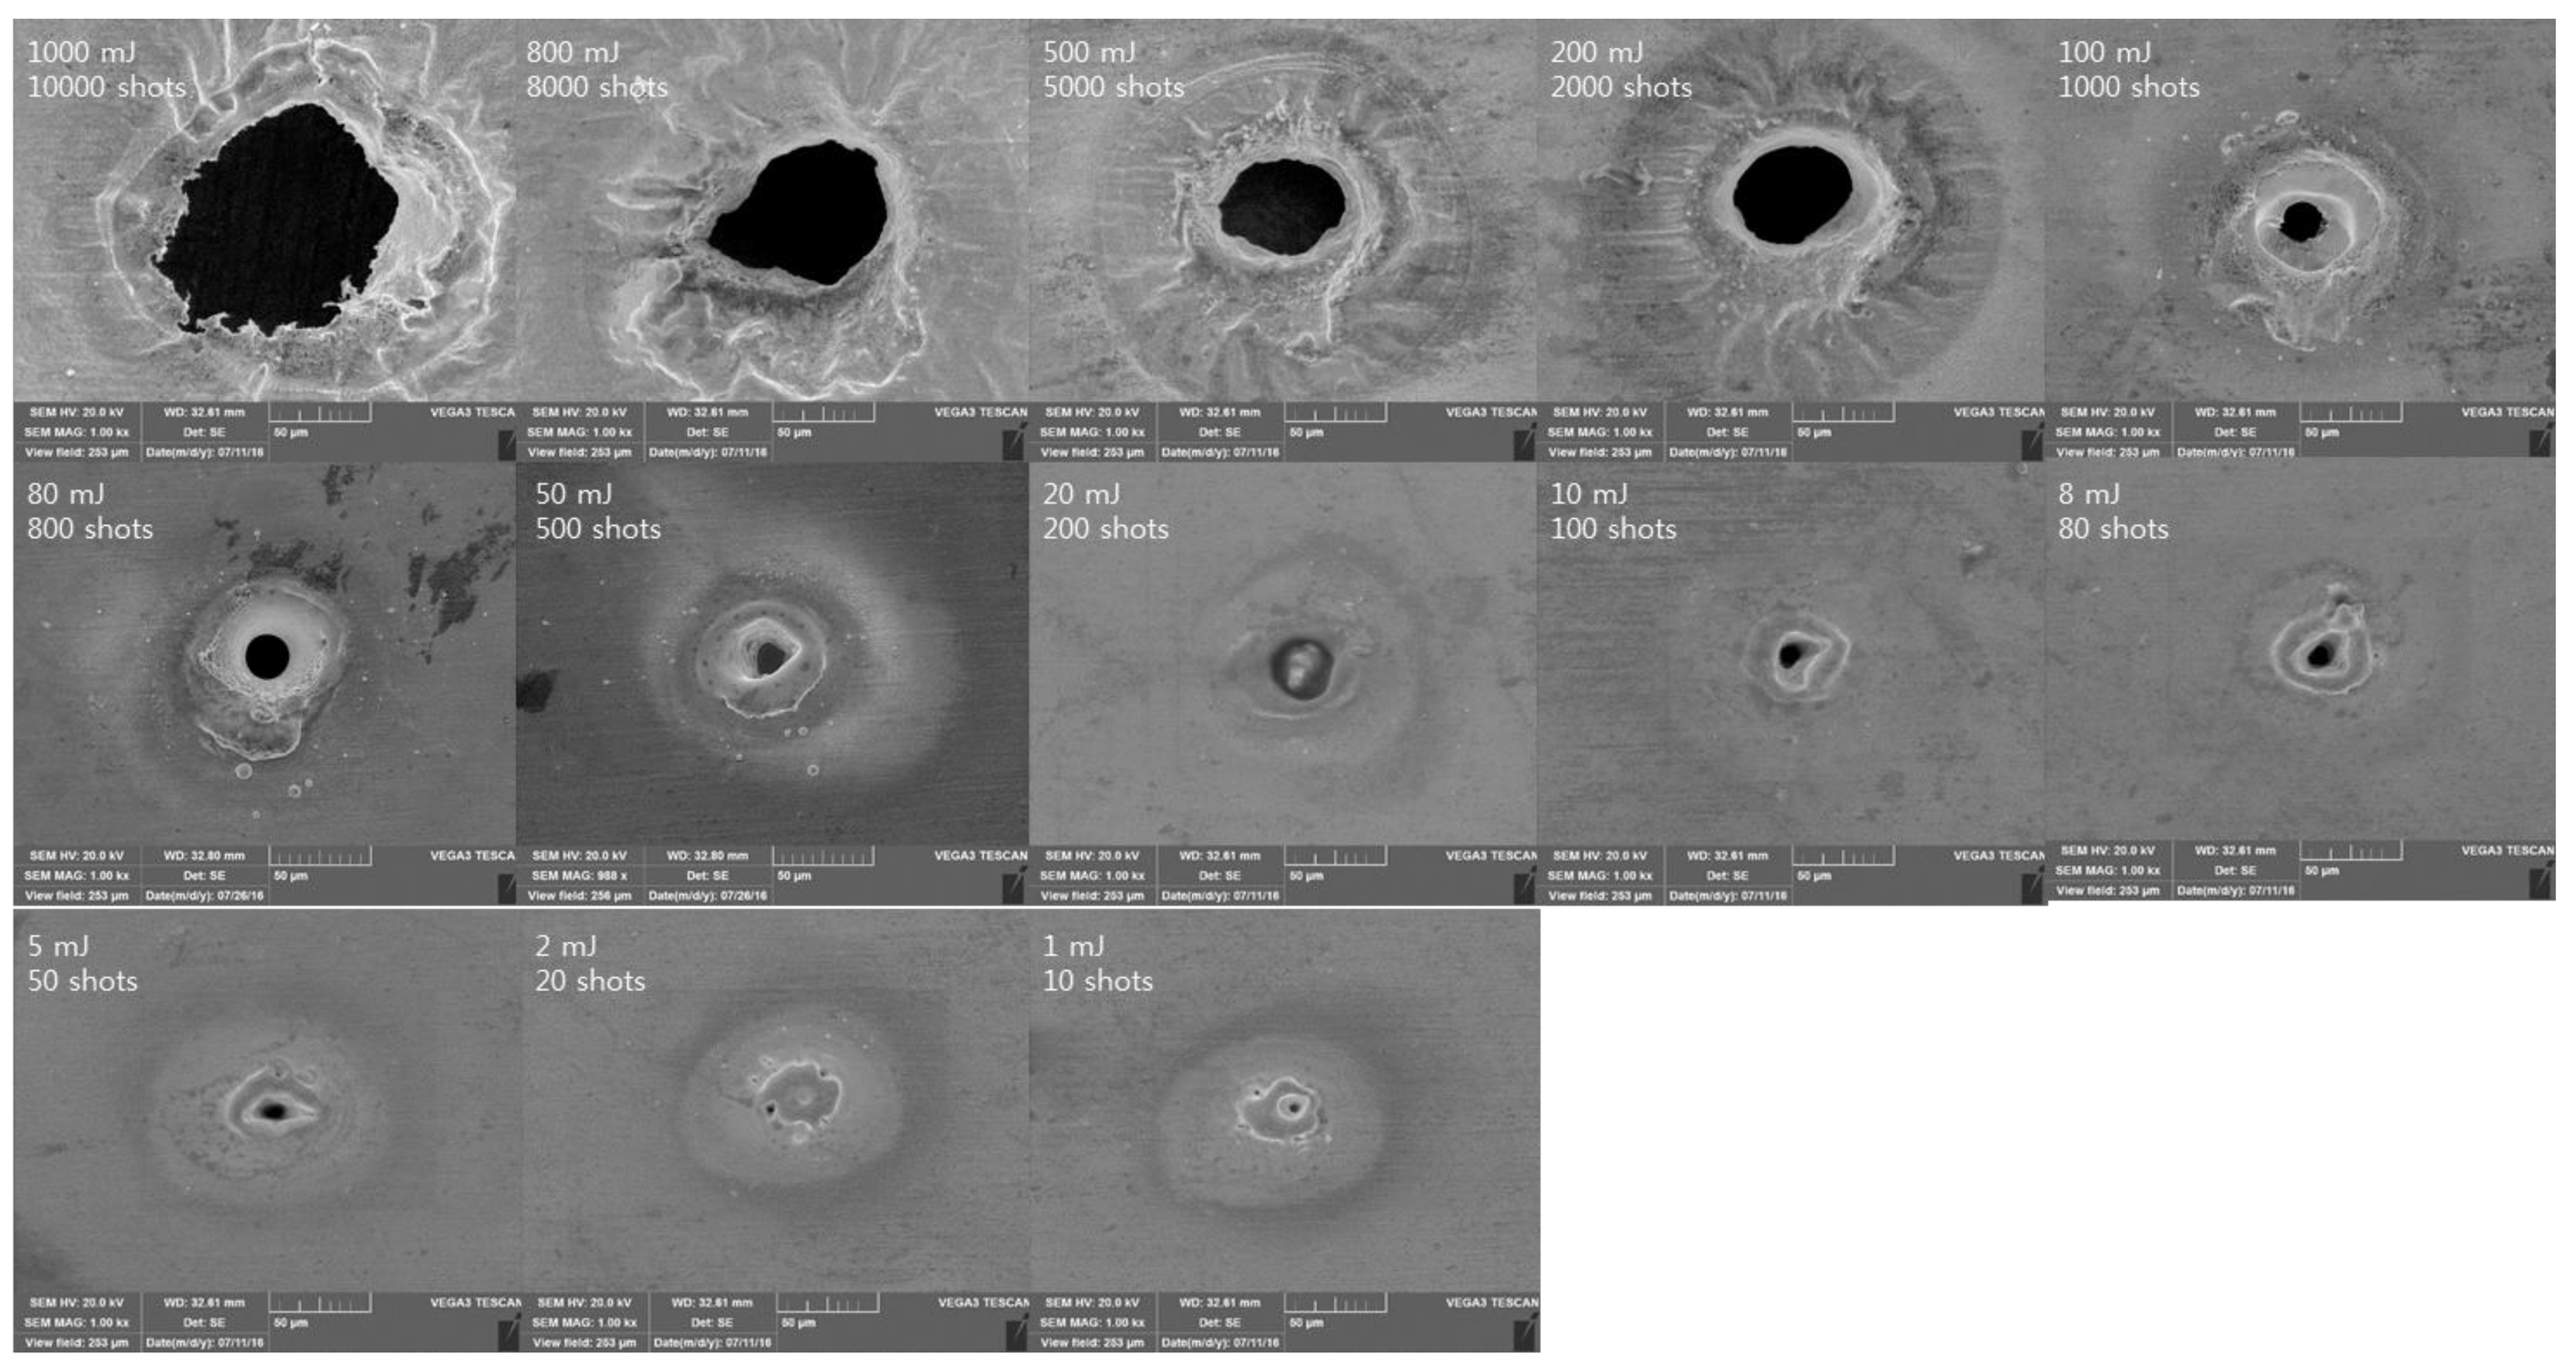
The surface characteristics of laser and material interaction are observed by SEM photographs. The experimental specimens are taken by SEM and the surface photographs of the specimens are compiled according to Δt (Figure 9, Figure 10, Figure 11, Figure 12 and Figure 13). In the case of the photos of Δt = 4 ns series, pulse energy is very low, so it is omitted because it has mostly no trace and no penetration. In all Δt series overall, round machining residue or a strong spatter mark of molten materials in the radial direction are observed around the MRZ surface. At Δt = 200 ns series, the burr is created around the hole as a whole at all ETotal. Especially at ETotal = 10 and 8 mJ, a thick burr is observed. Below ETotal = 8 mJ, only the melting marks are formed. At Δt = 100 and 50 ns, on the whole, a relatively thick burr is observed around the MRZ. Through this, it can be deduced that the recoil pressure generated by the laser interaction repeatedly pushes the molten material in the radial direction. At Δt = 100 ns series, it can be observed that width is not constant compared to Δt = 50 ns series. In addition, in both series, below ETotal = 2 mJ, only melting marks are formed. At Δt = 20 ns series, only a small burr is generated at ETotal = 80 mJ or more, and a burr with no constant width is created at ETotal = 50 mJ or less. In addition, at ETotal = 2 mJ or less, it is not penetrated. Finally, at Δt = 8 ns series, the burr is almost not generated as a whole. Furthermore, at ETotal = 200~1000 mJ, the surface around the MRZ is crumpled, and only a slight melting trace is observed at ETotal of 2 mJ or less.
In the case of roundness, SEM photographs are observed in comparison with the results of the roundness graph analysis. At all Δt series in the roundness graph, according to ETotal change, there is a section where the roundness values are constantly high and a section where the roundness values are decreased. At all Δt series in the SEM photographs, the MRZ shapes with the high roundness values show an almost perfect circle, and the MRZ shapes with the low roundness values show a distorted shape or an ellipse.
4. Conclusions
As the production of micro-electronics using nickel-coated copper is rapidly increasing, laser material processing is becoming a key processing technology due to high precision requirements. However, systematic studies on the processing of nickel-coated copper using a laser are relatively insufficient. Therefore, in this study, the interaction between nickel-coated beryllium copper (BeCu) and lasers are studied in terms of the heat affected zone (HAZ), material removal zone (MRZ), and roundness.
First, the pulse duration of long pulses (Δt = 50, 100, 200 ns) has a relatively wide MRZ and a small deviation of hole diameter. On the other hand, the pulse duration of lower series (Δt = 4, 8, 20 ns) has a very large deviation of hole diameter. Thus, a series with a low Δt is a process sensitive to the change of the Total Accumulated Energy (ETotal). Next, the roundness graph is analyzed. Common to all Δt series, if the energy is too high, the roundness is not good due to an excessive heat effect. On the contrary, if the energy is too low, the processing is not successful. In the SEM photograph, the surface of the specimen is observed according to ETotal change for each Δt series. At all ETotal of Δt = 200 and 100 ns series and above ETotal = 20 mJ of Δt = 50 ns series, the burr is thick and large. The interaction characteristics between the laser and nickel-coated BeCu discussed in this paper will be a good reference for further research in the area of laser machining.
Acknowledgments
The research described herein was sponsored by the National Research Foundation of Korea (NRF) grant funded by the Korean government (Ministry of Science, Information and Communications Technology & Future Planning) (No. 2017R1C1B5017916). The opinions expressed in this paper are those of the authors and do not necessarily reflect the views of the sponsors.
Author Contributions
Dongkyoung Lee conceived and designed the experiments, performed the experiments, analyzed the data, contributed analysis tools and wrote the paper
Conflicts of Interest
The author declare no conflict of interest.
References
- Lee, D.; Cho, J.; Kim, C.H.; Lee, S.H. Application of laser spot cutting on spring contact probe for semiconductor package inspection. Opt. Laser Technol. 2017, 97, 90–96. [Google Scholar] [CrossRef]
- Lee, C.-M.; Kim, D.-H.; Baek, J.-T.; Kim, E.-J. Laser assisted milling device: A review. Int. J. Precis. Eng. Manuf.-Green Technol. 2016, 3, 199–208. [Google Scholar] [CrossRef]
- Jeong, Y.C.; Cho, Y.T.; Jung, Y.G. Design of stitch welded shape with laser-ARC hybrid welding for ultra-high strength steel. Int. J. Precis. Eng. Manuf.-Green Technol. 2016, 3, 193–197. [Google Scholar] [CrossRef]
- Steen, W.M. Laser Material Processing, 3rd ed.; Springer: London, UK, 2003. [Google Scholar]
- Kannatey-Asibu, E.; Wiley InterScience (Online Service). Principles of Laser Materials Processing; Wiley: Hoboken, NJ, USA, 2009. [Google Scholar]
- Choi, J.-H.; Moon, Y.; Lee, S.-H.; In, J.H.; Jeong, S. Wavelength dependence of the ablation characteristics of Cu (In, Ga) Se2 solar cell films and its effects on laser induced breakdown spectroscopy analysis. Int. J. Precis. Eng. Manuf.-Green Technol. 2016, 3, 167–171. [Google Scholar] [CrossRef]
- Lee, D. Experimental Investigation of Laser Spot Welding of Ni and Au-Sn-Ni Alloy. J. Weld. Join. 2017, 35, 1–5. [Google Scholar] [CrossRef]
- Demir, A.G.; Previtali, B. Dross-free submerged laser cutting of AZ31 Mg alloy for biodegradable stents. J. Laser Appl. 2016, 28, 032001. [Google Scholar] [CrossRef]
- Lee, D.; Mazumder, J. Effects of momentum transfer on sizing of current collectors for lithium-ion batteries during laser cutting. Opt. Laser Technol. 2018, 99, 315–325. [Google Scholar] [CrossRef]
- Lee, D.; Pyo, S. Experimental Investigation of Multi-mode Fiber Laser Cutting of Cement Mortar. Materials 2018, 11, 278. [Google Scholar] [CrossRef] [PubMed]
- Lee, D. Investigation of Laser Ablation on Acrylonitrile Butadiene Styrene Plastic Used for 3D Printing. J. KWJS 2018, 36, 50–56. [Google Scholar]
- Lee, D. Investigation of Physical Phenomena and Cutting Efficiency for Laser Cutting on Anode for Li-Ion Batteries. Appl. Sci. 2018, 8, 266. [Google Scholar] [CrossRef]
- Lee, D.; Ahn, S. Investigation of Laser Cutting Width of LiCoO2 Coated Aluminum for Lithium-Ion Batteries. Appl. Sci. 2017, 7, 914. [Google Scholar] [CrossRef]
- Lee, D.; Patwa, R.; Herfurth, H.; Mazumder, J. Parameter optimization for high speed remote laser cutting of electrodes for lithium-ion batteries. J. Laser Appl. 2016, 28, 022006. [Google Scholar] [CrossRef]
- Lee, D.; Patwa, R.; Herfurth, H.; Mazumder, J. Computational and experimental studies of laser cutting of the current collectors for lithium-ion batteries. J. Power Sources 2012, 210, 327–338. [Google Scholar] [CrossRef]
- Karimzad Ghavidel, A.; Navidfar, A.; Shabgard, M.; Azdast, T. Role of CO2 laser cutting conditions on anisotropic properties of nanocomposite contain carbon nanotubes. J. Laser Appl. 2016, 28, 032006. [Google Scholar] [CrossRef]
- Staehr, R.; Bluemel, S.; Jaeschke, P.; Suttmann, O.; Overmeyer, L. Laser cutting of composites—Two approaches toward an industrial establishment. J. Laser Appl. 2016, 28, 022203. [Google Scholar] [CrossRef]
- Zhang, C.; Wen, P.; Yao, Z.; Yuan, Y.; Fan, X. Visualization of flow separation inside cut kerf during laser cutting of thick sections. J. Laser Appl. 2016, 28, 022204. [Google Scholar] [CrossRef]
- Rodrigues, C.G.; Duflou, J.R. Into polarization control in laser cutting with direct diode lasers. J. Laser Appl. 2016, 28, 022207. [Google Scholar] [CrossRef]
- Lee, D.; Mazumder, J. Dataset demonstrating effects of momentum transfer on sizing of current collector for lithium-ion batteries during laser cutting. Data Brief 2018, 17, 6–14. [Google Scholar] [CrossRef] [PubMed]
- Ghaderi, M.; Rezagholizadeh, M.; Monir Vaghefi, S.M.; Heidary, A. Investigation of high temperature wear resistance of electroless nickel coating with different contents of phosphorous. Prot. Met. Phys. Chem. Surf. 2016, 52, 538–542. [Google Scholar] [CrossRef]
- Li, B.; Zheng, M.; Xue, H.; Pang, H. High performance electrochemical capacitor materials focusing on nickel based materials. Inorg. Chem. Front. 2016, 3, 175–202. [Google Scholar] [CrossRef]
- Chai, L.; Rae, A.; Wilson, J.M. Methods for Manufacture a Capacitor with Three-Dimensional High Surface Area Electrodes. U.S. Patent 9,343,231, 17 May 2016. [Google Scholar]
- Stowers, J.P.; Burgers, H.T.; Blackard, P.D. Coaxial Double-Headed Spring Contact Probe Assembly and Coaxial Surface Contact for Engagement Therewith. U.S. Patent 5,936,421, 10 August 1999. [Google Scholar]
- Carbonero, J.L.; Morin, G.; Cabon, B. Comparison between beryllium-copper and tungsten high frequency air coplanar probes. IEEE Trans. Microw. Theory Tech. 1995, 43, 2786–2793. [Google Scholar] [CrossRef]
- Ki, H.; Mohanty, P.S.; Mazumder, J. Multiple reflection and its influence on keyhole evolution. J. Laser Appl. 2002, 14, 39–45. [Google Scholar] [CrossRef]
- Ki, H.; Mohanty, P.S.; Mazumder, J. Modeling of laser keyhole welding: Part I. Mathematical modeling, numerical methodology, role of recoil pressure, multiple reflections, and free surface evolution. Metall. Mater. Trans. A 2002, 33, 1817–1830. [Google Scholar] [CrossRef]
- Ki, H.; Mohanty, P.S.; Mazumder, J. Modeling of laser keyhole welding: Part II. Simulation of keyhole evolution, velocity, temperature profile, and experimental verification. Metall. Mater. Trans. A 2002, 33, 1831–1842. [Google Scholar] [CrossRef]
- Lee, D.; Mazumder, J. Effects of laser beam spatial distribution on laser-material interaction. J. Laser Appl. 2016, 28, 032003. [Google Scholar] [CrossRef]
- Weber, R.; Graf, T.; Berger, P.; Onuseit, V.; Wiedenmann, M.; Freitag, C.; Feuer, A. Heat accumulation during pulsed laser materials processing. Opt. Express 2014, 22, 11312–11324. [Google Scholar] [CrossRef] [PubMed]
Figure 1.
Experimental set-up.

Figure 2.
The scanning electron microscope (SEM) image describing measurement of the heat affect zone (HAZ) and material removal zone (MRZ).
Figure 2.
The scanning electron microscope (SEM) image describing measurement of the heat affect zone (HAZ) and material removal zone (MRZ).

Figure 3.
Roundness measurement.
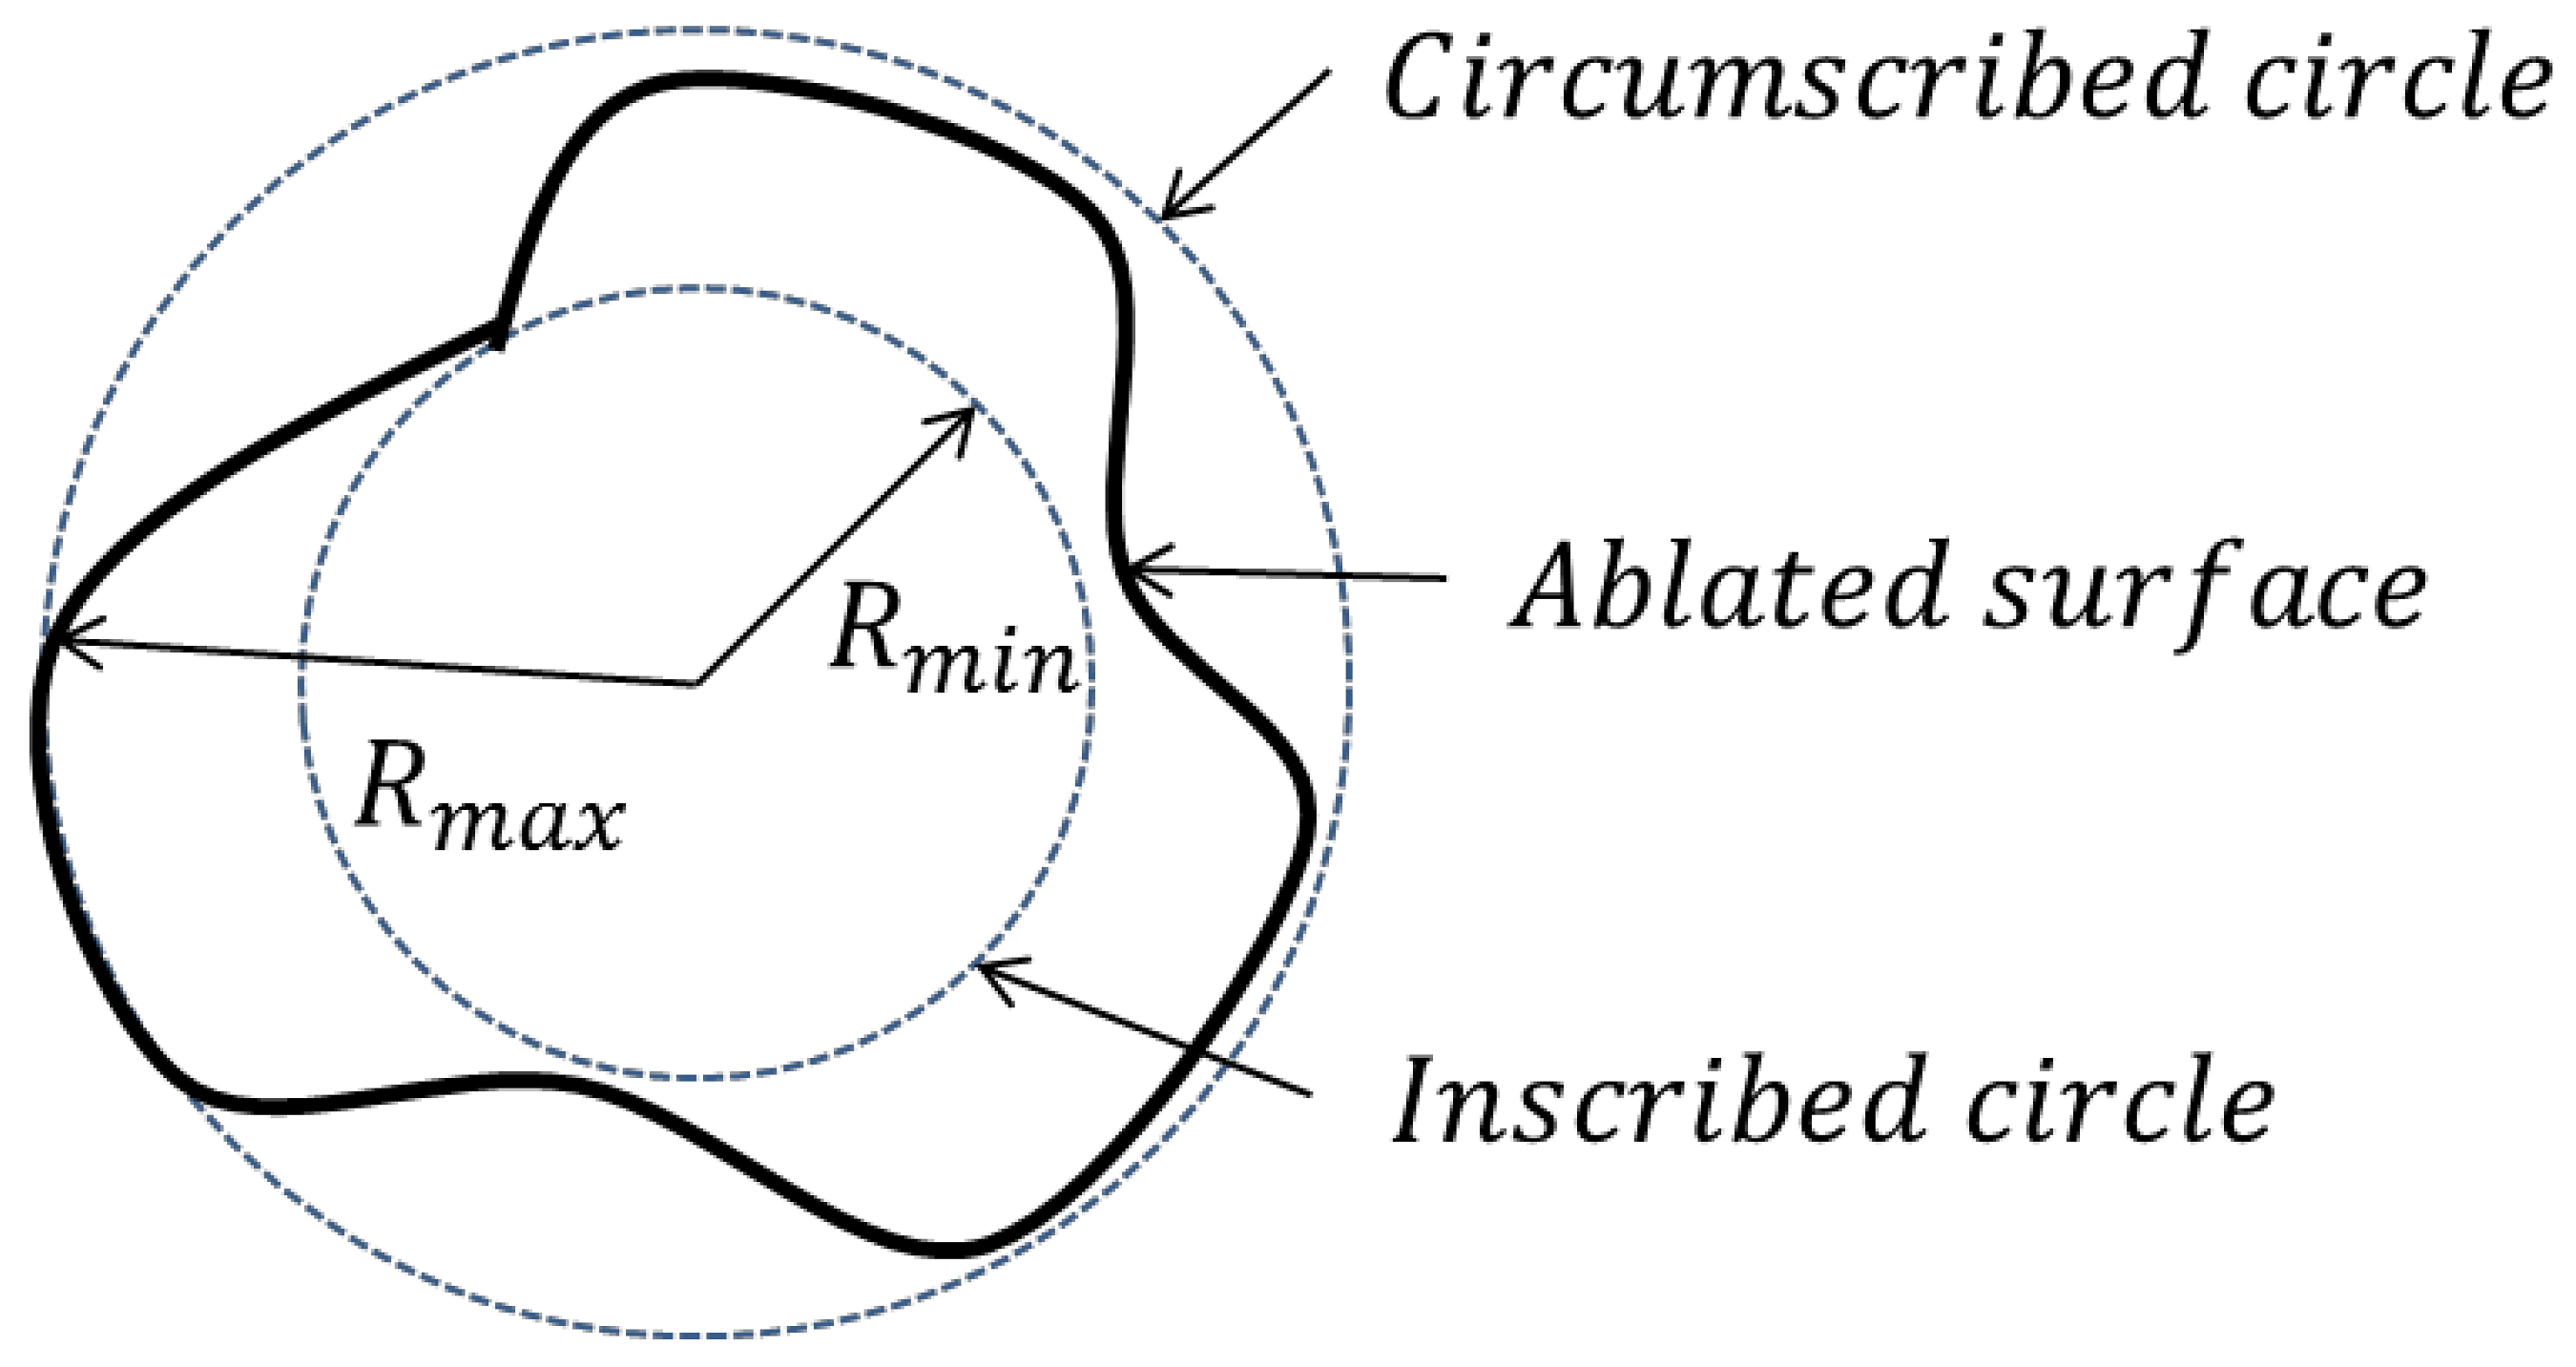
Figure 4.
Heat affect zone (HAZ) with the pulse duration from 4 ns to 200 ns. The HAZ of the long pulses (Δt = 50, 100, 200 ns) increase steadily with little deviation as ETotal increases. On the other hand, the short pulses (Δt = 4, 8, 20 ns) have a large deviation of hole sizes and the sizes rise sharply as ETotal increases.

Figure 5.
Material removal zone (Top) with the pulse duration from 4 ns to 200 ns The HAZ of the long pulses (Δt = 50, 100, 200 ns) increase steadily with little deviation as ETotal increases. On the other hand, the short pulses (Δt = 4, 8, 20 ns) have a large deviation of hole sizes and the sizes rise sharply as ETotal increases.
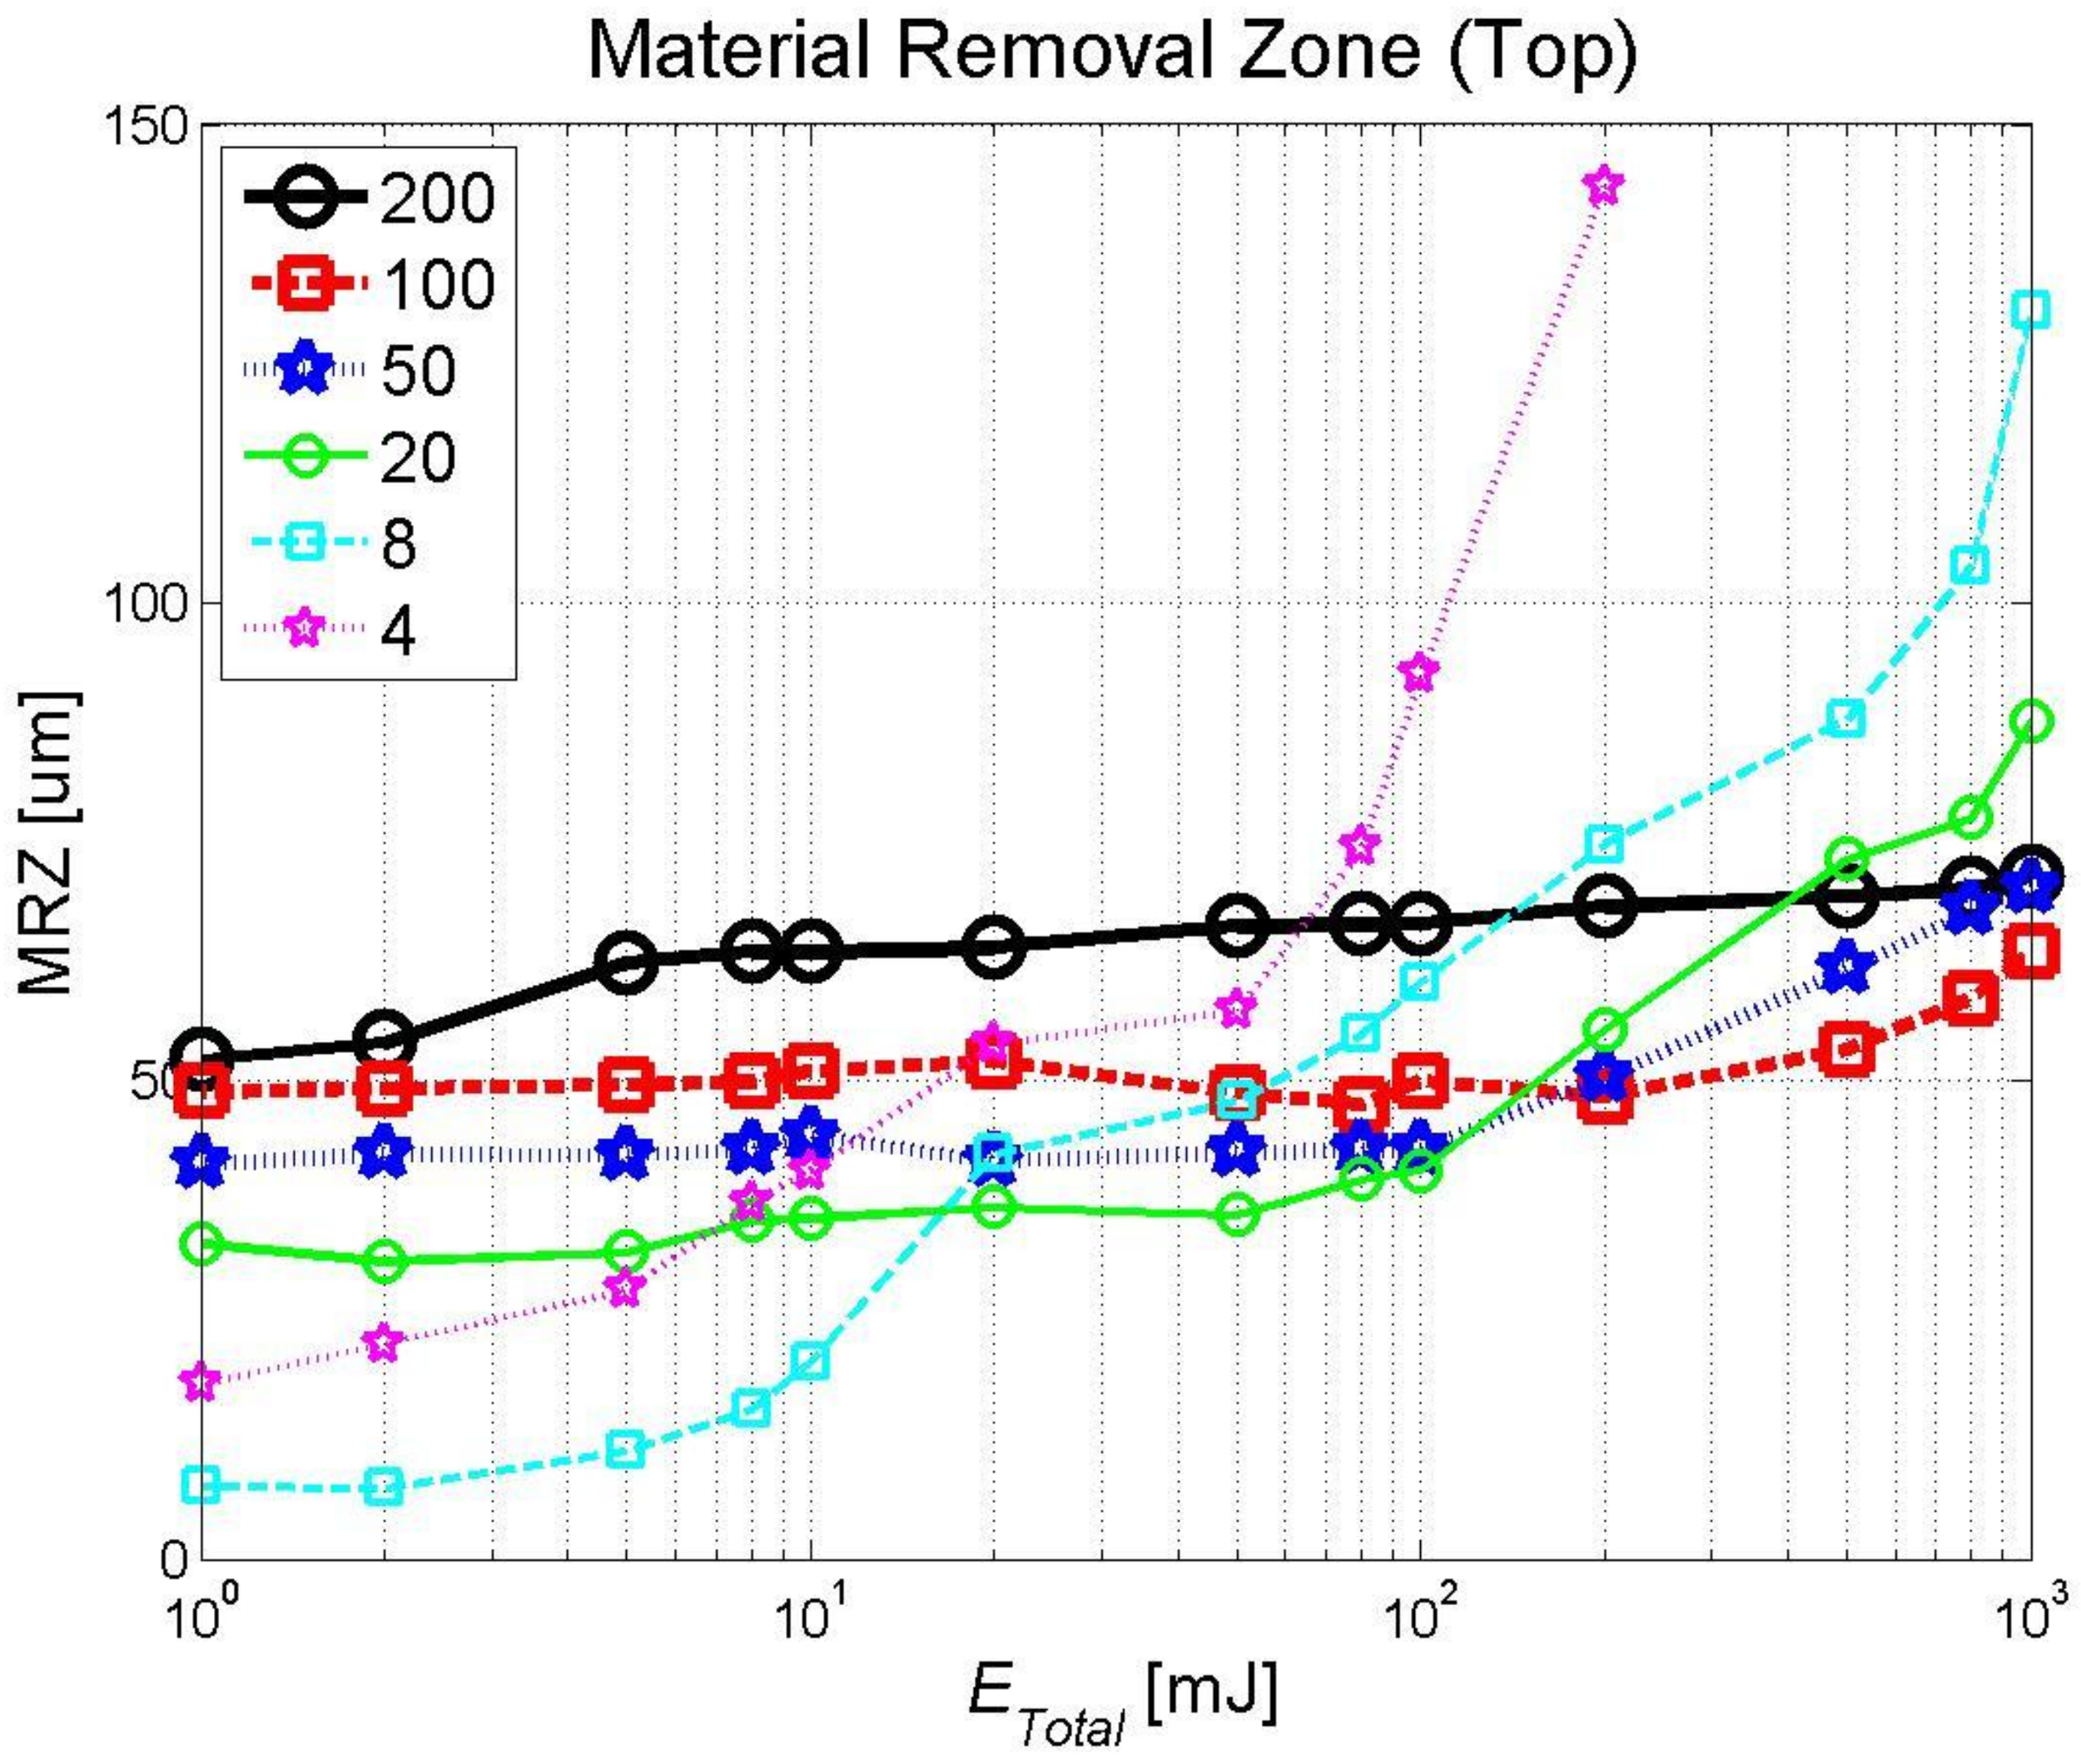
Figure 6.
Material removal zone (Bottom) with the pulse duration from 4 ns to 200 ns.

Figure 7.
Comparison of , , and with the pulse duration from 4 ns to 200 ns. These values tend to increase as the pulse duration decreases. This can be explained by heat accumulation and material removal mechanism with effect of laser repetition rate and pulse energy.
Figure 7.
Comparison of , , and with the pulse duration from 4 ns to 200 ns. These values tend to increase as the pulse duration decreases. This can be explained by heat accumulation and material removal mechanism with effect of laser repetition rate and pulse energy.
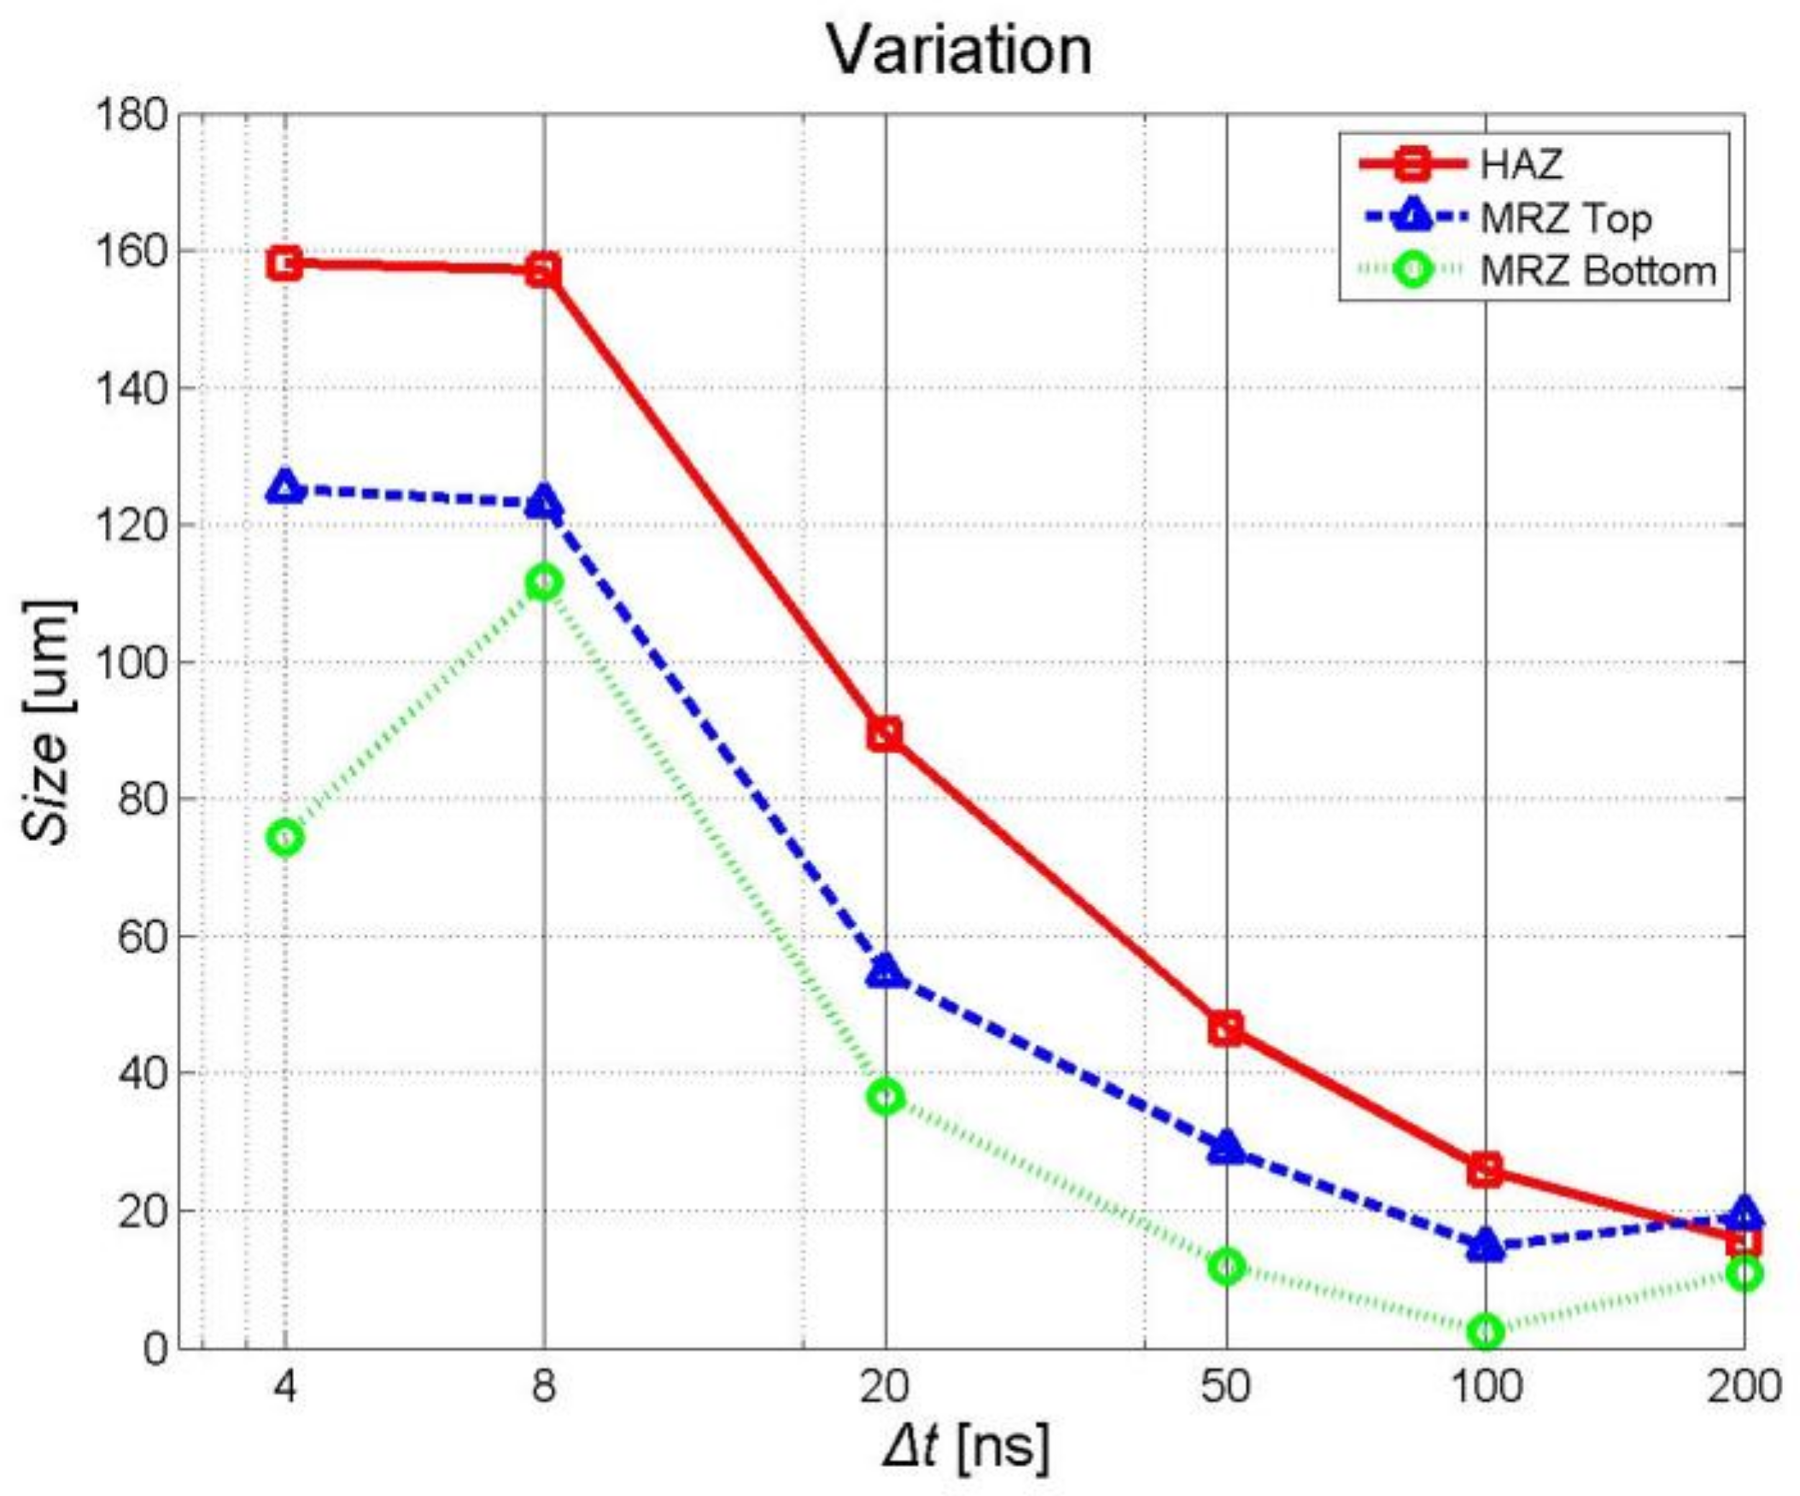
Figure 8.
Roundness with the pulse duration from 4 ns to 200 ns. The roundness decreases as the ETotal increases. This is because, with low ETotal, the surface will be relatively flat and radiate transmitted heat symmetrically. However, with high ETotal, the molten portion of the material will become larger and the molten surface will be relatively rugged, resulting in an asymmetric heat transfer.

Figure 9.
SEM images of laser ablation with Δt = 200 ns.

Figure 10.
SEM images of laser ablation with Δt = 100 ns.
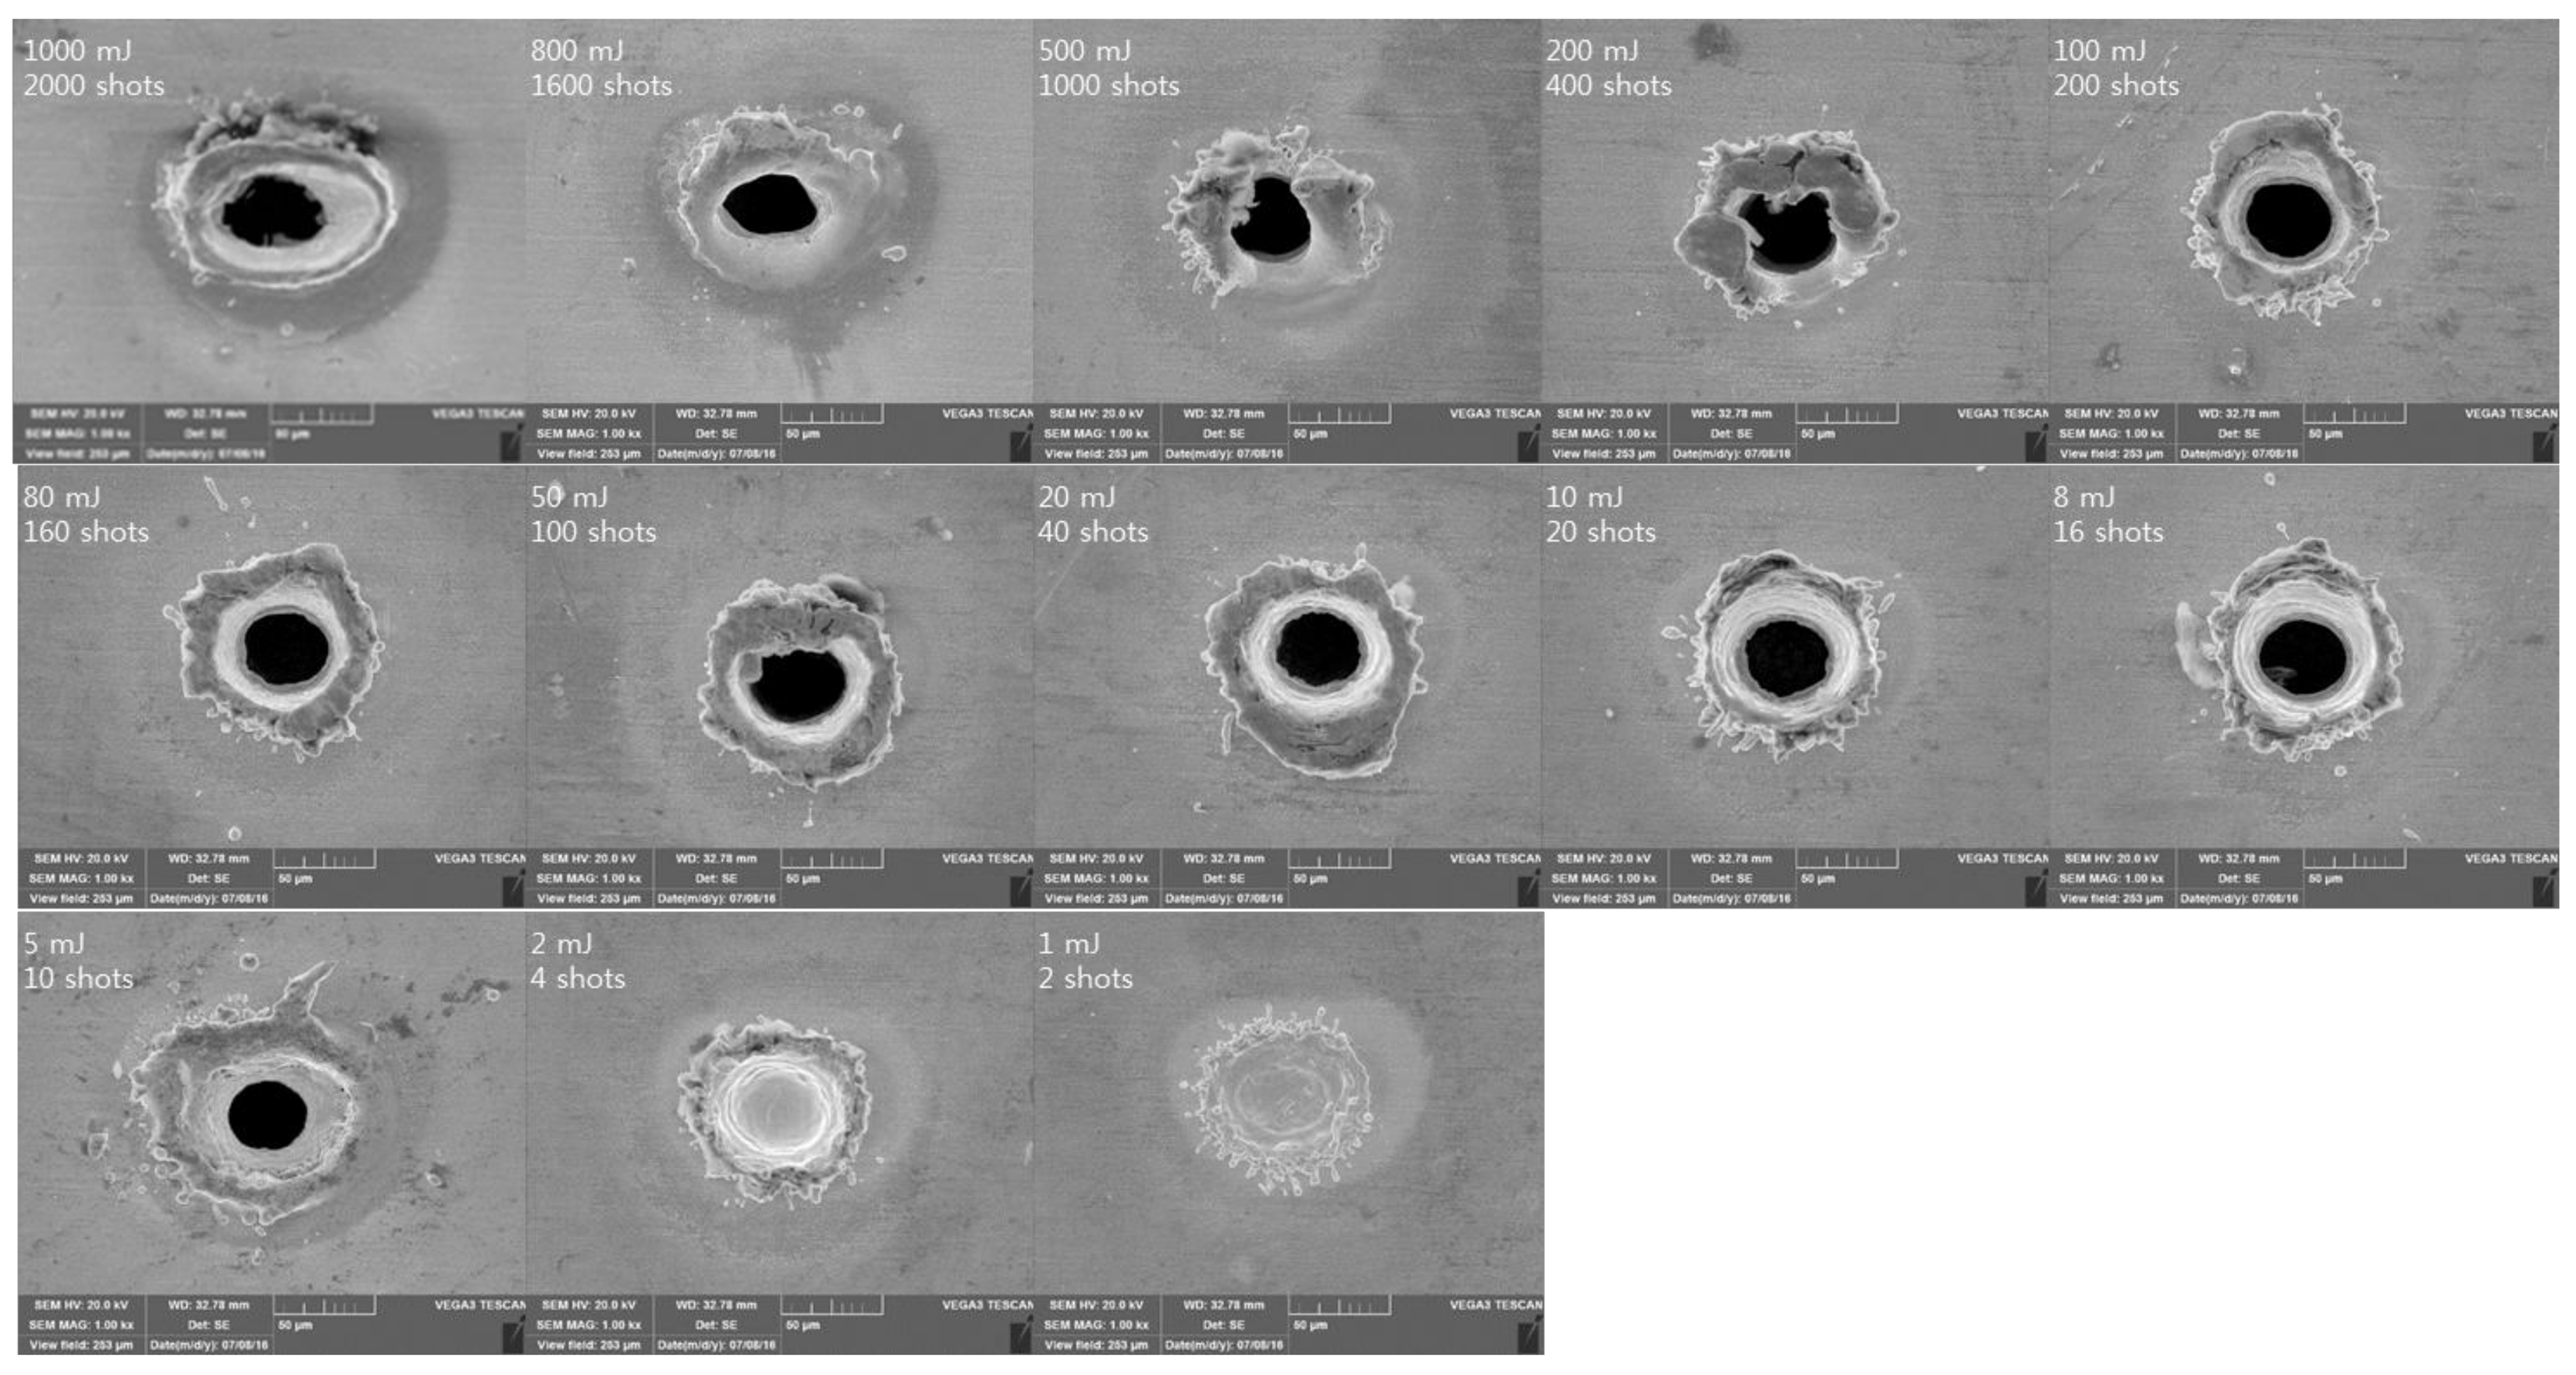
Figure 11.
SEM images of laser ablation with Δt = 50 ns.

Figure 12.
SEM images of laser ablation with Δt = 20 ns.
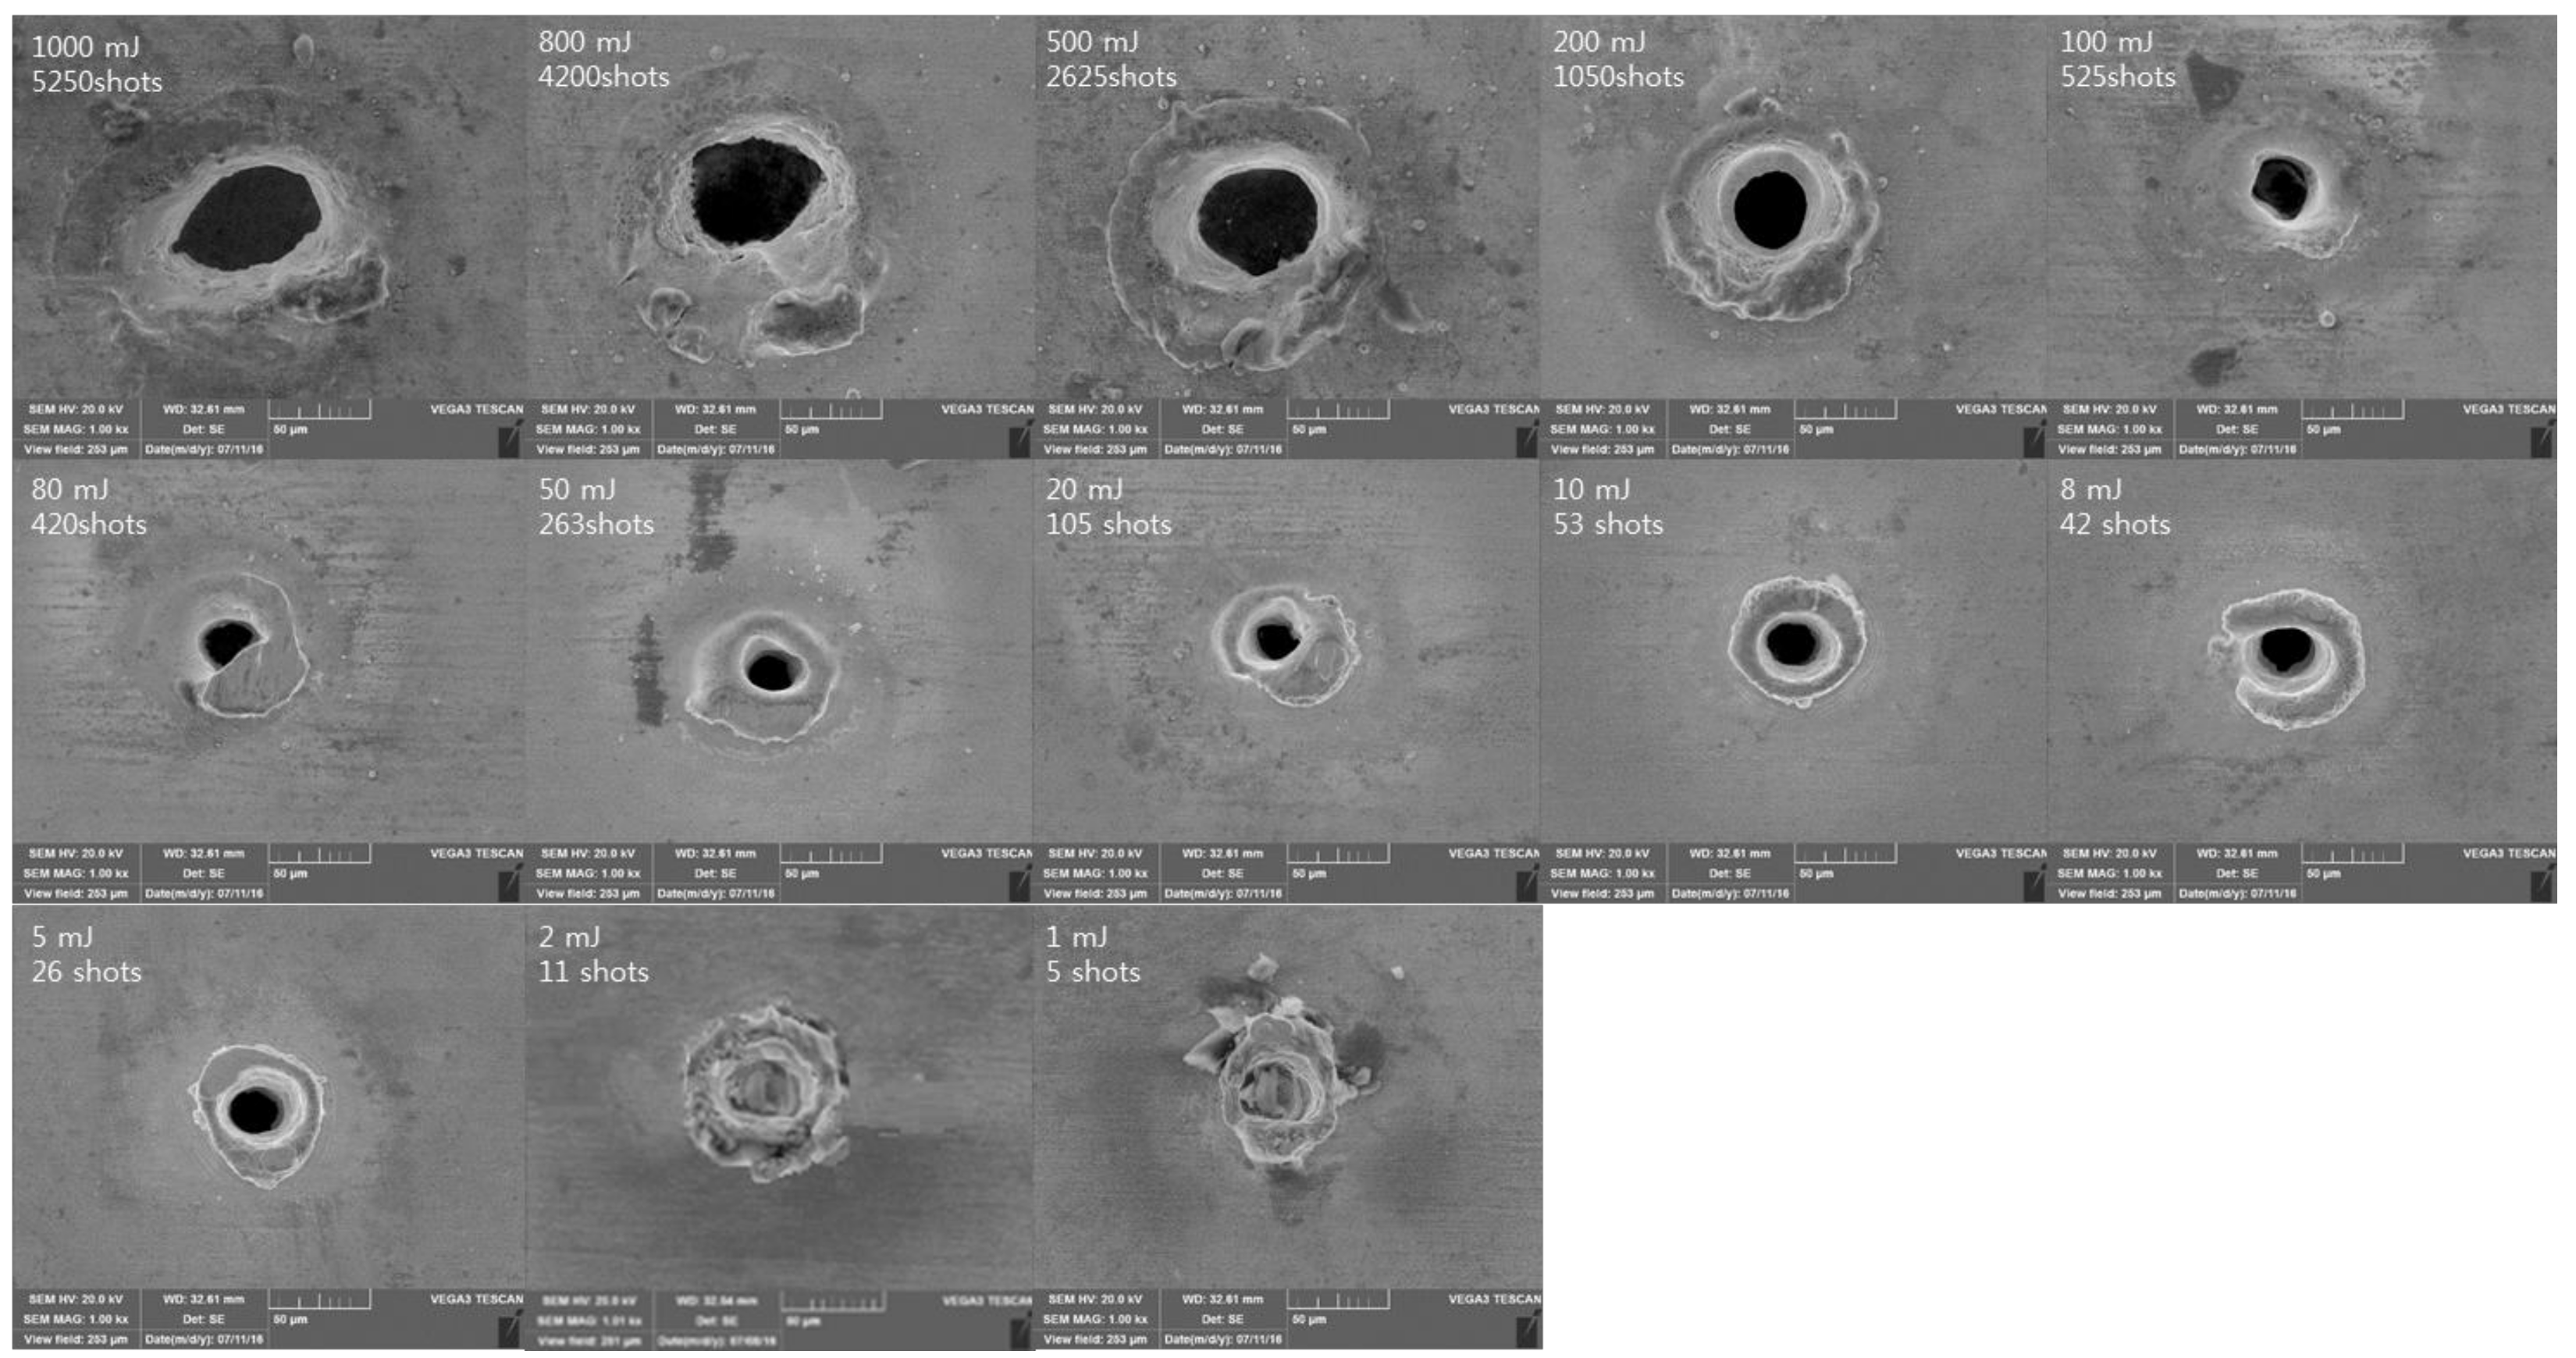
Figure 13.
SEM images of laser ablation with Δt = 8 ns.


Table 1.
Laser parameters.
| Pulse Duration (ns) | Repetition Rate (kHz) | Pulse Energy (uJ) | Total E (mJ) | ||||||||||||
|---|---|---|---|---|---|---|---|---|---|---|---|---|---|---|---|
| 1000 | 800 | 500 | 200 | 100 | 80 | 50 | 20 | 10 | 8 | 5 | 2 | 1 | |||
| Number of Pulse (#) | |||||||||||||||
| 200 | 20 | 1000 | 1000 | 800 | 500 | 200 | 100 | 80 | 50 | 20 | 10 | 8 | 5 | 2 | 1 |
| 100 | 40 | 500 | 2000 | 1600 | 1000 | 400 | 200 | 160 | 100 | 40 | 20 | 16 | 10 | 4 | 2 |
| 50 | 60 | 333.3 | 3000 | 2400 | 1500 | 600 | 300 | 240 | 150 | 60 | 30 | 24 | 15 | 6 | 3 |
| 20 | 105 | 190.5 | 5250 | 4200 | 2625 | 1050 | 525 | 420 | 263 | 105 | 53 | 42 | 26 | 11 | 5 |
| 8 | 200 | 100 | 10,000 | 8000 | 5000 | 2000 | 1000 | 800 | 500 | 200 | 100 | 80 | 50 | 20 | 10 |
| 4 | 500 | 40 | 25,000 | 20,000 | 12,500 | 5000 | 2500 | 2000 | 1250 | 500 | 250 | 200 | 125 | 50 | 25 |
Table 2.
, , and .
| Pulse Duration (ns) | ΔHAZ (μm) | Δ(MRZ)Top (μm) | Δ(MRZ)Bottom (μm) |
|---|---|---|---|
| 200 | 15.656 | 19.221 | 10.958 |
| 100 | 25.932 | 14.687 | 2.362 |
| 50 | 46.583 | 28.84 | 12.008 |
| 20 | 89.307 | 54.58 | 36.682 |
| 8 | 157.133 | 123.019 | 111.748 |
| 4 | 158.073 | 125.15 | 74.305 |
Table 3.
Roundness.
| Pulse Duration (ns) | Total E (mJ) | ||||||||||||
|---|---|---|---|---|---|---|---|---|---|---|---|---|---|
| 1000 | 800 | 500 | 200 | 100 | 80 | 50 | 20 | 10 | 8 | 5 | 2 | 1 | |
| Roundness (%) | |||||||||||||
| 200 | 61.43 | 62.07 | 68.9 | 69.85 | 67.21 | 66.13 | 69.3 | 68.33 | 66.67 | - | - | - | - |
| 100 | 47.89 | 48.21 | 60 | 70.4 | 71.15 | 68.75 | 73.91 | 70 | 67 | 68.27 | 69.57 | - | - |
| 50 | 50.66 | 51.56 | 58.65 | 66.36 | 71.43 | 74.7 | 72.63 | 77.32 | 72.94 | 71.6 | 71.23 | - | - |
| 20 | 48.89 | 54.76 | 62.16 | 78.89 | 72.97 | 71.19 | 68.63 | 67.35 | 68.42 | 67.24 | 67.65 | - | - |
| 8 | 57.96 | 54.39 | 54.43 | 61.11 | 71.15 | 78.85 | 76.32 | 75.68 | 75.4 | 74.07 | 73.91 | - | - |
| 4 | No Exp | No Exp | No Exp | 55 | 64.44 | 69.05 | - | - | - | - | - | - | - |
© 2018 by the author. Licensee MDPI, Basel, Switzerland. This article is an open access article distributed under the terms and conditions of the Creative Commons Attribution (CC BY) license (http://creativecommons.org/licenses/by/4.0/).
Share and Cite
MDPI and ACS Style
Lee, D. Experimental Investigation of Laser Ablation Characteristics on Nickel-Coated Beryllium Copper. Metals 2018, 8, 211. https://doi.org/10.3390/met8040211
AMA Style
Lee D. Experimental Investigation of Laser Ablation Characteristics on Nickel-Coated Beryllium Copper. Metals. 2018; 8(4):211. https://doi.org/10.3390/met8040211
Chicago/Turabian StyleLee, Dongkyoung. 2018. "Experimental Investigation of Laser Ablation Characteristics on Nickel-Coated Beryllium Copper" Metals 8, no. 4: 211. https://doi.org/10.3390/met8040211
Note that from the first issue of 2016, this journal uses article numbers instead of page numbers. See further details here.