Article

Enhanced Compressive Property of Al Composite Foams at Elevated Temperatures via Plasma Electrolytic Oxidation

1
Roll Forging Research Institute, Jilin University, Changchun 130022, China
2
Key Laboratory of Automobile Materials (Ministry of Education), College of Materials Science and Engineering, Jilin University, Changchun 130022, China
3
Faculty of Engineering, University of Nottingham, Nottingham NG7 2RD, UK
4
Key Laboratory of Bionic Engineering (Ministry of Education), Jilin University, Changchun 130022, China
*
Author to whom correspondence should be addressed.
Metals 2018, 8(2), 118; https://doi.org/10.3390/met8020118
Submission received: 10 January 2018 / Revised: 28 January 2018 / Accepted: 1 February 2018 / Published: 8 February 2018

Abstract

:
The present work investigates the compressive property of Al matrix composite foams at different temperatures between room temperature and 200 °C. Elevated temperature results in a decreased compressive strength and energy absorption capacity of as-received Al foams. Therefore, to maintain the compressive property, the Al2O3 ceramic coating was deposited on the Al struts of the foams by the plasma electrolytic oxidation (PEO) process to form Al2O3/Al composite foams. As a consequence, the composite foams exhibit a higher compressive strength and energy absorption capacity as compared with the as-received Al foams at both room temperature and elevated temperatures because of the reinforced effect of the Al2O3 ceramic on the foam strut. The related mechanisms were explained by fractography, microstructure observation and phase composition analysis using scanning electron microscopy (SEM), energy-dispersive X-ray spectroscopy (EDS) and X-ray diffraction (XRD).

1. Introduction

Open-cell Al foams are viewed as an attractive material due to their positive mechanical properties and functional performances, such as low density, high specific strength, excellent energy absorption, sound absorption and damping capacities [1,2]. Thus, Al foams have potential for application in the aerospace, petrochemical and transportation industries [3,4,5].
The compressive property is an important performance to evaluate the energy absorption capacity of Al foams under different conditions. Previous investigations have revealed that the compressive strength at high temperature is reduced due to the softening effect on the metal matrix [6,7,8]. Besides, the high temperature can cause a change in the compressive deformation behavior. It was reported that under elevated temperature conditions, the deformation of the foams mainly results from the plastic bending of the cell wall, but under room temperature conditions, the deformation of the foams is controlled by buckling and tearing [7].
Different methods have been developed to further improve the mechanical performance of the Al foams. Hollow sphere, coating, ceramic particles as well as short fibers were used to increase the mechanical and chemical properties of the Al foams [9,10,11,12,13,14,15,16,17]. Among these methods, the deposition of a coating on the surface of the Al foams is an effective way to improve the performance of the Al foams [12,13,14,15,16,17]. Recently, the plasma electrolytic oxidation (PEO), also named micro arc oxidation (MAO), was applied on open-cell Al foams [12,13,14,15]. The ceramic coating can be prepared on the outer and inner surface of the Al foams and form a new type of ceramic/Al composite foams. Dunleavy reveals that the microstructure of ceramic coatings on Al foams is similar to that of corresponding bulk Al alloys [12]. The compressive and tensile strength of open-cell Al foams is enhanced by ceramic coatings [13]. Furthermore, our previous study demonstrates that the PEO coating provides the Al foams with a high corrosion resistance because the ceramic coatings can protect the Al strut from corrosion attack under salty environment conditions [15]. However, these investigations mentioned above were mainly employed at room temperature, and few studies focus on the compressive properties of PEO ceramic/Al composite foams at elevated temperatures. Therefore, in this study, the compressive properties of the composite foams at different temperatures were investigated. Also, the fractographies at different temperatures were observed to explore the deformation mechanisms.

2. Materials and Methods

2.1. Preparation

The pure aluminum foam was fabricated by the infiltration process. The details of the preparation process are given in our previous study [18]. The cross-section images of Al foam were analyzed to obtain information on the pore size [19,20]. The average pore size of the foam specimen used in this study is at the level of 2–3 mm.
Specimens cut from the foams were firstly chemically cleaned, and then they were coated with a voltage of 450 V. The electrolyte includes the main aqueous solution of 4 g/L NaOH (BJ Chem. Works, Beijing, China), 4 g/L EDTA-2Na (BJ Chem. Works, Beijing, China) and 9 g/L Na2SiO3 (BJ Chem. Works, Beijing, China). The details of the preparation process are given in our previous study [15]. During the PEO process, the temperature of the electrolyte was constantly maintained at approximately 30 °C using a stirring and cooling system.

2.2. Material Characterization

The porosities of the Al foams were calculated using the following equation:
P = (1 − ρ*/ρs) × 100%
where P is the porosity of the foams, ρ* and ρs are the densities of the foams and the Al matrix, respectively.
The microstructure and element composition of the foams and the PEO coating were observed by scanning electron microscopy (SEM: Model VEGA3 TESCAN, Brno, Czech Republic; Model EVO18 ZEISS, Oberkochen, Germany) with an energy-dispersive spectrum analyzer (EDS Model Link-Isis, Oxford Instruments, Abingdon-on-Thames, UK).
The phase composition of the foams and the coating was analyzed by X-ray diffraction (XRD, D/Max2500PC, Rigaku Corp., Osaka, Japan). The radiation source was Cu Kα. The scanning angular scope ranged from 20° to 80°.
The coating thickness was measured by SEM images from polished cross-sections of foam specimens. In order to achieve result repeatability, the averaged value was calculated from more than 15 different measurements throughout foam samples.

2.3. Compression Test

Foam specimens were prepared for a compressive test at a nominal strain rate of ~10−3/s. For the high temperature test, an Instron series mechanical machine (Instron Corp., Shanghai, China) equipped with a high temperature furnace was used. The testing temperatures were room temperature, 100 °C and 200 °C. Before starting the compressive test, the foam specimen was held in the high temperature furnace for 15 min to achieve temperature stability. More than three measured values were averaged as experimental data to reduce the data error. The obtained data were used for drawing the compressive stress–strain curves.
In this study, the compressive strength and energy absorption capacity were used to describe the compressive properties of the foams. The compressive strength is defined as the initial peak stress when the curve shows a stress yield beyond the linear-elastic region or the plateau stress at the strain of 0.05 when the stress–strain curve is smoothing without obvious stress yield. The absorbed energies at the strain of 0.5 and 0.6 are used to compare the energy absorption capacities between the as-received Al foams and ceramic/Al composite foams.
The energy absorption capacity of the foams can be calculated from the area under the stress–strain curve to a certain strain [1,2,20]:
W = 0 ε σ d ε
where W is the energy absorption capacity, ε is the compressive strain; and σ is the compressive stress.
In order to clarify the deformation mechanisms of the composite foams under different temperatures, the fractography observations were made by using SEM after the specimens had undergone the strain of about 0.3.

3. Results and Discussion

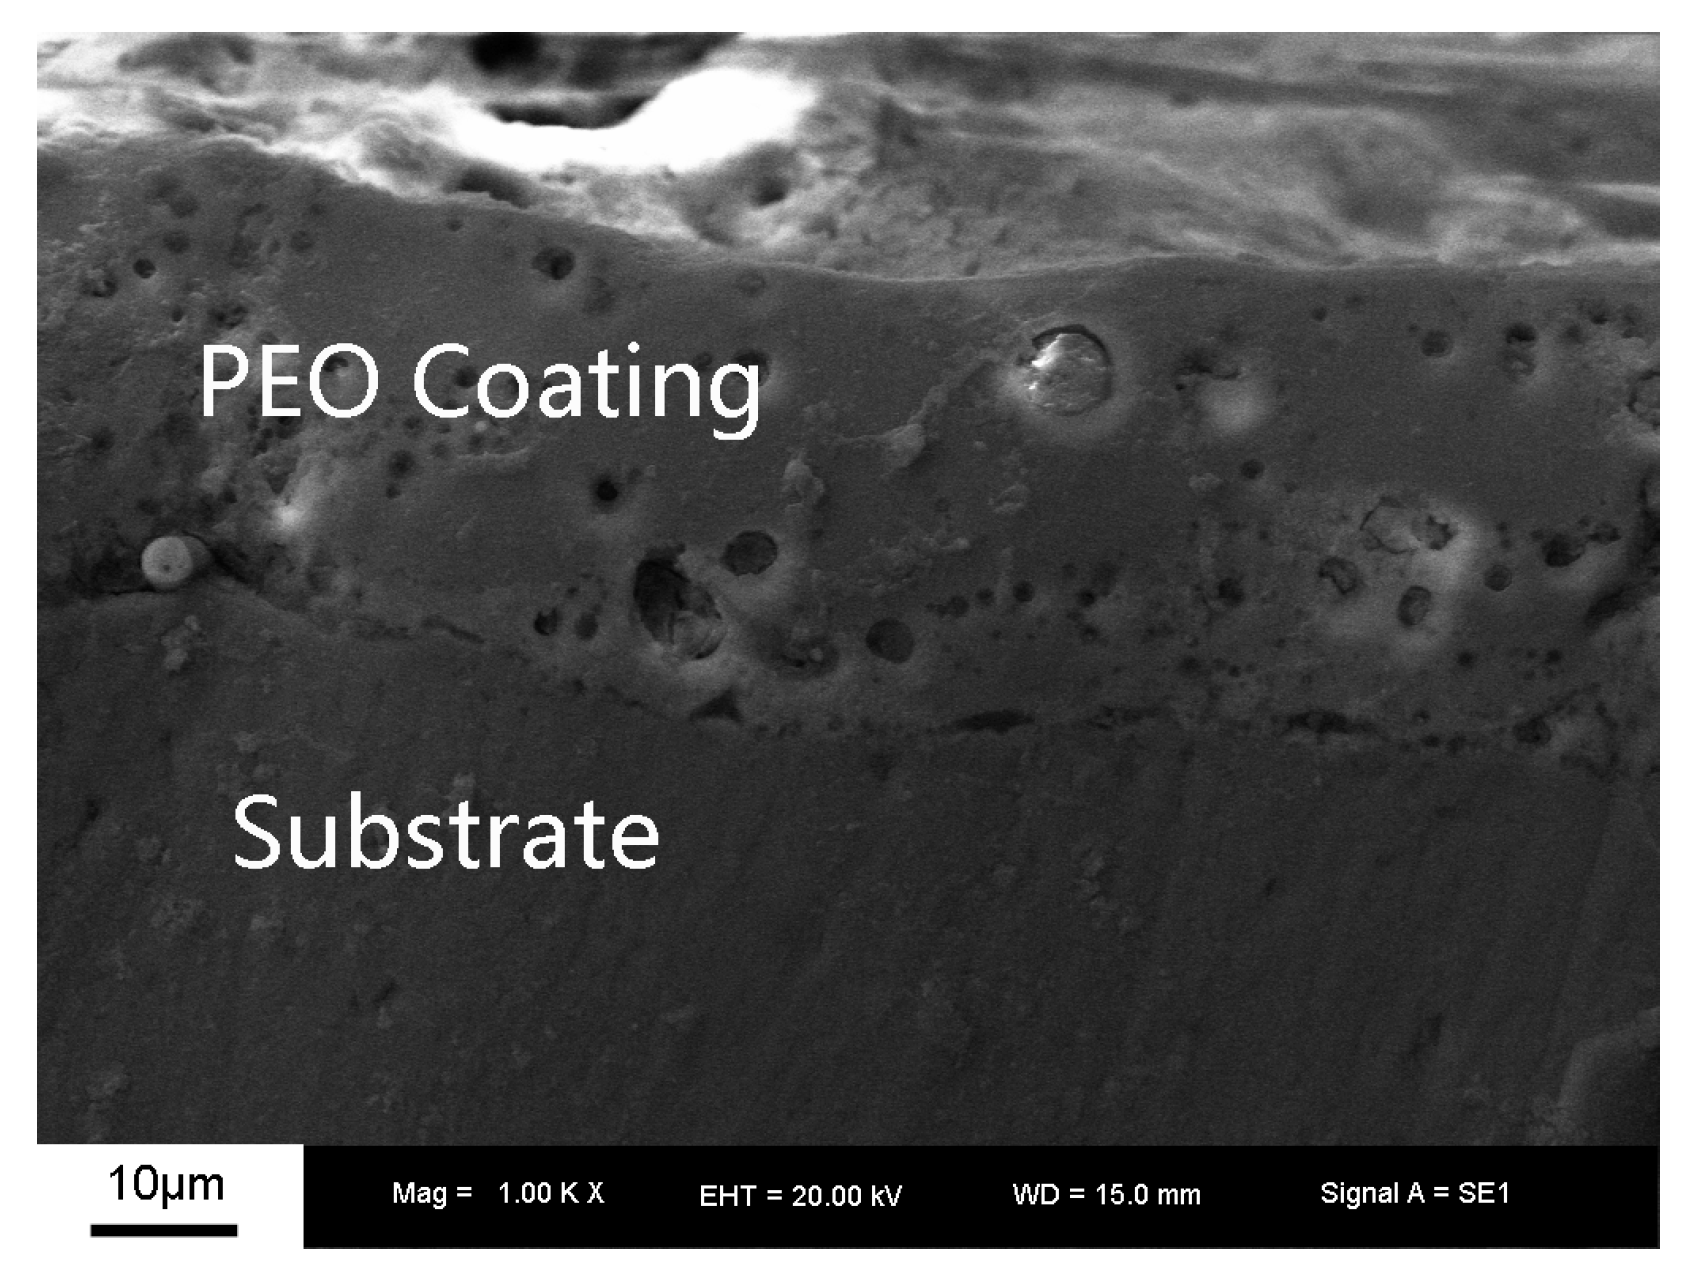
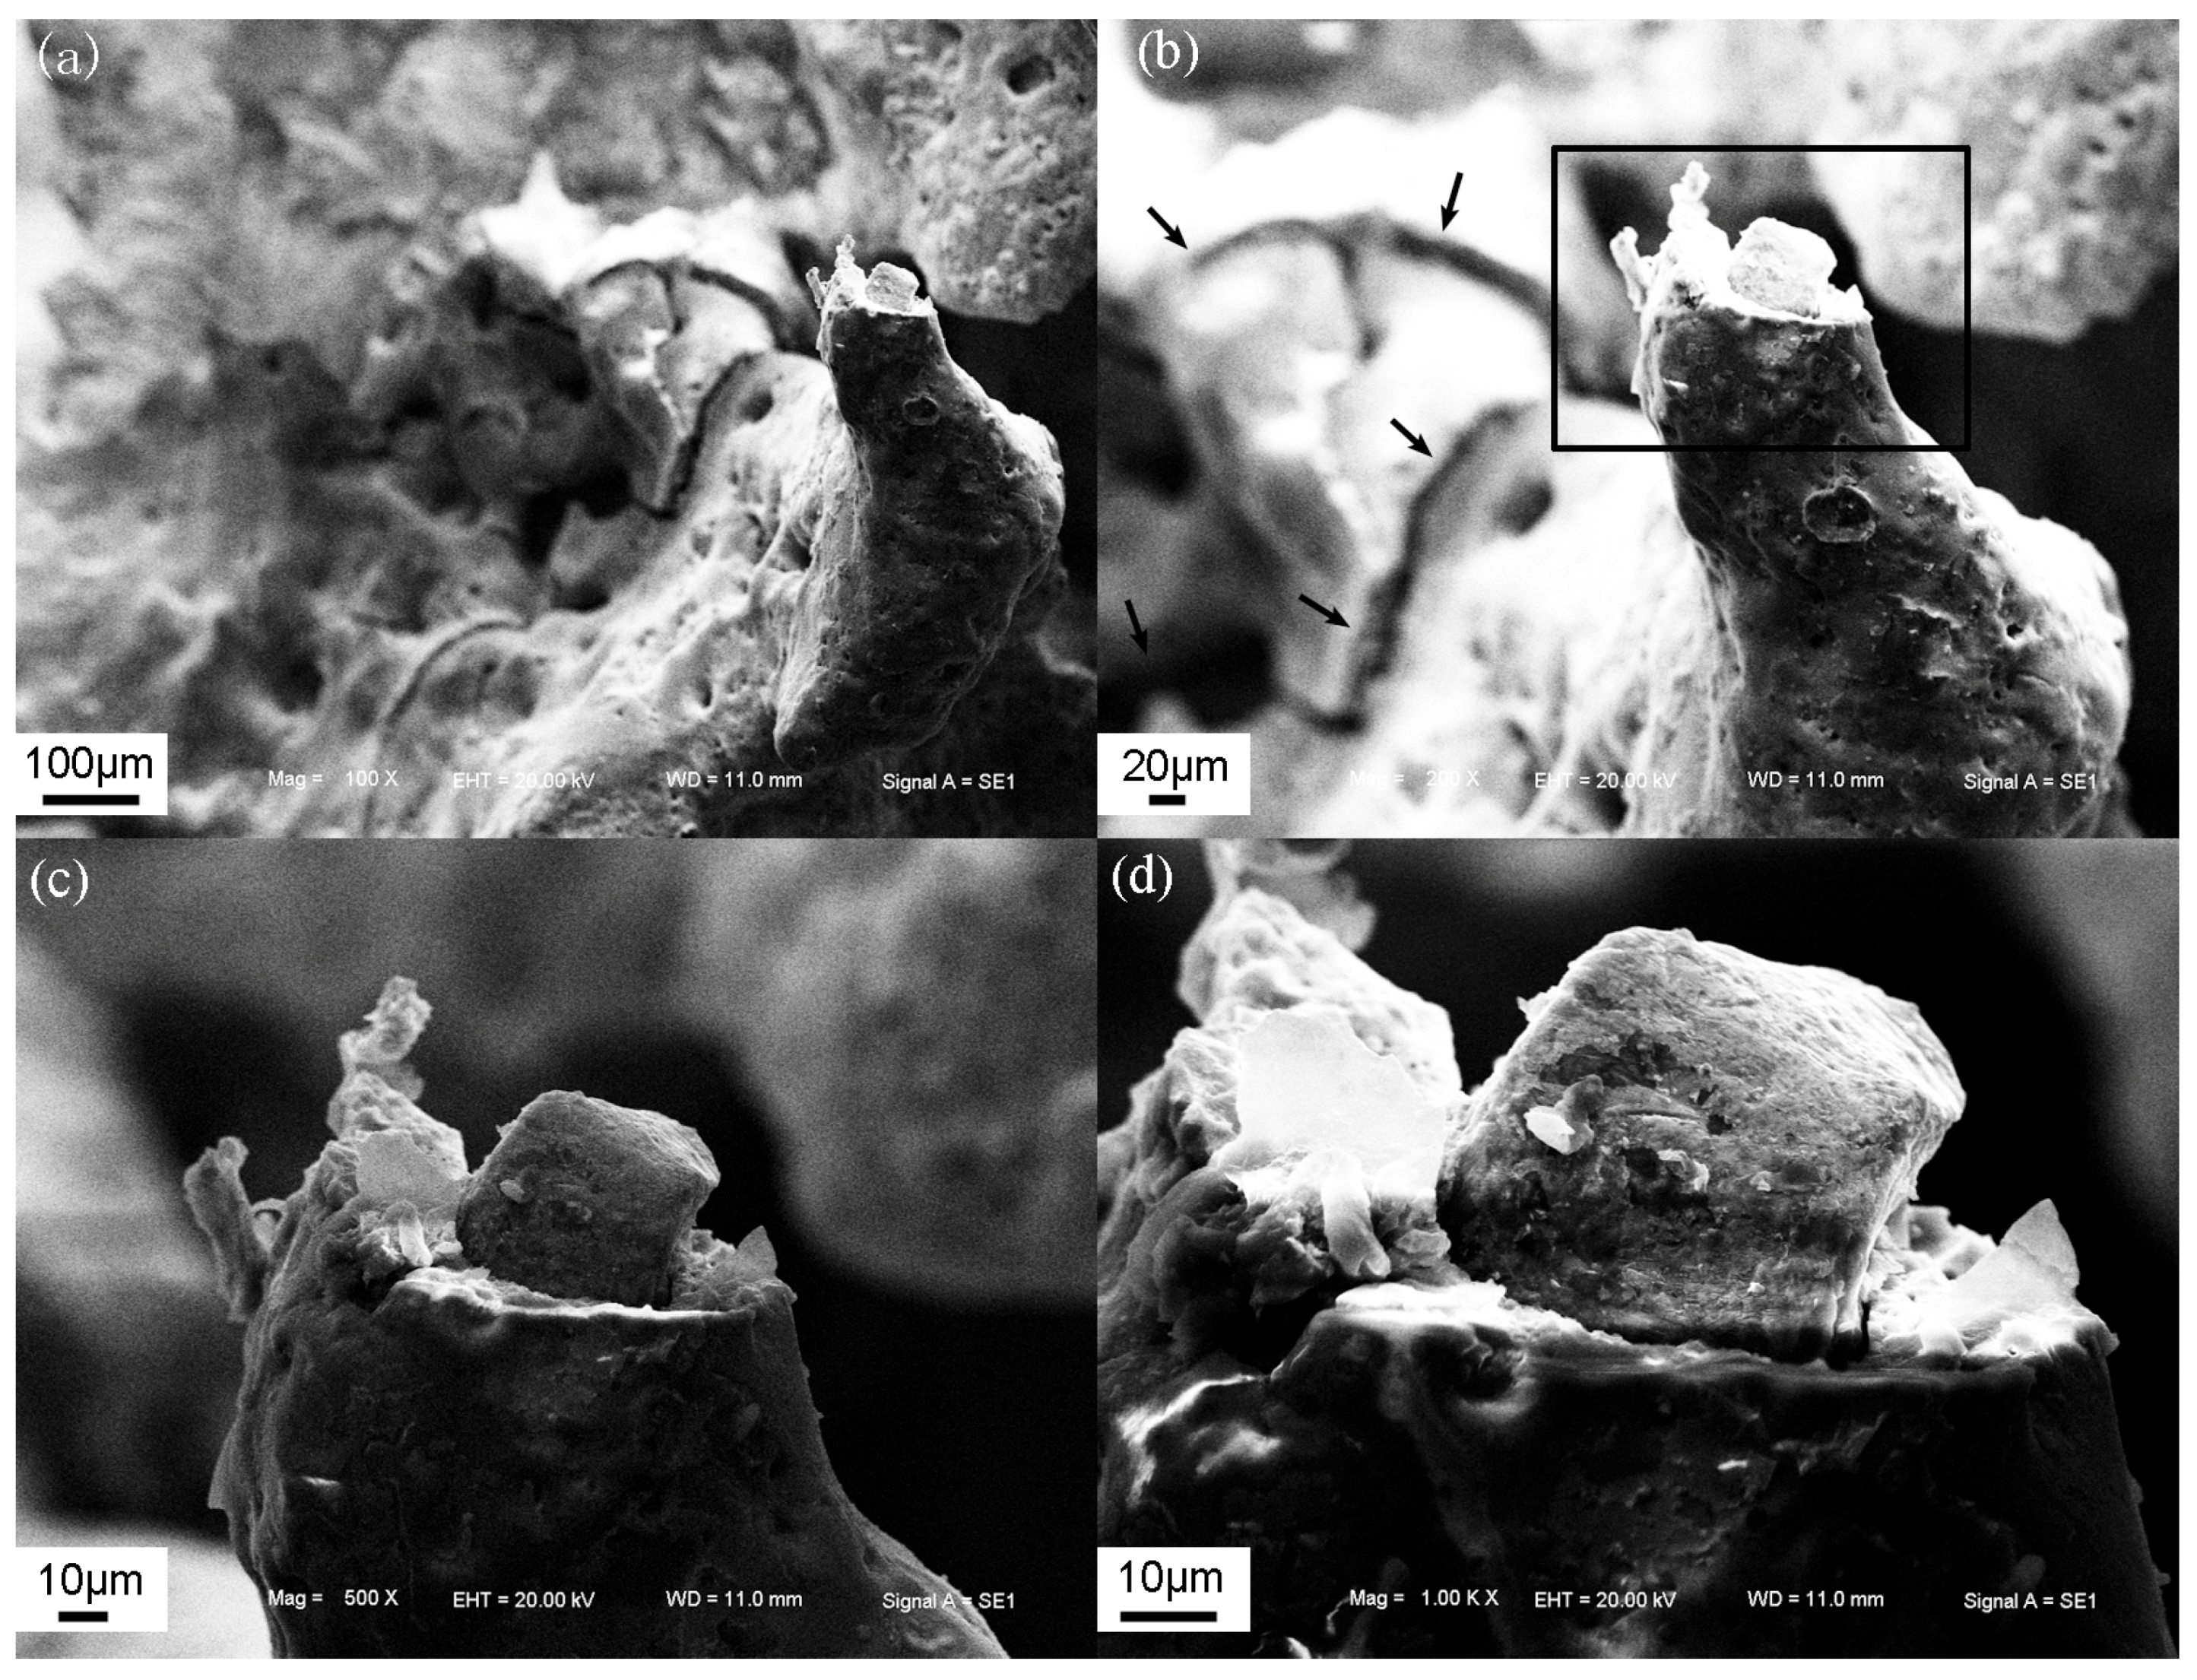
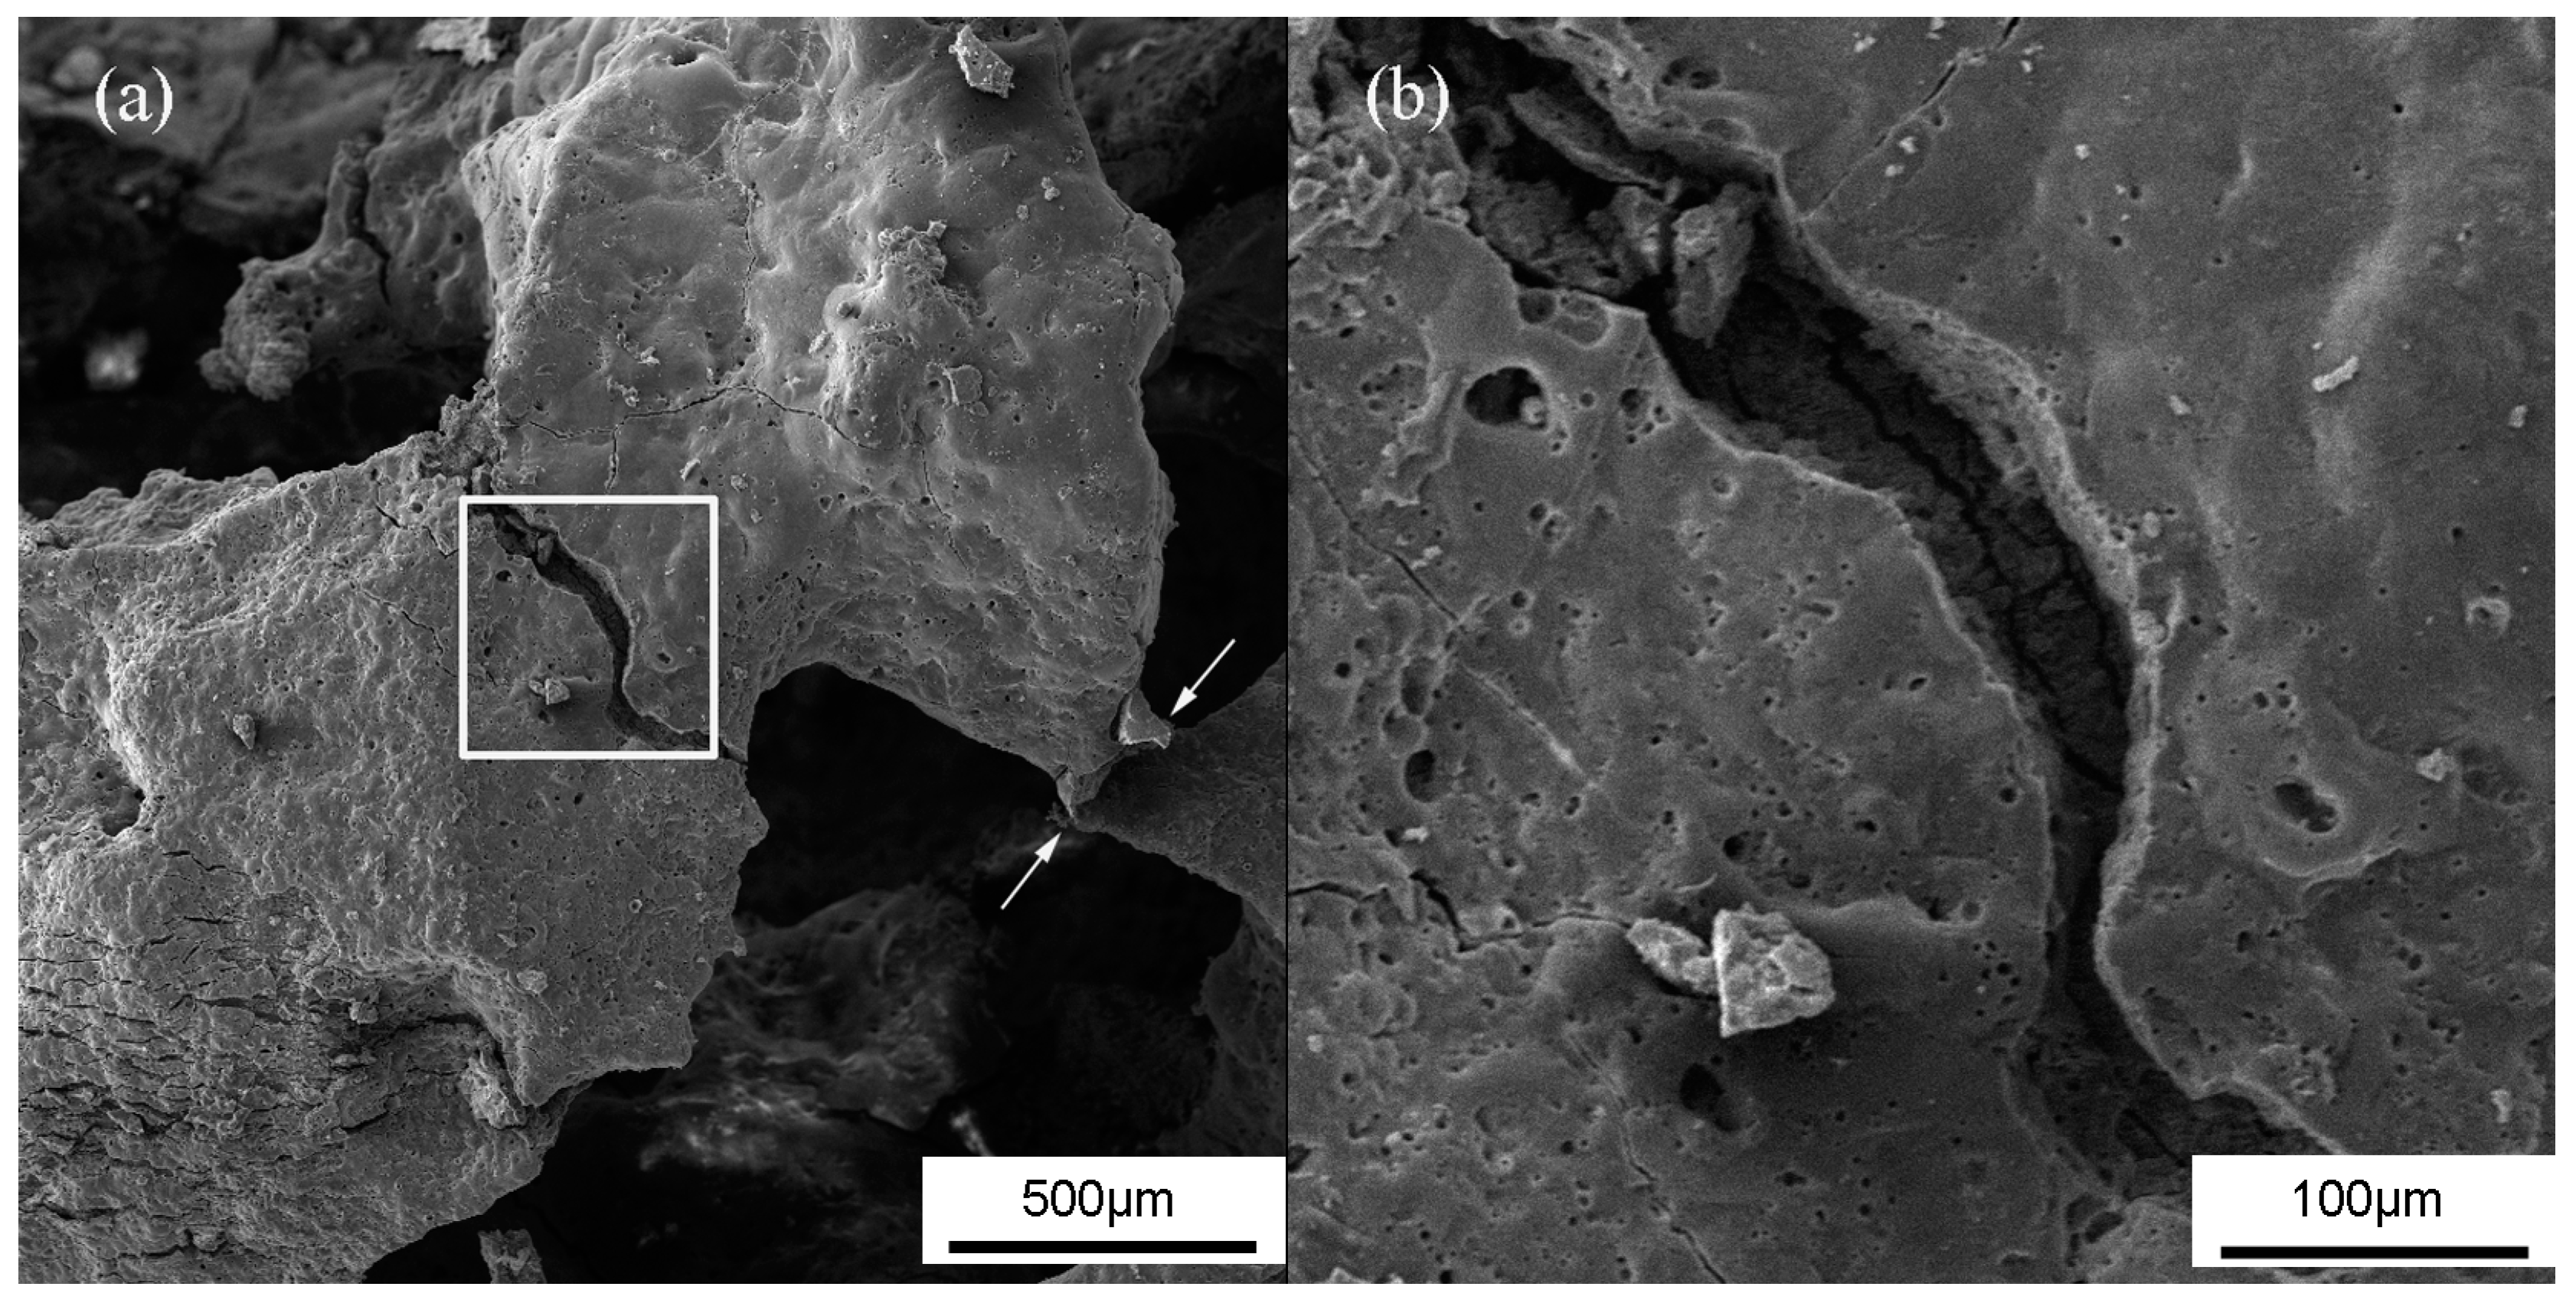
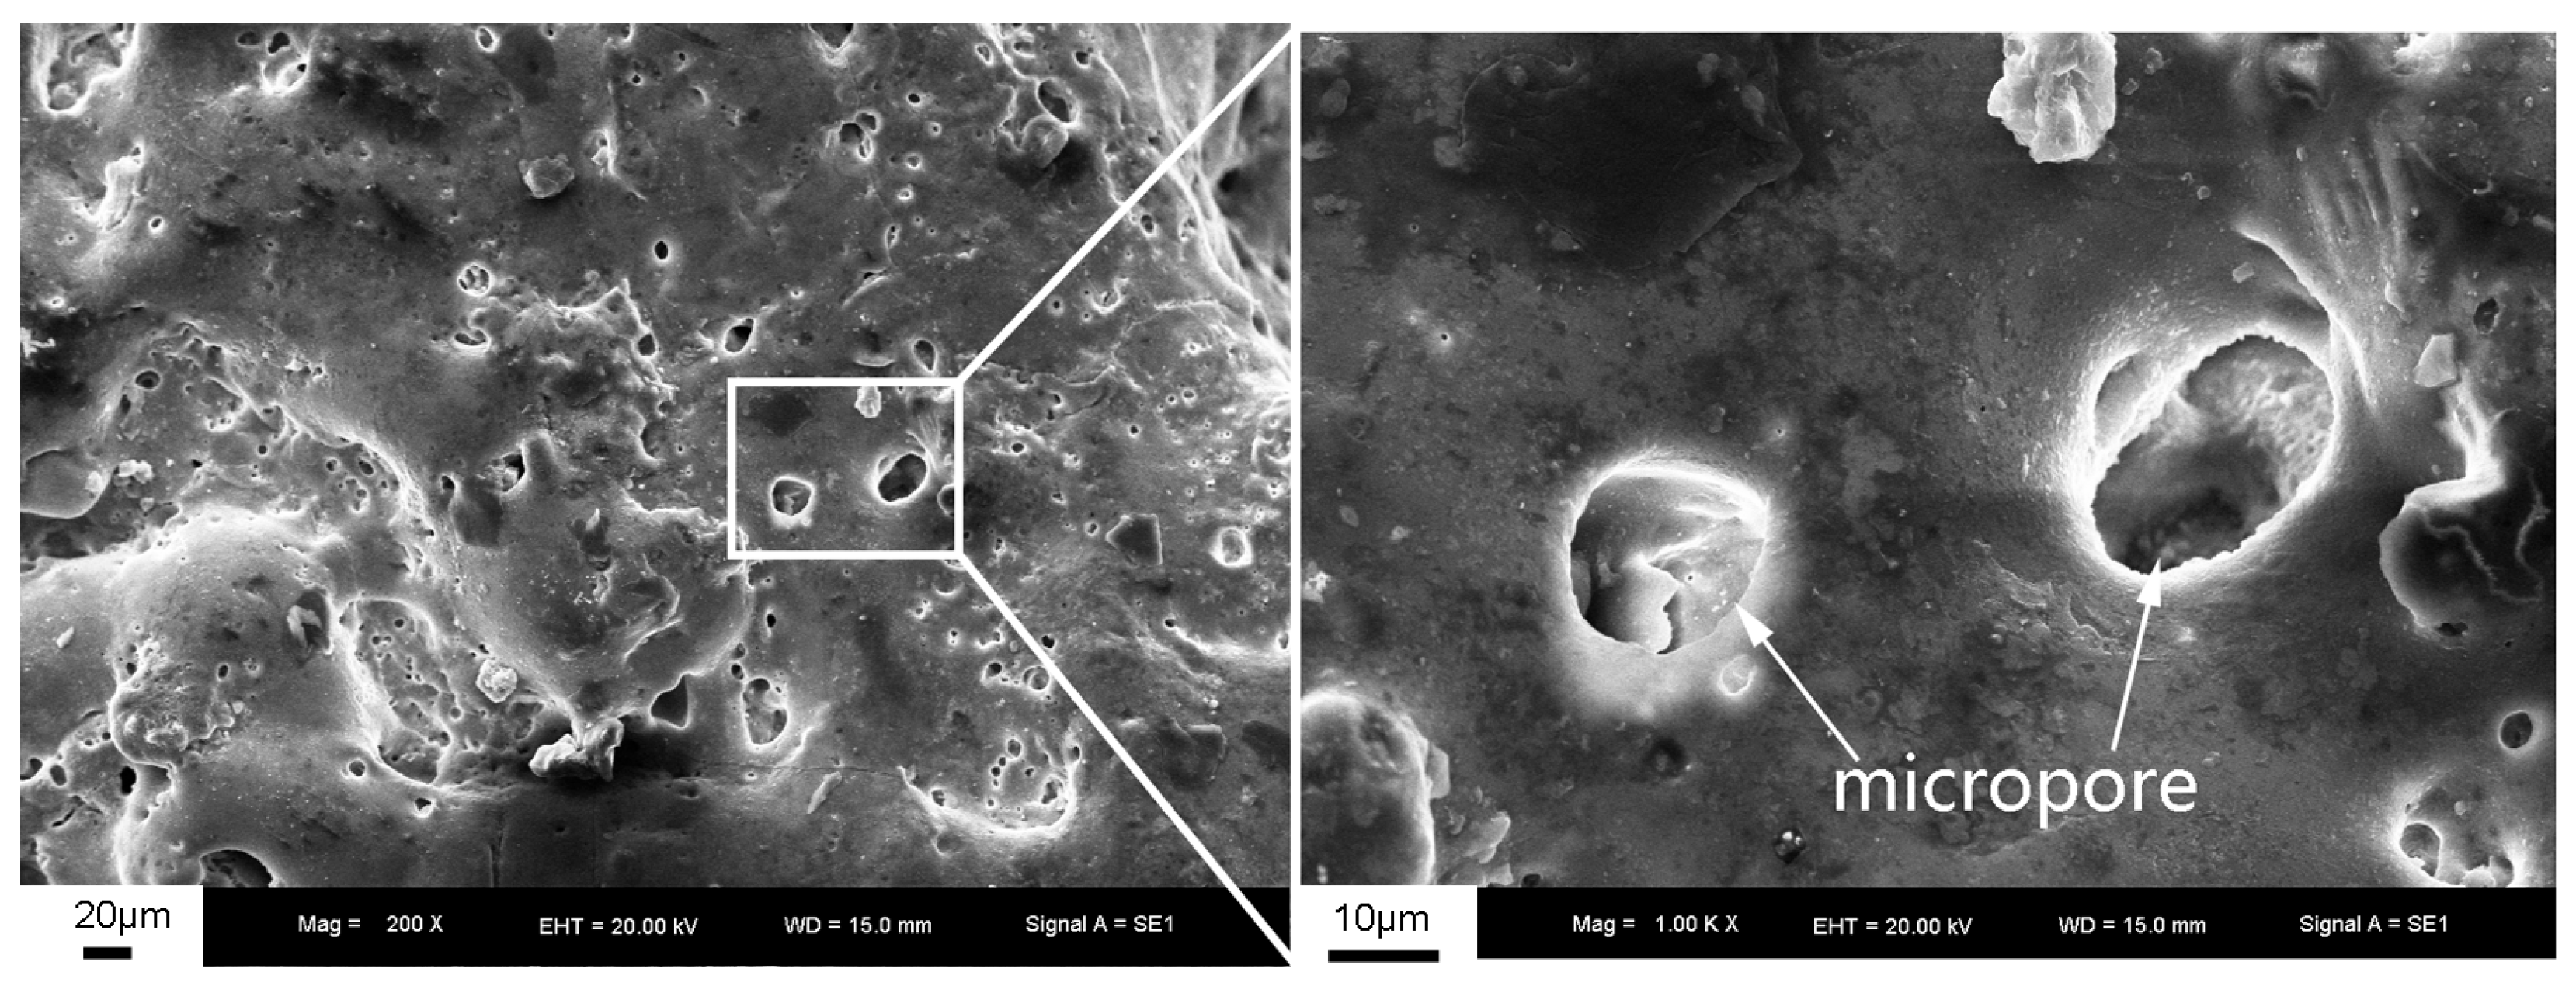
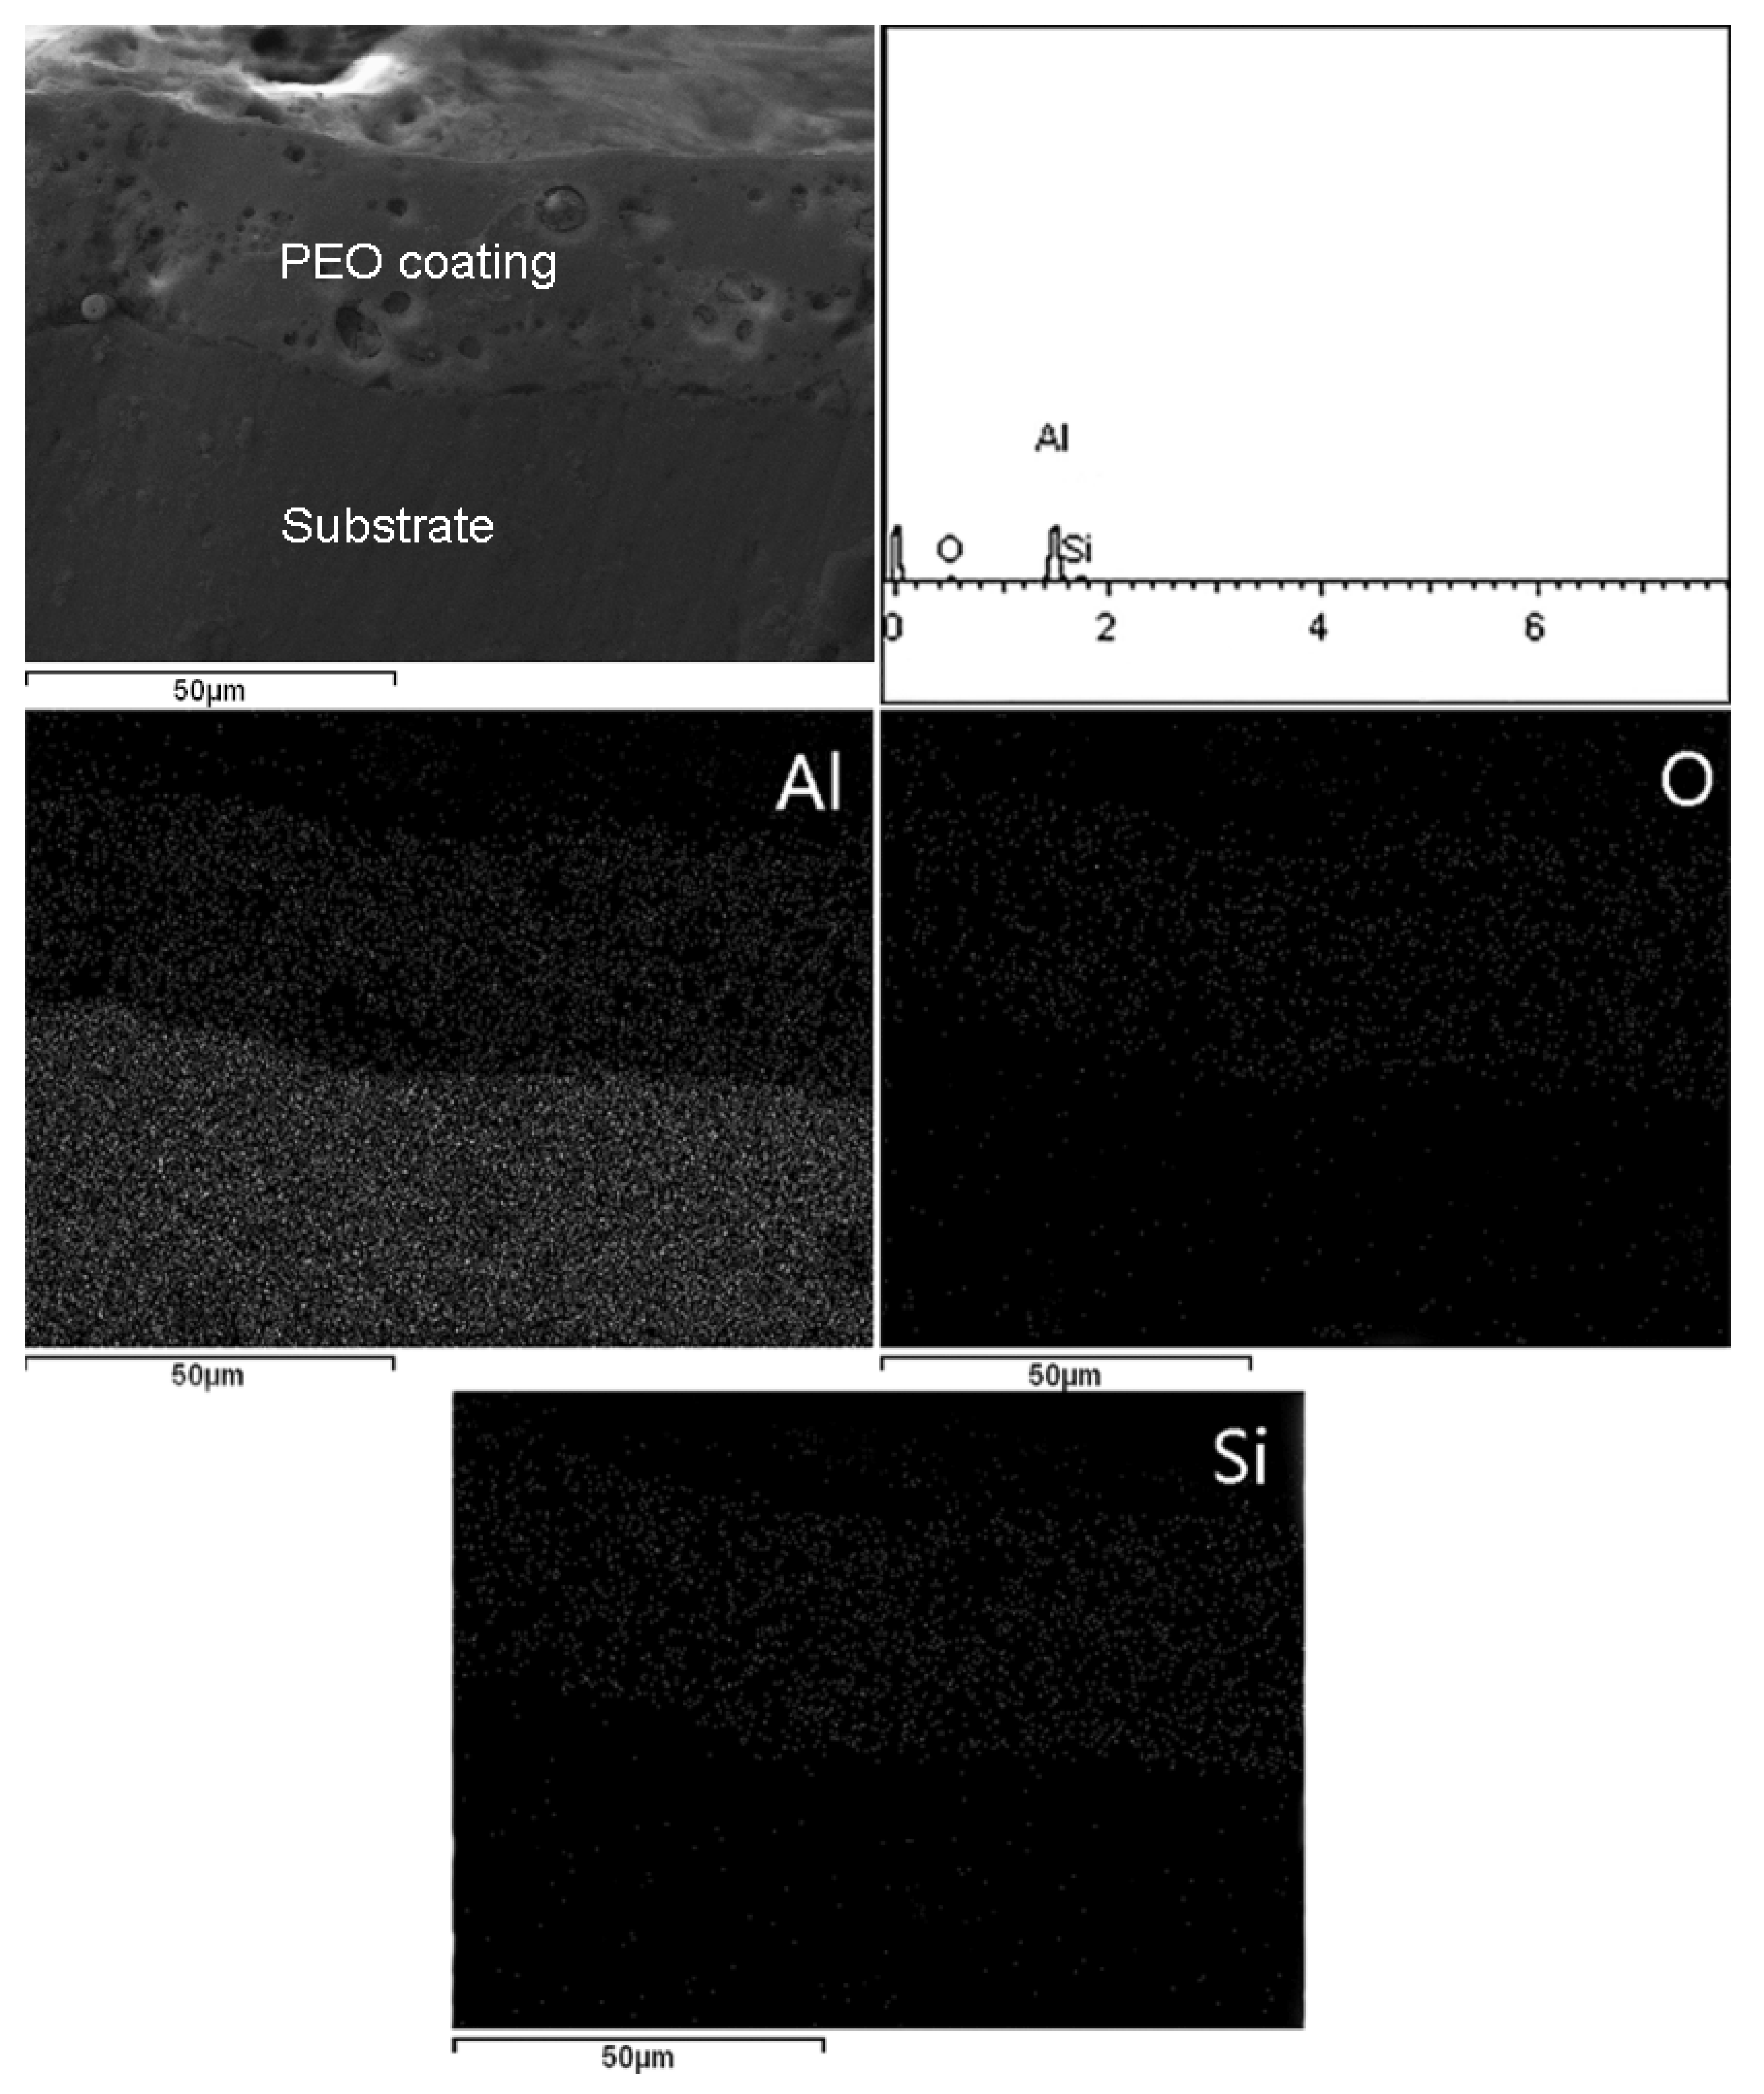
3.1. The Surface Morphology and Thickness of the PEO Coating

Figure 1a shows the optical image of Al foams before PEO treatment. It displays that the Al foams are characterized by an open-cell structure. The porosity of the foam specimen used in this study is about 65%. Figure 1b shows the image of Al foams after PEO treatment. It can be seen that although the foams lost their metallic luster, the composite foams still kept their original macro architecture after they underwent intense electrospark and successive micro-arc discharge during PEO treatment. This result favors a uniform comparison of the compressive property between the as-received foams and composite foams.
Figure 2 shows the SEM image of the surface of the PEO coating. The surface of the coating exhibits a number of micro-pores whose radiuses range from 5 to 15 μm. The formations of the micro-pores are attributed to micro-arc discharge [21]. The micro-arc produced an instantaneous high temperature in the discharge channels during the PEO process, resulting in many molten oxides. Afterwards, these molten oxides were rapidly solidified under the cooling effect of the electrolyte after they were ejected from the discharge channels. As a result, the PEO coating composed of oxides was deposited on the surface of the foam struts. This experimental result is in line with the study by Khan [22].
Figure 3 shows the SEM image of the cross section of the PEO coating. Generally, the PEO coating consists of a porous external layer and a relative dense internal layer [22]. In this study, it is indicated that there are a number of micro-pores in the external layer and internal layer of the PEO coating. The average thickness of the PEO coating is about 31 μm. However, it is found that the thickness of the PEO coating is inhomogeneous. Generally, the thicker coatings can be found near the outer edge of the foams due to various current density distributions during the PEO process. The variation in the PEO coating thickness of the open-cell foams is consistent with previous results [12]. This phenomenon is likely induced by the complex inner architecture of Al foams, which introduces both a reduced potential and a limited mass transportation of the electrolyte solution from the outer to the inner architecture of the foams [12,13].

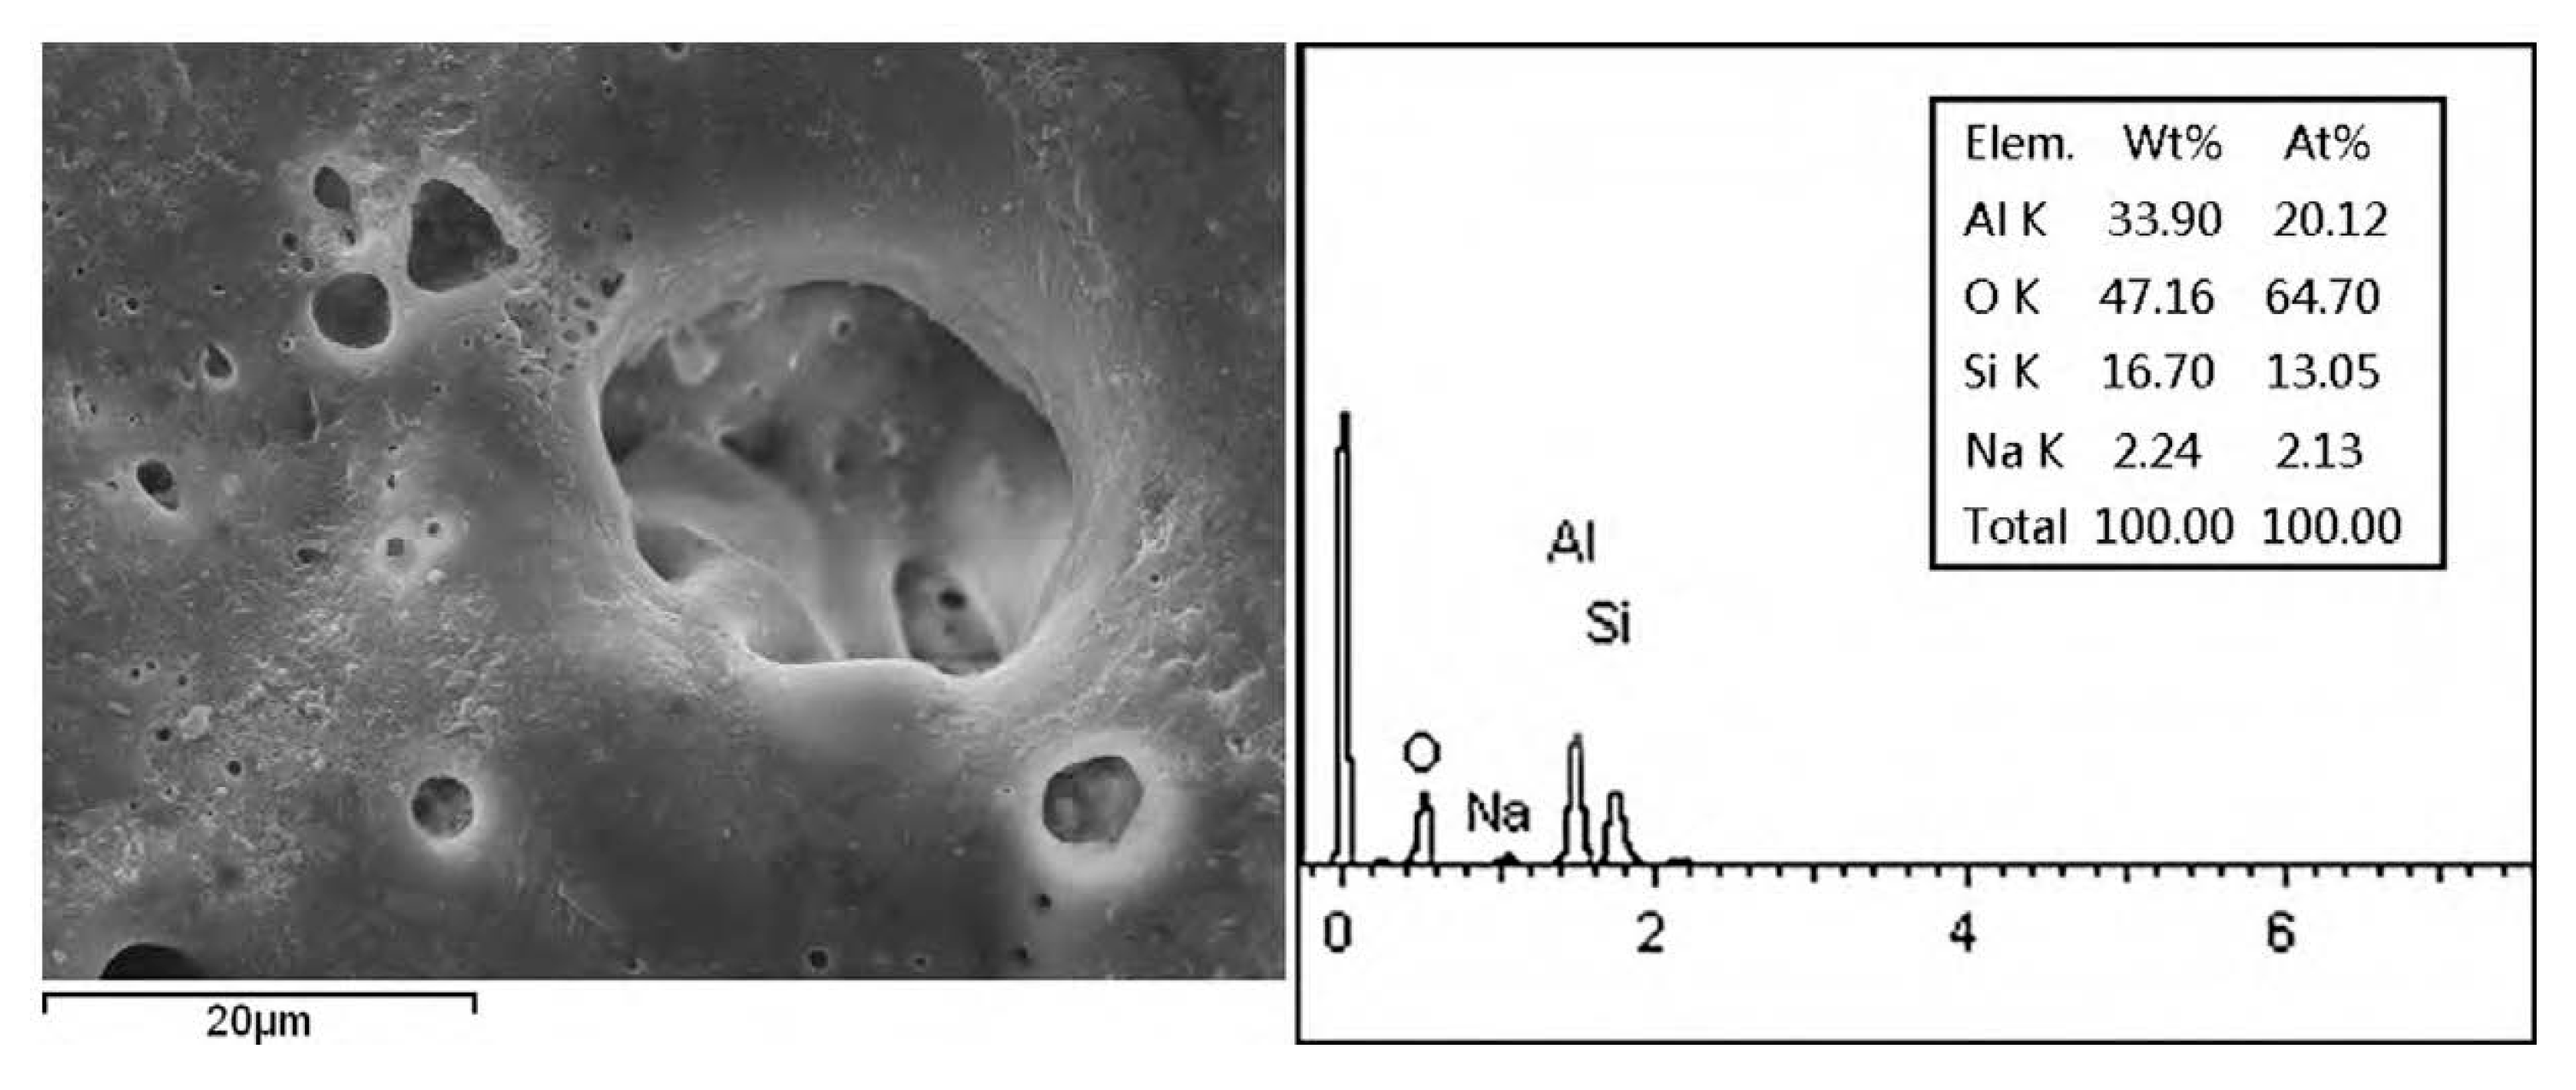
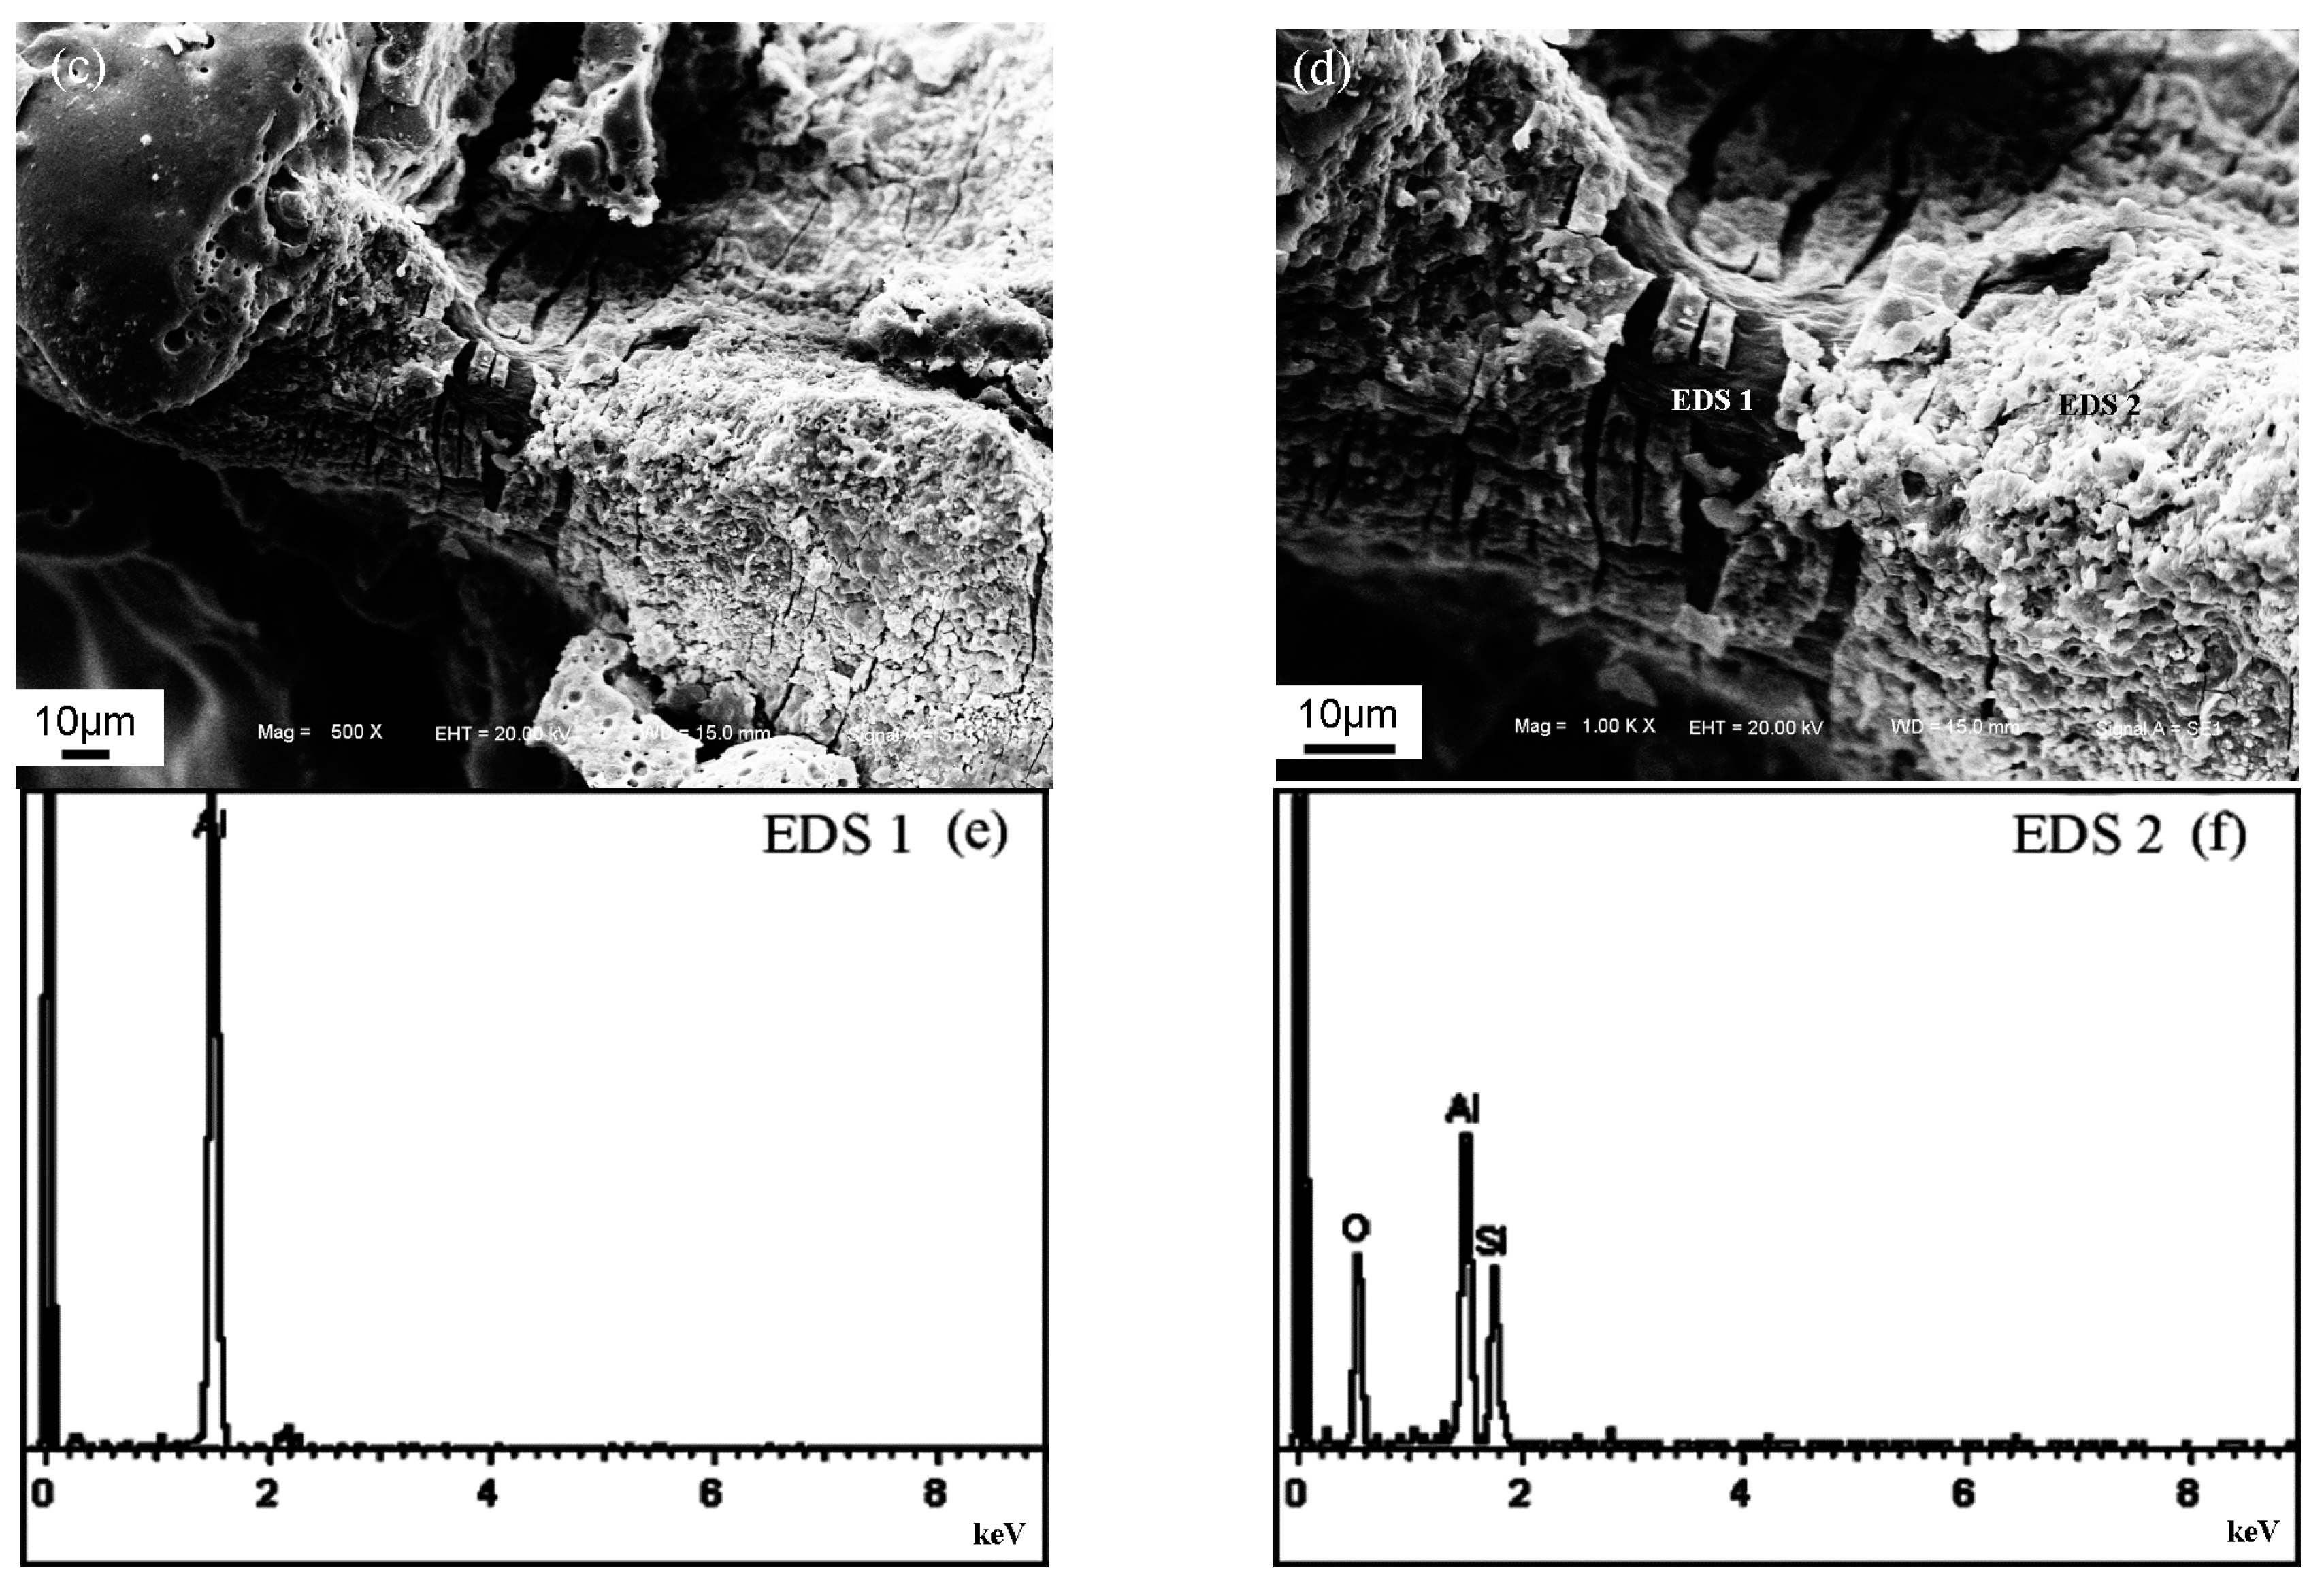
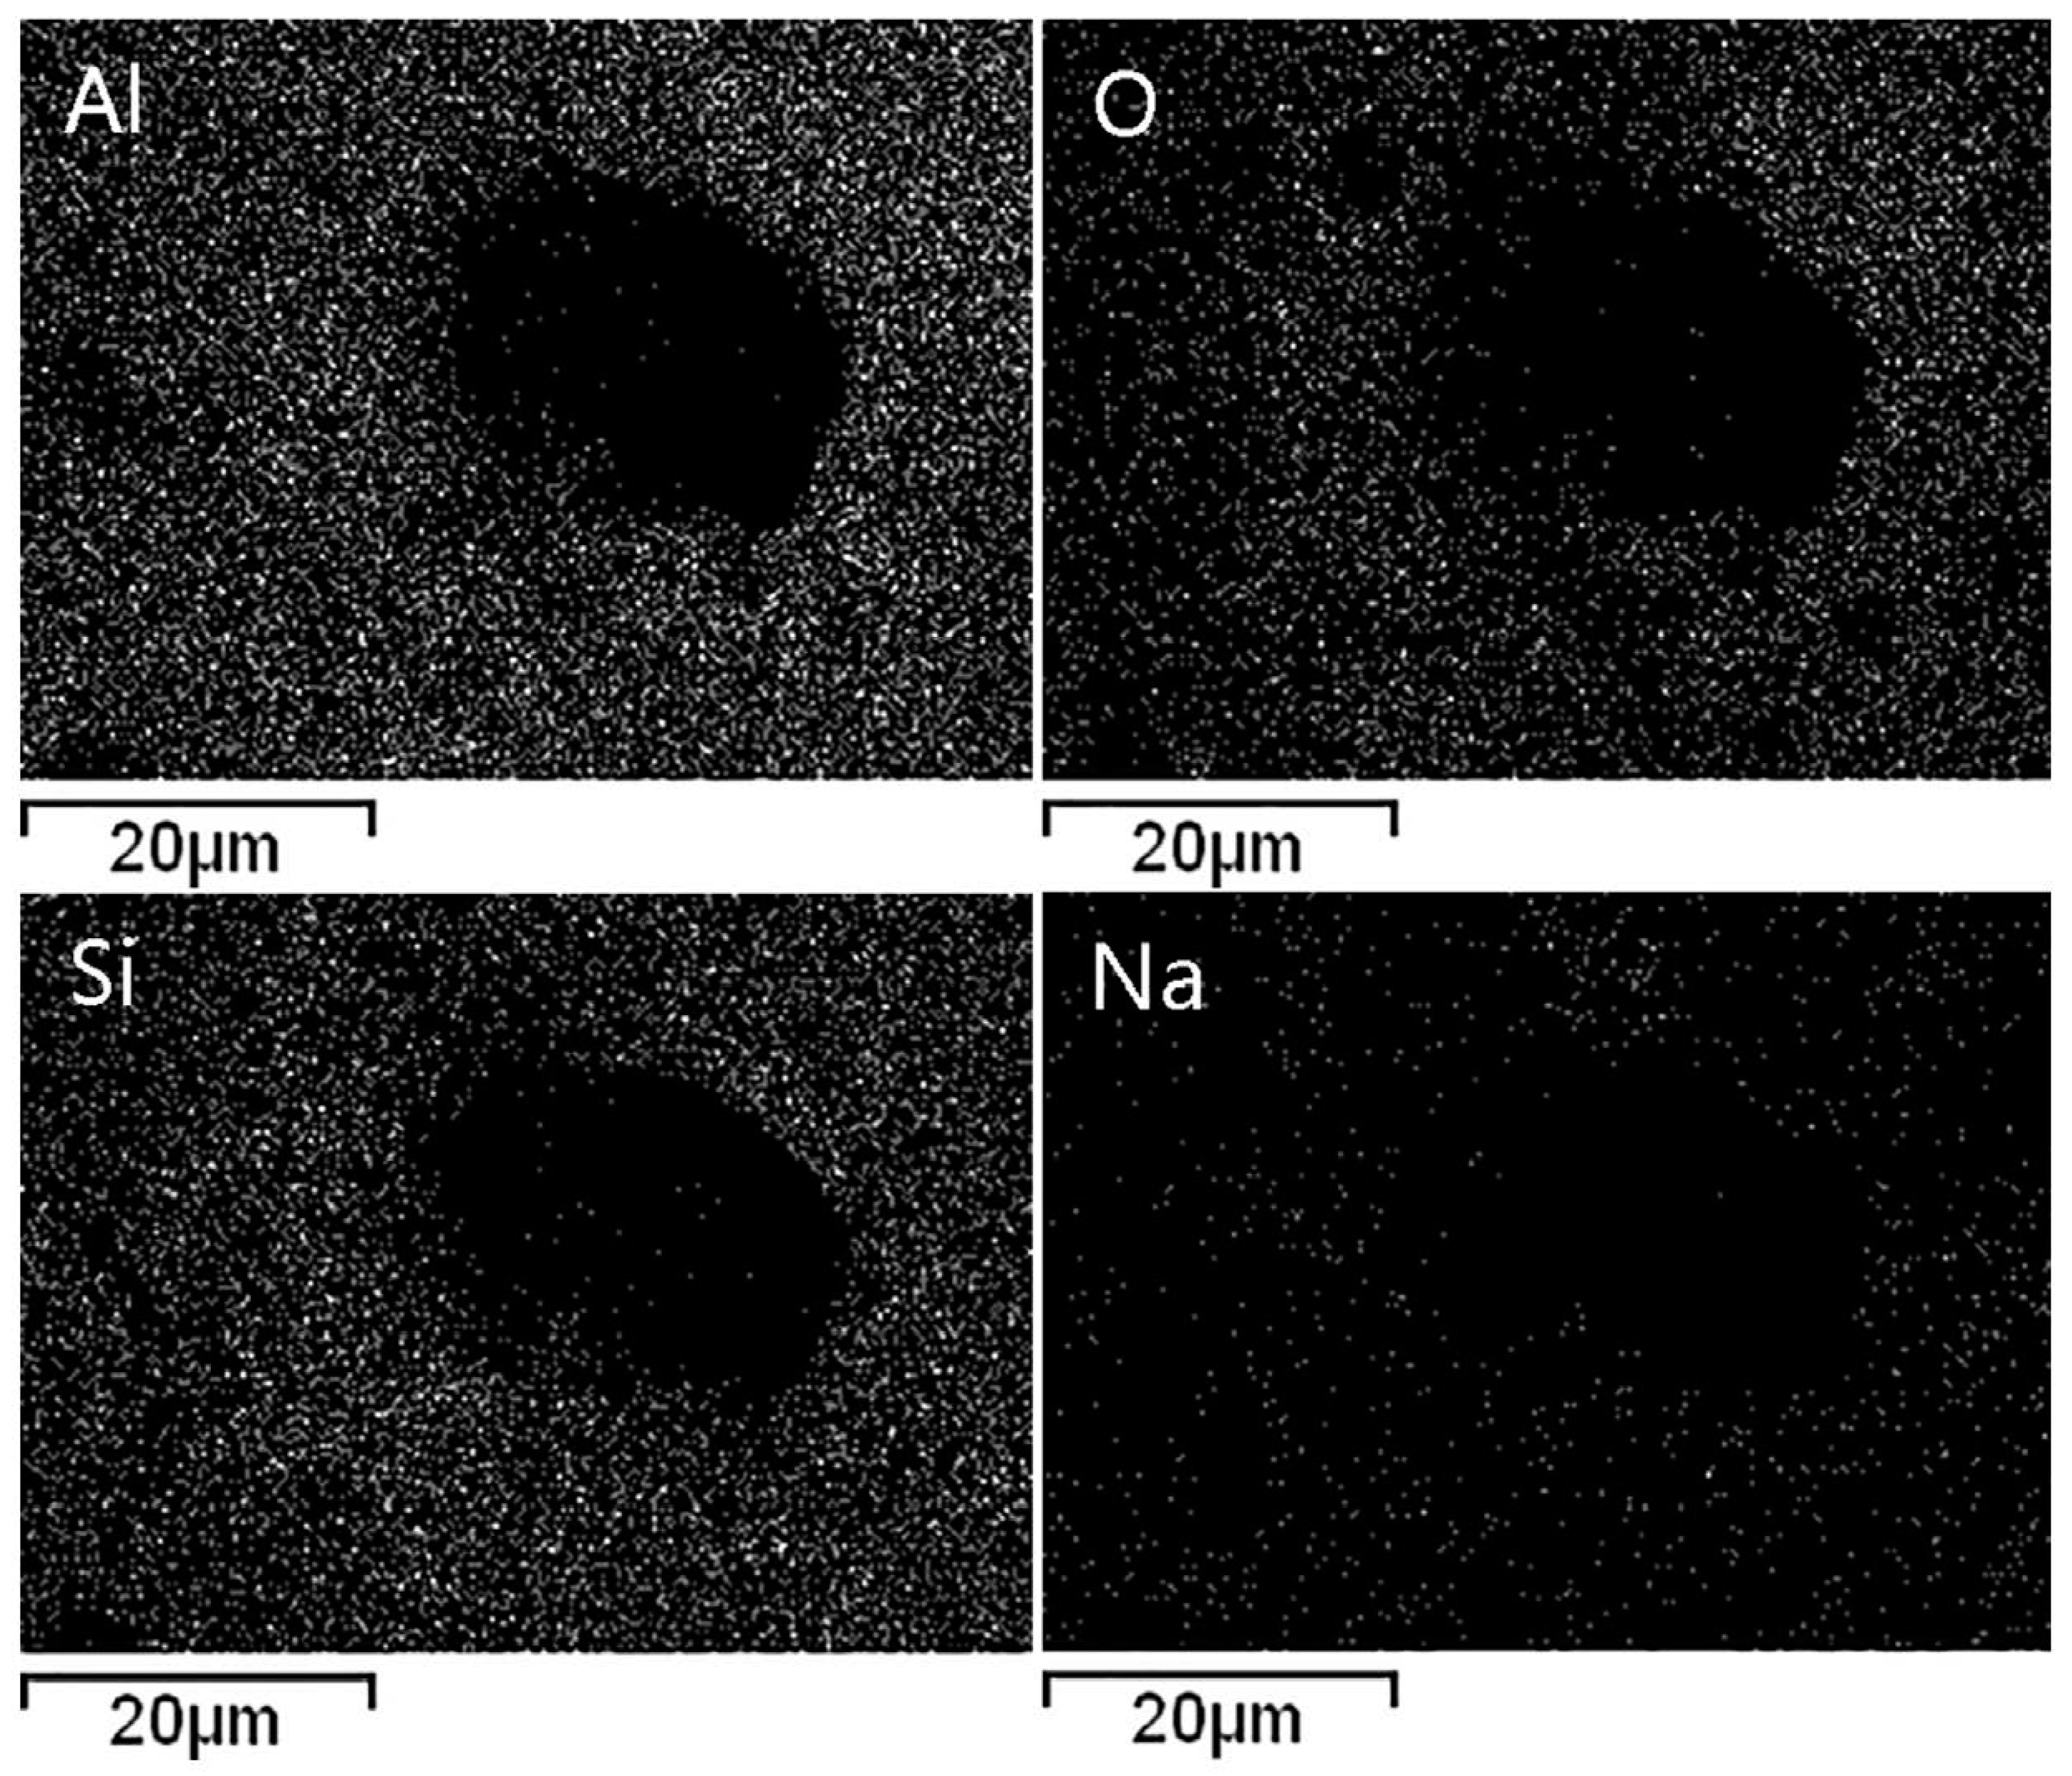
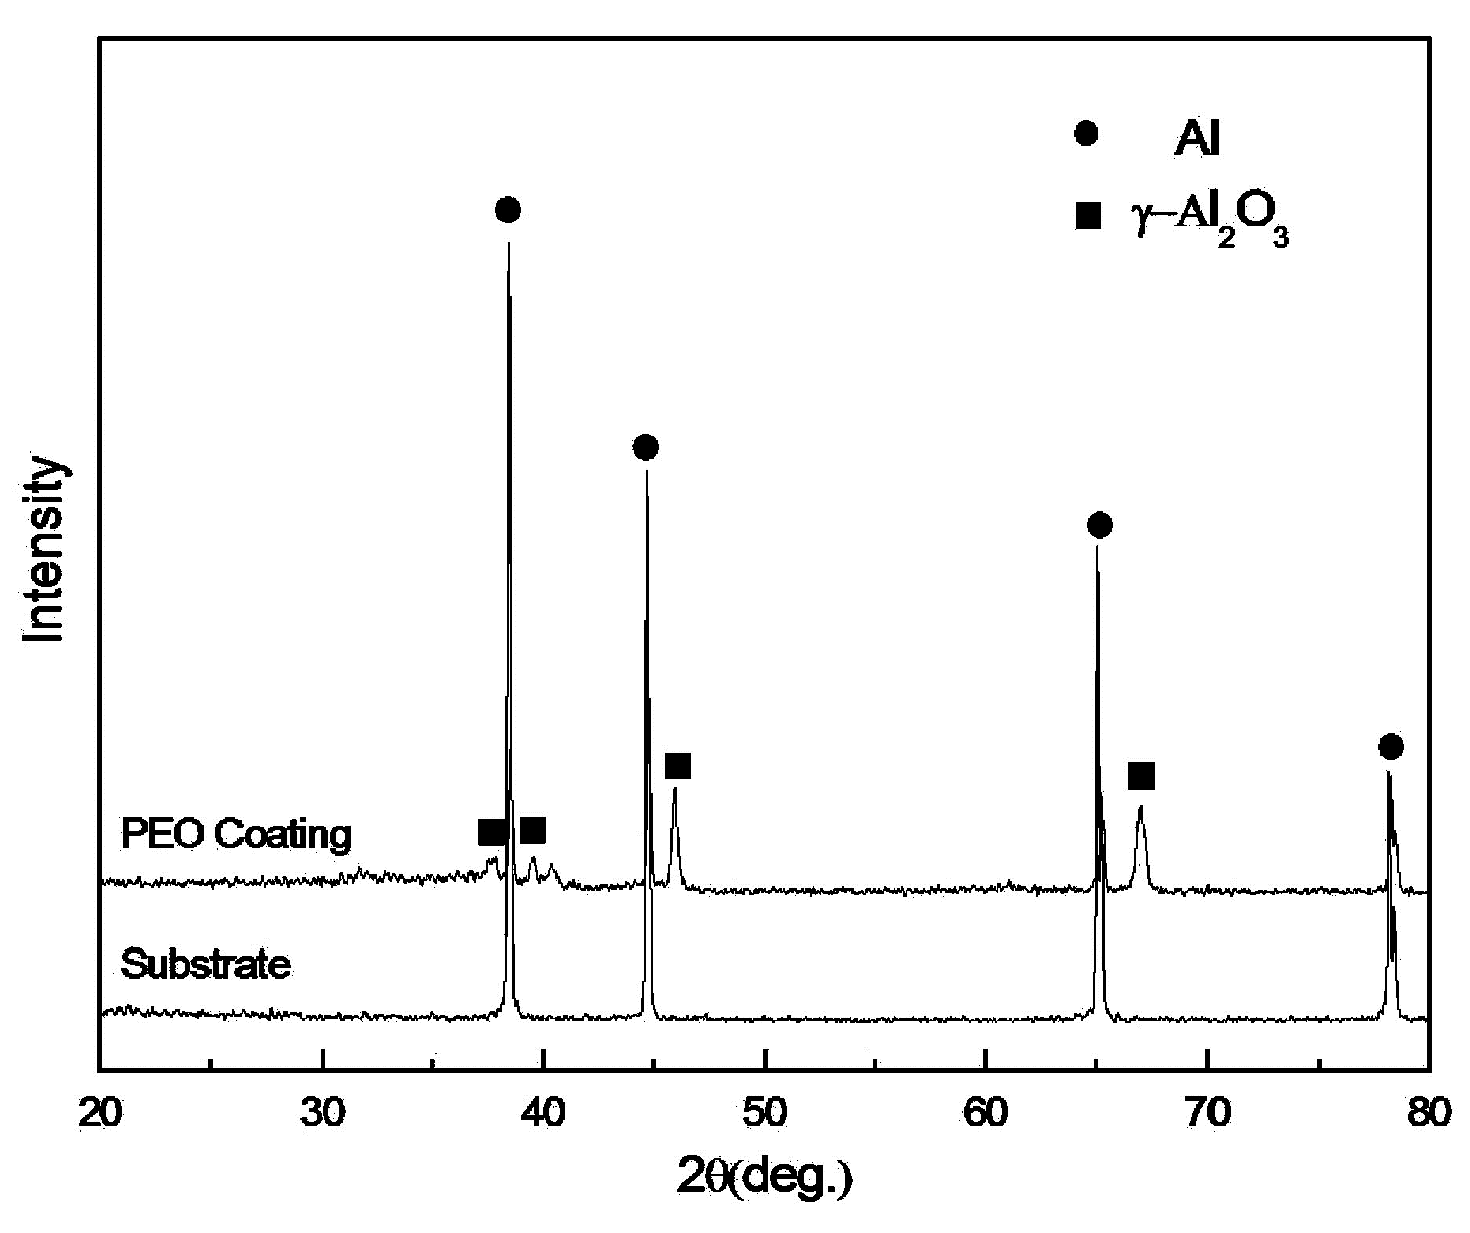
3.2. Element and Phase Composition of the PEO Coating

Figure 4 and Figure 5 show the EDS analysis results on the cross section and surface of the PEO coating, respectively. The analysis illustrated that the PEO coating is composed of four elements, i.e., Al, O, Si and Na. Among these elements, the PEO coating mainly contains Al and O. The Al element is derived from the matrix, while the Si element and Na element are come from the electrolyte.
Figure 6 shows the XRD results of Al foams and composite foams, respectively. The strong peaks of the Al phase and γ-Al2O3 phase are detected from the composite foams. It is clear that the Al phase is from the foam strut, as exhibited in the peaks from substrate. Therefore, the main phase composition of the PEO coating is the γ-Al2O3 phase. A similar conclusion was put forward by Sundararajan and Khan that the surface layers of the PEO coatings are comprised of main γ-Al2O3 phase with a small proportion of α-Al2O3 [21,22].

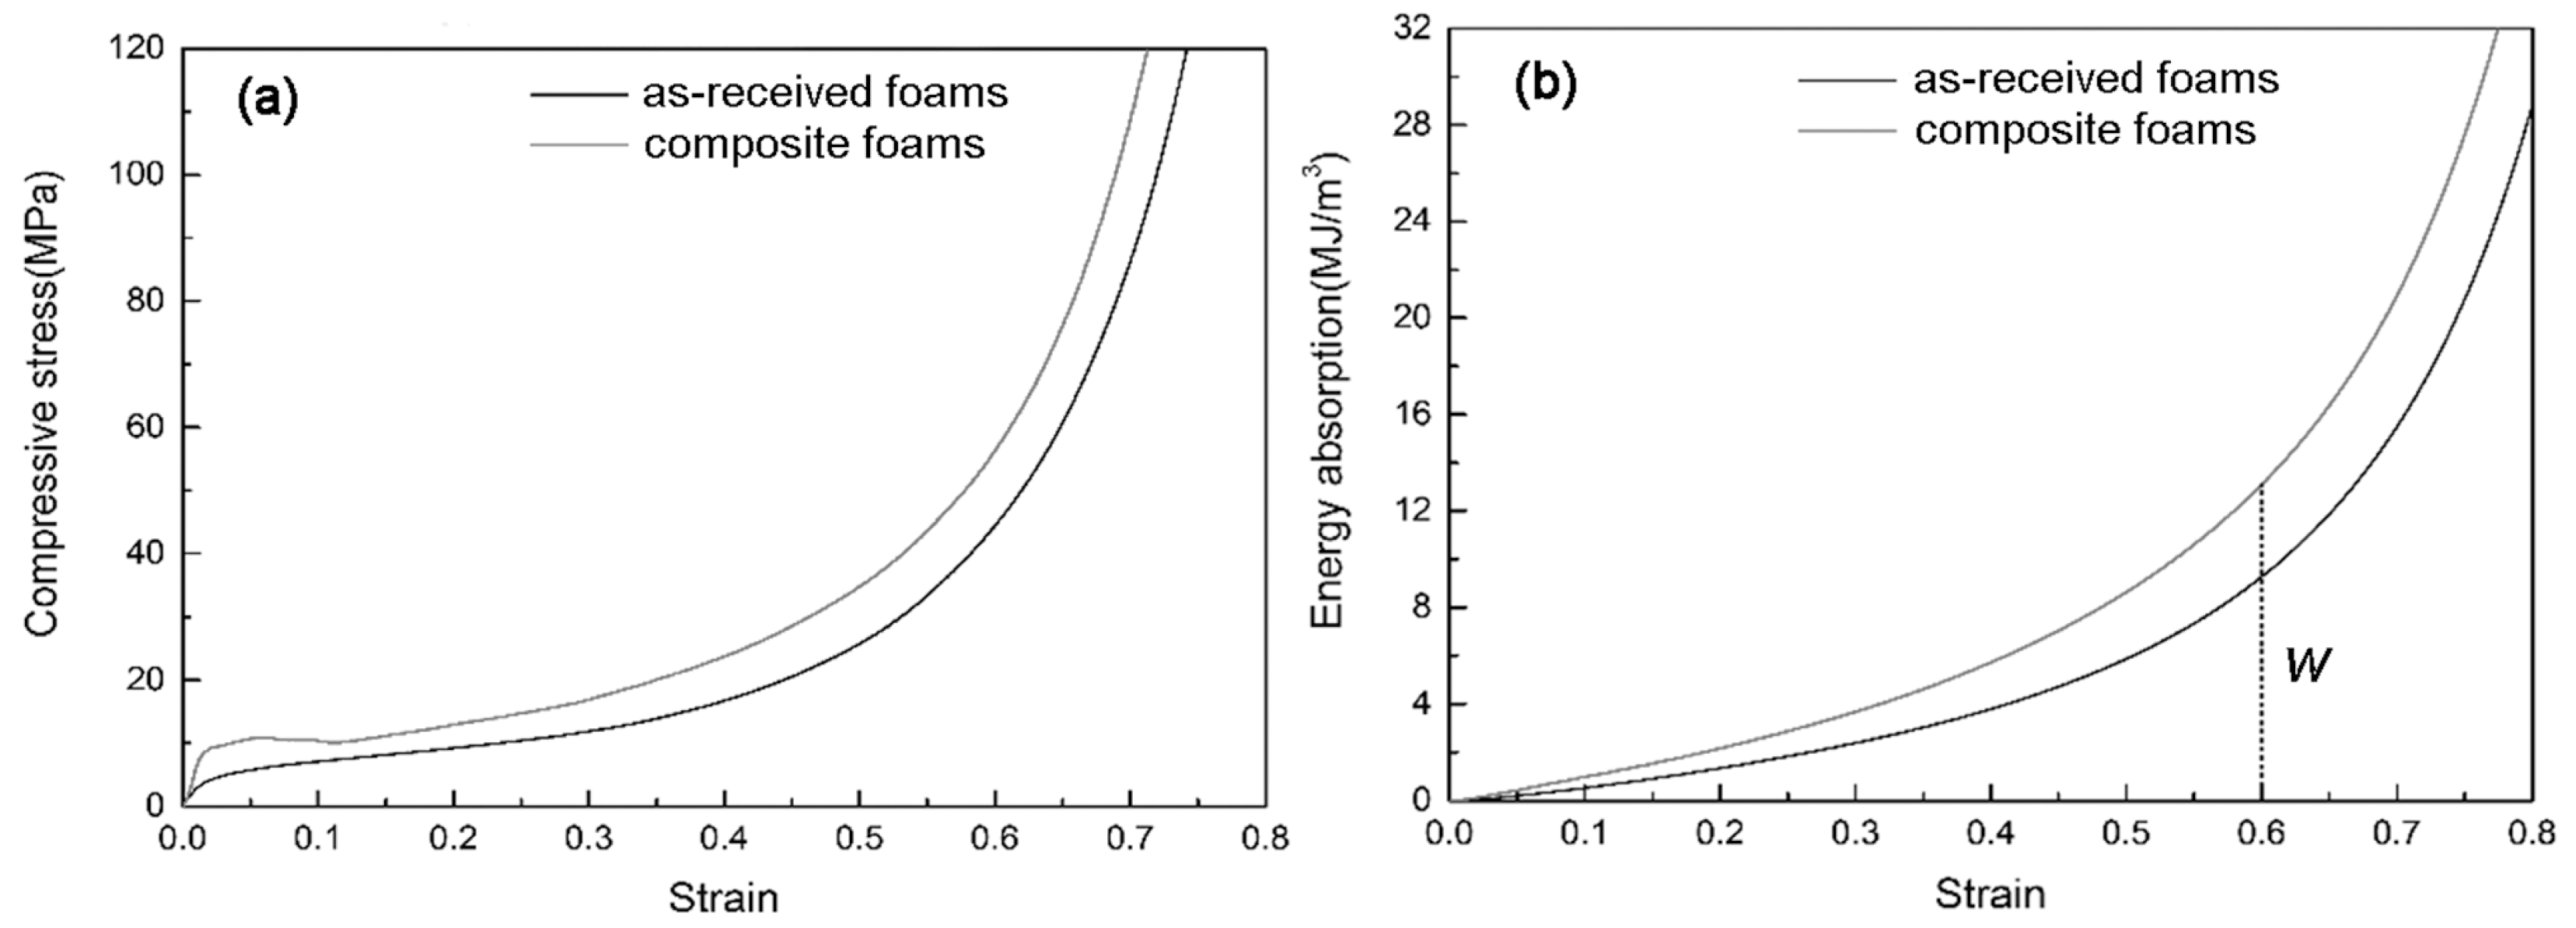
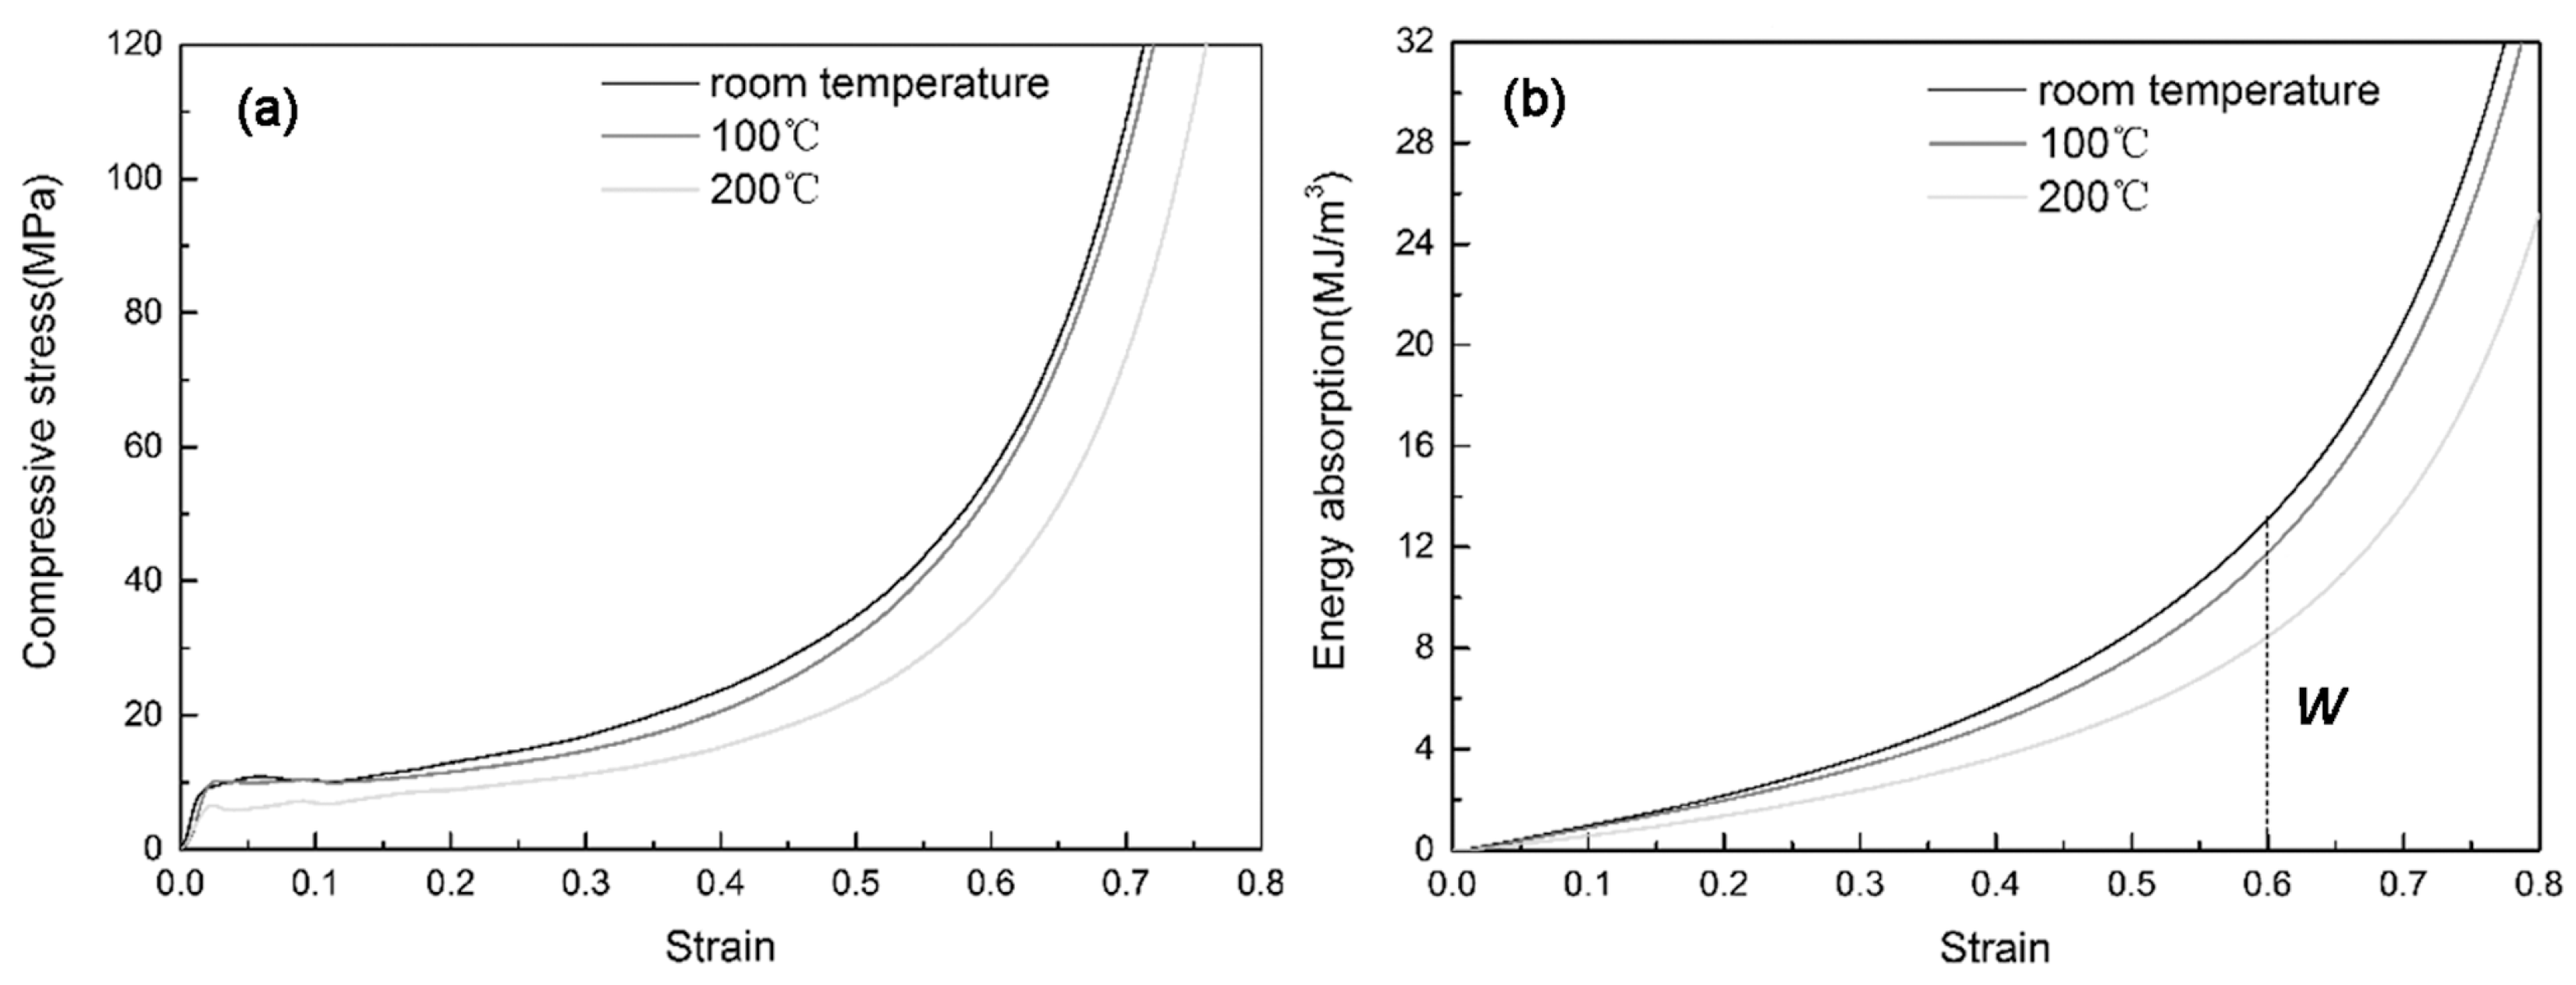
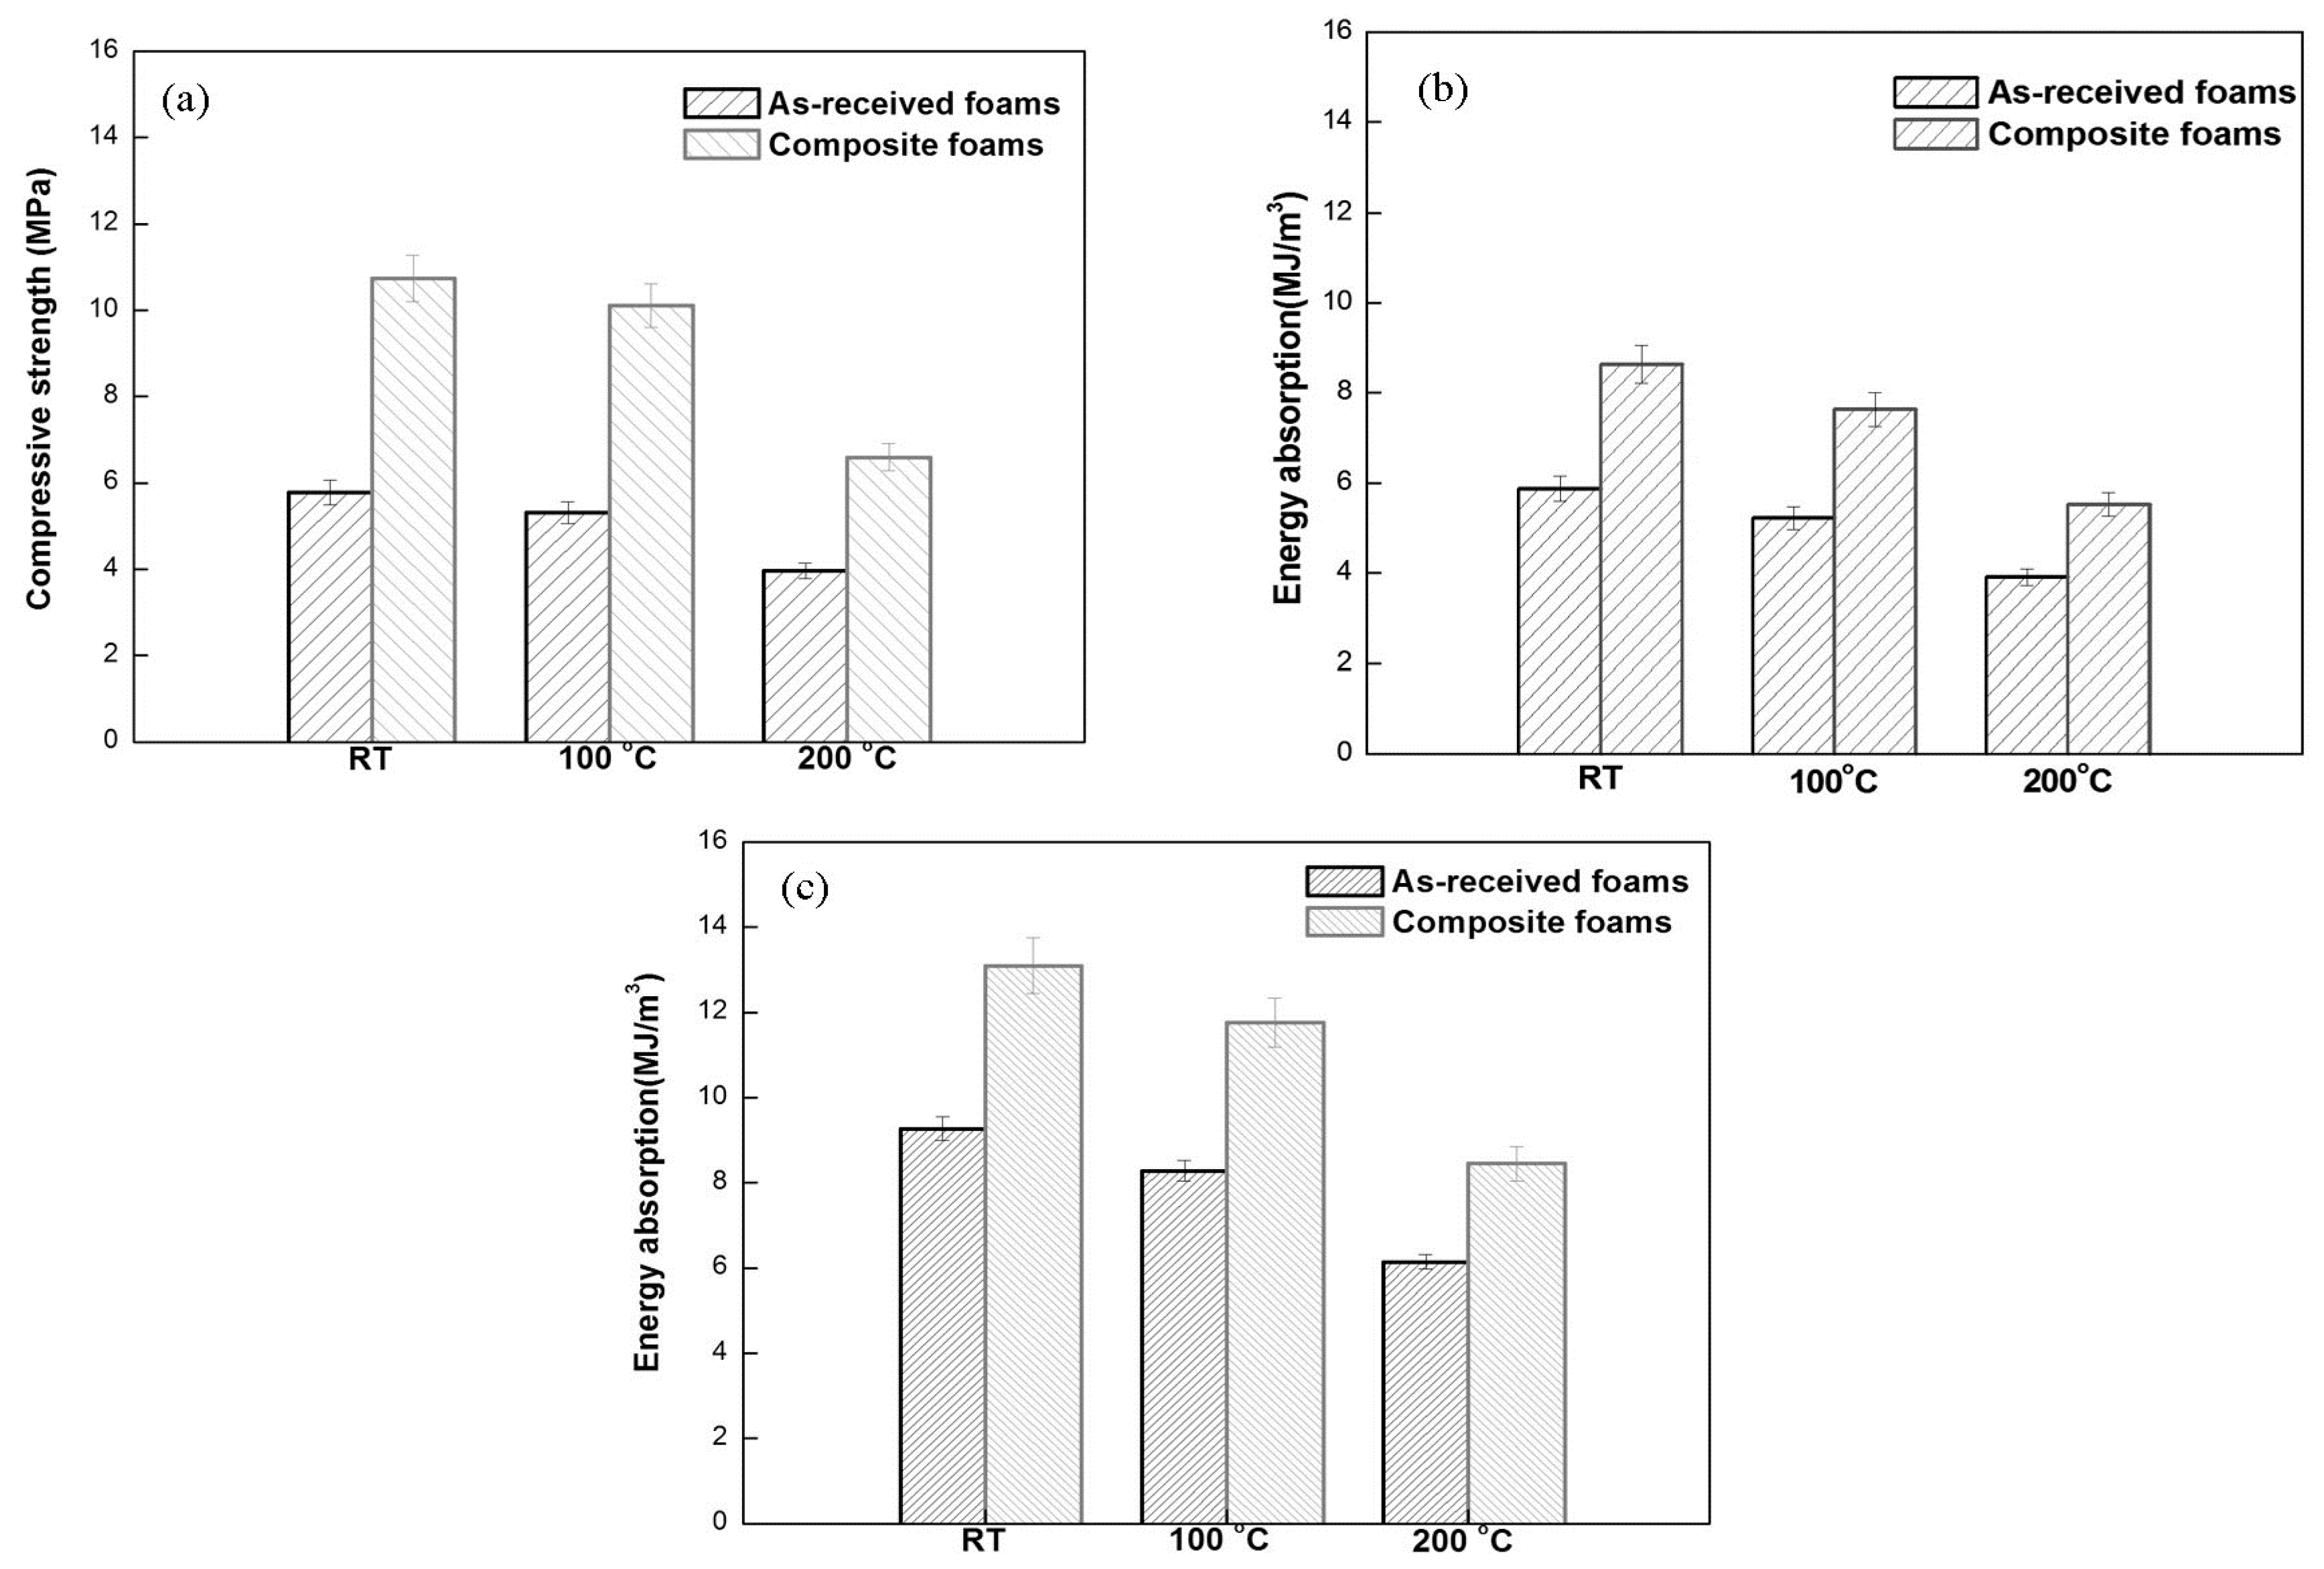
3.3. Compressive Properties of Composite Foams

Figure 7 shows the compressive stress–strain curves and energy absorption capacities of as-received Al foams and composite foams at room temperature. It can be seen from Figure 7a that both compressive stress–strain curves contain three regions [1,2,9,20]: originally, there is a linear-elastic region at very low strain; and then a plateau region where the stress rises slowly; finally, a densification region where the stress rises sharply. However, two types of foam exhibit different mechanical responses because the compressive curve of composite foams presented a yield stress beyond the linear-elastic region; by contrast, the compressive curve of Al foams showed a slowly increasing stress rather than yield stress. This experimental result indicated that the deformation behavior and failure mechanism are quite different between the two types of foams. It is noted that the mechanical responses of the PEO ceramic/Al composite foams are also different from those of ceramic hollow sphere/Al composite foams reported in previous investigations, since the latter foams display a rapid drop after the peak stress beyond the linear-elastic region [9,10].
As for compressive strength, the composite foams exhibit a higher value than the Al foams due to the reinforced effect of alumina ceramic on the foam strut. As a result, the composite foams also exhibit a higher energy absorption capacity as compared with the Al foams, as shown in Figure 7b. However, the increasing compressive strength and energy absorption capacity are accompanied by the increasing weight of the foams after PEO treatment because of the additional coating on the foam strut. Interestingly, it is reported that the specific strength of the foams is also improved by the PEO coating [13].
Figure 8 shows the compressive stress–strain curves and energy absorption capacities of composite foams at elevated temperatures. It can be seen that the stress oscillations are significant at elevated temperatures, especially at 200 °C, which is believed that attributed to the brittle deformation behavior of the foams [1,2]. In addition, the compressive strength and energy absorption capacity of the composite foams decrease with the increase of temperature and this downward trend of the composite foams is similar to that of the as-received Al foams due to the softening effect of elevated temperature on the Al strut [23]. As shown in Figure 8b, the temperature also induces a decrement in the energy absorption capacity. The energy absorption capacity of the composite foams reduces with increasing temperature. The decrement in compressive strength and energy absorption capacity at 200 °C is obvious.
However, it is noted that the compressive strength of composite foams is still higher than that of as-received Al foams at both 100 °C and 200 °C. This is confirmed by Figure 9, which shows the compressive strength and energy absorption capacity of as-received Al foams and composite foams at different temperatures, respectively. Therefore, it is concluded that the Al2O3 ceramic coating deposited on the surface of the foams can maintain the compressive property at elevated temperatures due to the high heat tolerance of Al2O3 ceramic.

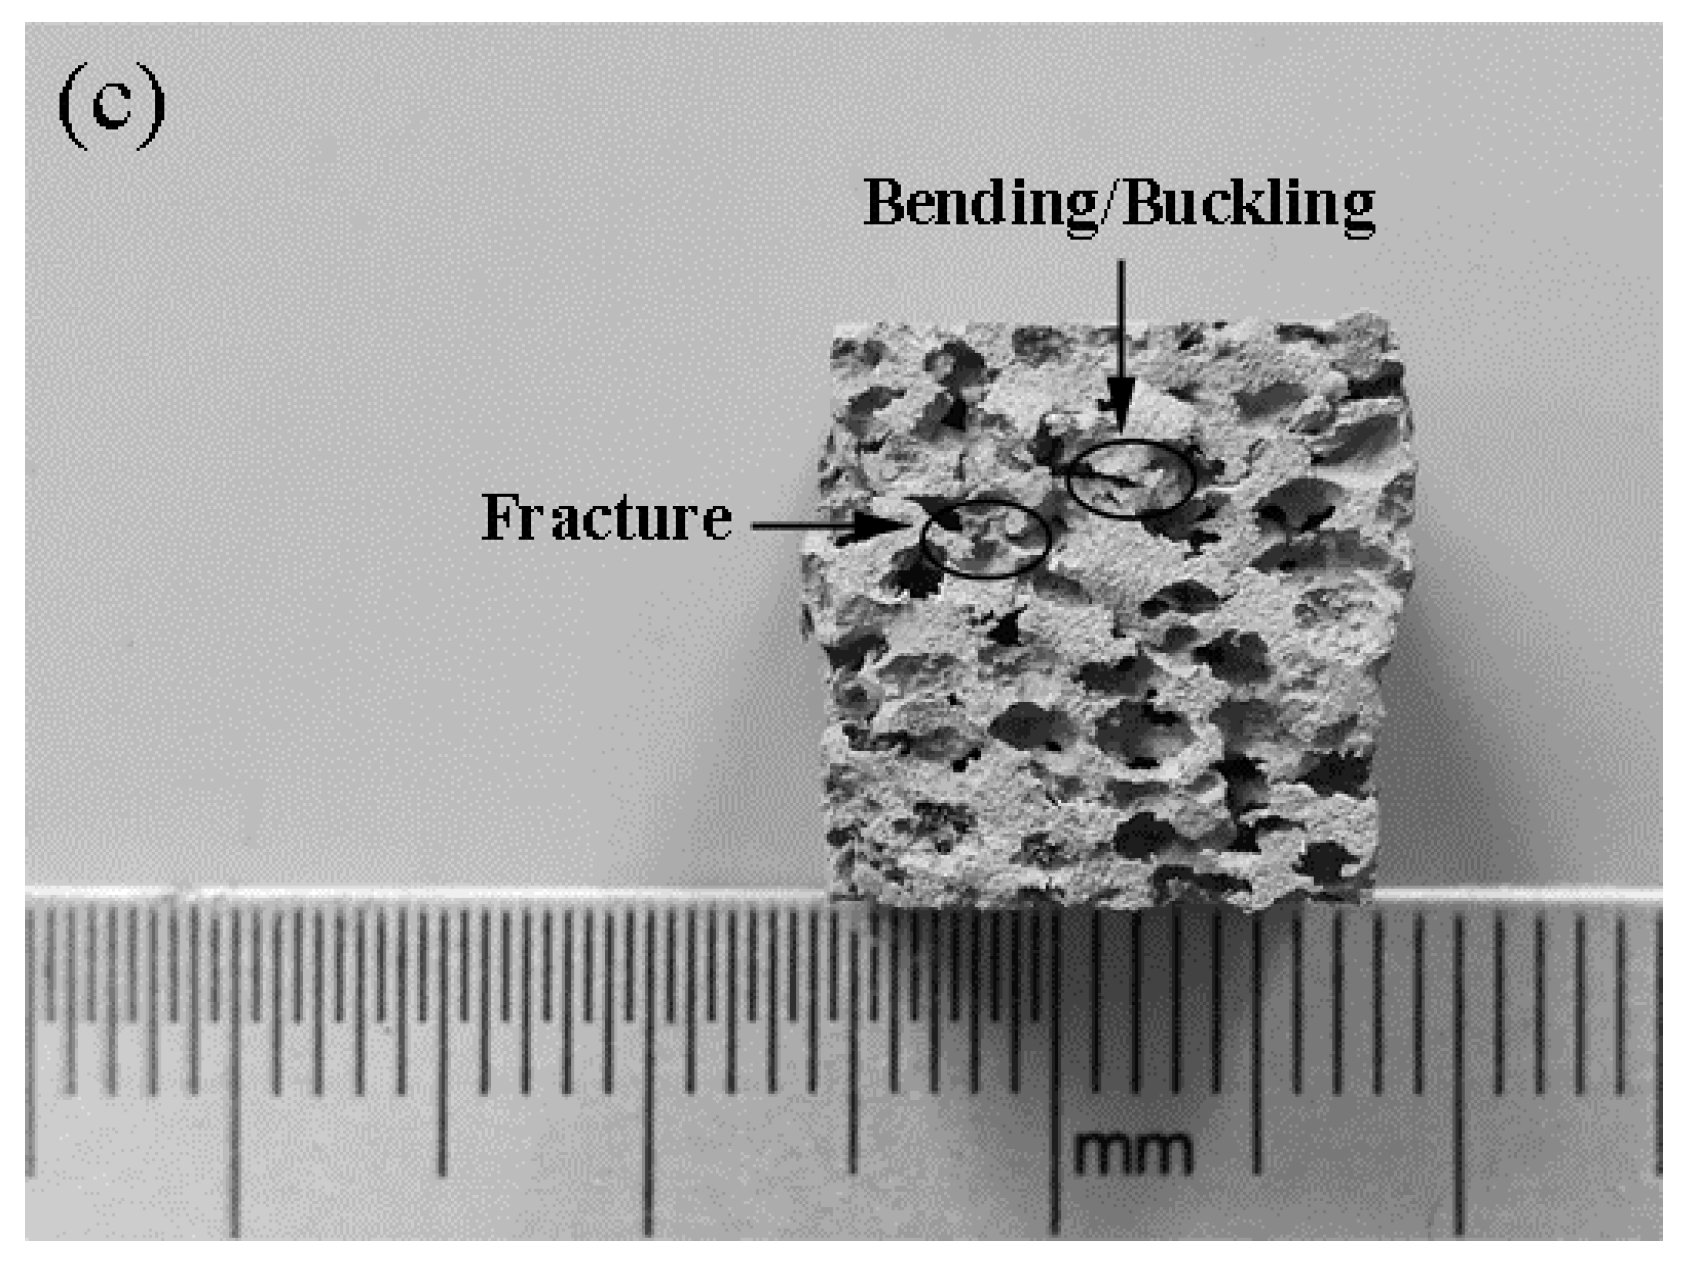
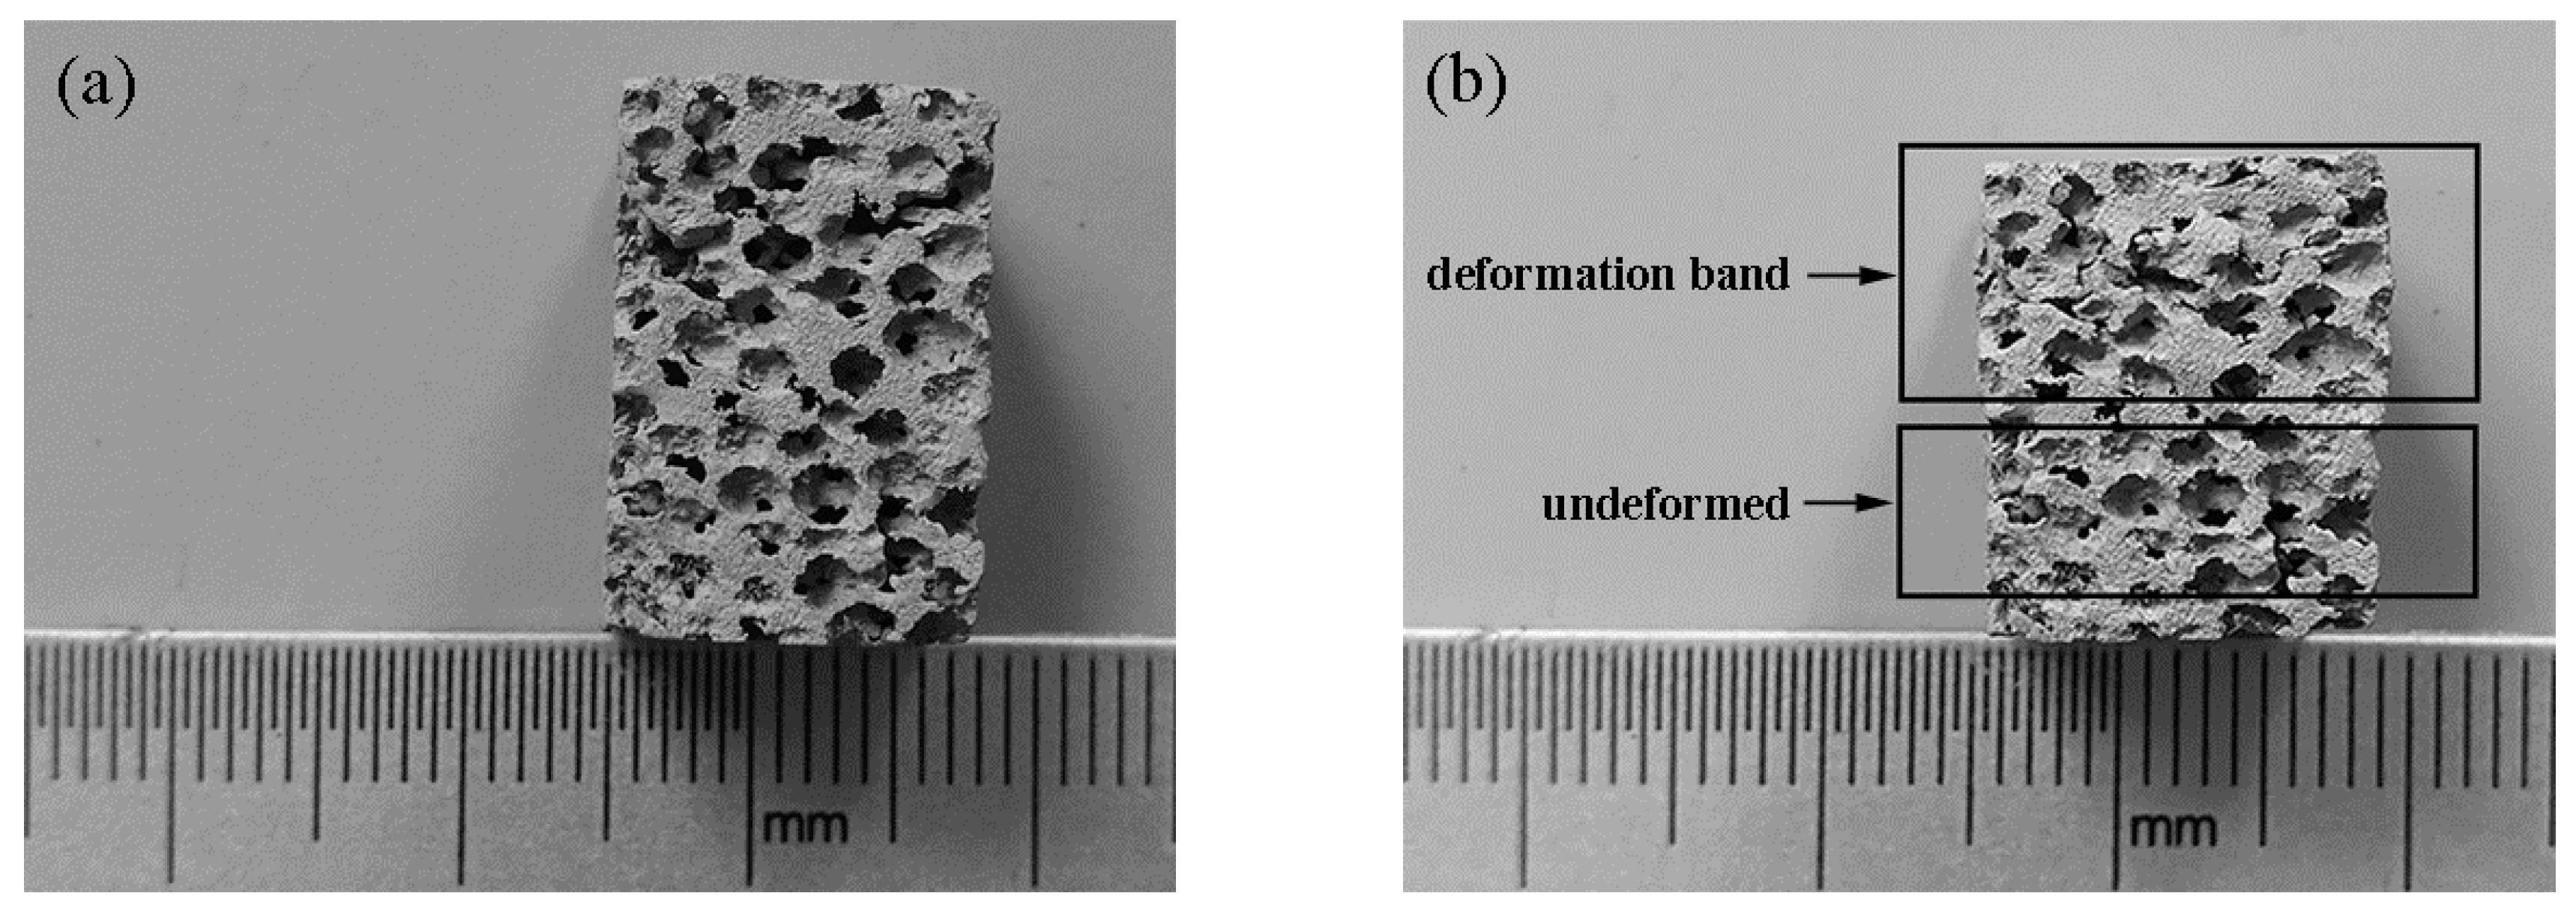
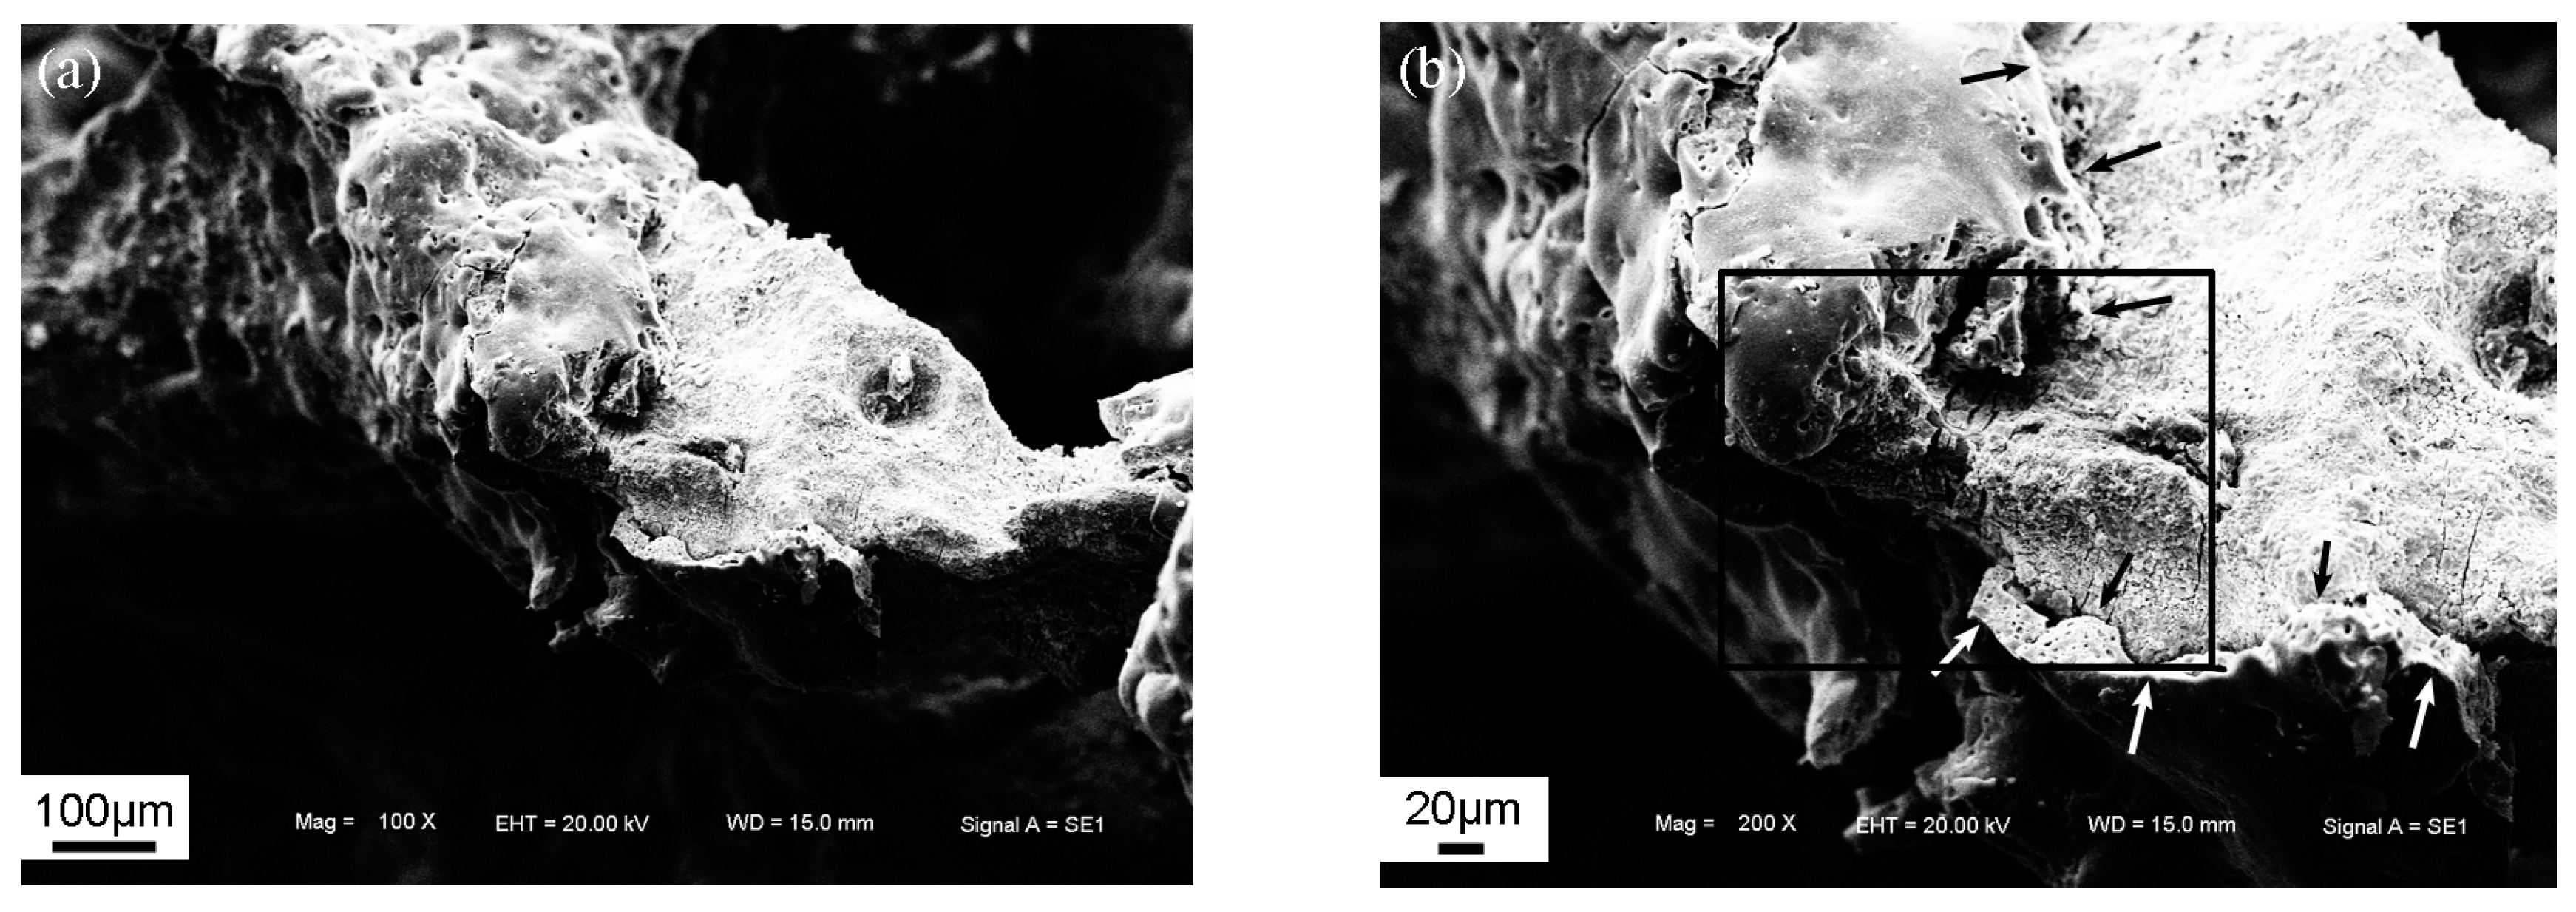
3.4. Failure Mechanism

Figure 10 shows the macroscopic deformation behavior of the composite foams at different strains. It can be seen that the macroscopic deformation of the composite foams is characterized by the local bending/buckling and fracture of the foam strut (Figure 10c). These behaviors that happened in several foam struts induced the formation of a local deformation band (Figure 10b). After the foam struts were crushed and put into contact with each other, a densification of the foams took place.
Figure 11 shows the SEM image of bending/buckling of the foam strut at room temperature. There are several broken ceramic fragments on the foam strut. Furthermore, interface debondings also can be observed, as indicated by the arrow in Figure 11b. The magnified images (Figure 11c,d) exhibit the occurrence of a crack in the PEO ceramic coating, which is also confirmed by EDS analysis in Figure 11f. It can be seen that several small cracks propagate along with the micro-pores and then they are combined to form a large crack. The large crack is almost straight, indicating a transcrystalline rupture of the ceramic coating. Furthermore, the interface debonding takes place between the PEO coating and Al substrate, which is evidenced by the highly magnified image (Figure 11d) and its EDS analysis (Figure 11e).
Figure 12 shows the SEM image of the fracture of a foam strut at room temperature. It can be seen from Figure 12a that the foam strut is fractured. In addition, the arrow in Figure 12b indicates some large cracks in the PEO coating. Further magnification images (Figure 12c,d) exhibit the interface debonding that occurred between the PEO ceramic coating and Al substrate.
Figure 13 shows the SEM image of the deformation of a foam strut at 200 °C. The arrow in Figure 13a indicates a fracture of a foam strut. In addition, the PEO ceramic coating was seriously cracked, as shown in Figure 13b.
Based on these SEM observations mentioned above, it can be concluded that the crack in the ceramic coating and debonding of the coating/Al interface are considered as two main causes for the failure of the composite foams during compressive deformation at different temperatures. As compared with pure Al, the Al2O3 ceramic has higher mechanical properties (e.g., hardness and modulus) and heat tolerance; however, high mechanical properties are usually accompanied by a significant brittleness of Al2O3 ceramic. It can be inferred that although the ceramic coating maintains high mechanical properties and heat tolerance at elevated temperature, its low ductility may cause a crack early on at relative low strain. These factors, in addition to interface debonding, promote the brittle deformation behavior of the composite foams.

4. Conclusions

In the present study, a γ-Al2O3 ceramic coating was deposited on the surface of open-cell Al foams by applying PEO technology. The average thickness of the coating was 31 μm, but the thickness was not uniform. The compressive strength and energy absorption capacity of the composite foams decreased with the increase of testing temperatures. However, the composite foams exhibited higher compressive strength and energy absorption capacity than the as-received Al foams at all testing temperatures; but, the Al2O3 ceramic coatings bring about some brittleness to the foams. The compressive property of the open-cell Al foams at elevated temperatures can be improved by the PEO ceramic coating.

Acknowledgments

This work is supported by “The National Natural Science Foundation of China (Nos. 51201068 and 51475200)”. Science and Technology Development Project of Jilin Province (No. 20150519007JH).

Author Contributions

The experimental scheme was framed by Jiaan Liu. The fabrications, characterizations and experiments were performed by Wenchi Pan, Fujian Si and Yan Liu; and analyzed by Huamin Liu. The manuscript was composed by Jiaan Liu, Huamin Liu and Kuo Huang, and revised by Huamin Liu.

Conflicts of Interest

The authors declare no conflict of interest.

References

  1. Ashby, M.F.; Gibson, L. Cellular Solids: Structure and Properties, 2nd ed.; Cambridge University Press: Cambridge, UK, 1997. [Google Scholar]
  2. Banhart, J. Manufacture, characterisation and application of cellular metals and metal foams. Prog. Mater. Sci. 2001, 46, 559–632. [Google Scholar] [CrossRef]
  3. Stanev, L.; Kolev, M.; Drenchev, B.; Drenchev, L. Open-cell metallic porous materials obtained through space holders-part II: Structure and properties. A review. J. Manuf. Sci. Eng. 2017, 139, 050802. [Google Scholar] [CrossRef]
  4. Degischer, H.P.; Brigitte, K. Handbook of Cellular Metals, 1st ed.; WILEY-VCH-Verlag: Weinheim, Germany, 2002. [Google Scholar]
  5. García-Moreno, F. Commercial applications of metal foams: Their properties and production. Materials 2016, 9, 85. [Google Scholar] [CrossRef] [PubMed]
  6. Aly, M.S. Behavior of closed cell aluminium foams upon compressive testing at elevated temperatures: Experimental results. Mater. Lett. 2007, 61, 3138–3141. [Google Scholar] [CrossRef]
  7. Wang, P.; Xu, S.; Li, Z.; Yang, J.; Zheng, H.; Hu, S. Temperature effects on the mechanical behavior of aluminum foam under dynamic loading. Mater. Sci. Eng. A 2014, 599, 174–179. [Google Scholar] [CrossRef]
  8. Liu, J.; Qu, Q.; Liu, Y.; Li, R.; Liu, B. Compressive properties of Al-Si-SiC composite foams at elevated temperatures. J. Alloys Compd. 2016, 676, 239–244. [Google Scholar] [CrossRef]
  9. Duarte, I.; Ferreira, J. Composite and nanocomposite metal foams. Materials 2016, 9, 79. [Google Scholar] [CrossRef] [PubMed]
  10. Orbulov, I.N. Compressive properties of aluminium matrix syntactic foams. Mater. Sci. Eng. A 2012, 555, 52–56. [Google Scholar] [CrossRef]
  11. Goel, M.D.; Peroni, M.; Solomos, G.; Mondal, D.P.; Matsagar, V.A.; Gupta, A.K. Dynamic compression behavior of cenosphere aluminum alloy syntactic foam. Mater. Des. 2012, 42, 418–423. [Google Scholar] [CrossRef]
  12. Dunleavy, C.S.; Curran, J.A.; Clyne, T.W. Plasma electrolytic oxidation of aluminium networks to form a metal-cored ceramic composite hybrid material. Compos. Sci. Technol. 2011, 71, 908–915. [Google Scholar] [CrossRef]
  13. Abdulla, T.; Yerokhin, A.; Goodall, R. Enhancement in specific strength of open cell aluminium foams through plasma electrolytic oxidation treatment. Scr. Mater. 2014, 75, 38–41. [Google Scholar] [CrossRef]
  14. Abdulla, T.; Yerokhin, A.; Goodall, R. Effect of plasma electrolytic oxidation coating on the specific strength of open-cell aluminium foams. Mater. Des. 2011, 32, 3742–3749. [Google Scholar] [CrossRef]
  15. Liu, J.; Zhu, X.; Huang, Z.; Yu, S.; Yang, X. Characterization and property of microarc oxidation coatings on open-cell aluminum foams. J. Coat. Technol. Res. 2011, 9, 357–363. [Google Scholar] [CrossRef]
  16. Sun, Y.; Burgueño, R.; Wang, W.; Lee, I. Effect of annealing on the mechanical properties of nano-copper reinforced open-cell aluminum foams. Mater. Sci. Eng. A 2014, 613, 340–351. [Google Scholar] [CrossRef]
  17. Antenucci, A.; Guarino, S.; Tagliaferri, V.; Ucciardello, N. Improvement of the mechanical and thermal characteristics of open cell aluminum foams by the electrodeposition of Cu. Mater. Des. 2014, 59, 124–129. [Google Scholar] [CrossRef]
  18. Liu, J.; Gao, F.; Rao, Y.; Wu, C.; Liu, Y. Compressive properties of aluminum foams produced by replication route using spheroidal calcium chloride as space holder. Mater. Trans. 2014, 55, 1906–1908. [Google Scholar] [CrossRef]
  19. Chen, X.; Zhang, N.; Sun, K. Facile ammonia-induced fabrication of nanoporous NiO films with enhanced lithium-storage properties. Electrochem. Commun. 2012, 20, 137–140. [Google Scholar] [CrossRef]
  20. Duarte, I.; Vesenjak, M.; Krstulović-Opara, L. Variation of quasi-static and dynamic compressive properties in a single aluminium foam block. Mater. Sci. Eng. A 2014, 616, 171–182. [Google Scholar] [CrossRef]
  21. Sundararajan, G.; Krishna, L.R. Mechanisms underlying the formation of thick alumina coatings through the MAO coating technology. Surf. Coat. Technol. 2003, 167, 269–277. [Google Scholar] [CrossRef]
  22. Khan, R.H.U.; Yerokhin, A.; Li, X.; Dong, H.; Matthews, A. Surface characterisation of DC plasma electrolytic oxidation treated 6082 aluminium alloy: Effect of current density and electrolyte concentration. Surf. Coat. Technol. 2010, 205, 1679–1688. [Google Scholar] [CrossRef]
  23. Liu, J.; Si, F.; Zhu, X.; Liu, Y.; Zhang, J.; Liu, Y. Compressive properties of open-cell Al hybrid foams at different temperatures. Materials 2017, 10, 98. [Google Scholar] [CrossRef] [PubMed]
Figure 1. Image of Al foams: (a) before and (b) after PEO treatment.
Metals 08 00118 g001
Figure 2. SEM (scanning electron microscopy) images of the surface of the PEO coating.
Metals 08 00118 g002
Figure 3. SEM images of the cross section of the PEO coating.
Metals 08 00118 g003
Figure 4. The element distribution of the cross section of the PEO coating.
Metals 08 00118 g004
Figure 5. The element distribution of the PEO coating surface.
Metals 08 00118 g005aMetals 08 00118 g005b
Figure 6. XRD pattern of the Al foams substrate and PEO coating.
Metals 08 00118 g006
Figure 7. Compressive properties of the Al foams and composite foams at room temperature: (a) compressive curves; (b) energy absorption.
Metals 08 00118 g007
Figure 8. Compressive properties of composite foams at different temperatures: (a) stress–strain curves, (b) energy absorption capacity–strain curves.
Metals 08 00118 g008
Figure 9. The compressive properties of as-received Al foams and composite foams at different temperatures: (a) compressive strength and energy absorption capacities at a strain of (b) 0.5 and (c) 0.6.
Metals 08 00118 g009
Figure 10. The macroscopic compressive deformation of the composite foams at a strain of (a) 0, (b) ~0.2, (c) ~0.3.
Metals 08 00118 g010aMetals 08 00118 g010b
Figure 11. SEM image of the deformation of a foam strut: (a) and magnification (bd) and its EDS analysis (e,f) at room temperature.
Metals 08 00118 g011aMetals 08 00118 g011b
Figure 12. SEM image of the fracture of a foam strut: (a), and magnification (bd) at room temperature.
Metals 08 00118 g012
Figure 13. SEM image of the deformation of a foam strut: (a), and magnification (b) at 200 °C.
Metals 08 00118 g013

