Article

Characterization of Porous Phosphate Coatings Enriched with Magnesium or Zinc on CP Titanium Grade 2 under DC Plasma Electrolytic Oxidation

1
Division of BioEngineering and Surface Electrochemistry, Department of Engineering and Informatics Systems, Faculty of Mechanical Engineering, Koszalin University of Technology, Racławicka 15-17, PL 75-620 Koszalin, Poland
2
HORIBA Société par Actions Simplifiée (S.A.S.), Avenue de la Vauve-Passage Jobin Yvon, 91120 Palaiseau, France
3
Department of Physics, Norwegian University of Science and Technology (NTNU), Realfagbygget E3-124 Høgskoleringen 5, NO 7491 Trondheim, Norway
4
Faculty of Engineering, Hochschule Wismar-University of Applied Sciences Technology, Business and Design, DE 23966 Wismar, Germany
5
Centro de Quimica Estrutural (CQE), Instituto Superior Técnico, University of Lisbon, Av. Rovisco Pais, P 1049-001 Lisboa, Portugal
*
Author to whom correspondence should be addressed.
Metals 2018, 8(2), 112; https://doi.org/10.3390/met8020112
Submission received: 27 December 2017 / Revised: 26 January 2018 / Accepted: 1 February 2018 / Published: 6 February 2018
(This article belongs to the Special Issue Plasma Electrolytic Oxidation)

Abstract

:
The aim of the paper is to study and determine the effect of voltage increasing from 500 up to 650 VDC on chemical and electrochemical properties of the obtained porous coatings with plasma electrolytic oxidation (PEO) processes, known also as micro arc oxidation (MAO). In the present paper, the chemical and electrochemical characterization of porous phosphate coatings enriched with magnesium or zinc on commercially pure (CP) Titanium Grade 2 under DC-PEO obtained in electrolytes based on concentrated 85% analytically pure H3PO4 (98 g/mole) acid with additions of 500 g·L−1 of zinc nitrate Zn(NO3)2∙6H2O or magnesium nitrate Mg(NO3)2∙6H2O, are described. These materials were characterized using scanning electron microscope (SEM) with energy-dispersive X-ray spectroscopy (EDS), X-ray photoelectron spectroscopy (XPS) and glow discharge optical emission spectroscopy (GDOES). It was found that the voltage of PEO process has influence on the chemical composition and thickness of the obtained porous coatings as well as on their electrochemical behavior. The higher the potential of PEO treatment, the higher the amount of zinc-to-phosphorus ratio for zinc enriched coatings was obtained, whereas in magnesium enriched coatings, the average amount of magnesium detected in PEO coating is approximately independent of the PEO voltages. Based on XPS studies, it was found out that most likely the top 10 nm of porous coatings is constructed of titanium (Ti4+), magnesium (Mg2+), zinc (Zn2+), and phosphates PO43 and/or HPO42− and/or H2PO4 and/or P2O74−. On the basis of GDOES studies, a four-sub-layer model of PEO coatings is proposed. Analysis of the potentiodynamic corrosion curves allowed to conclude that the best electrochemical repeatability was noted for magnesium and zinc enriched coatings obtained at 575 VDC.

1. Introduction

Electrochemical treatments, such as electropolishing [1,2,3] and plasma electrolytic oxidation (micro arc oxidation) [4,5,6] may be used for preparing nano- and micro-layers, respectively. In case of standard electropolishing (EP) [7,8,9,10], magnetoelectropolishing (MEP) [9,10,11,12,13,14,15,16] and high-current density electropolishing (HDEP) [17,18,19,20] it is possible to obtain passive layers with different chemical compositions [20,21,22,23,24,25,26] as well as hydrogenation [27,28,29], which affect the corrosion behavior [30,31] and mechanical [32,33] properties of the treated workpieces. To obtain the porous micro-coatings on titanium [34,35,36,37] and its alloys [38,39,40,41,42,43,44], plasma electrolytic oxidation (PEO) should be used. It is worth noting that the obtained porous coatings may contain elements originating from the electrolytes, which lead to a bone-like structure (phosphorus and calcium) [45,46,47] and show antibacterial properties (copper and zinc) [48,49,50,51,52,53,54] with simultaneous high corrosion resistance. It should be also pointed out that the addition of magnesium accelerates wound healing, what in case of biomaterials is very important. Additionally, it may be noted that the chemical composition [36,37,41,51] of PEO coatings as well as their porosity [42,52] which simply undergo the description by roughness parameters [55,56], may be expected.
The aim of the paper is to determine the effect of DC voltage and PEO processing time on the creation of porous coatings enriched with magnesium or zinc on CP Titanium Grade 2. Electrolytes based on concentrated 85% analytically pure H3PO4 (98 g/mole) acid, containing zinc nitrate Zn(NO3)2∙6H2O or magnesium nitrate Mg(NO3)2∙6H2O, were used in the study.

2. Method

Plasma electrolytic oxidation (micro arc oxidation) process was used to treat CP Titanium Grade 2 samples with dimensions 10 mm × 10 mm × 2 mm. The plasma electrolytic oxidation (PEO) was performed at the voltages of 500, 575 and 650 VDC by using the commercial DC power supply PWR 1600H (KIKUSUI Electronics Corporation International, Yokohama, Kanagawa, Japan), 0-650V/0-8A. The electrolyte consisted of a concentrated 85% analytically pure H3PO4 (98 g/mole) acid, with 500 g·L−1 of zinc nitrate Zn(NO3)2∙6H2O or magnesium nitrate Mg(NO3)2∙6H2O.
A scanning electron microscope Quanta 250 FEI with Low Vacuum and ESEM mode (Field Electron and Iron Company, Hillsboro, OR, USA) and a field emission cathode as well as an energy dispersive EDS system in a Noran System Six with nitrogen-free silicon drift detector (EDS, Silicon Drift Detectors: Keith Thompson, Thermo Fisher Scientific, Madison, WI, USA), were used.
X-ray photoelectron spectroscopy (XPS) measurements on studied sample surfaces were performed by means of SCIENCE SES 2002 instrument (SCIENTA AB, ScientaOmicron, Uppsala, Sweden) using a monochromatic (Gammadata-Scienta) Al K(alpha) ( = 1486.6 eV) X-ray source (18.7 mA, 13.02 kV). Scan analyses were carried out with an analysis area of 1 mm × 3 mm and a pass energy of 500 eV with the energy step 0.2 eV and step time 200 ms. The binding energy of the spectrometer was calibrated by the position of the Fermi level on a clean metallic sample. The power supplies were stable and of high accuracy. The experiments were carried out in an ultra-high vacuum system (SCIENTA AB, ScientaOmicron, Uppsala, Sweden) with a base pressure of about 6 × 10⁻⁸ Pa. The XPS spectra were recorded in normal emission. For the XPS analyses, the CasaXPS 2.3.14 software (Casa Software Ltd., Teignmouth, Devon, UK) (Shirley background type, D. A. Shirley, Lawrence Berkeley National Laboratory, University of California, Berkeley, CA, USA) [57], with the help of XPS tables [58], was used. All the binding energy values presented in this paper were charge corrected to C 1s at 284.8 eV.
Glow discharge optical emission spectroscopy (GDOES) measurements on PEO oxidized titanium samples were performed using a Horiba Scientific GD Profiler 2 instrument (HORIBA Scientific, Palaiseau, France). A radio frequency (RF) pulsed source was used to generate plasma under the following conditions: pressure: 700 Pa, power: 40 W, frequency: 3000 Hz, duty cycle: 0.25, anode diameter: 4 mm. The signals of magnesium (285 nm), zinc (481 nm), phosphorus (178 nm), oxygen (130 nm), nitrogen (149 nm), hydrogen (122 nm), and titanium (365 nm) were simultaneously measured [59,60,61].
Linear polarization measurements were carried out in Ringer’s solution, which contains sodium chloride (8.69 g/L), potassium chloride (0.3 g/L), calcium chloride (0.48 g/L), through a Gamry Femtostat potentiostat using a 3-electrode configuration with a saturated calomel electrode (SCE) as reference electrode and platinum wire as counter electrode. Before polarization, the samples were immersed for 1 h in the electrolyte (OCP). Linear polarization was performed with 1 mV/s scan rate and the starting potential was set up for every sample as 100 mV lower than the OCP potential, while the ending potential was set up for 2000 mV (vs. SCE). One has to add that minimum 15 repeats were performed for each EDS experiment; one depth profile was performed for GDOES, and three corrosion measurements were done for each statistical plan.

3. Results and Discussion

In Figure 1, current vs. voltage curves of CP Titanium Grade 2 after PEO treatment in 500 g Mg(NO3)2 or 500 g Zn (NO3)2 in 1000 mL H3PO4 electrolyte, are shown. The current density peaks in the voltage range from 0 till 200 V should be interpreted as plasma inflammation in solution. Above a voltage of about 200 V the stabilization of current densities at about 50 A/dm2 is observed. This means that all the PEO treatments were carried out under the same current density conditions. The limiting values of voltage for the different PEO tests were defined: the lower voltage limit (500 VDC) corresponds to the minimum current density for which it is possible to obtain a porous coating in the two solutions, whereas the upper voltage limit (650 VDC) is due to the hardware limitation, i.e., the stabilized power supply.
In Figure 2 and Figure 3, the SEM micrographs of porous coatings formed on CP Titanium Grade 2 after PEO treatment at voltages of 500, 575, 650 VDC in electrolytes containing 500 g·L−1 of magnesium nitrate hexahydrate Mg(NO3)2∙6H2O or 500 g·L−1 of zinc nitrate hexahydrate Zn (NO3)2∙6H2O in concentrated phosphoric acid H3PO4, are presented. Based on EDS data recorded at a magnification of 500 times, the Zn/P ratios were found for the samples treated in the Zn-rich electrolyte. They were equal to 0.12 ± 0.01 (median: 0.12, range: 0.02), 0.16 ± 0.02 (median: 0.16, range: 0.06), 0.20 ± 0.01 (median: 0.20, range: 0.03) for 500, 575 and 650 VDC, respectively. For the coatings obtained in the electrolyte containing magnesium nitrate hexahydrate, the Mg/P ratios were equal to 0.16 ± 0.01 (median: 0.16, range: 0.02), 0.16 ± 0.01 (median: 0.16, range: 0.02), 0.17 ± 0.01 (median: 0.17, range: 0.04) for 500, 575, and 650 VDC, respectively.
In Figure 4, the Zn/P and Mg/P ratios based on EDS results for coatings formed on titanium after PEO treatment at voltages 500, 575, and 650 VDC in electrolytes containing 500 g·L−1 of zinc nitrate hexahydrate Zn(NO3)2∙6H2O and 500 g·L−1 of magnesium nitrate hexahydrate Mg(NO3)2∙6H2O in concentrated H3PO4, are shown, lying in the ranges of 0.12–0.20 and 0.16–0.17, respectively.
Based on these results, one can conclude that the Zn/P ratio increases linearly as a function of the amount of zinc nitrate, which on the other hand is not observed for the solution containing magnesium nitrate, where the average value of Mg/P ratio is approximately constant. In addition, it should be noted that the standard deviation of Mg/P ratio is approximately two times as high as that of the Zn/P ratio, which may indicate that in the case of phosphate coatings enriched with zinc, the repeatability of the PEO coating composition is greater than that for coatings enriched with magnesium.
In Figure 5a, the XPS spectrum of a coating formed on CP Titanium Grade 2 after PEO treatment for 3 min in the zinc-rich phosphoric acid electrolyte at a voltage of 575 VDC, is presented. The obtained XPS results of PEO coatings clearly show that the 10 nm top layer is enriched in zinc consisting of Zn2+, as well as titanium—as Ti4+, phosphorus as PO43−, or HPO42−, or H2PO4, or P2O74−, which was confirmed by the binding energies of 1022.4 eV (Zn 2p3/2), 499.8 eV (Zn LMM), 460.8 eV (Ti 2p3/2), 531.8 eV (O 1s), and 134.2 eV (P2p), respectively.
In Figure 5b, the XPS spectrum of a coating formed on CP Titanium Grade 2 after PEO treatment for 3 min in the magnesium-rich phosphoric acid electrolyte at a voltage of 575 VDC, is shown. The binding energies of magnesium Mg 2s (89.4 eV), Mg KLL (306.8 eV), and titanium Ti2p3/2 (460.2 eV) most likely may be interpreted as Mg2+ and Ti4+, respectively. In addition, it should be noted that in PEO coatings enriched in magnesium, the binding energies of phosphorus P2p (134.1 eV), and oxygen O 1s (531.6 eV) may suggest the presence of PO43−, HPO42−, H2PO4, and P2O74− ions in the obtained porous coatings, which is very similar to the case of coatings enriched in zinc.
In Figure 6 and Figure 7, the GDOES signals, with their derivatives, of zinc or magnesium, phosphorus, oxygen, hydrogen, carbon, nitrogen, titanium of porous coating formed on CP Titanium Grade 2 after PEO treatment at voltages of 500, 575, and 650 VDC in both electrolytes, are presented. Four sub-layers may be distinguished in each obtained coating, i.e., the first one very porous and organically contaminated, the second one and third one, semi-porous, which have different thicknesses, dependent on magnesium or zinc nitrate tetrahydrate amount in the electrolyte, and the fourth sub-layer is a transition one. To understand the influence of voltage on each sub-layer, authors propose describing them by mathematical equations. The regions were designated on the basis of GDOES signals and their first and second derivatives. The derivatives allowed us to determine mainly the beginning and the end of sub-layer intervals, where the rate of change of individual signals underwent significant changes. The thicknesses of the first top porous sub-layers of all the obtained PEO coatings enriched in magnesium or zinc are linear functions of PEO voltage U and may be described by the following mathematical models: I = 2.67∙U − 1143 (R2 = 0.992) and I = U − 141.6 (R2 = 0.964), respectively. In both cases, they are growing functions, i.e., the minimum top and porous sub-layer thickness was obtained at 500 VDC, and the maximum one, at 650 VDC. It should be also noted that the magnesium enriched coating in the first top sub-layer is depleted in magnesium, whereas the other one is enriched in zinc. The thicknesses of the second sub-layers for two examined coatings also have growing trends due to the PEO voltages. However, the biggest thickness of that second sub-layer was found for coatings created at 500 VDC, i.e., about 450 s of sputtering time, while for other voltages, i.e., 575 and 650 VDC the differences did not exceed 80 s of sputtering time. Most important is the fact that the magnesium enriched coating reaches its global maximum in that layer, while in case of zinc enriched coating, the maximum was found in the top first sub-layer. In the third sub-layers, the signals of magnesium and zinc revealed a decrease. For the magnesium spectrum, the lowest thickness (at 200 s of sputtering time) was recorded for coating formed at 500 VDC, while for the other voltages, i.e., 575 and 650 VDC, the thinnest ones were equal to about 800 s of sputtering time, which may be described by a power function 0.006∙U1.83 (R2 = 0.781) or a linear one of 2∙U − 450 (R2 = 0.75). In case of zinc enriched coating, the trend of coating thickness versus voltage U may be also considered as a power function, i.e., 3 × 10⁻¹¹∙U4.73 (R2 = 0.944) or a linear trend, i.e., 3.33∙U − 1516 (R2 = 0.892). The last transition sub-layer, which contains the limit of porosity which is visible as a peak on the hydrogen spectrum, that is halfway of the slope of titanium, for two tested coatings may be described by one 2.33∙U − 641.6 (R2 = 0.875).
In Figure 8, the potentiodynamic corrosion curves of the porous coating formed on CP Titanium Grade 2 after PEO treatment at voltages of 500 (red lines), 575 (blue lines), and 650 VDC (green lines), in (a) magnesium-rich, or (b) zinc-rich electrolytes, are presented. The electrochemical properties of coatings containing magnesium and/or zinc and/or titanium phosphates may be characterized by the passive current densities measured at 1400 mV. The minimum passive current density was recorded for coatings enriched with magnesium obtained at 500 VDC (mean: 2.3 × 10⁻⁷; median: 1.6 × 10⁻⁷; range: 4.4 × 10⁻⁷), while the maximum one (mean: 9.2 × 10⁻⁷; median: 1.1 × 10⁻⁶; range: 8.0 × 10⁻⁷), was at 650 VDC. That linear trend of mean of passive current densities i vs. PEO voltages U may be described by the following function: i = 5 × 10⁻⁹∙U – 2 × 10⁻⁶ (R2 = 0.98). It should be also noted that the smallest passive current density range (max–min) was found for magnesium enriched coatings obtained at 575 VDC, what may be interpreted as the best electrochemical repeatability.
The minimum passive current density was recorded for zinc-enriched coatings obtained at 575 VDC (mean: 2.9 × 10⁻⁷; median: 2.5 × 10⁻⁷; range: 5.6 × 10⁻⁷), while the maximum one (mean: 9.3 × 10⁻⁷; median: 3.8 × 10⁻⁶; range: 2.1 × 10⁻⁶), at 650 VDC. That linear trend of the mean of passive current densities i vs. PEO voltages U may be described by the following function: i = 4 × 10⁻⁹∙U − 2 × 10⁻⁶ (R2 = 0.66). It should be also noted that the smallest passive current density range was found for magnesium enriched coatings obtained at 575 VDC, which may be interpreted as the best electrochemical repeatability. However, it has to be pointed out that the values of passive current density averages and medians of zinc enriched PEO coatings are very similar. It may be concluded that the values of passive current densities may be correlated both with corrosion resistance as well as with charging of PEO coatings. In addition, an important fact is that the statistics were performed based only on three repetitions.

4. Conclusions

The studies of the effect of DC voltages increasing from 500 up to 650 VDC on creation of porous coatings enriched with magnesium or zinc on the CP Titanium Grade 2 allowed to formulating the following conclusions:
(1)
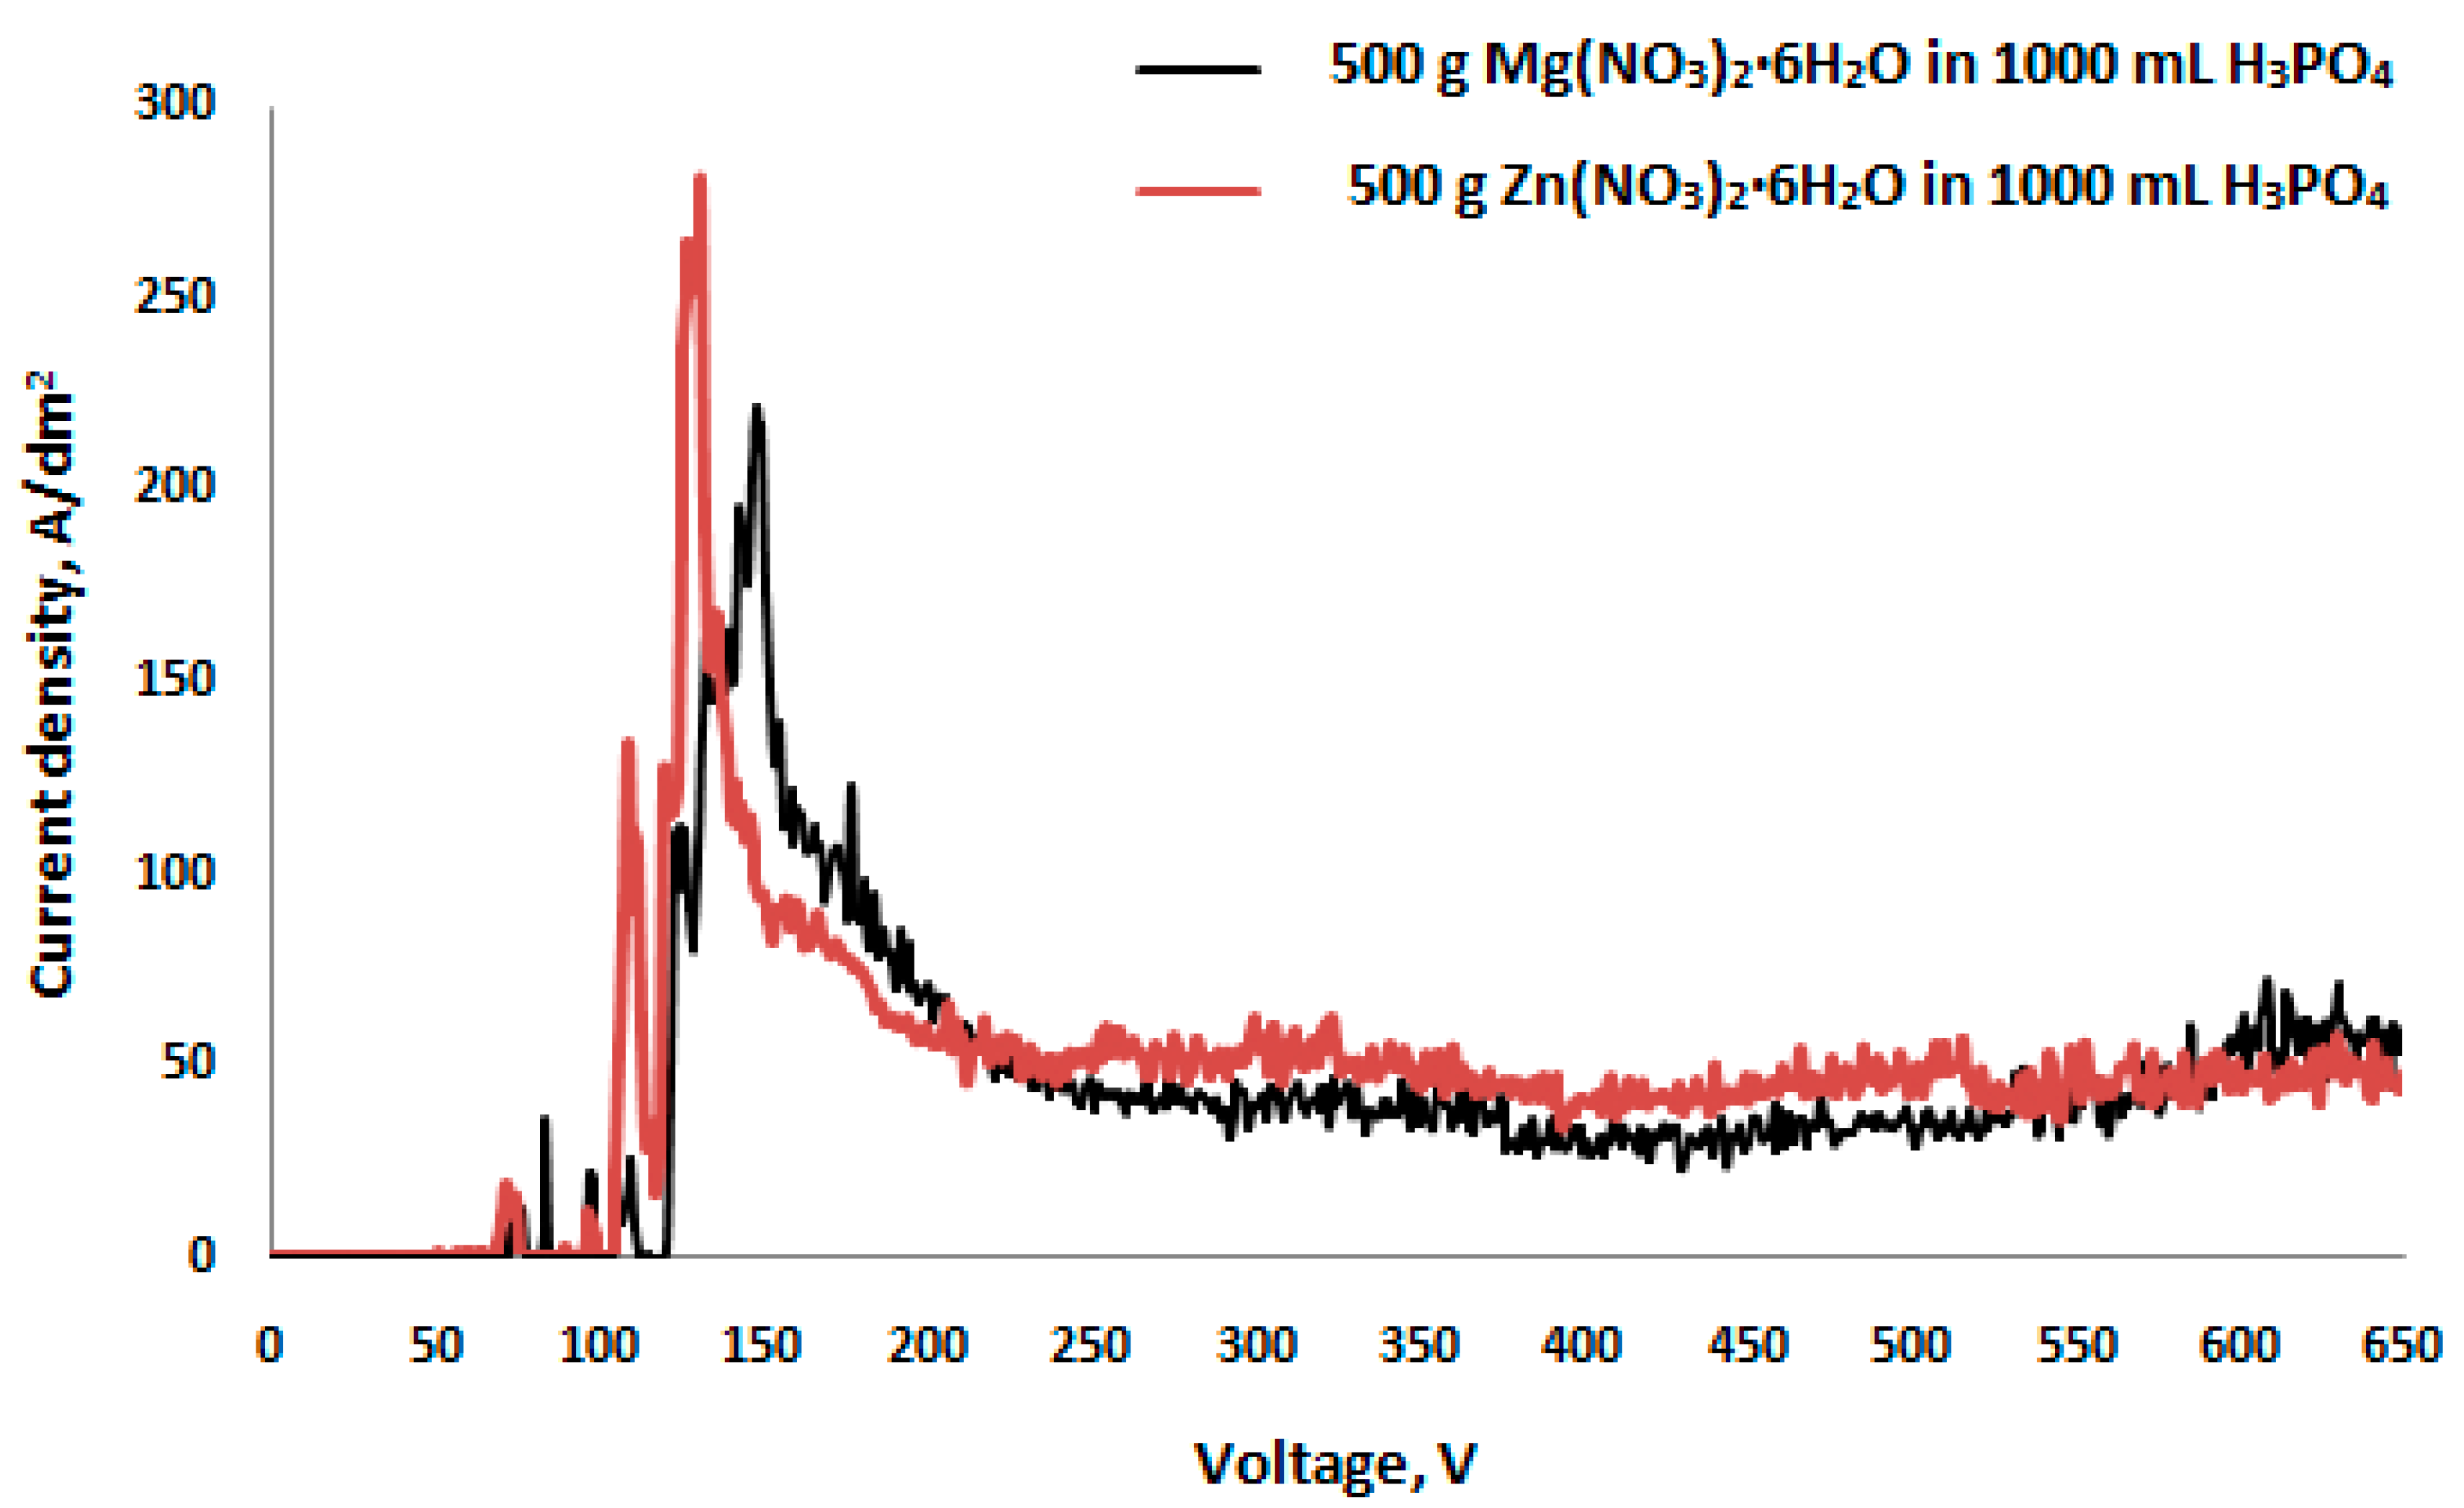
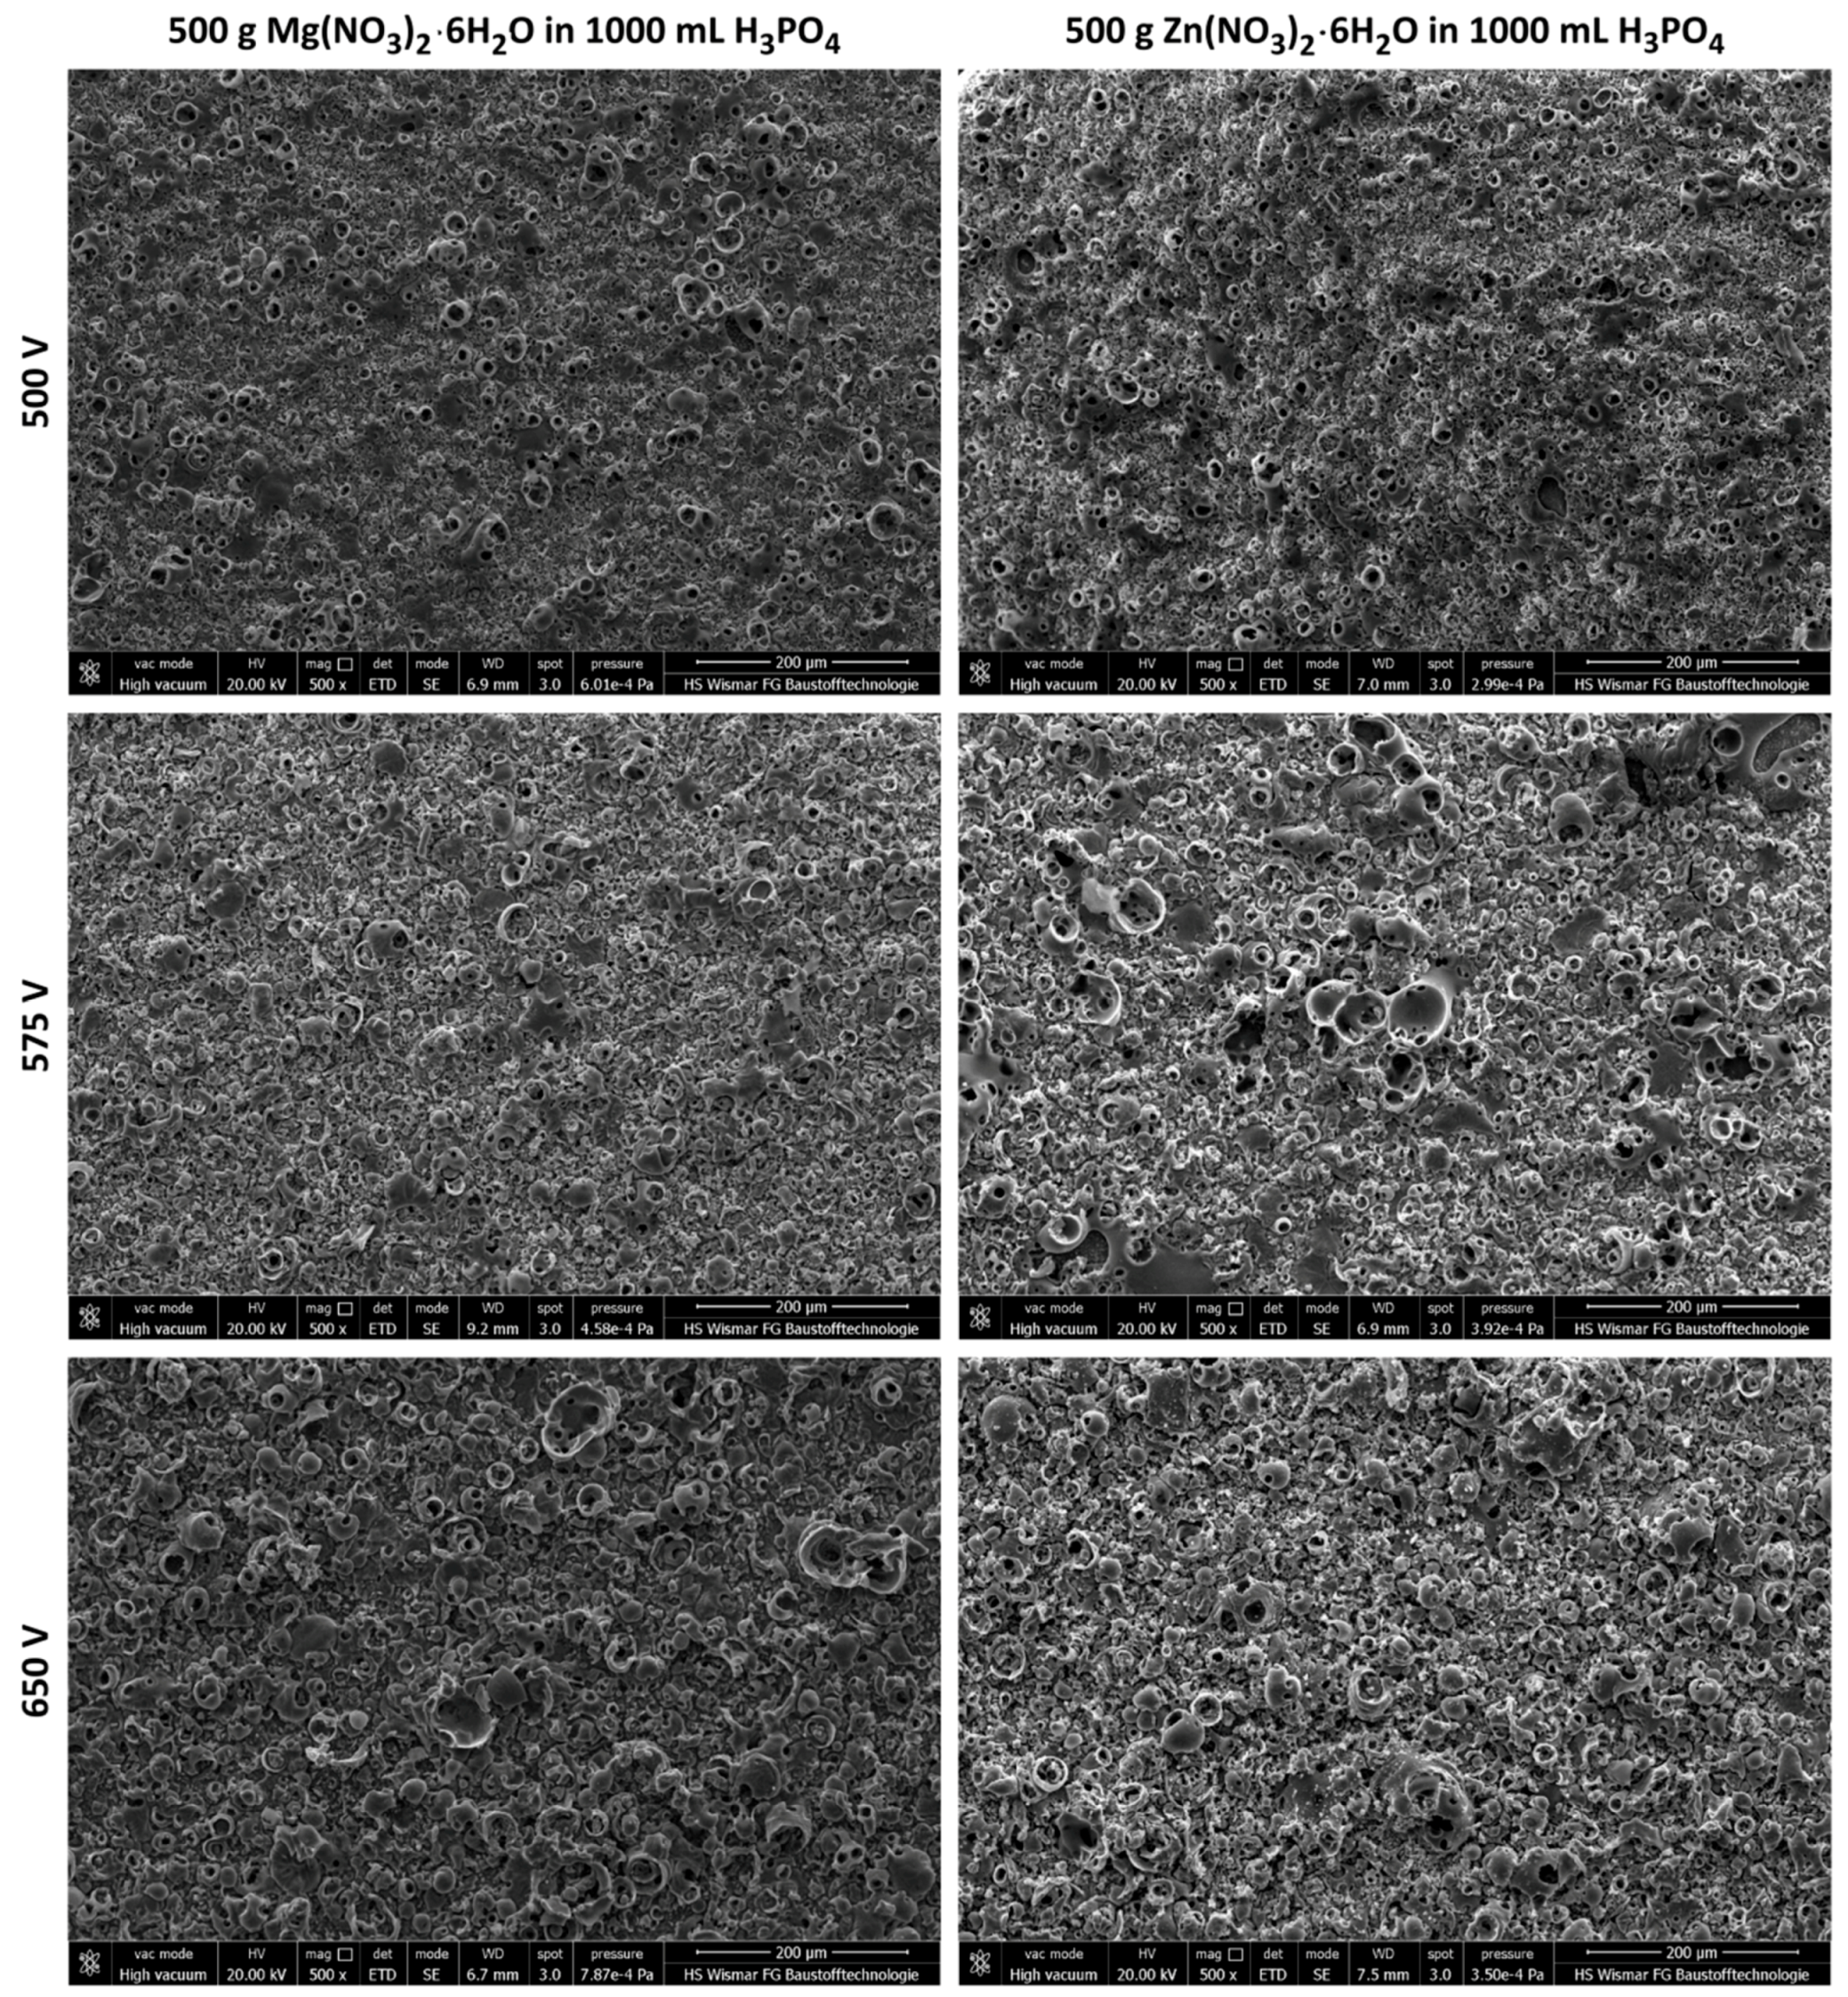
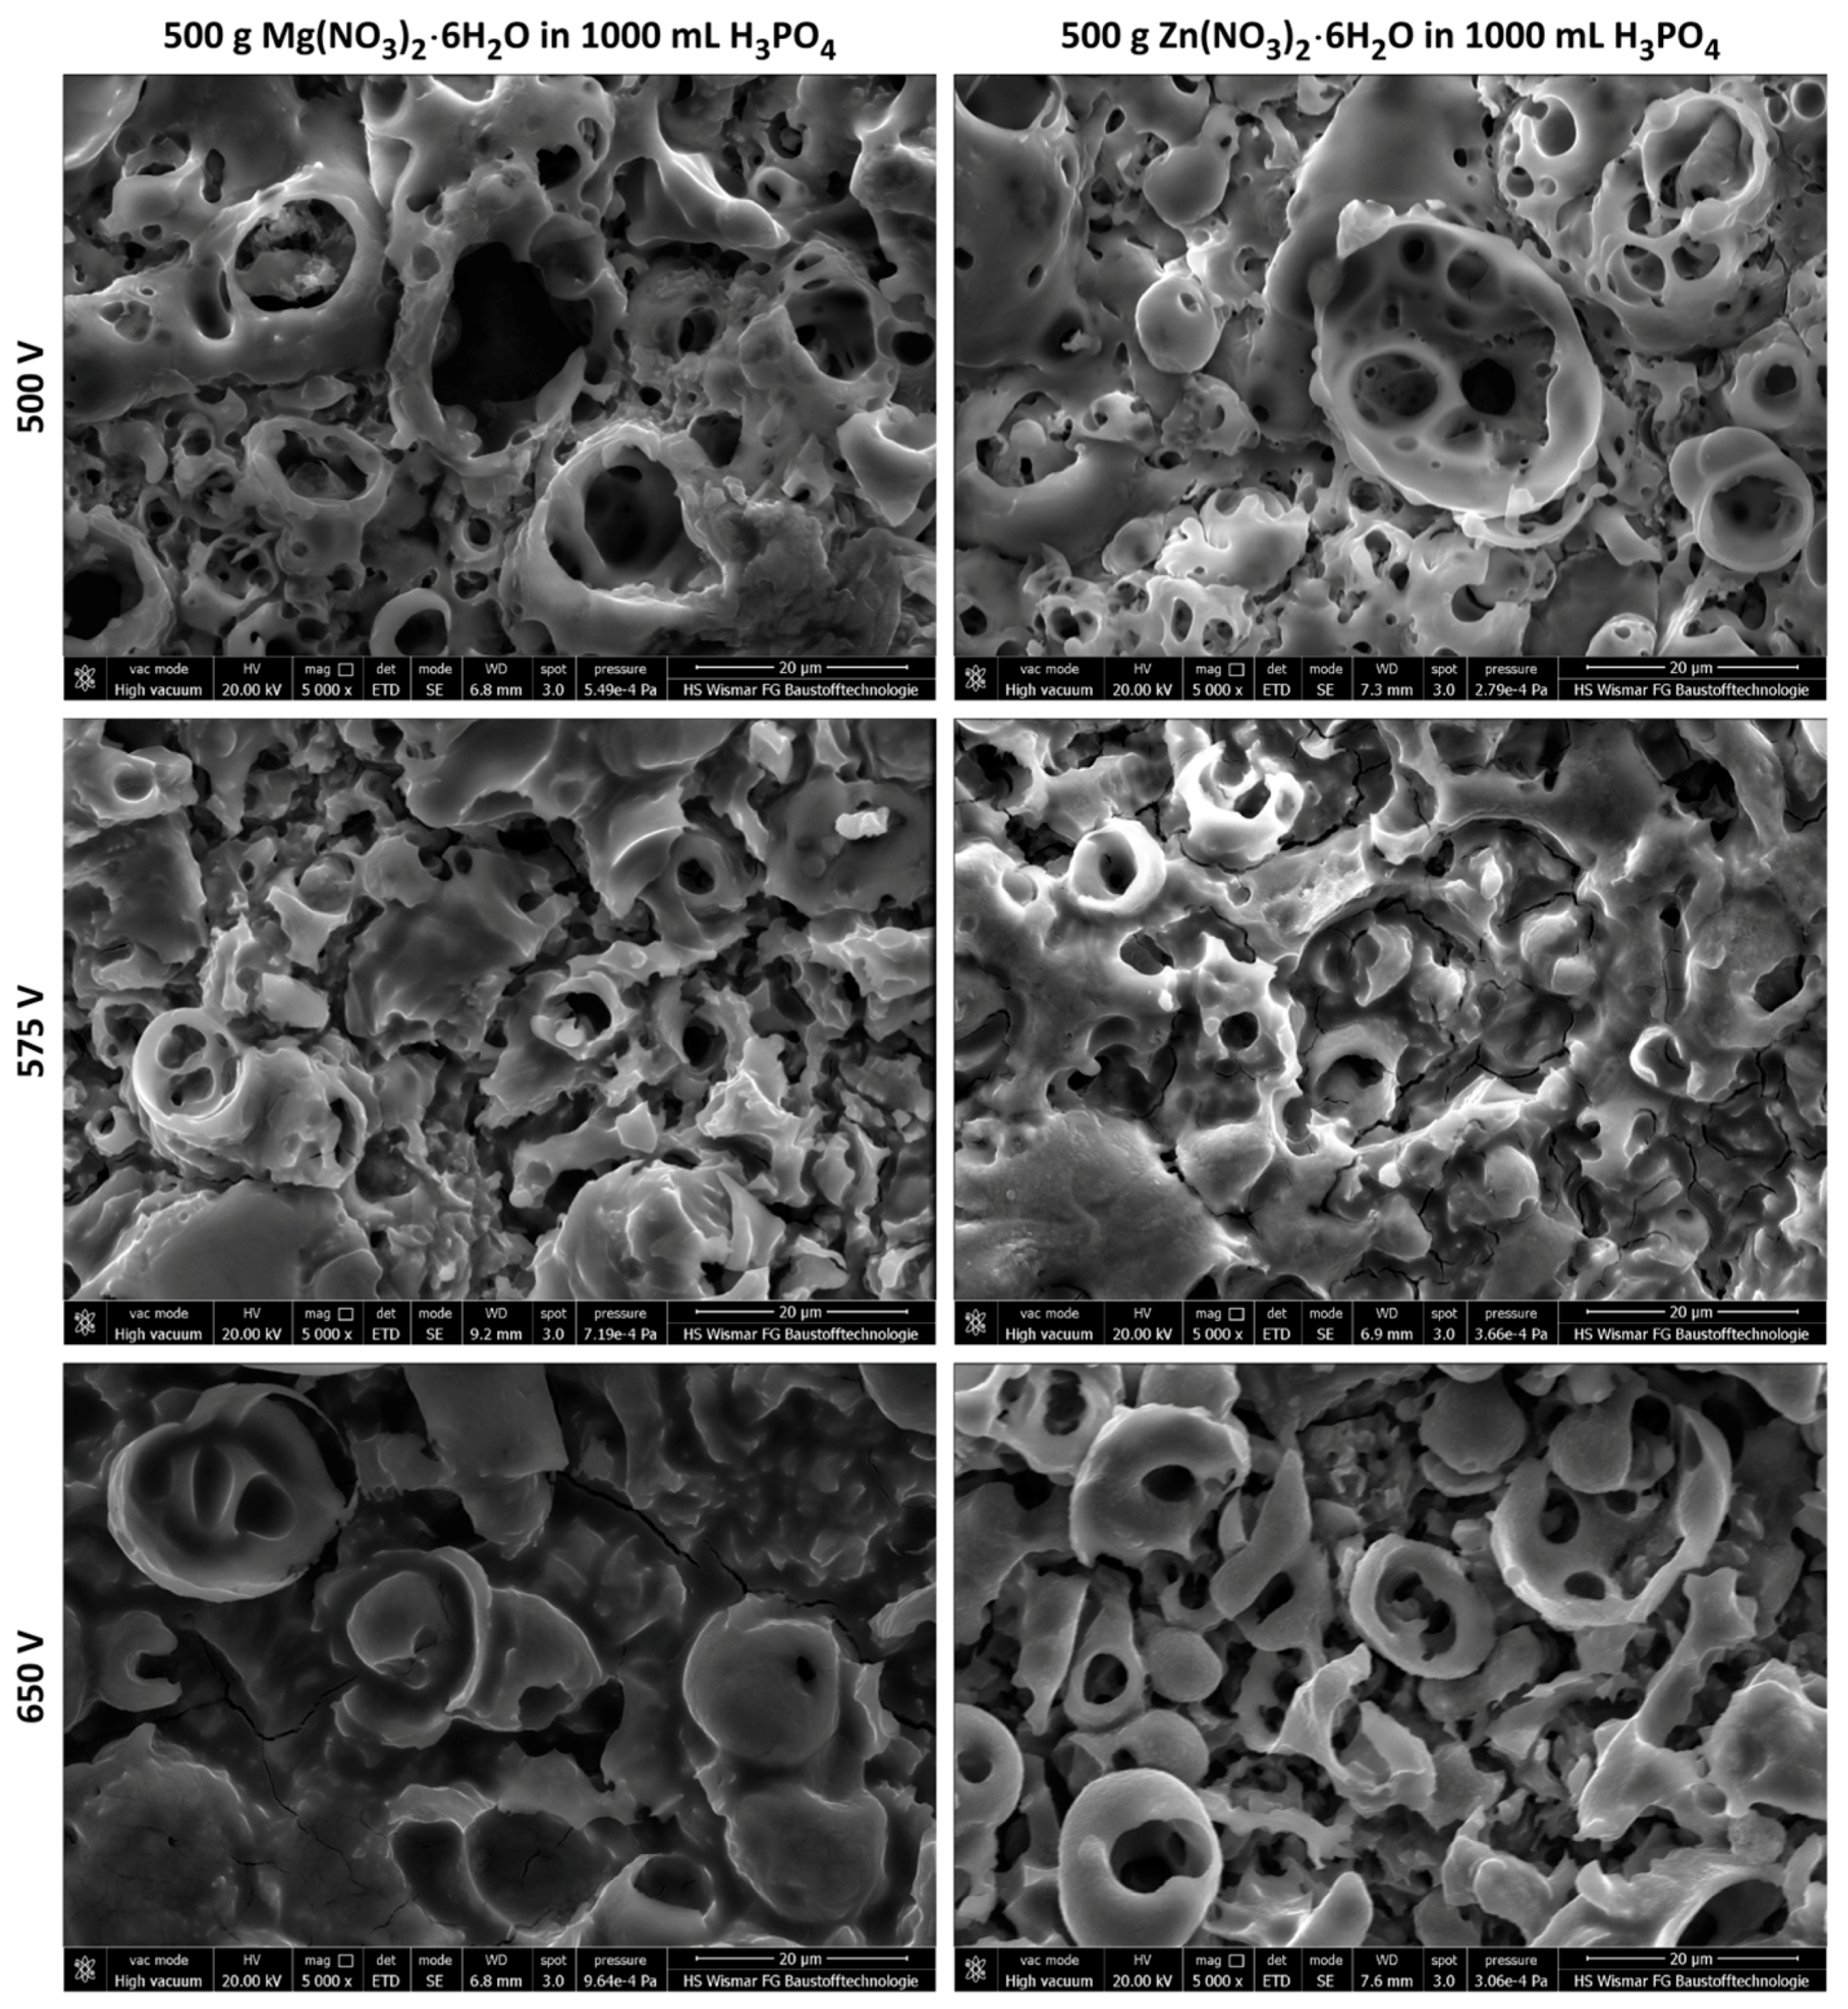
It is possible to form porous coatings by using of DC PEO oxidation in electrolytes containing concentrated phosphoric acid and magnesium or zinc nitrate.
(2)
The voltage of PEO process has an influence on the chemical composition and thickness of the obtained porous coatings as well as on their electrochemical behavior.
(3)
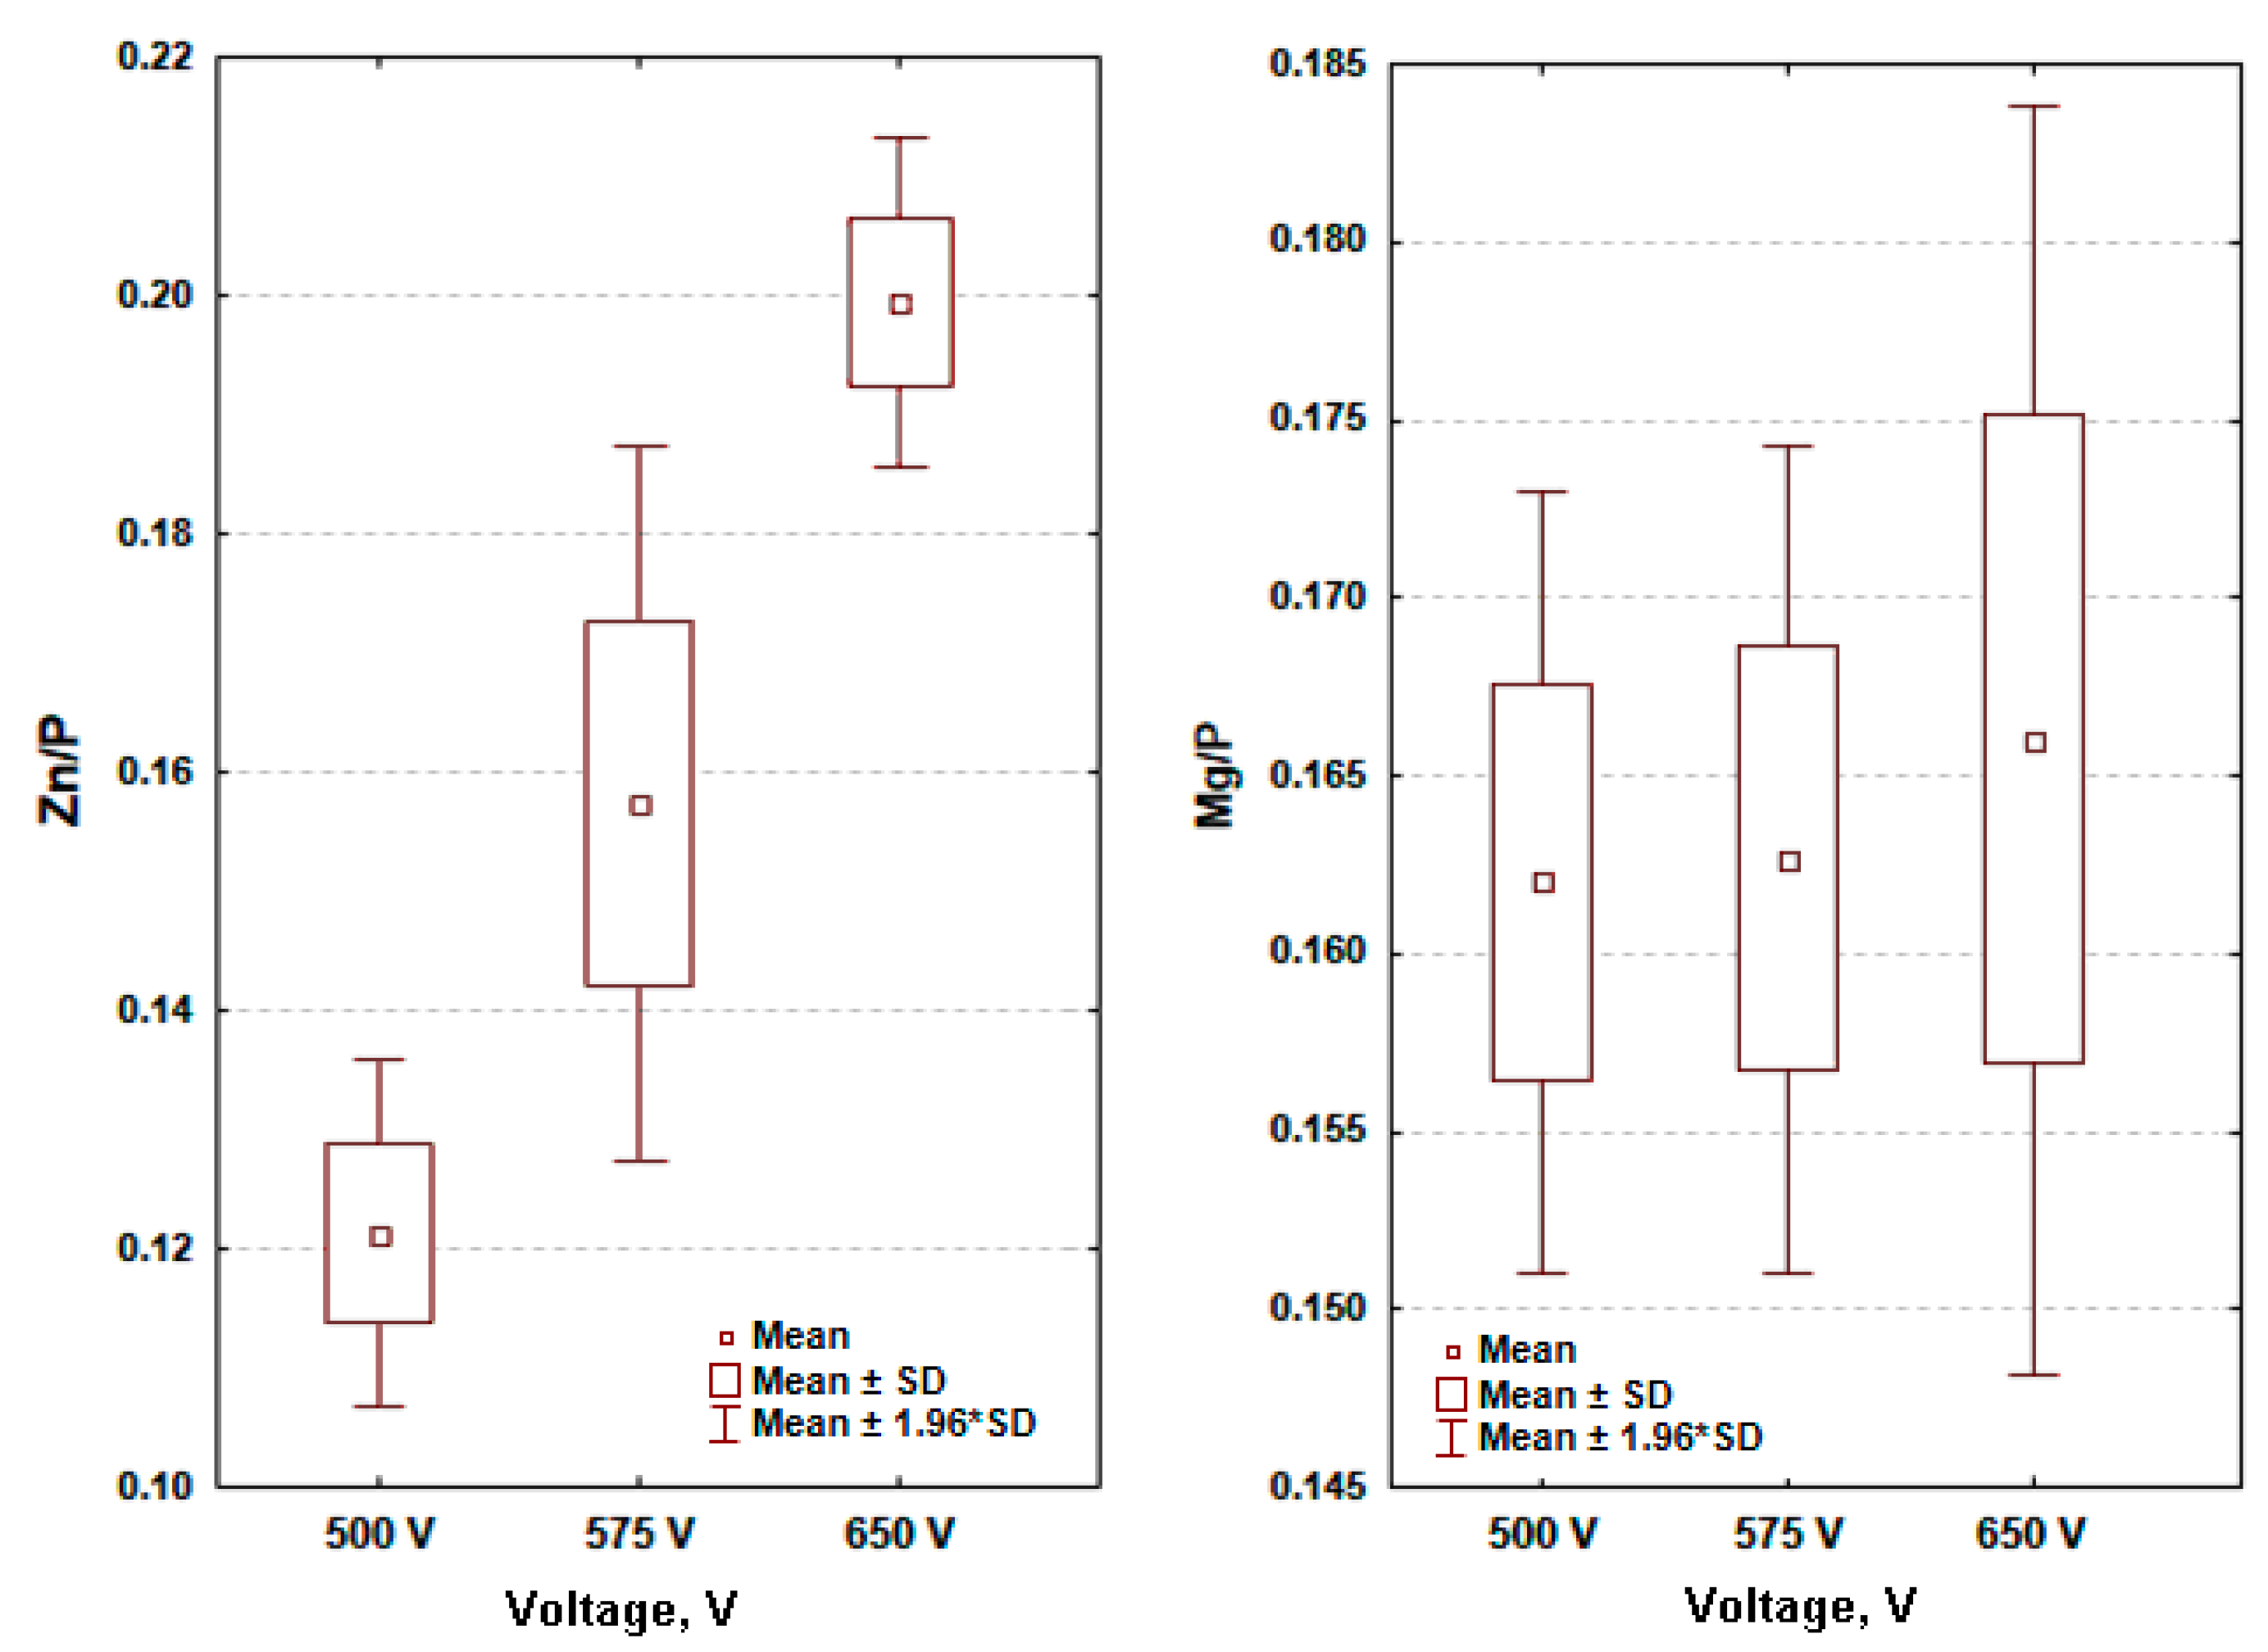
The higher the voltage of PEO treatment, the higher is zinc-to-phosphorus ratio for zinc enriched coatings; there is a trend for growing as a function of PEO voltage.
(4)
The higher the voltage of PEO treatment, the higher the range (max–min) of magnesium-to-phosphorus ratio with very similar averages for magnesium enriched coatings; the trend may be described as a constant function of PEO voltage.
(5)
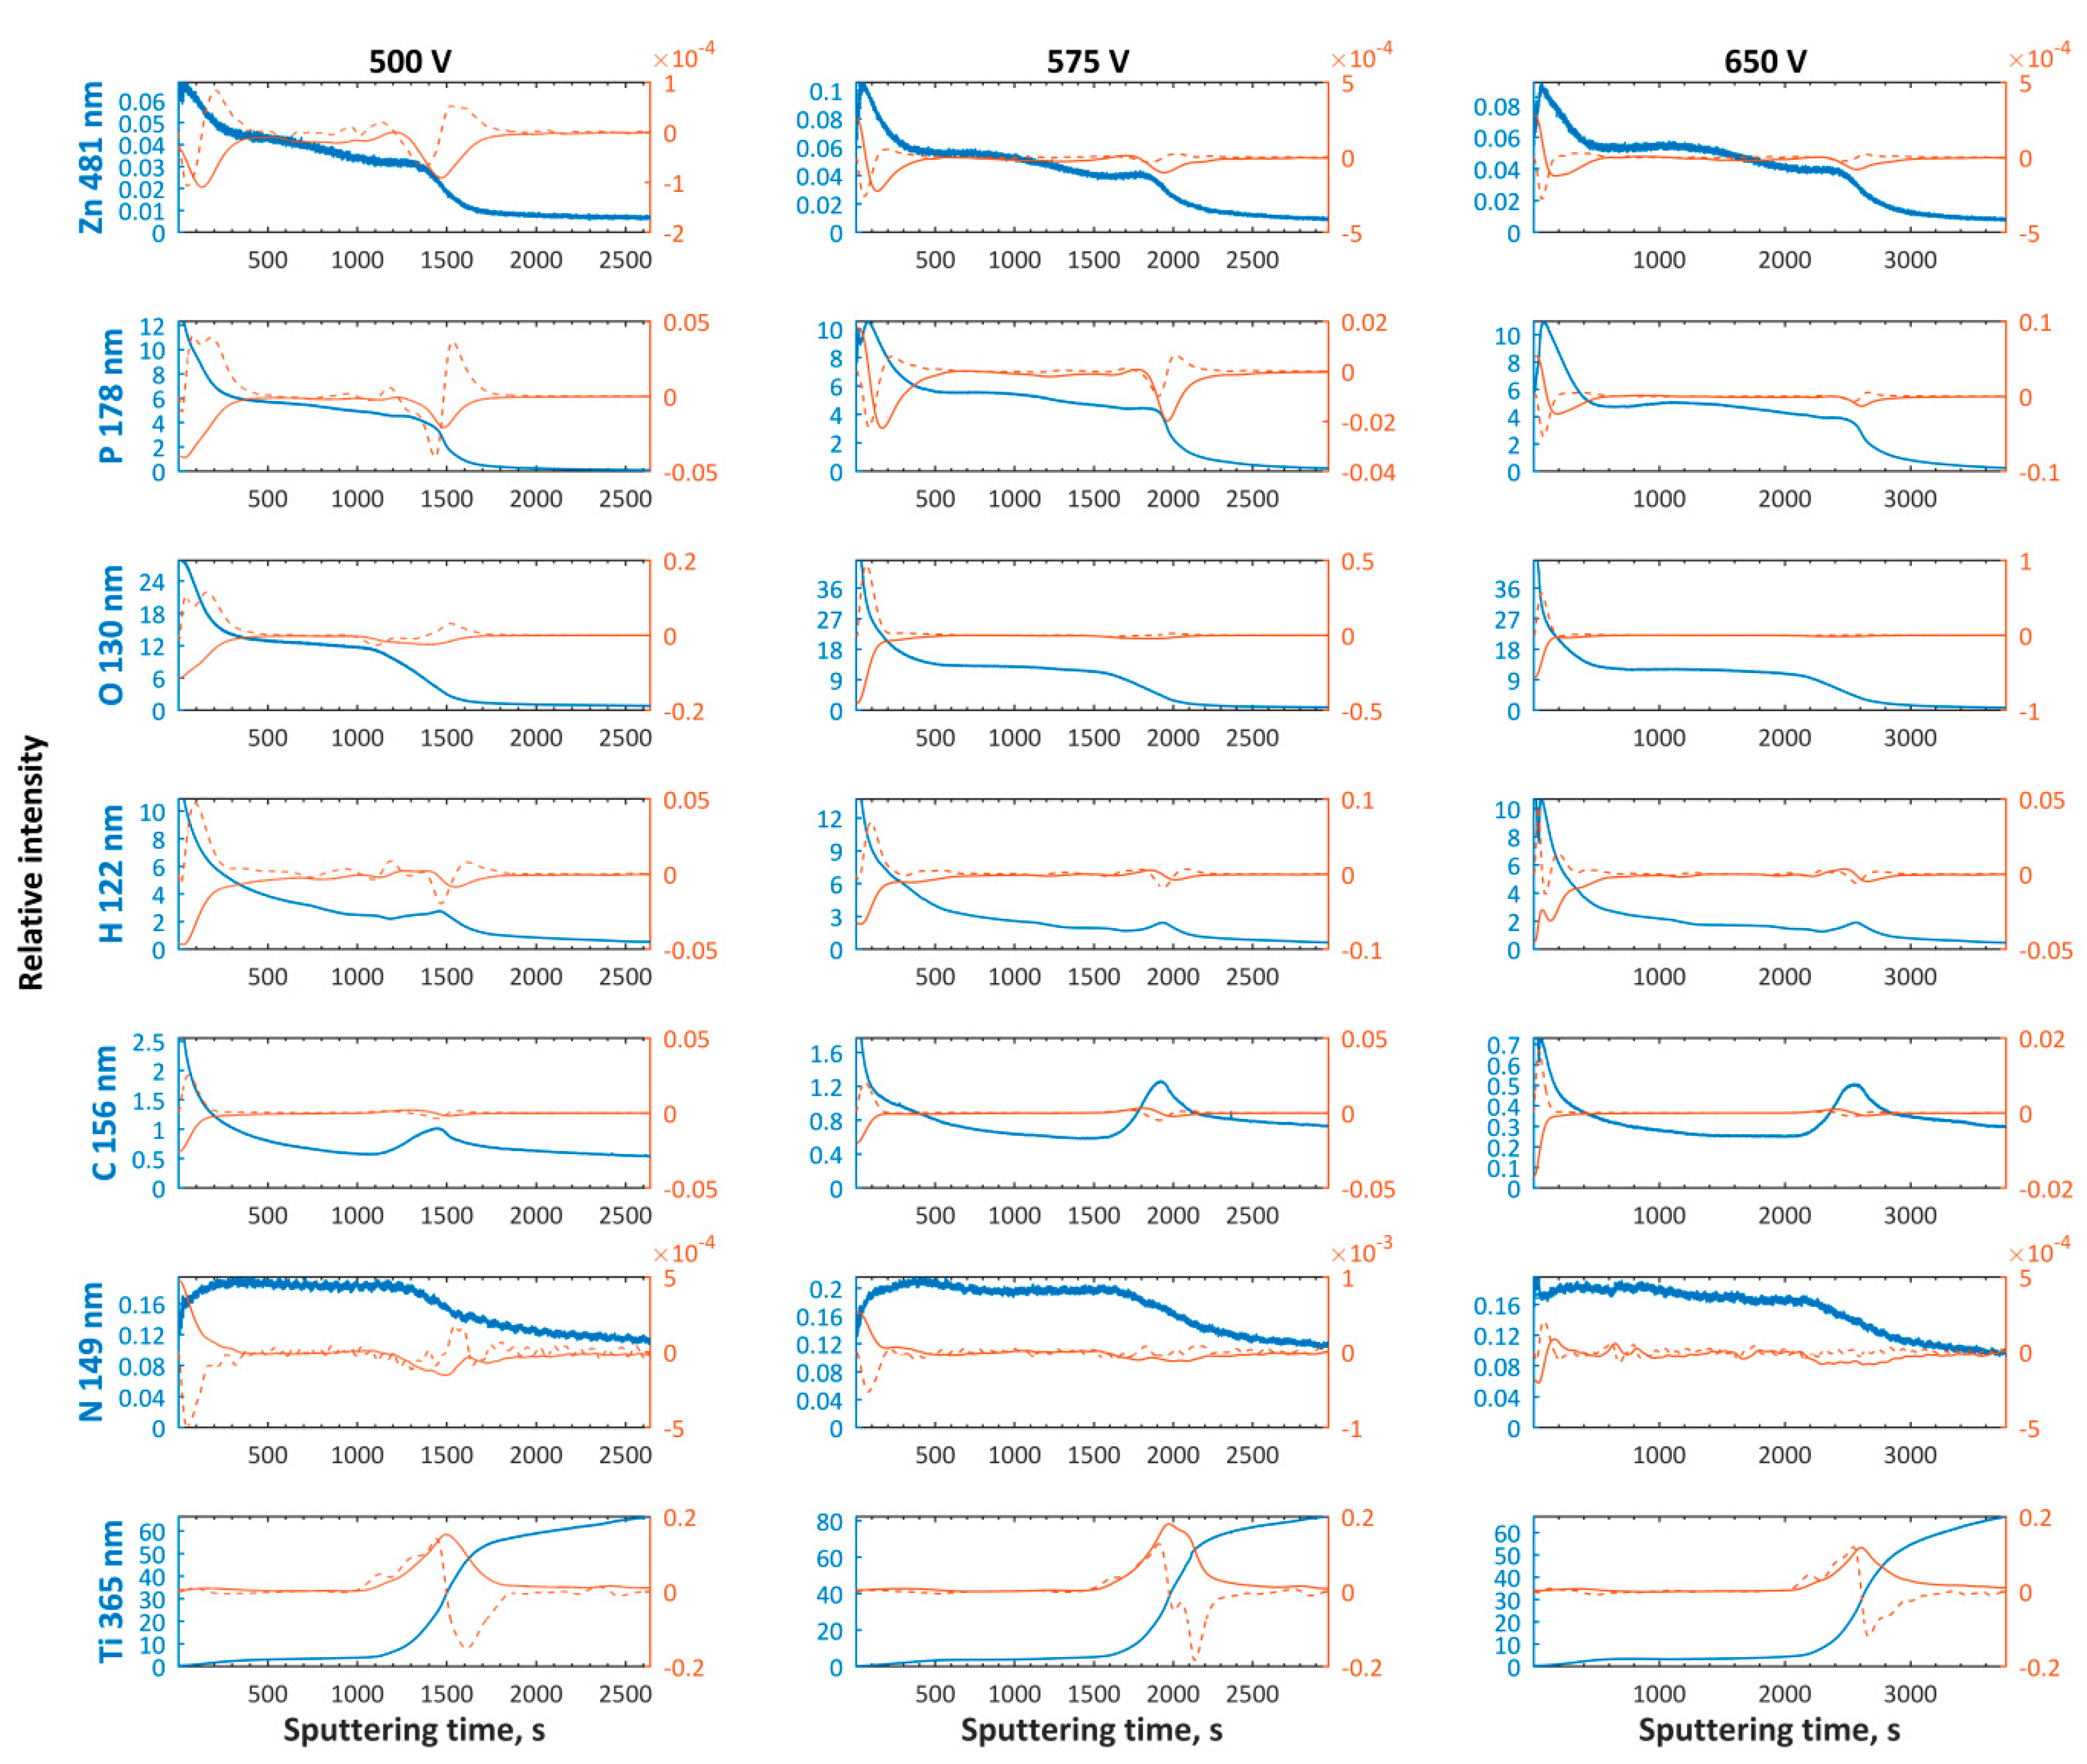
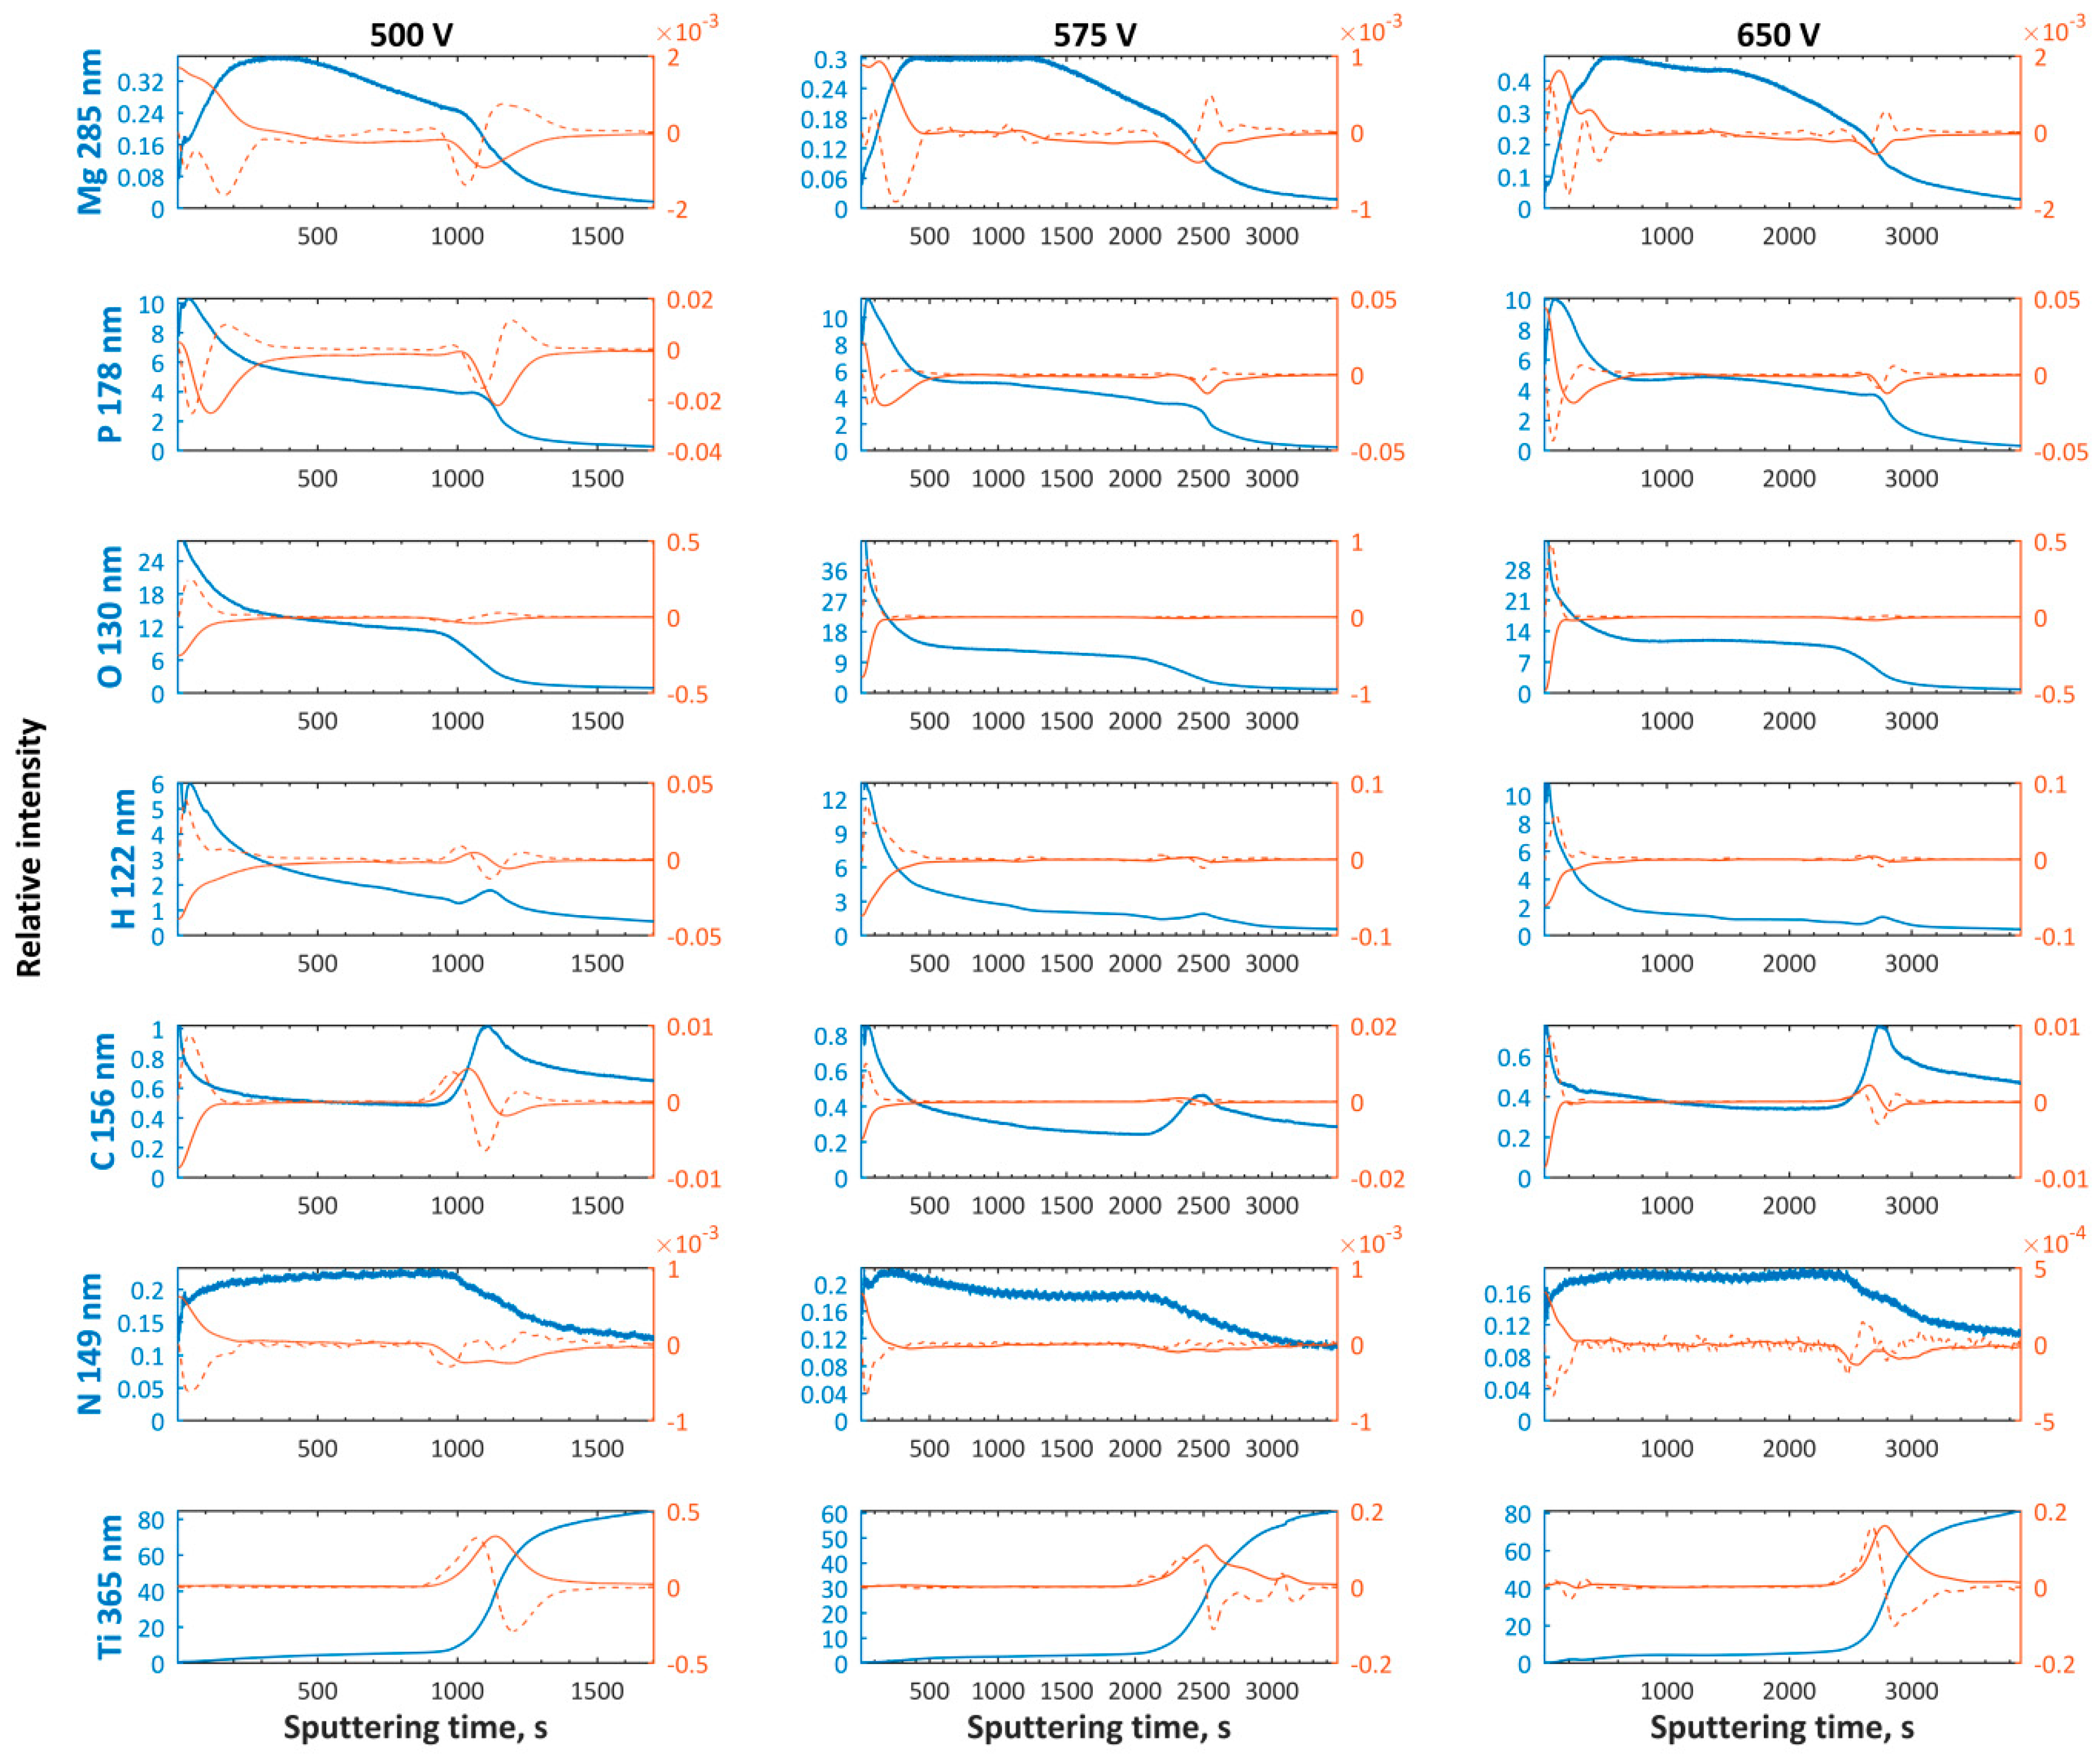
The four-sub-layer model may be assumed to describe the obtained PEO coatings:
(a)
The first and top sub-layers having a thickness corresponding with the sputtering time equaling to 200–600 s and 350–450 s for magnesium and zinc enriched PEO coatings, respectively;
(b)
The top sub-layer enriched with magnesium is depleted in magnesium compounds, while the other one, containing zinc in the top, is clearly enriched with zinc;
(c)
The thickness of semi-porous sub-layers depends on the PEO treatment voltage; the thickest second and third sub-layers appear to set up at high voltages and they decrease with PEO voltage decreasing;
(d)
The transition sub-layers have thickness corresponding to a sputtering time of about 500–900 s.
(6)
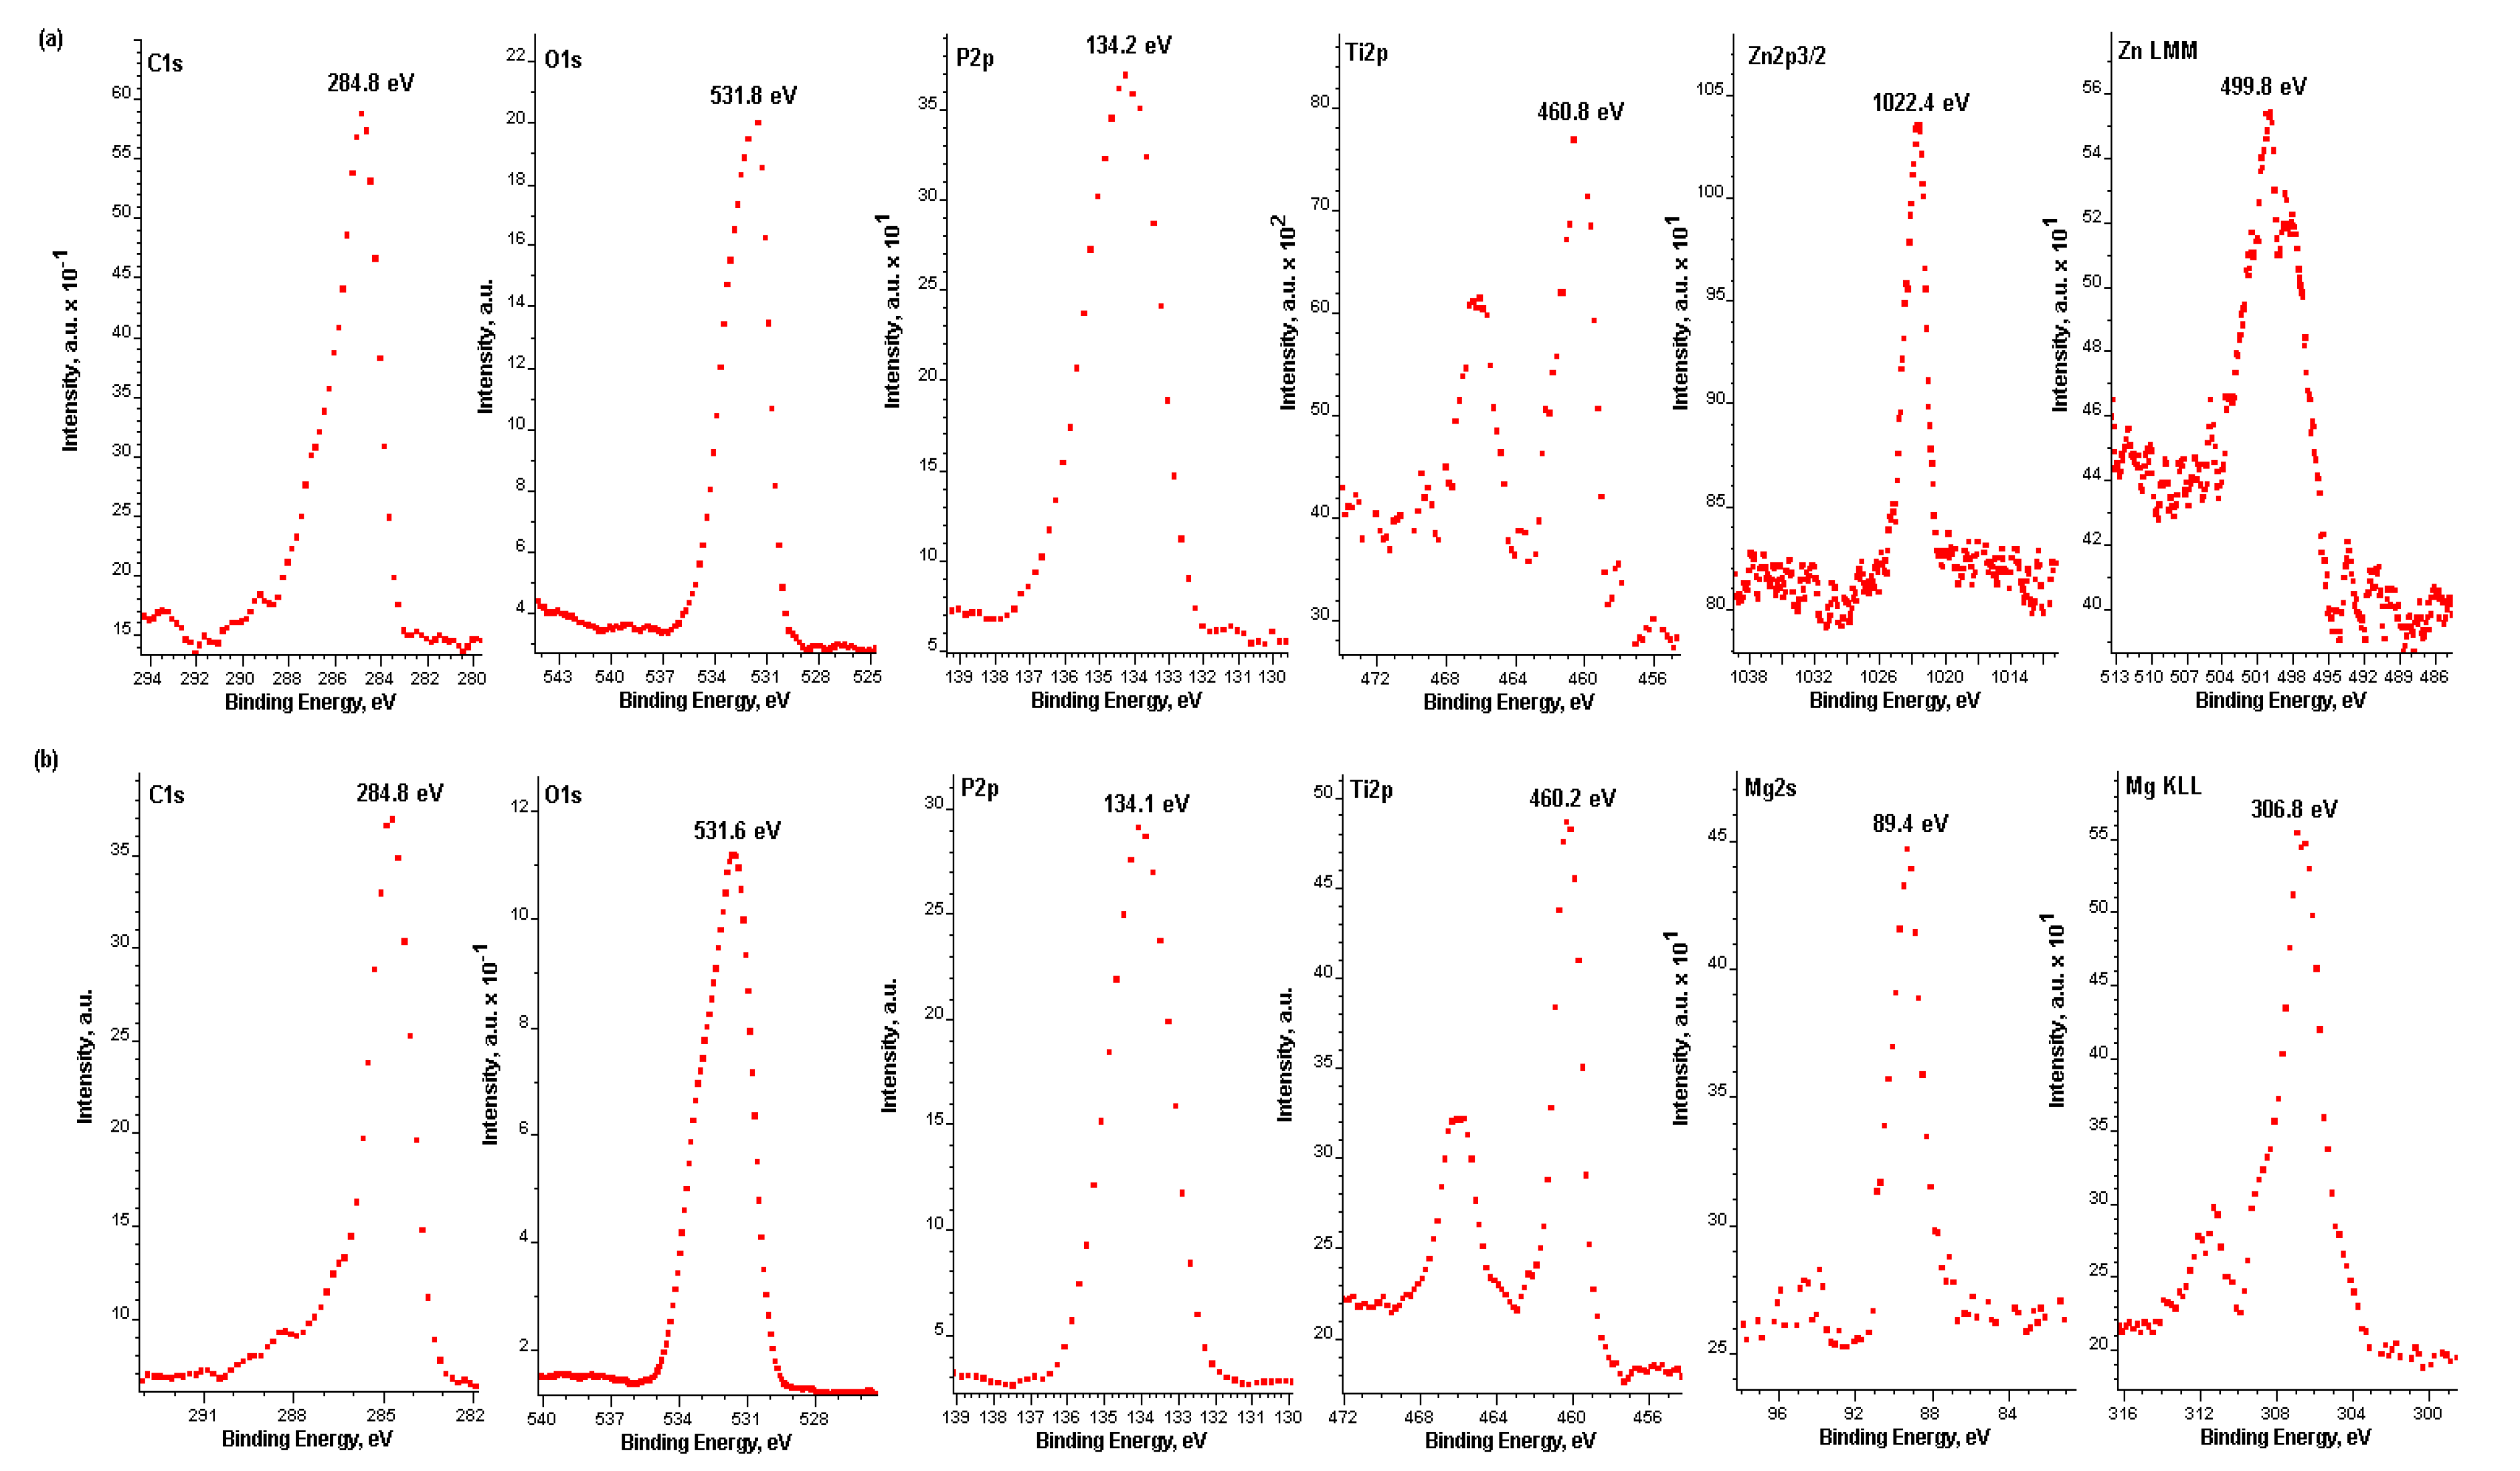
Most likely the top 10 nm of porous coatings is constituted of titanium (Ti4+), magnesium (Mg2+), zinc (Zn2+), and phosphates PO43−, and/or HPO42−, and/or H2PO4, and/or P2O74−.
(7)
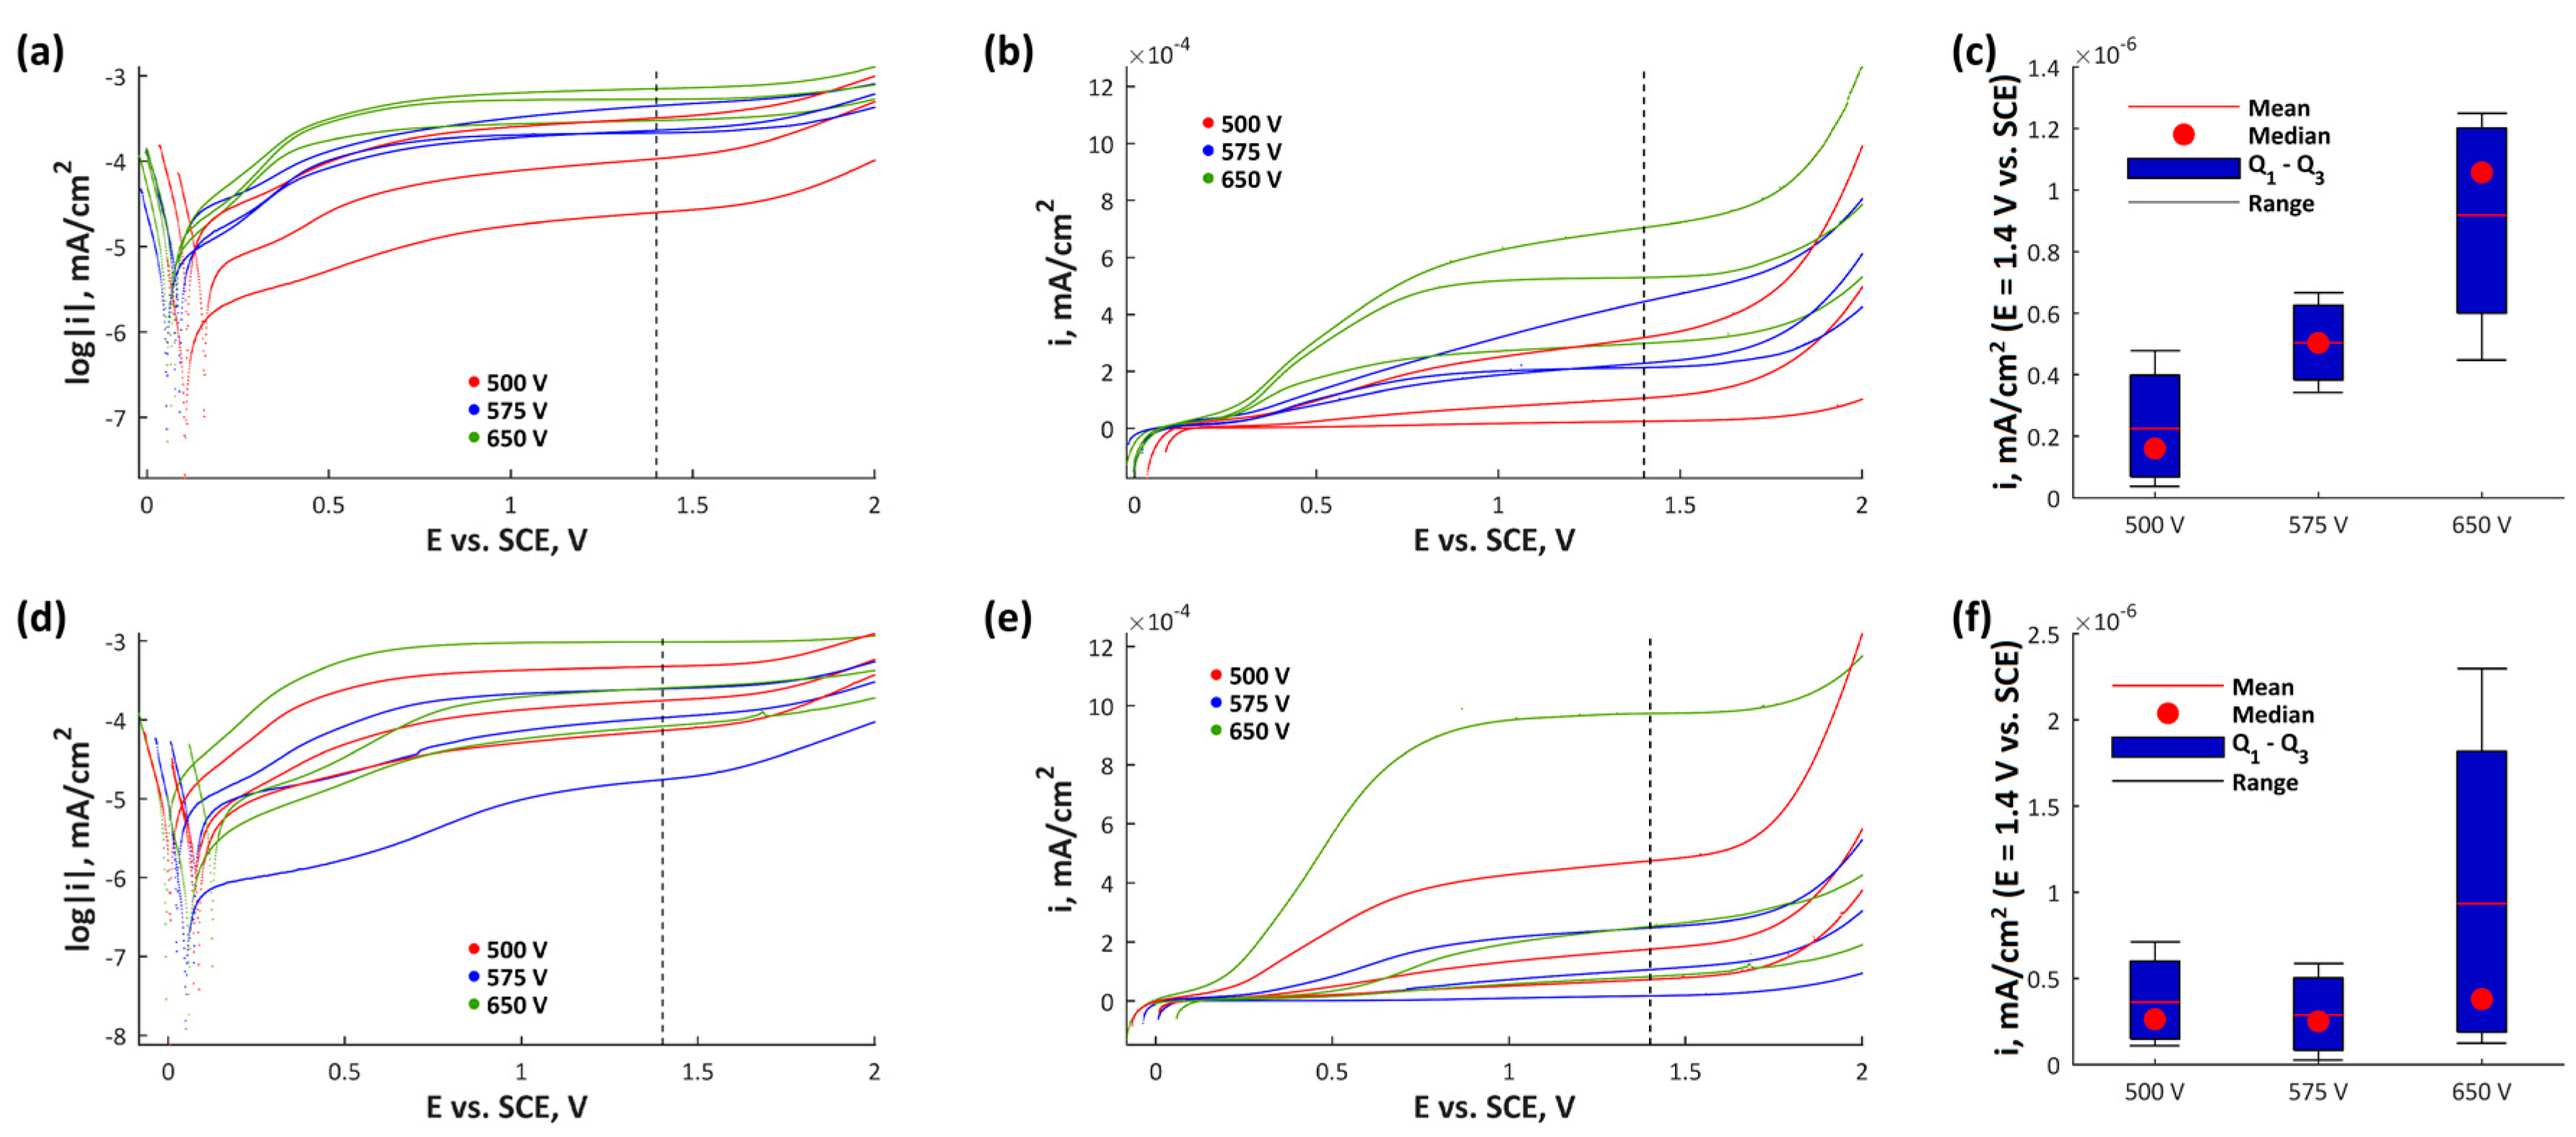
Based on the potentiodynamic corrosion measurements one may conclude that the best electrochemical repeatability was noted for magnesium and zinc enriched coatings obtained at 575 VDC.

Acknowledgments

This work was supported by a subsidzing by Grant OPUS 11 of National Science Centre, Poland, with registration number 2016/21/B/ST8/01952, titled “Development of models of new porous coatings obtained on titanium by Plasma Electrolytic Oxidation in electrolytes containing phosphoric acid with addition of calcium, magnesium, copper and zinc nitrates”. Centro de Quimica Estrutural (CQE) is financed by FCT under contract UID/QUI/00100/2013.

Author Contributions

Krzysztof Rokosz and Tadeusz Hryniewicz conceived and designed the experiments; Krzysztof Rokosz, Sofia Gaiaschi, Patrick Chapon, Steinar Raaen, and Winfried Malorny performed the experiments; Krzysztof Rokosz, Tadeusz Hryniewicz, João Salvador Fernandes, and Kornel Pietrzak analyzed the data; Krzysztof Rokosz, Tadeusz Hryniewicz, and Kornel Pietrzak contributed reagents, materials, analysis tools; Krzysztof Rokosz and Tadeusz Hryniewicz wrote the paper.

Conflicts of Interest

The authors declare no conflict of interest.

References

  1. Hryniewicz, T.; Hryniewicz, Z. On the solution of equation of diffusion in electropolishing. J. Electrochem. Soc. 1989, 136, 3767–3769. [Google Scholar] [CrossRef]
  2. Hryniewicz, T. Concept of microsmoothing in the electropolishing process. Surf. Coat. Technol. 1994, 64, 75–80. [Google Scholar] [CrossRef]
  3. Rokicki, R.; Hryniewicz, T. Enhanced oxidation-dissolution theory of electropolishing. Trans. Inst. Met. Finish. 2012, 90, 188–196. [Google Scholar] [CrossRef]
  4. Aliasghari, S. Plasma Electrolytic Oxidation of Titanium. Ph.D. Thesis, Faculty of Engineering and Physical Sciences, School of Materials, The University of Manchester, Manchester, UK, 2014. [Google Scholar]
  5. Han, Y.; Hong, S.H.; Xu, K.W. Synthesis of nanocrystalline titania films by micro-arc oxidation. Mater. Lett. 2002, 56, 744–747. [Google Scholar] [CrossRef]
  6. Gnedenkov, S.V.; Sharkeev, Y.P.; Sinebryukhov, S.L.; Khrisanfova, O.A.; Legostaeva, E.V.; Zavidnaya, A.G.; Puz’, A.V.; Khlusov, I.A.; Opra, D.P. Functional coatings formed on the titanium and magnesium alloys as implant materials by plasma electrolytic oxidation technology: Fundamental principles and synthesis conditions. Corros. Rev. 2016, 34, 65–83. [Google Scholar] [CrossRef]
  7. Hryniewicz, T.; Rokosz, K.; Sandim, H.R.Z. SEM/EDX and XPS studies of niobium after electropolishing. Appl. Surf. Sci. 2012, 263, 357–361. [Google Scholar] [CrossRef]
  8. Hryniewicz, T.; Konarski, P.; Rokicki, R.; Valiček, J. SIMS analysis of hydrogen content in near surface layers of AISI 316L SS after electrolytic polishing under different conditions. Surf. Coat. Technol. 2011, 205, 4228–4236. [Google Scholar] [CrossRef]
  9. Rokosz, K. Electrochemical Polishing in Magnetic Field; Koszalin University of Technology Publishing House: Koszalin, Poland, 2012; Monograph No 219; ISSN 0239-7129. (In Polish) [Google Scholar]
  10. Hryniewicz, T.; Rokicki, R.; Rokosz, K. Co-Cr alloy corrosion behaviour after electropolishing and “magnetoelectropolishing” treatments. Surf. Coat. Technol. 2008, 62, 3073–3076. [Google Scholar] [CrossRef]
  11. Hryniewicz, T.; Rokicki, R.; Rokosz, K. Magnetoelectropolishing for metal surface modification. Trans. Inst. Met. Finish. 2007, 85, 325–332. [Google Scholar] [CrossRef]
  12. Hryniewicz, T.; Rokosz, K. Polarization characteristics of magnetoelectropolishing stainless steels. Mater. Chem. Phys. 2010, 122, 169–174. [Google Scholar] [CrossRef]
  13. Hryniewicz, T.; Rokicki, R.; Rokosz, K. Corrosion and surface characterization of titanium biomaterial after magnetoelectropolishing. Surf. Coat. Technol. 2008, 203, 1508–1515. [Google Scholar] [CrossRef]
  14. Rokicki, R.; Hryniewicz, T.; Rokosz, K. Modifying metallic implants by magnetoelectropolishing. Med. Device Diagn. Ind. 2008, 30, 102–111. [Google Scholar]
  15. Rokicki, R.; Hryniewicz, T. Nitinol surface finishing by magnetoelectropolishing. Trans. Inst. Met. Finish. 2008, 86, 280–285. [Google Scholar] [CrossRef]
  16. Rokicki, R.; Haider, W.; Hryniewicz, T. Influence of sodium hypochlorite treatment of electropolished and magnetoelectropolished nitinol surfaces on adhesion and proliferation of MC3T3 preosteoblast cells. J. Mater. Sci. Mater. Med. 2012, 23, 2127–2139. [Google Scholar] [CrossRef] [PubMed]
  17. Rokosz, K.; Hryniewicz, T.; Simon, F.; Rzadkiewicz, S. Comparative XPS analysis of passive layers composition formed on AISI 304 L SS after standard and high-current density electropolishing. Surf. Interface Anal. 2015, 47, 87–92. [Google Scholar] [CrossRef]
  18. Rokosz, K.; Lahtinen, J.; Hryniewicz, T.; Rzadkiewicz, S. XPS depth profiling analysis of passive surface layers formed on austenitic AISI 304L and AISI 316L SS after high-current-density electropolishing. Surf. Coat. Technol. 2015, 276, 516–520. [Google Scholar] [CrossRef]
  19. Rokosz, K.; Hryniewicz, T.; Simon, F.; Rzadkiewicz, S. Comparative XPS analyses of passive layers composition formed on duplex 2205 SS after standard and high-current-density electropolishing. Teh. Vjesn. Tech. Gaz. 2016, 23, 731–735. [Google Scholar]
  20. Hryniewicz, T.; Rokosz, K. Analysis of XPS results of AISI 316L SS electropolished and magnetoelectropolished at varying conditions. Surf. Coat. Technol. 2010, 204, 2583–2592. [Google Scholar] [CrossRef]
  21. Rokosz, K.; Hryniewicz, T.; Raaen, S. Cr/Fe ratio by XPS spectra of magnetoelectropolished AISI 316L SS fitted by Gaussian-Lorentzian shape lines. Teh. Vjesn. Tech. Gaz. 2014, 21, 533–538. [Google Scholar]
  22. Rokosz, K.; Hryniewicz, T. XPS measurements of LDX 2101 duplex steel surface after magnetoelectropolishing. Int. J. Mater. Res. 2013, 104, 1223–1232. [Google Scholar] [CrossRef]
  23. Hryniewicz, T.; Rokosz, K. Investigation of selected surface properties of AISI 316L SS after magnetoelectropolishing. Mater. Chem. Phys. 2010, 123, 47–55. [Google Scholar] [CrossRef]
  24. Rokosz, K.; Hryniewicz, T. XPS Analysis of nanolayers obtained on AISI 316L SS after Magnetoelectropolishing. World Sci. News 2016, 37, 232–248. [Google Scholar]
  25. Rokosz, K.; Hryniewicz, T.; Raaen, S. Characterization of passive film formed on AISI 316L stainless steel after magnetoelectropolishing in a broad range of polarization parameters. Steel Res. Int. 2012, 83, 910–918. [Google Scholar] [CrossRef]
  26. Hryniewicz, T.; Rokicki, R.; Rokosz, K. Chapter 11. Magnetoelectropolished Titanium Biomaterial. In Biomaterials Science and Engineering; InTech: London, UK, 2011; pp. 227–248. ISBN 978-953-308-118-2. Available online: http://www.intechopen.com/articles/show/title/magnetoelectropolished-titanium-biomaterial (accessed on 3 February 2018).
  27. Hryniewicz, T.; Konarski, P.; Rokicki, R.; Valiček, J. SIMS studies of titanium biomaterial hydrogenation after magnetoelectropolishing. Surf. Coat. Technol. 2012, 206, 4027–4031. [Google Scholar] [CrossRef]
  28. Hryniewicz, T.; Konarski, P.; Rokicki, R. Hydrogen reduction in MEP niobium studied by secondary ion mass spectrometry (SIMS). Metals 2017, 7, 442. [Google Scholar] [CrossRef]
  29. Rokicki, R.; Hryniewicz, T.; Konarski, P.; Rokosz, K. The alternative, novel technology for improvement of surface finish of SRF niobium cavities. World Sci. News 2017, 74, 152–163. [Google Scholar]
  30. Rokosz, K.; Hryniewicz, T. Effect of magnetic field on the pitting corrosion of austenitic steel type AISI 304. Ochr. Przed Koroz. 2011, 54, 487–491. [Google Scholar]
  31. Hryniewicz, T.; Rokosz, K. Corrosion resistance of magnetoelectropolished AISI 316L SS biomaterial. Anti-Corros. Methods Mater. 2014, 61, 57–64. [Google Scholar] [CrossRef]
  32. Hryniewicz, T.; Rokosz, K.; Rokicki, R.; Prima, F. Nanoindentation and XPS studies of titanium TNZ alloy after electrochemical polishing in a magnetic field. Materials 2015, 8, 205–215. [Google Scholar] [CrossRef] [PubMed]
  33. Hryniewicz, T.; Rokosz, K.; Valiček, J.; Rokicki, R. Effect of magnetoelectropolishing on nanohardness and Young’s modulus of titanium biomaterial. Mater. Lett. 2012, 83, 69–72. [Google Scholar] [CrossRef]
  34. Han, Y.; Hong, S.H.; Xu, K.W. Structure and in vitro bioactivity of titania-based films by micro-arc oxidation. Surf. Coat. Technol. 2003, 168, 249–258. [Google Scholar] [CrossRef]
  35. The, T.H.; Berkani, A.; Mato, S.; Skeldon, P.; Thompson, G.E.; Habazaki, H.; Shimizu, K. Initial stages of plasma electrolytic oxidation of titanium. Corros. Sci. 2003, 45, 2757–2768. [Google Scholar]
  36. Rokosz, K.; Hryniewicz, T.; Dudek, Ł.; Matysek, D.; Valiček, J.; Harničarova, M. SEM and EDS analysis of surface layer formed on titanium after plasma electrolytic oxidation in H3PO4 with the addition of Cu(NO3)2. J. Nanosci. Nanotechnol. 2016, 16, 7814–7817. [Google Scholar] [CrossRef]
  37. Rokosz, K.; Hryniewicz, T.; Dalibor, M.; Raaen, S.; Valiček, J.; Dudek, Ł.; Harničarova, M. SEM, EDS and XPS analysis of the coatings obtained on titanium after plasma electrolytic oxidation in electrolytes containing copper nitrate. Materials 2016, 9. [Google Scholar] [CrossRef] [PubMed]
  38. Krząkala, A.; Młyński, J.; Dercz, G.; Michalska, J.; Maciej, A.; Nieużyła, L.; Simka, W. Modification of Ti-6Al-4V alloy surface by EPD-PEO process in ZrSiO4 suspension. Arch. Metall. Mater. 2014, 59, 199–204. [Google Scholar] [CrossRef]
  39. Simka, W.; Nawrat, G.; Chlode, J.; Maciej, A.; Winiarski, A.; Szade, J.; Radwanski, K.; Gazdowicz, J. Electropolishing and anodic passivation of Ti6Al7Nb alloy. Przem. Chem. 2011, 90, 84–90. [Google Scholar]
  40. Wang, Y.; Jiang, B.; Lei, T.; Guo, L. Dependence of growth features of microarc oxidation coatings of titanium alloy on control modes of alternate pulse. Mater. Lett. 2004, 58, 1907–1911. [Google Scholar] [CrossRef]
  41. Rokosz, K.; Hryniewicz, T.; Raaen, S. Development of Plasma Electrolytic Oxidation for improved Ti6Al4V biomaterial surface properties. Int. J. Adv. Manuf. Technol. 2016, 85, 2425–2437. [Google Scholar] [CrossRef]
  42. Rokosz, K.; Hryniewicz, T.; Raaen, S.; Chapon, P. Investigation of porous coatings obtained on Ti-Nb-Zr-Sn alloy biomaterial by Plasma Electrolytic Oxidation: Characterisation and Modelling. Int. J. Adv. Manuf. Technol. 2016, 87, 3497–3512. [Google Scholar] [CrossRef]
  43. Rokosz, K.; Hryniewicz, T.; Raaen, S.; Chapon, P. Development of copper-enriched porous coatings on ternary Ti-Nb-Zr alloy by Plasma Electrolytic Oxidation. Int. J. Adv. Manuf. Technol. 2017, 89, 2953–2965. [Google Scholar] [CrossRef]
  44. Rokosz, K.; Hryniewicz, T. Characteristics of porous and biocompatible coatings obtained on Niobium and Titanium-Niobium-Zirconium (TNZ) alloy by Plasma Electrolytic Oxidation. Mechanik 2015, 12, 15–18. [Google Scholar] [CrossRef]
  45. Simka, W.; Sadowski, A.; Warczak, M.; Iwaniak, A.; Dercz, G.; Michalska, J.; Maciej, A. Modification of titanium oxide layer by calcium and phosphorus. Electrochim. Acta 2011, 56, 8962–8968. [Google Scholar] [CrossRef]
  46. Rokosz, K.; Hryniewicz, T.; Gaiaschi, S.; Chapon, P.; Raaen, S.; Pietrzak, K.; Malorny, W. Characterisation of calcium- and phosphorus-enriched porous coatings on CP Titanium Grade 2 fabricated by plasma electrolytic oxidation. Metals 2017, 7. [Google Scholar] [CrossRef]
  47. Rokosz, K.; Hryniewicz, T.; Chapon, P.; Raaen, S.; Sandim, H.R.Z. XPS and GDOES characterisation of porous coating enriched with copper and calcium obtained on Tantalum via Plasma Electrolytic Oxidation. J. Spectrosc. 2016, 2016, 7093071. [Google Scholar] [CrossRef]
  48. Rokosz, K.; Hryniewicz, T.; Raaen, S.; Chapon, P.; Dudek, Ł. GDOES, XPS and SEM with EDS analysis of porous coatings obtained on Titanium after Plasma Electrolytic Oxidation. Surf. Interface Anal. 2016, 49, 303–315. [Google Scholar] [CrossRef]
  49. Rokosz, K.; Hryniewicz, T.; Chapon, P.; Dudek, Ł. A new approach to porous PEO coating sub-layers determination on the basis of GDOES signals. World Sci. News 2016, 57, 289–299. [Google Scholar]
  50. Rokosz, K.; Hryniewicz, T.; Malorny, W. Characterisation of porous coatings obtained on materials by Plasma Electrolytc Oxidation. Mater. Sci. Forum 2016, 862, 86–95. [Google Scholar] [CrossRef]
  51. Rokosz, K.; Hryniewicz, T.; Raaen, S. SEM, EDS and XPS analysis of nanostructured coating obtained on NiTi biomaterial alloy by Plasma Electrolytic Oxidation (PEO). Teh. Vjesn. Tech. Gaz. 2017, 24, 193–198. [Google Scholar]
  52. Rokosz, K.; Hryniewicz, T.; Pietrzak, K.; Sadlak, P.; Valíček, J. Fabrication and characterisation of porous, calcium enriched coatings on titanium after Plasma Electrolytic Oxidation under DC regime. Adv. Mater. Sci. 2017, 17, 55–67. [Google Scholar] [CrossRef]
  53. Rokosz, K.; Hryniewicz, T. Comparative SEM and EDX analysis of surface coatings created on niobium and titanium alloys after Plasma Electrolytic Oxidation (PEO). Teh. Vjesn. Tech. Gaz. 2017, 24, 465–472. [Google Scholar]
  54. Rokosz, K.; Hryniewicz, T.; Raaen, S.; Malorny, W. Fabrication and characterization of porous coatings obtained by Plasma Electrolytic Oxidation. J. Mech. Energy Eng. 2017, 1, 23–30. [Google Scholar]
  55. Valiček, J.; Drzik, M.; Hryniewicz, T.; Harničarova, M.; Rokosz, K.; Kusnerova, M.; Barcova, K.; Brazina, D. Noncontact method for surface roughness measurement after machining. Meas. Sci. Rev. 2012, 12, 184–188. [Google Scholar] [CrossRef]
  56. Kusnerova, M.; Valiček, J.; Harničarova, M.; Hryniewicz, T.; Rokosz, K.; Palkova, Z.; Vaclavik, V.; Repka, M.; Bendova, M. A proposal for simplifying the method of evaluation of uncertainties in measurement results. Meas. Sci. Rev. 2013, 13, 1–6. [Google Scholar] [CrossRef]
  57. Casa Software Ltd. CasaXPS: Processing Software for XPS, AES, SIMS and More. 2009. Available online: http://www.casaxps.com (accessed on 12 December 2017).
  58. Wagner, C.D.; Naumkin, A.V.; Kraut-Vass, A.; Allison, J.W.; Powell, C.J.; Rumble, J.R. NIST Standard Reference Database 20, Version 4.1. 2003. Available online: http://srdata.nist.gov/xps (accessed on 3 February 2018).
  59. Nelis, T.; Payling, R. Practical Guide to Glow Discharge Optical Emission Spectroscopy; RSC Analytical Spectroscopy Monographs; Barnett, N.W., Ed.; Royal Society of Chemistry: Cambridge, UK, 2002. [Google Scholar]
  60. Pulsed RF Glow Discharge Optical Emission Spectrometry; Ultra Fast Elemental Depth Profiling; HORIBA Jobin Yvon: Paris, France, 2014; Available online: http://www.horiba.com/scientific/products/atomic-emission-spectroscopy/glow-discharge/ (accessed on 12 December 2017).
  61. DiP: Differential Interferometry Profiling; HORIBA Jobin Yvon: Paris, France, 2015; Available online: http://www.horiba.com/fileadmin/uploads/Scientific/Documents/GDS/HJY_BRO_GDOES_DiP.pdf (accessed on 12 December 2017).
Figure 1. Current vs. voltage curves of CP (commercially pure) Titanium Grade 2 after plasma electrolytic oxidation (PEO) treatment in 500 g Mg(NO3)2 or 500 g Zn(NO3)2 in 1000 mL H3PO4 electrolyte.
Metals 08 00112 g001
Figure 2. SEM (scanning electron microscope) micrographs of the coatings formed on CP Titanium Grade 2 after PEO treatment at voltages of 500 V, 575 V, 650 V in H3PO4 electrolyte with addition of 500 g·L−1 Mg(NO3)2∙6H2O or 500 g·L−1 Zn(NO3)2∙6H2O. Magnification: 500 times.
Metals 08 00112 g002
Figure 3. SEM micrographs of coatings formed on CP Titanium Grade 2 after PEO treatment at voltages of 500 V, 575 V, 650 V in H3PO4 electrolyte with addition of 500 g·L−1 Mg(NO3)2∙6H2O or 500 g·L−1 Zn(NO3)2∙6H2O. Magnification: 5000 times.
Metals 08 00112 g003
Figure 4. Zn/P and Mg/P ratios of EDS results of coatings formed on CP Titanium Grade 2 after PEO treatment at voltages 500, 575 and 650 VDC in electrolytes containing 500 g·L−1 of Zn(NO3)2∙6H2O and 500 g·L−1 of Mg(NO3)2∙6H2O in concentrated H3PO4.
Metals 08 00112 g004
Figure 5. XPS spectra of coatings formed on CP Titanium Grade 2 after PEO treatment at voltage 575 VDC in concentrated H3PO4 electrolytes containing (a) 500 g·L−1 Zn(NO3)2∙6H2O; and (b) 500 g·L−1 Mg(NO3)2∙6H2O.
Metals 08 00112 g005
Figure 6. Glow discharge optical emission spectroscopy (GDOES) signals of zinc (Zn), phosphorus (P), oxygen (O), hydrogen (H), carbon (C), nitrogen (N), and titanium (Ti) of the porous coating formed on CP Titanium Grade 2 after PEO treatment at voltages of 500 VDC, 575 VDC, and 650 VDC in 500 g·L−1 Mg(NO3)2∙6H2O in H3PO4 electrolyte; blue continuous line—GDOES signal, red continuous line—first derivative, red dotted line—second derivative.
Metals 08 00112 g006
Figure 7. Glow discharge optical emission spectroscopy (GDOES) signals of magnesium (Mg), phosphorus (P), oxygen (O), hydrogen (H), carbon (C), nitrogen (N), and titanium (Ti) of the porous coating formed on CP Titanium Grade 2 after PEO treatment at voltages of 500 VDC, 575 VDC, and 650 VDC in 500 g·L−1 Mg(NO3)2∙6H2O in H3PO4 electrolyte; blue continuous line—GDOES signal, red continuous line—first derivative, red dotted line—second derivative.
Metals 08 00112 g007
Figure 8. Potentiodynamic corrosion results of the porous coating formed on CP Titanium Grade 2 after PEO treatment at voltages of 500 VDC (red lines), 575 VDC (blue lines), and 650 VDC (green lines), in (a) magnesium-rich, or (b) zinc-rich phosphoric acid electrolytes; (a,d) logarithmic Y axis; (b,e) linear Y axis; (c,f) statistical analysis results.
Metals 08 00112 g008

