Article

Effect of Temperature and Dwell Time on Fatigue Crack Growth Behavior of CP-Ti

1
School of Mechanical and Power Engineering, Nanjing Tech University, Nanjing 211816, China
2
Jiangsu Key Lab of Design and Manufacture of Extreme Pressure Equipment, Nanjing Tech University, Nanjing 211816, China
*
Author to whom correspondence should be addressed.
Metals 2018, 8(12), 1031; https://doi.org/10.3390/met8121031
Submission received: 8 November 2018 / Revised: 28 November 2018 / Accepted: 30 November 2018 / Published: 6 December 2018
(This article belongs to the Special Issue Titanium Alloys: Processing and Properties)

Abstract

:
In this paper, the effects of temperature and dwell time on the Fatigue Crack Growth (FCG) behavior of commercial pure titanium were studied under high and low load ratios. Besides, combined with the fracture surface morphology, the specific characteristics of FCG were analyzed under pure fatigue and dwell fatigue conditions. The experiment results show that the FCG rate of commercial pure titanium (CP-Ti) increases with the temperature under low load ratio, and the dwell time increases the FCG rate. Also, the enhancement of the dwell time increases as the temperature rises. The dwell effect tends to be saturated when the temperature rises to 200 °C. Under high load ratio, the FCG rate of CP-Ti also exhibits a temperature-sensitive enhancement. The enhancement effect of the dwell time on the FCG rate under high load ratio is more significant. However, the effect of the hold time on the FCG rate does not increase at 300 °C. The da/dN–ΔK/E FCG curves for CP-Ti have a tendency to approach each other under different load ratios, which indicates that the E-modulus is an important factor for the difference. The effect of dwell time on the FCG behavior of CP-Ti is dominated by the creep deformation mechanism under different load ratios from room temperature to 300 °C. At the same time, the oxidation effect gradually becomes significant as the load ratio increases to 300 °C. The fracture surface morphology shows that the secondary cracks and the roughness increase with temperature or dwell time under low load ratio condition, while, under high load ratio, the effect of creep deformation on the FCG behavior is more obviously enhanced, and plastic deformation is gradually significant with increase of the dimples.

1. Introduction

TA2 is a common commercial pure titanium (CP-Ti), which presents a single α phase at service temperature. Its strength is not high, but its plasticity is good. Its oxidation resistance is better than that of austenitic stainless steels. Its heat resistance is poor, and its service temperature is lower than 350 °C. Commercial pure titanium is widely used in thermal power station systems, marine seawater corrosion pipeline systems, chemical distillation systems, seawater desalination systems, and aerospace components [1]. The components usually withstand different temperatures and load under service condition. Therefore, the fatigue crack propagation behavior of the materials used is carefully controlled as an index of continuous damage.
In general, the titanium alloys are temperature-sensitive, that is, their yield strength, ultimate strength, and elastic modulus decrease obviously with temperature. Therefore, the Fatigue Crack Growth (FCG) behavior of titanium alloys also has a certain degree of temperature sensitivity [2]. For most titanium alloys, the FCG rate increases with temperature under a certain load ratio. However, the increase of secondary cracks and the crack closure effect induced by oxides can inhibit the alloy’s FCG rate at high temperature. In addition, the FCG curve of titanium alloy has a tendency to intersect at one point at different temperatures [3,4,5,6].
The plastic deformation of titanium alloys depends on the crystal orientation. The titanium alloy with HCP (hexagonal closed-packed) orientation is prone to creep deformation with dwell time at the corresponding temperature [7,8]. It is generally believed that the creep behavior of a titanium alloy is caused by the combination of dislocation slip and twin deformation at a certain temperature [9,10]. For the near-α phase titanium alloy, the FCG life will decrease exponentially with the dwell time at room temperature [11]. In addition, the FCG lives of Ti–6Al–V and Ti-6242 alloys decrease, while the FCG rates increase under a certain dwell time [12,13]. At the same time, the load ratio has an obvious effect on the dwell fatigue crack growth rate of Ti-6242 alloy, and the FCG rate increases with the dwell time [14]. Moreover, the FCG rate of commercial pure titanium increases with the load ratio at the same dwell time [15]. For superalloy GH4720Li, the increase of the FCG rate with a holding time of 90 s is more obvious than that of the pure fatigue under the same ΔK. Besides, grain boundary oxidative embrittlement at the crack tip is also possible in addition to the fatigue and creep damage [16,17]. At present, extensive research on the dwell fatigue crack growth behavior of CP-Ti is concentrated at room temperature, while the dwell fatigue crack growth behavior at different temperatures has not been addressed. Therefore, in this paper, the FCG behavior of CP-Ti for pure fatigue at a dwell time of 10 s under different load ratios was tested in the air environment at room temperature, 100 °C, 200 °C, and 300 °C. Moreover, the FCG mechanism under the various load ratios and temperatures was analyzed in combination with fracture surface morphology.

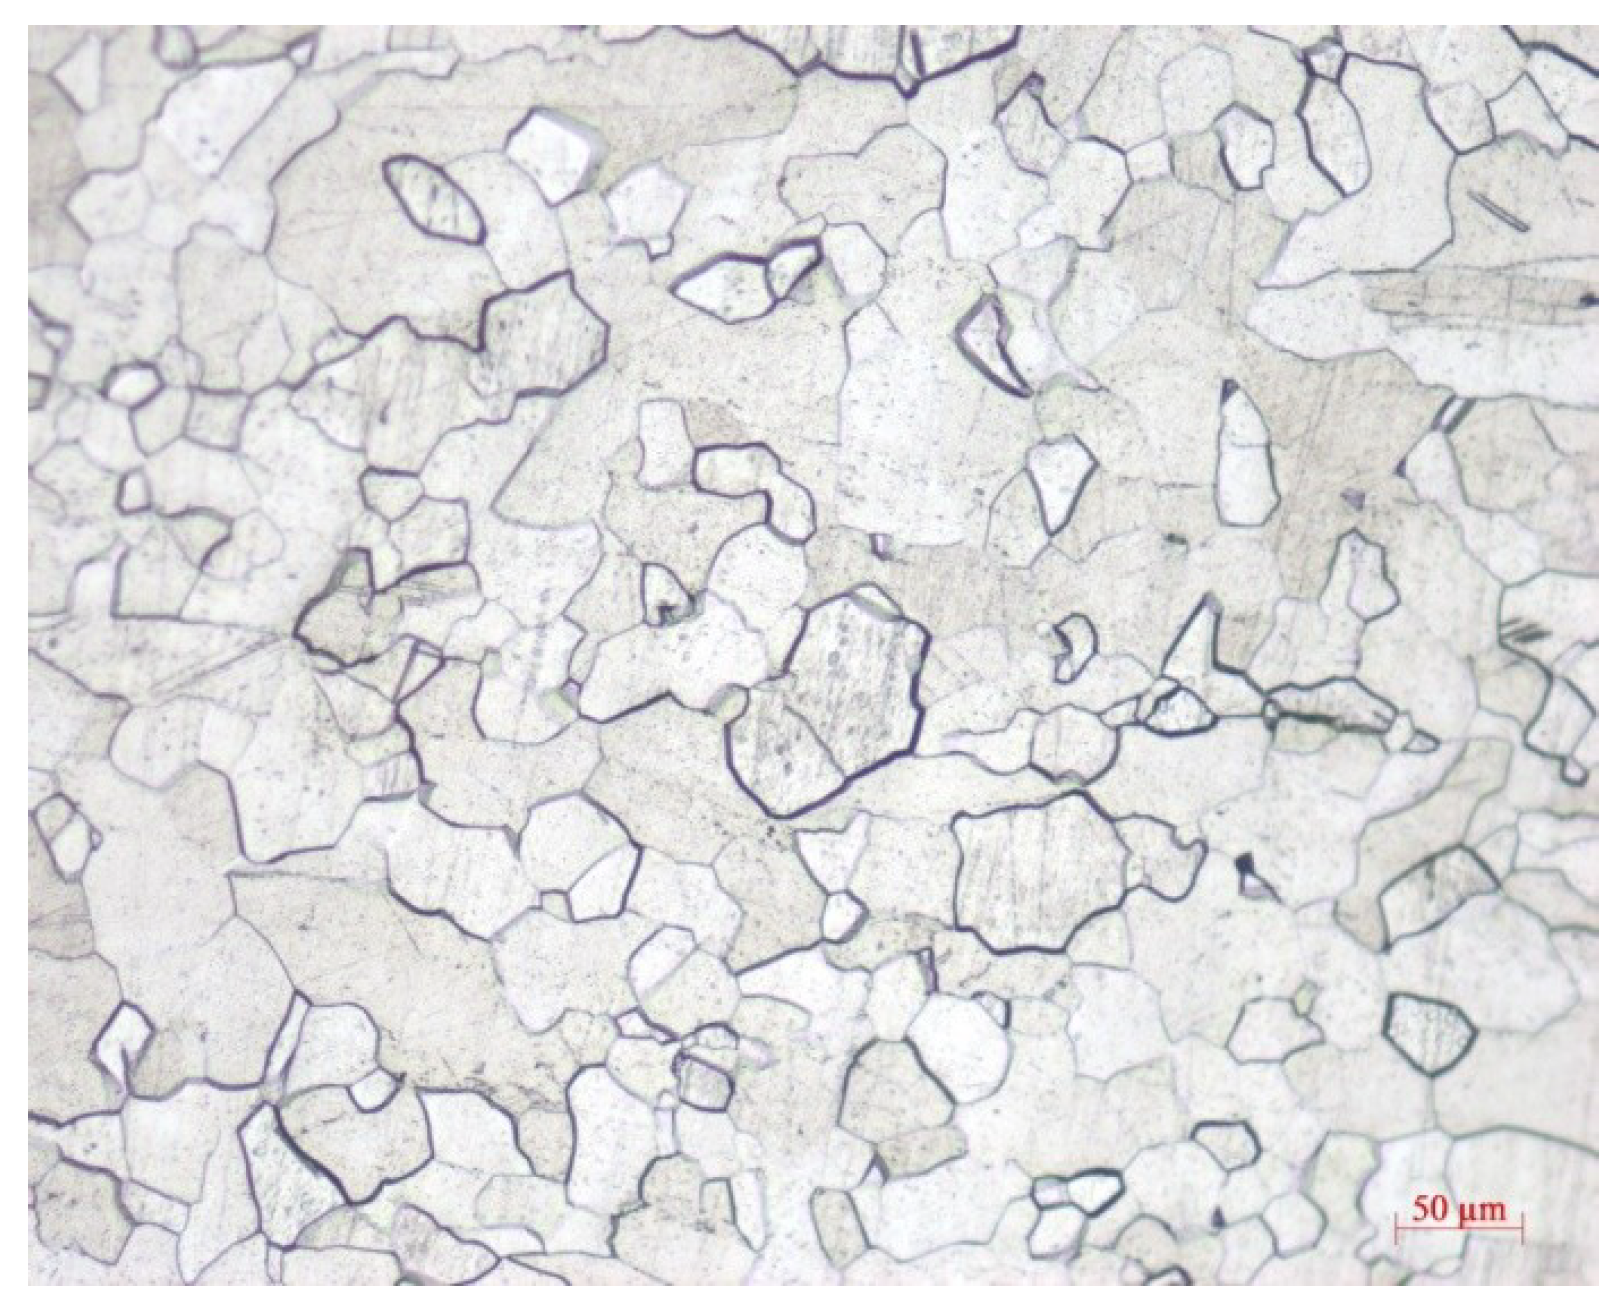
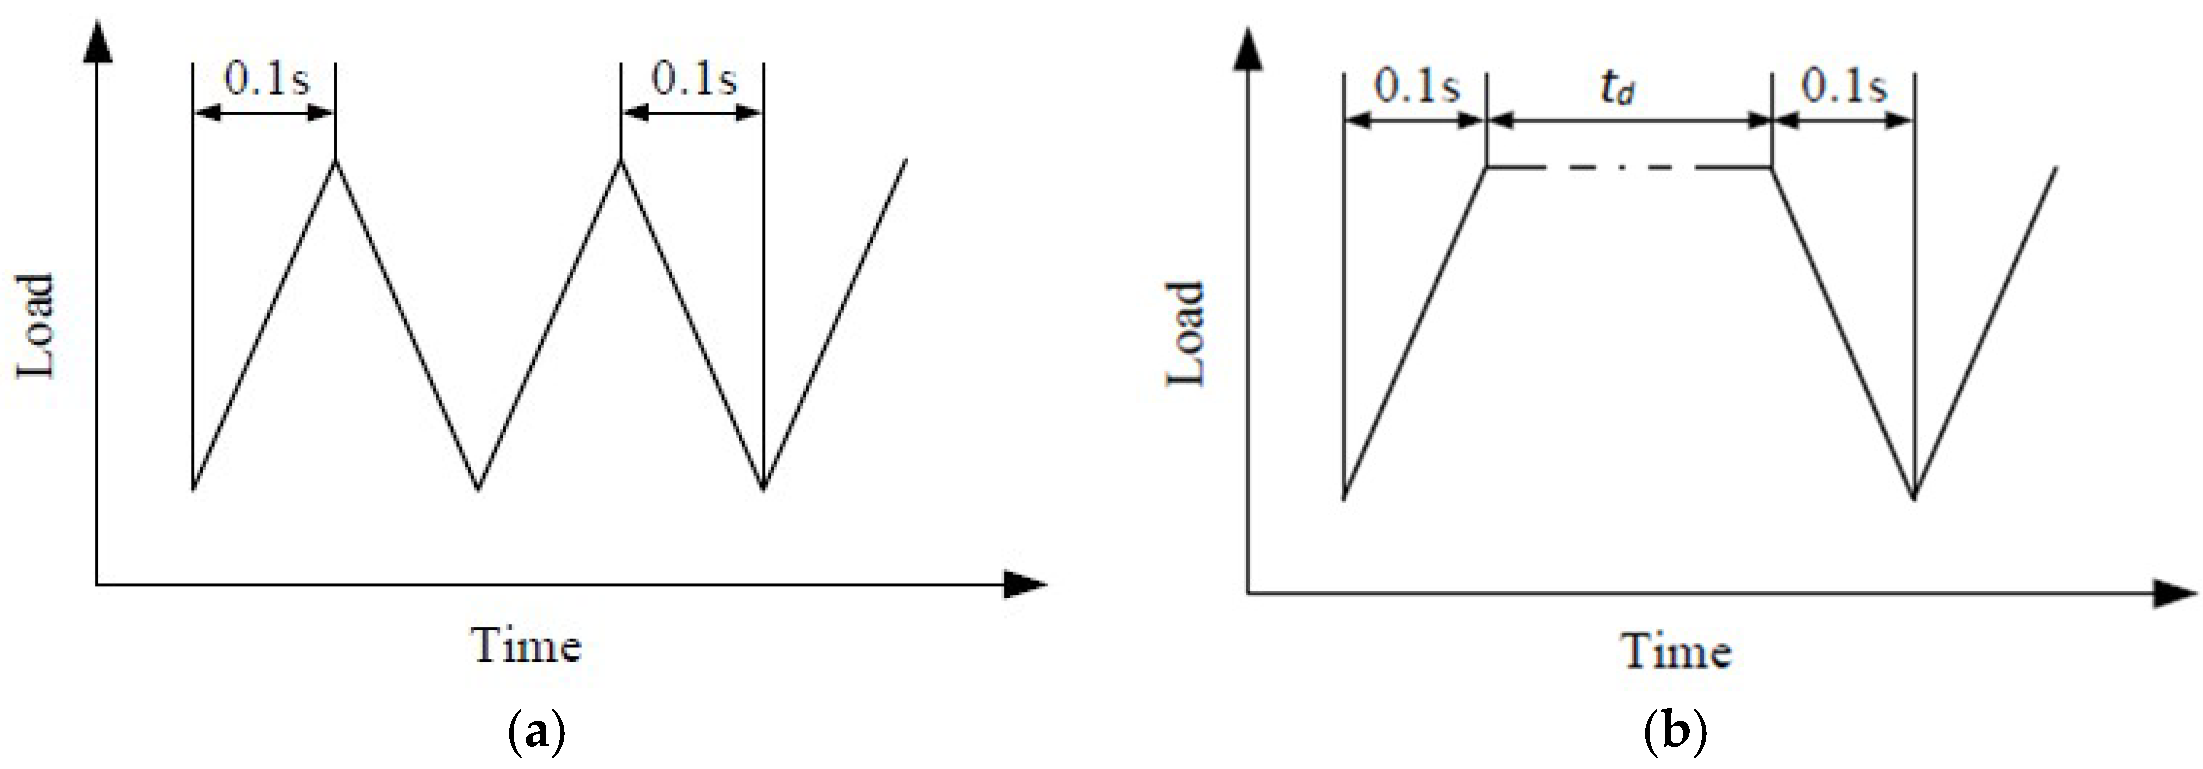
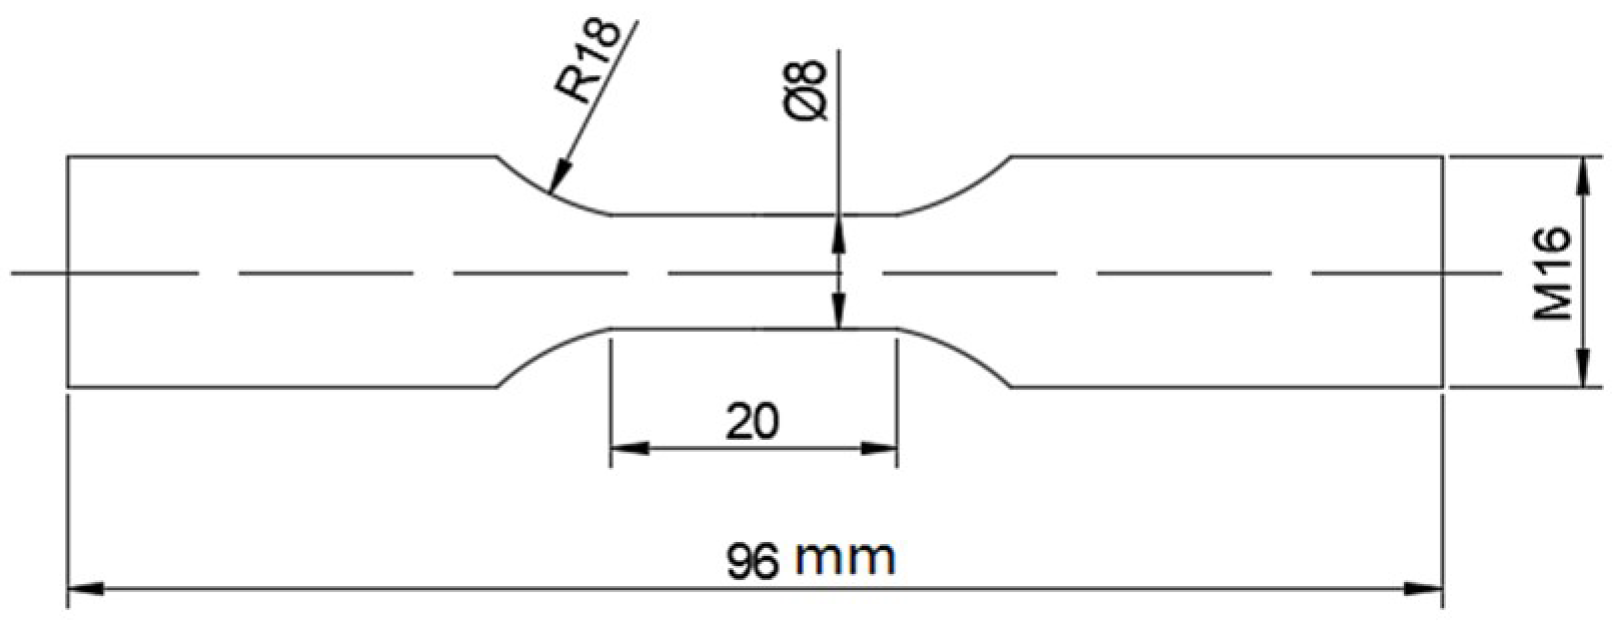
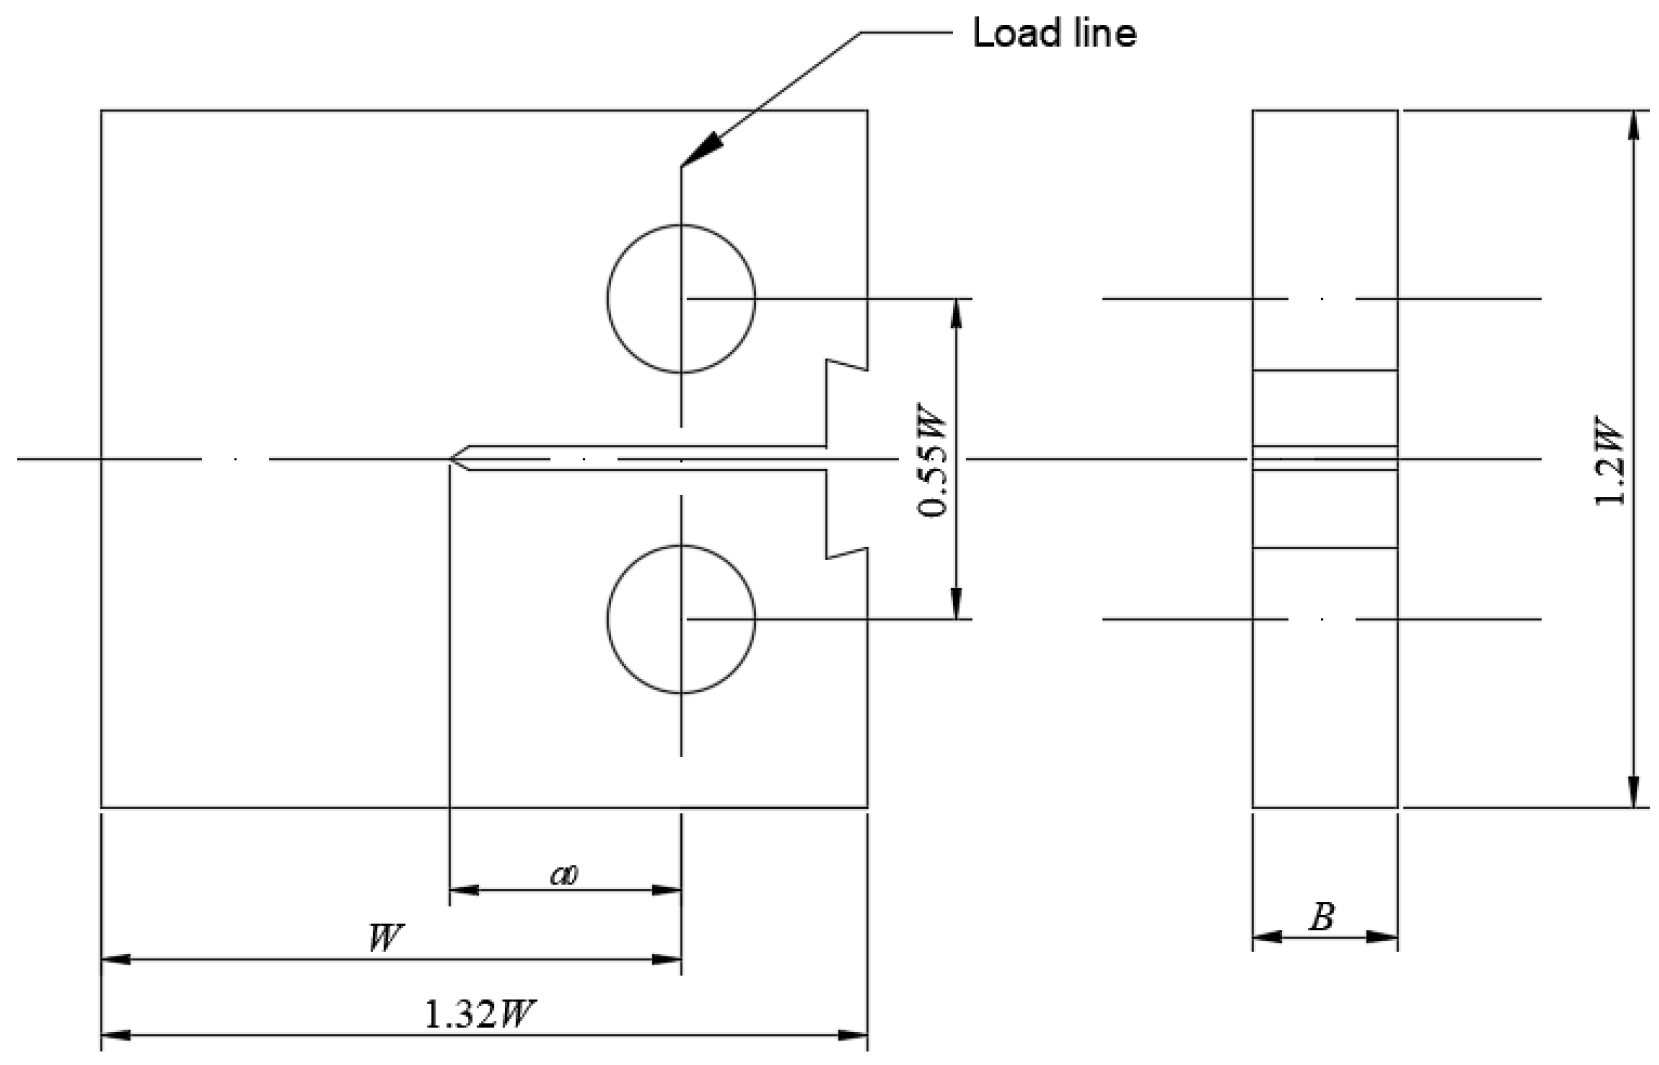
2. Experiment Details

The material used in this study was commercial pure titanium (CP-Ti) grade 2 with pre-annealing treatment. The chemical composition is presented in Table 1. The tensile test was carried out with an MTS809 servo-hydraulic system (MTS, Eden Prairie, MN, USA), which was subjected to room temperature and high temperature tensile tests. As shown in Figure 1, the compact tensile (CT) specimens were adopted according to ASTM: E8/E8M-11. Test temperatures were RT, 100 °C, 200 °C, and 300 °C. The mechanical properties at different temperatures are listed in Table 2. Standard CT specimens were adopted according to ASTM E647-2015e1 [18]. As shown in Figure 2, the dimension parameters were B (thickness) = 12.5 mm, W (width) = 50 mm, and a0 (initial crack length) = 20 mm. The metallographic analysis was carried out on the material plane which was parallel to the fatigue crack propagation direction. CP-Ti has an equiaxed crystal structure with slender crystal grains and inhomogeneous size, as shown in Figure 3. The sizes of crystal grain varied from 20 μm to 70 μm. CT specimens are widely used to investigate the FCG behavior. The crack front of a CT specimen may show a severe tunneling shape if the creep deformation is significant. This is mainly due to the stress states, being plane strain in the mid-thickness and plane stress on the two sides. The tests were carried out with MTS Landmark 370.10 servo-hydraulic system (MTS, Eden Prairie, MN, USA). The temperature control was carried out with a high-temperature furnace and an external thermometer within an error of ±2 °C. Loading clevises with ‘‘flat bottom’’ holes were used for the CT specimens according to ASTM E647-2015e1. The waveforms for the loading and unloading portions were triangular, and the loading/unloading times were held constant. As shown in Figure 4, the dwell time is superimposed on the triangular waveforms at maximum load considering the creep effects. Crack length was monitored by clip gage for crack-tip opening displacement (CTOD) with the compliance method. Pre-cracking was 2 mm under low load ratio and 4 mm under high load ratio at 25 °C. The FCG behavior of the specimens under two load ratios at different temperatures and dwell times are shown in Table 3.

3. Results and Discussion

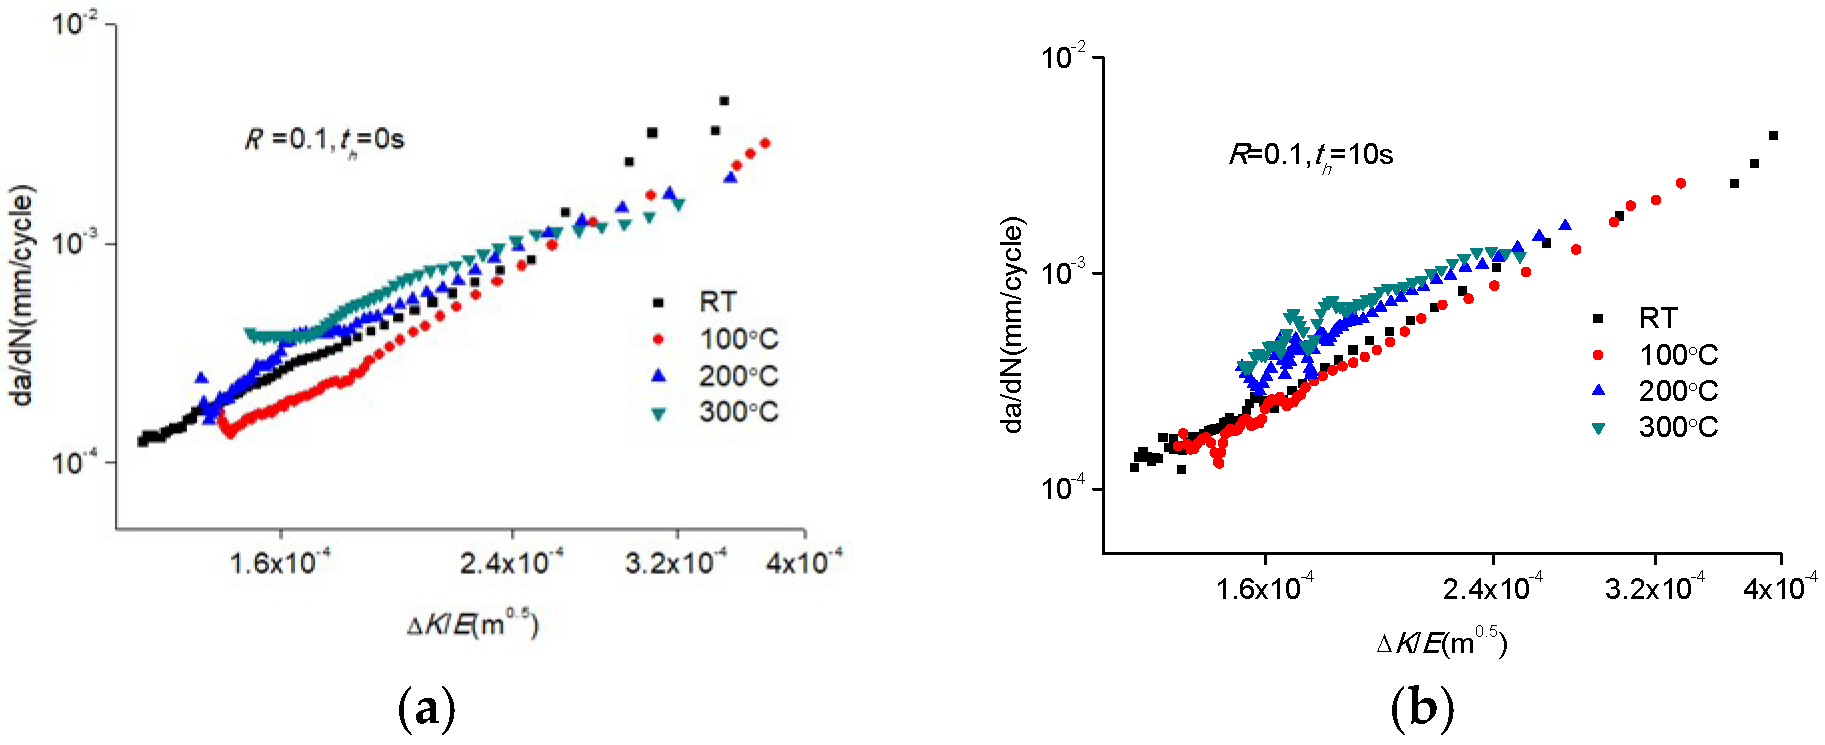
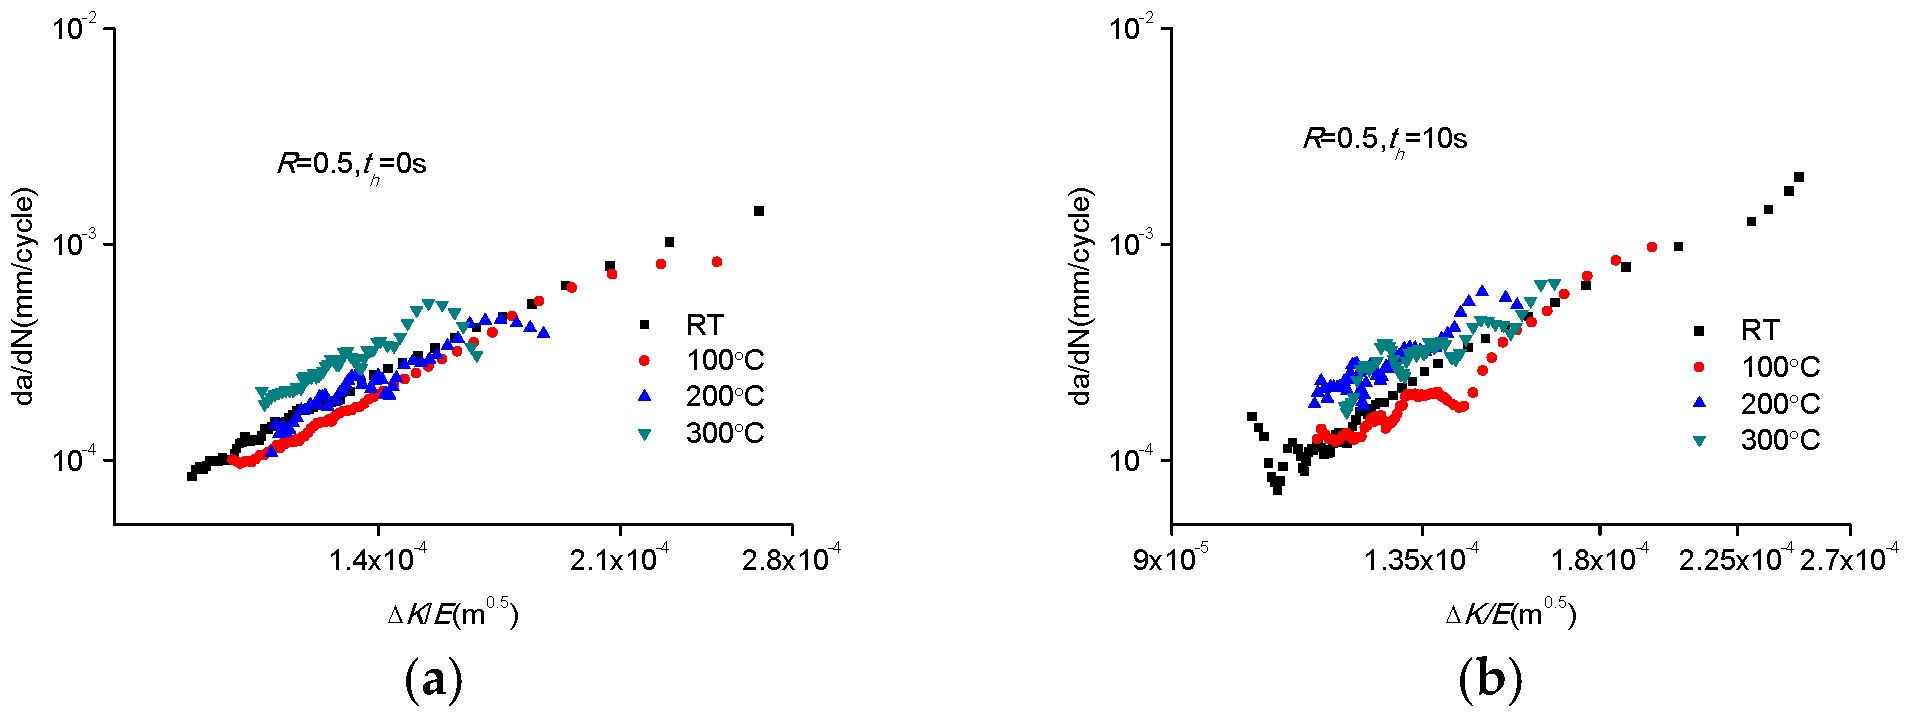
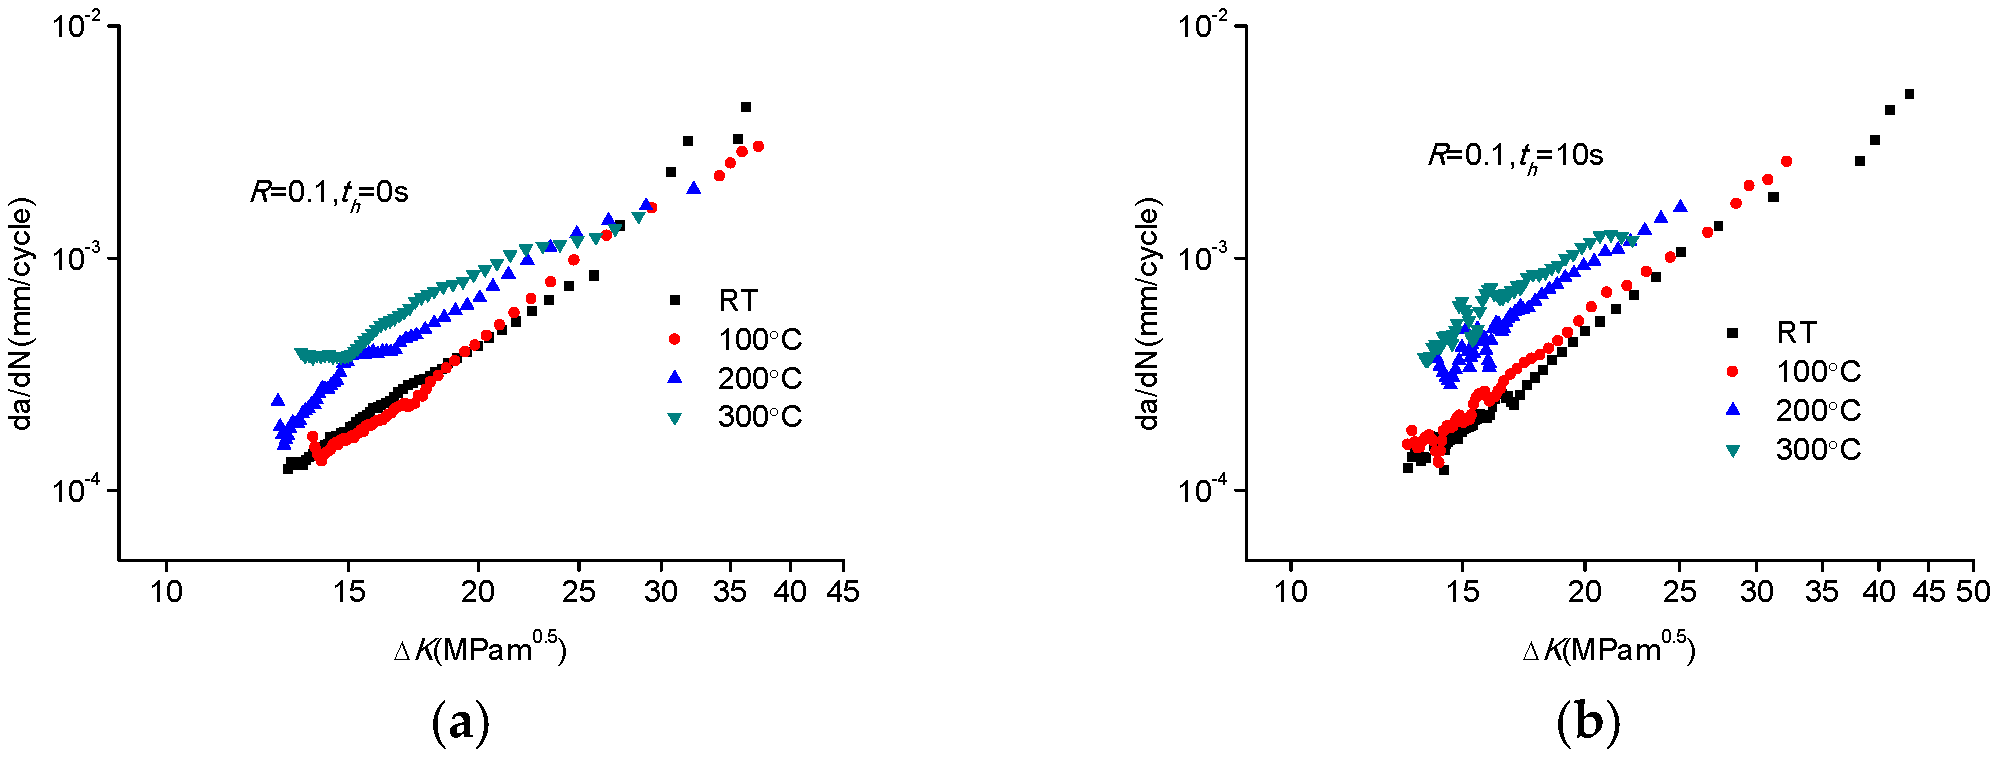
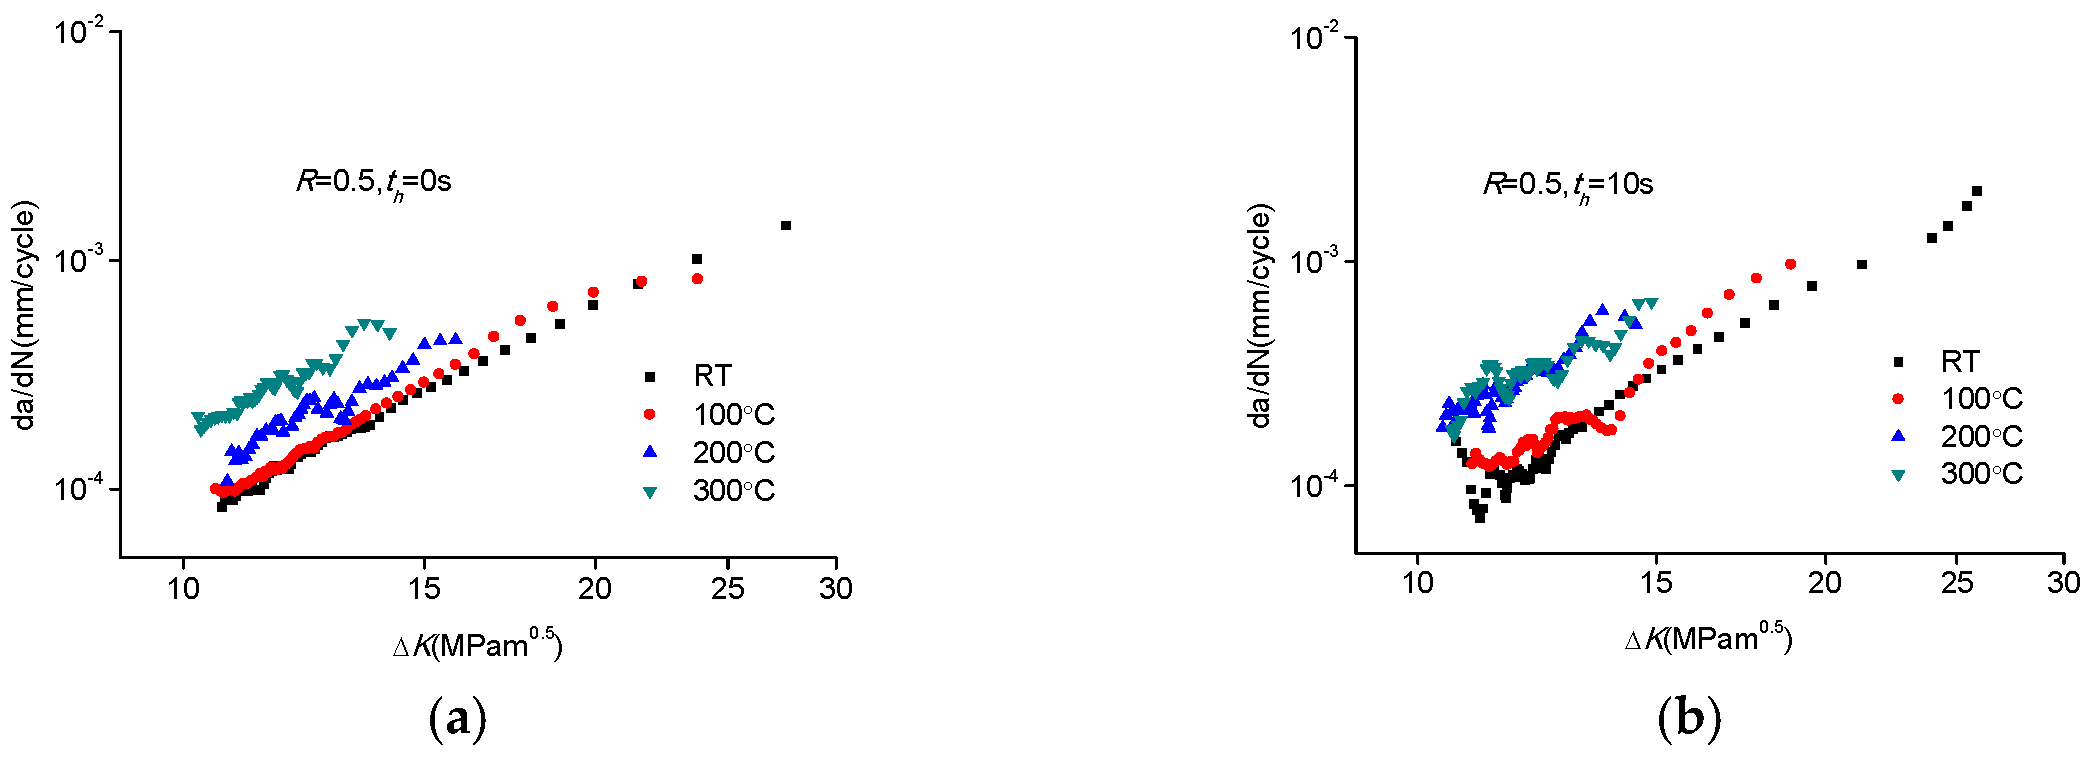
3.1. Temperature Sensitivity of CP-Ti under Pure Fatigue and Dwell FCG

As shown in Table 3, the temperature sensitivity of the FCG behavior of commercial pure titanium under pure fatigue and dwell fatigue conditions with low load ratio (R = 0.1, Fmax = 4978 N) and high load ratio (R = 0.5, Fmax = 6500 N) were studied. The pure fatigue and dwell FCG curves of da/dN-ΔK of commercial pure titanium at room temperature, 100 °C, 200 °C, and 300 °C in air environment were obtained. As shown in Figure 4, the initial stress intensity factor amplitudes were identical under the same load, and the loading waveform corresponded to a dwell time of 10 s.
Figure 5 shows the FCG behavior of CP-Ti at different temperatures under low load ratio. As shown in Figure 5a, similar to the general titanium alloy [19], the overall FCG rate of CP-Ti increased with temperature. The FCG rate at room temperature was higher than at 100 °C in the initial stage. However, it was lower than at 100 °C in the steady stage, and the gap gradually increased. The FCG rate at 200 °C significantly increased with respect to that at room temperature and 100 °C in the initial and steady stages. The FCG rate at 200 °C was 1.6 times that at 100 °C under ΔK = 20 MPam0.5. The FCG rate at 300 °C was generally higher than at 200 °C. The FCG rate at 300 °C was 1.4 times that at 200 °C under ΔK = 18 MPam0.5. The FCG rate of CP-Ti increased with the temperature, but the rate of increase was reduced at 300 °C. In addition, the FCG curves gradually intersected at one point at different temperatures. The temperature sensitivity of dwell fatigue crack growth behavior was more obvious than that of pure fatigue, as shown in Figure 5b. The dwell fatigue crack growth rate of CP-Ti increased obviously with temperature. In addition, dwell fatigue crack growth curves at different temperatures did not gradually intersect at one point.
Figure 6 shows the FCG behavior of CP-Ti at different temperatures under high load ratio. In comparison with Figure 5, the FCG rate was much higher than under low load ratio. The FCG behavior of CP-Ti was also temperature-sensitive in pure fatigue conditions. Besides, the FCG rate increased with temperature in the initial stage and in the steady stage. Under the dwell fatigue condition, the FCG rate of CP-Ti increased as temperature rose from room temperature to 200 °C. However, the FCG rate did not continuously increase at 300 °C and was close to that at 200 °C.

3.2. Effect of Temperature and Oxidation on the FCG Behavior of CP-Ti

As mentioned above, the properties of CP-Ti materials change significantly with temperature. The FCG behavior is obviously temperature-sensitive under pure fatigue and dwell fatigue conditions. Besides, titanium has high activity and is easily oxidized at high temperature. Therefore, temperature and oxidation play a major role in the FCG behavior of CP-Ti at different temperatures. Soboyejo et al. [20] found that the oxidation of titanium alloys induced crack closure effects in a high-temperature environment. Mabru et al. [21] analyzed the effects of temperature and environment on the FCG of γ-phase titanium alloys and found that the effects of temperature and crack closure of FCG in air were more obvious than in a vacuum environment. Mercer et al. [22] studied the effects on FCG of three titanium–aluminum alloys at 25 °C, 450 °C, and 700 °C. The FCG rate is explained by a deformation mechanism and the oxidation-induced crack closure in the crack tip. It can be concluded that the crack closure effect which was caused by oxidation at 700 °C inhibited the tendency of the crack to accelerate.
Figure 7 and Figure 8 show that the da/dN–ΔK/E FCG curves of CP-Ti have a tendency to approach each other under different load ratios, which indicates that E-modulus is an important reason for the difference of FCG behavior of CP-Ti. Meanwhile, as the temperature increased, the yield strength decreased, resulting in an increase in the plasticity area, which in turn increased CTOD, and finally the FCG rate increased. As shown in Figure 9 and Figure 10, the oxidation of CP-Ti was obviously higher as the temperature increased. Besides, the overall oxidation effect on crack tip and grain boundary was higher than the oxidation-induced crack closure effect [22], which led to the increase of the FCG rate of CP-Ti at different temperatures under different load ratios.

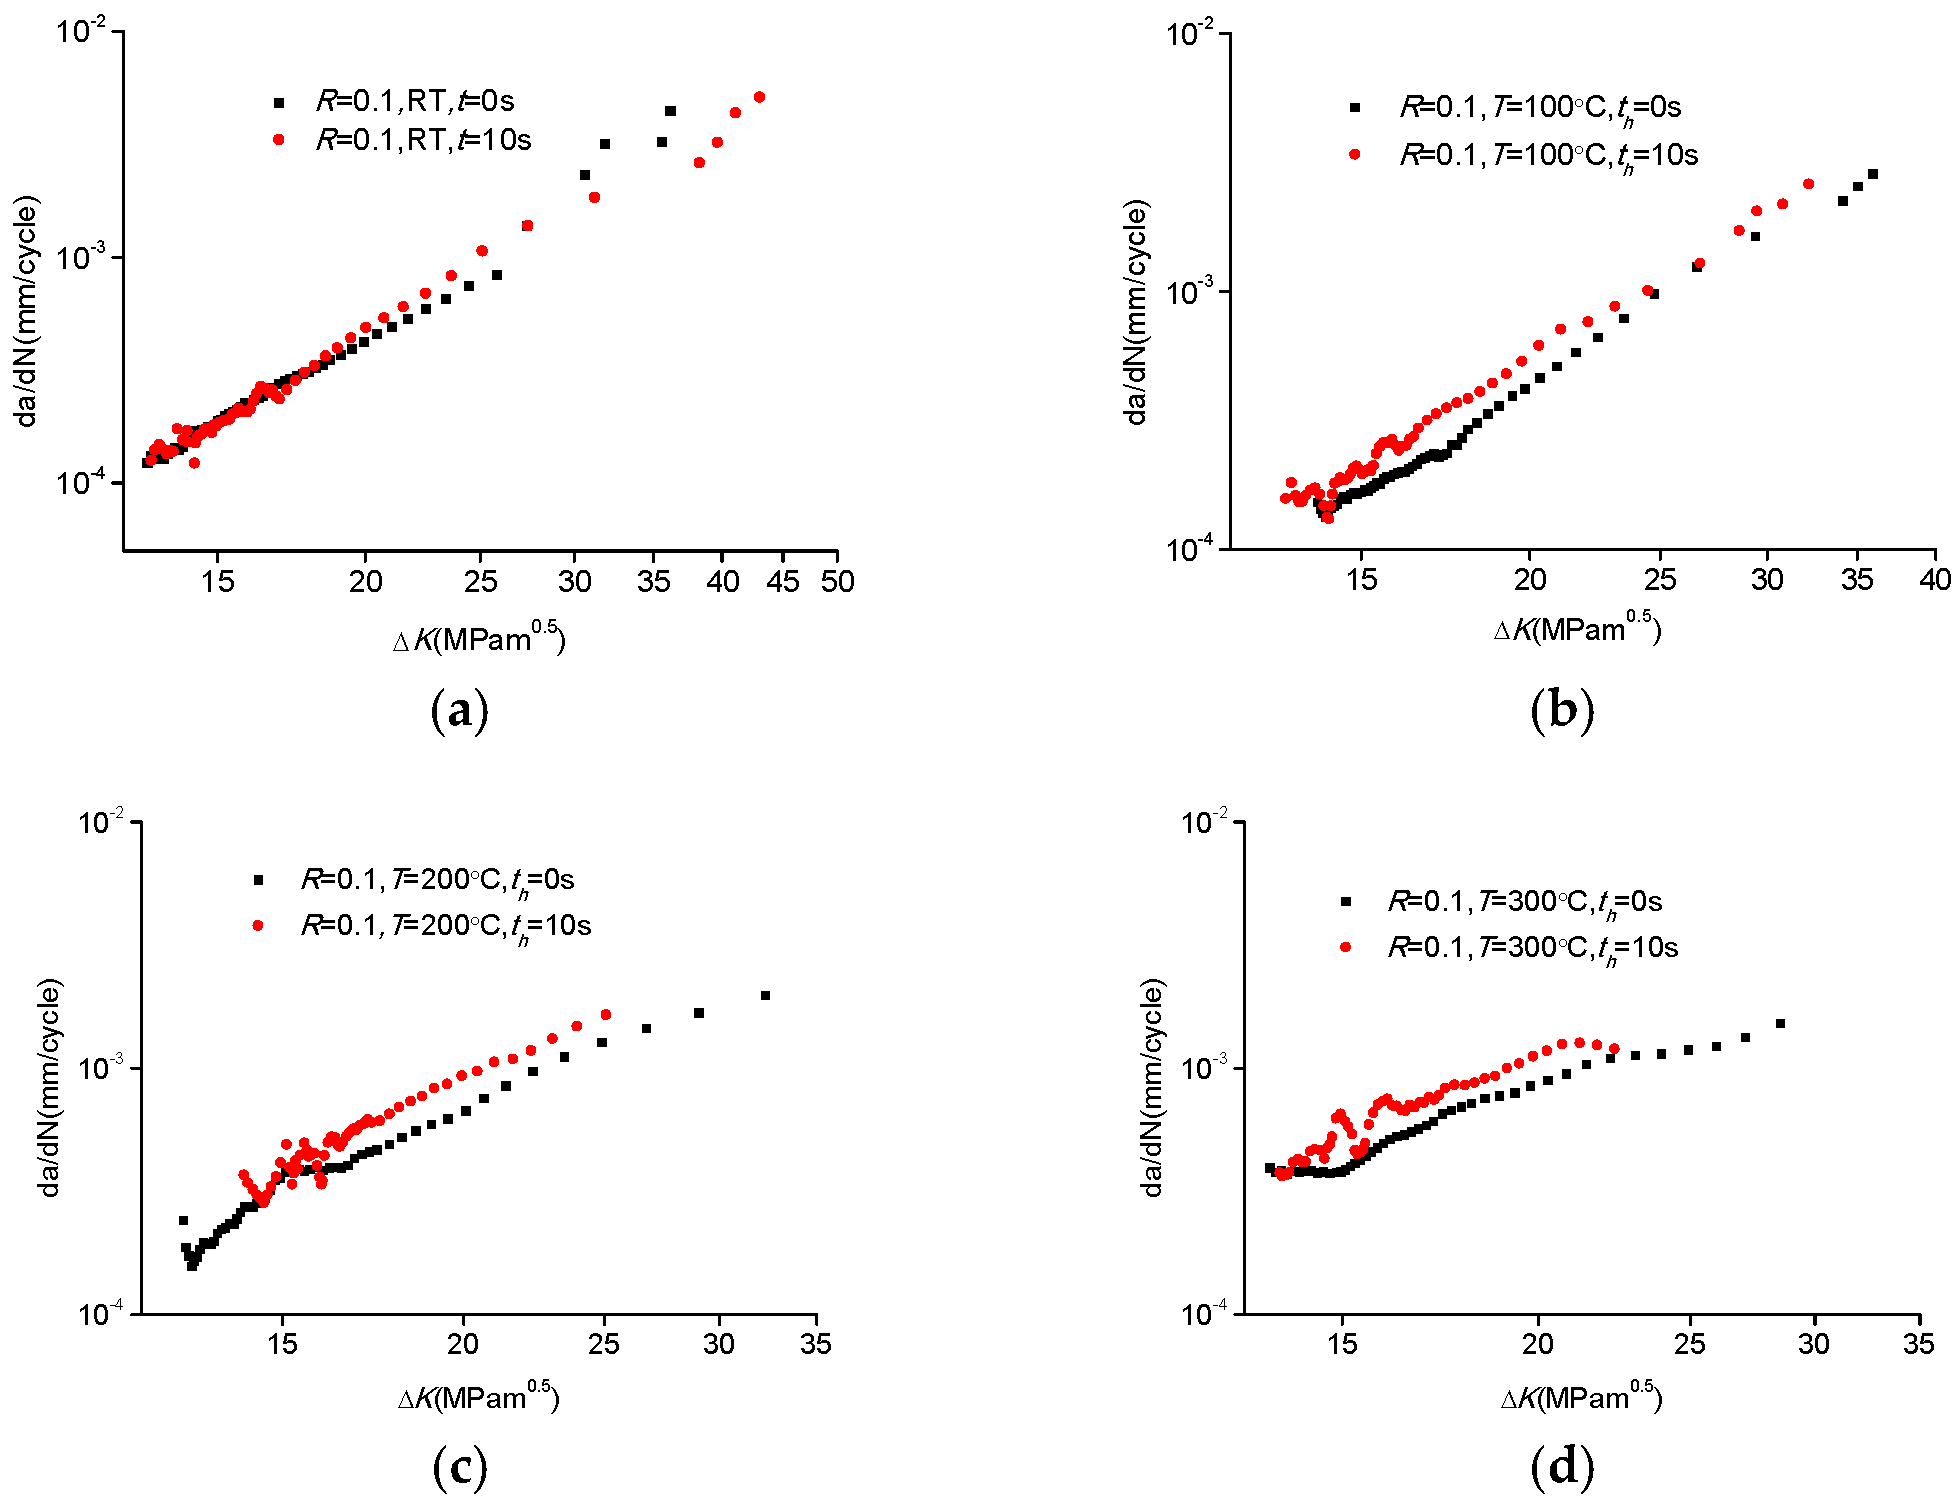
3.3. Effect of Dwell Time on the FCG Behavior of CP-Ti

For common alloys, the FCG rate increases with dwell time at high temperature. However, the FCG rate of titanium alloys is affected by dwell time at room temperature [11].
As shown in Figure 11, except for the RT condition, the dwell fatigue crack growth rate was higher than that of the pure fatigue under low load ratio. From room temperature to 300 °C, the effect of dwell time on the FCG rate gradually increased.
Figure 12 shows that the enhancement of the FCG rate by dwell time first increased from room temperature to 200 °C and then stopped increasing at 300 °C under high load ratio. Compared with low load ratio, the effect of dwell time was smaller in FCG initial stage from room temperature to 100 °C but it began to gradually increase in the steady stage and final stages. In addition, the effect of dwell time on the FCG rate was most significant at 200 °C. However, the dwell fatigue crack growth rate of CP-Ti at 300 °C was close to that of pure fatigue, which might have been caused by oxidation. It was found that the dwell time effect gradually increased from room temperature to 200 °C and became more obvious as the load ratio increased. However, creep saturation inhibited FCG at 300 °C and also became more prominent as the load ratio increased.
The enhancement of the FCG rate of titanium alloys by dwell time is mainly caused by creep deformation [11]. The hold effect increases with the load ratio at room temperature for CP-Ti [15]. Moreover, according to the literature [23,24], the creep behavior of CP-Ti has a threshold stress and reaches a saturation platform in the temperature range from 20 °C to 300 °C. In addition, the creep phenomenon becomes more obvious under high load ratio. Besides, 300 °C is the upper temperature limit for creep behavior of CP-Ti. CP-Ti is affected by significant oxidation, which leads to crack tip and grain boundary oxidative embrittlement at high temperatures [16,17].
As shown in Figure 11, under low load ratio at room temperature, the dwell time had no obvious effect on the FCG rate due to slow creep deformation and low creep saturation platform of CP-Ti. At 100 °C, the dwell time had an effect on the FCG when the creep deformation of CP-Ti was accelerated and the creep saturation platform was increased. At 200 °C, the creep deformation of CP-Ti saturation platform was the highest. Therefore, the dwell time significantly enhanced the FCG rate. Although CP-Ti achieved a less saturated creep deformation in a shorter time at 300 °C, the dwell FCG of CP-Ti still increased significantly because the oxidative embrittlement was faster than the oxidation-induced crack closure effect.
As shown in Figure 12, under high load ratio, the creep deformation was enhanced from room temperature to 200 °C, resulting in an increase of the FCG rate compared with that under low load ratio. However, the oxidation-induced crack closure effect basically offset the creep deformation and oxidative embrittlement of CP-Ti at 300 °C. Therefore, there was no obvious change of FCG rate between pure fatigue and dwell fatigue conditions at 300 °C.

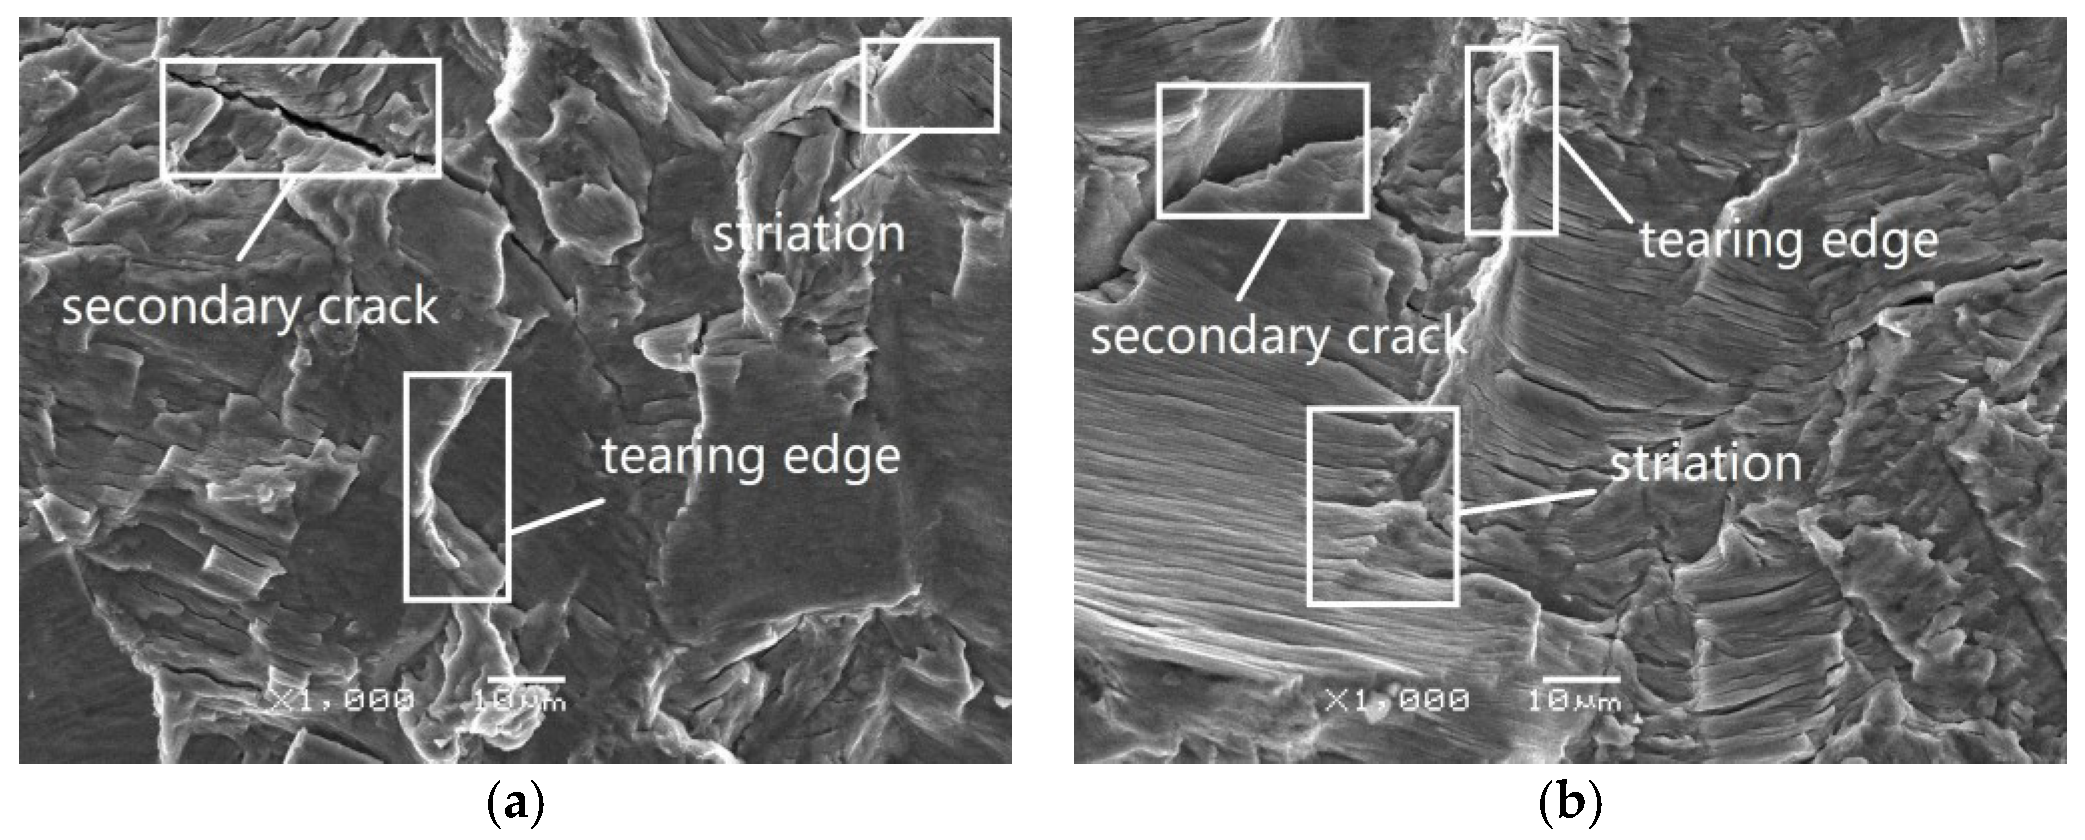
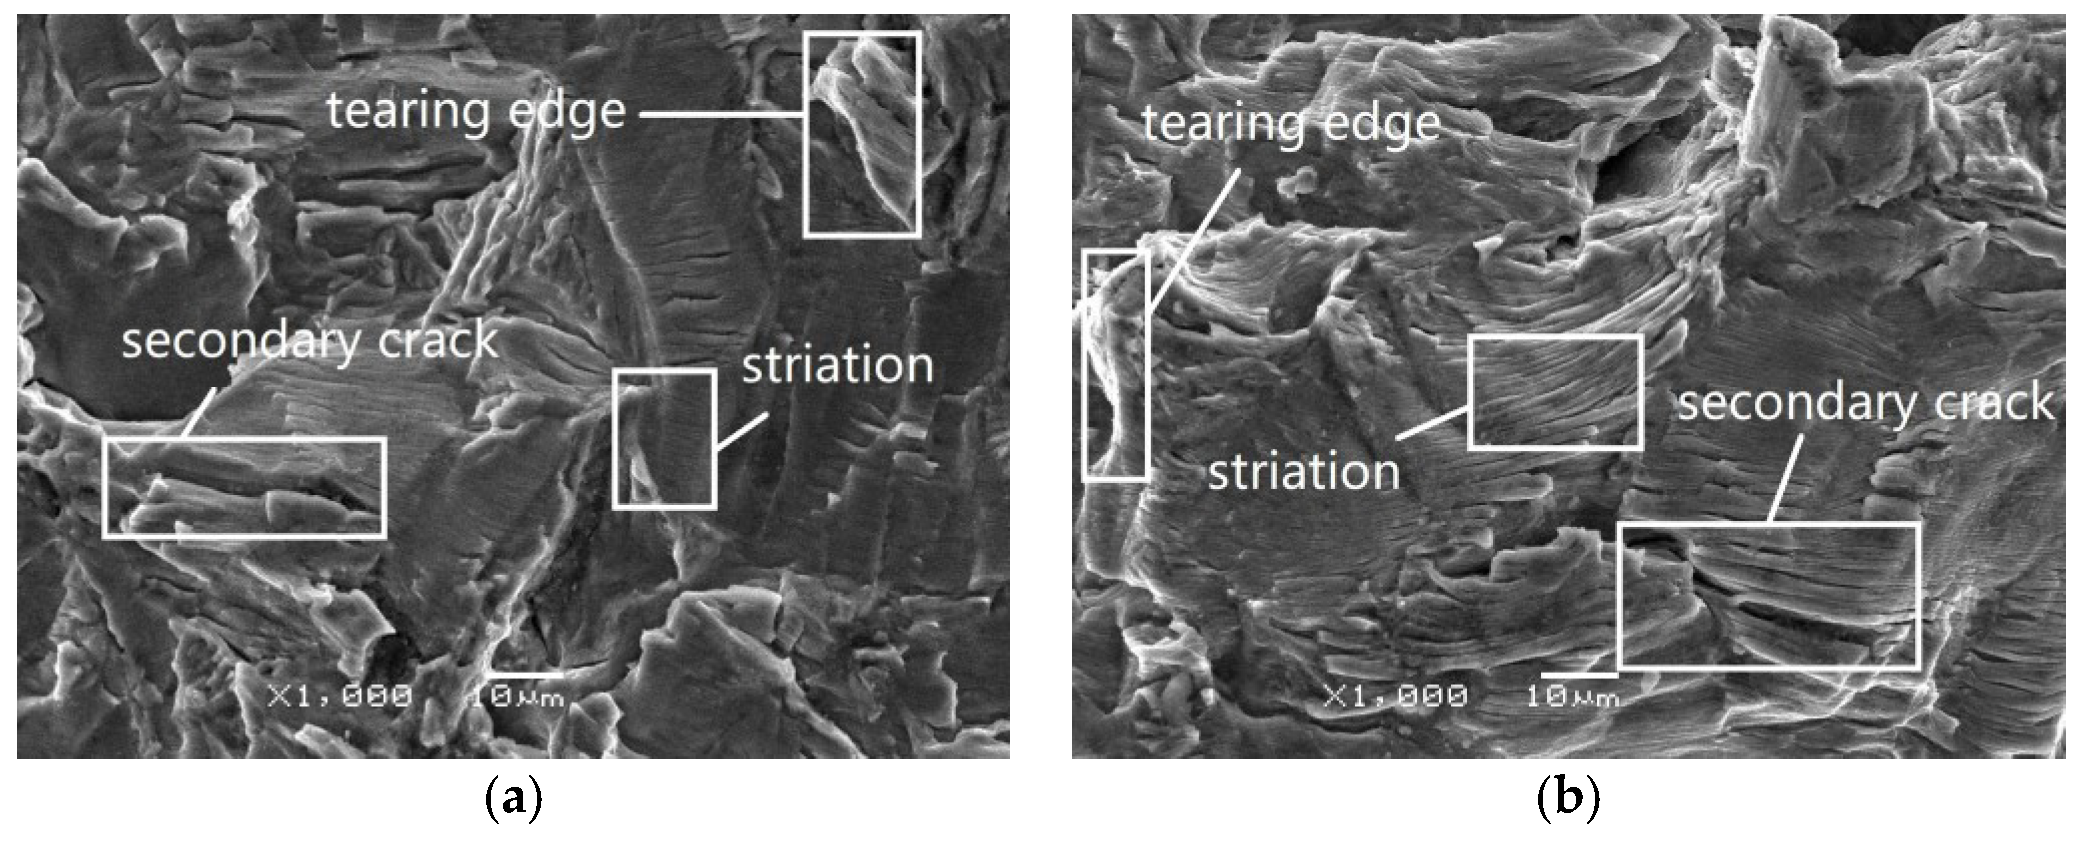
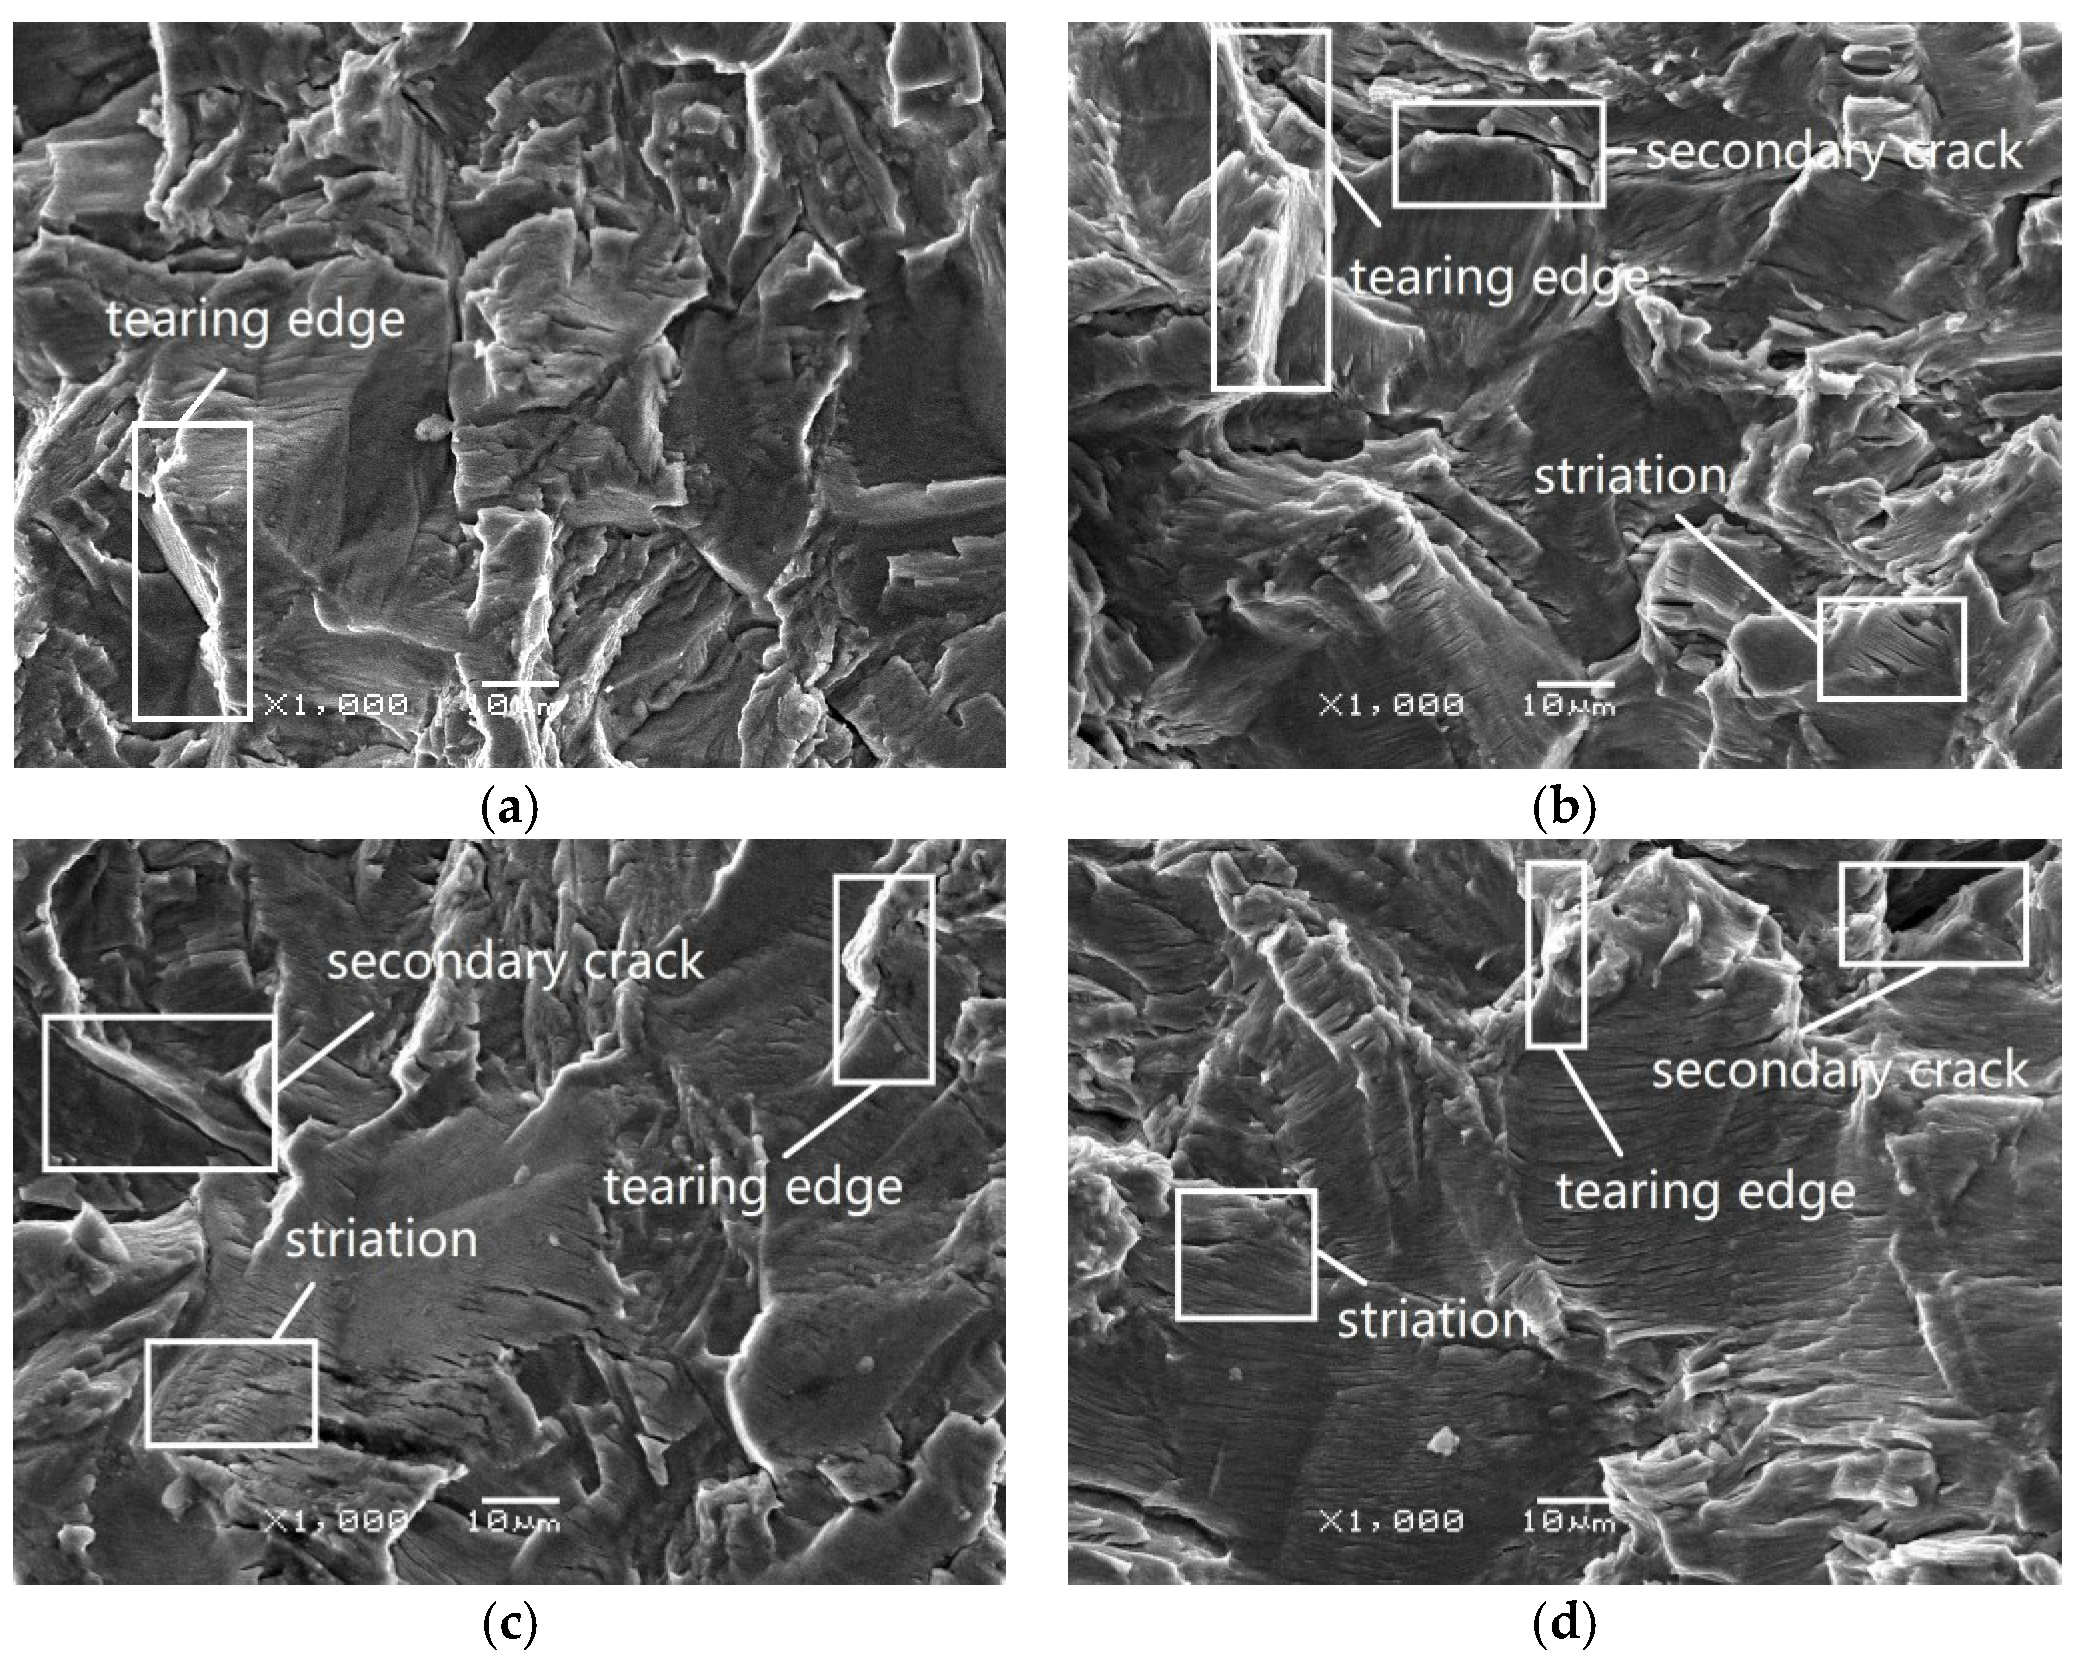
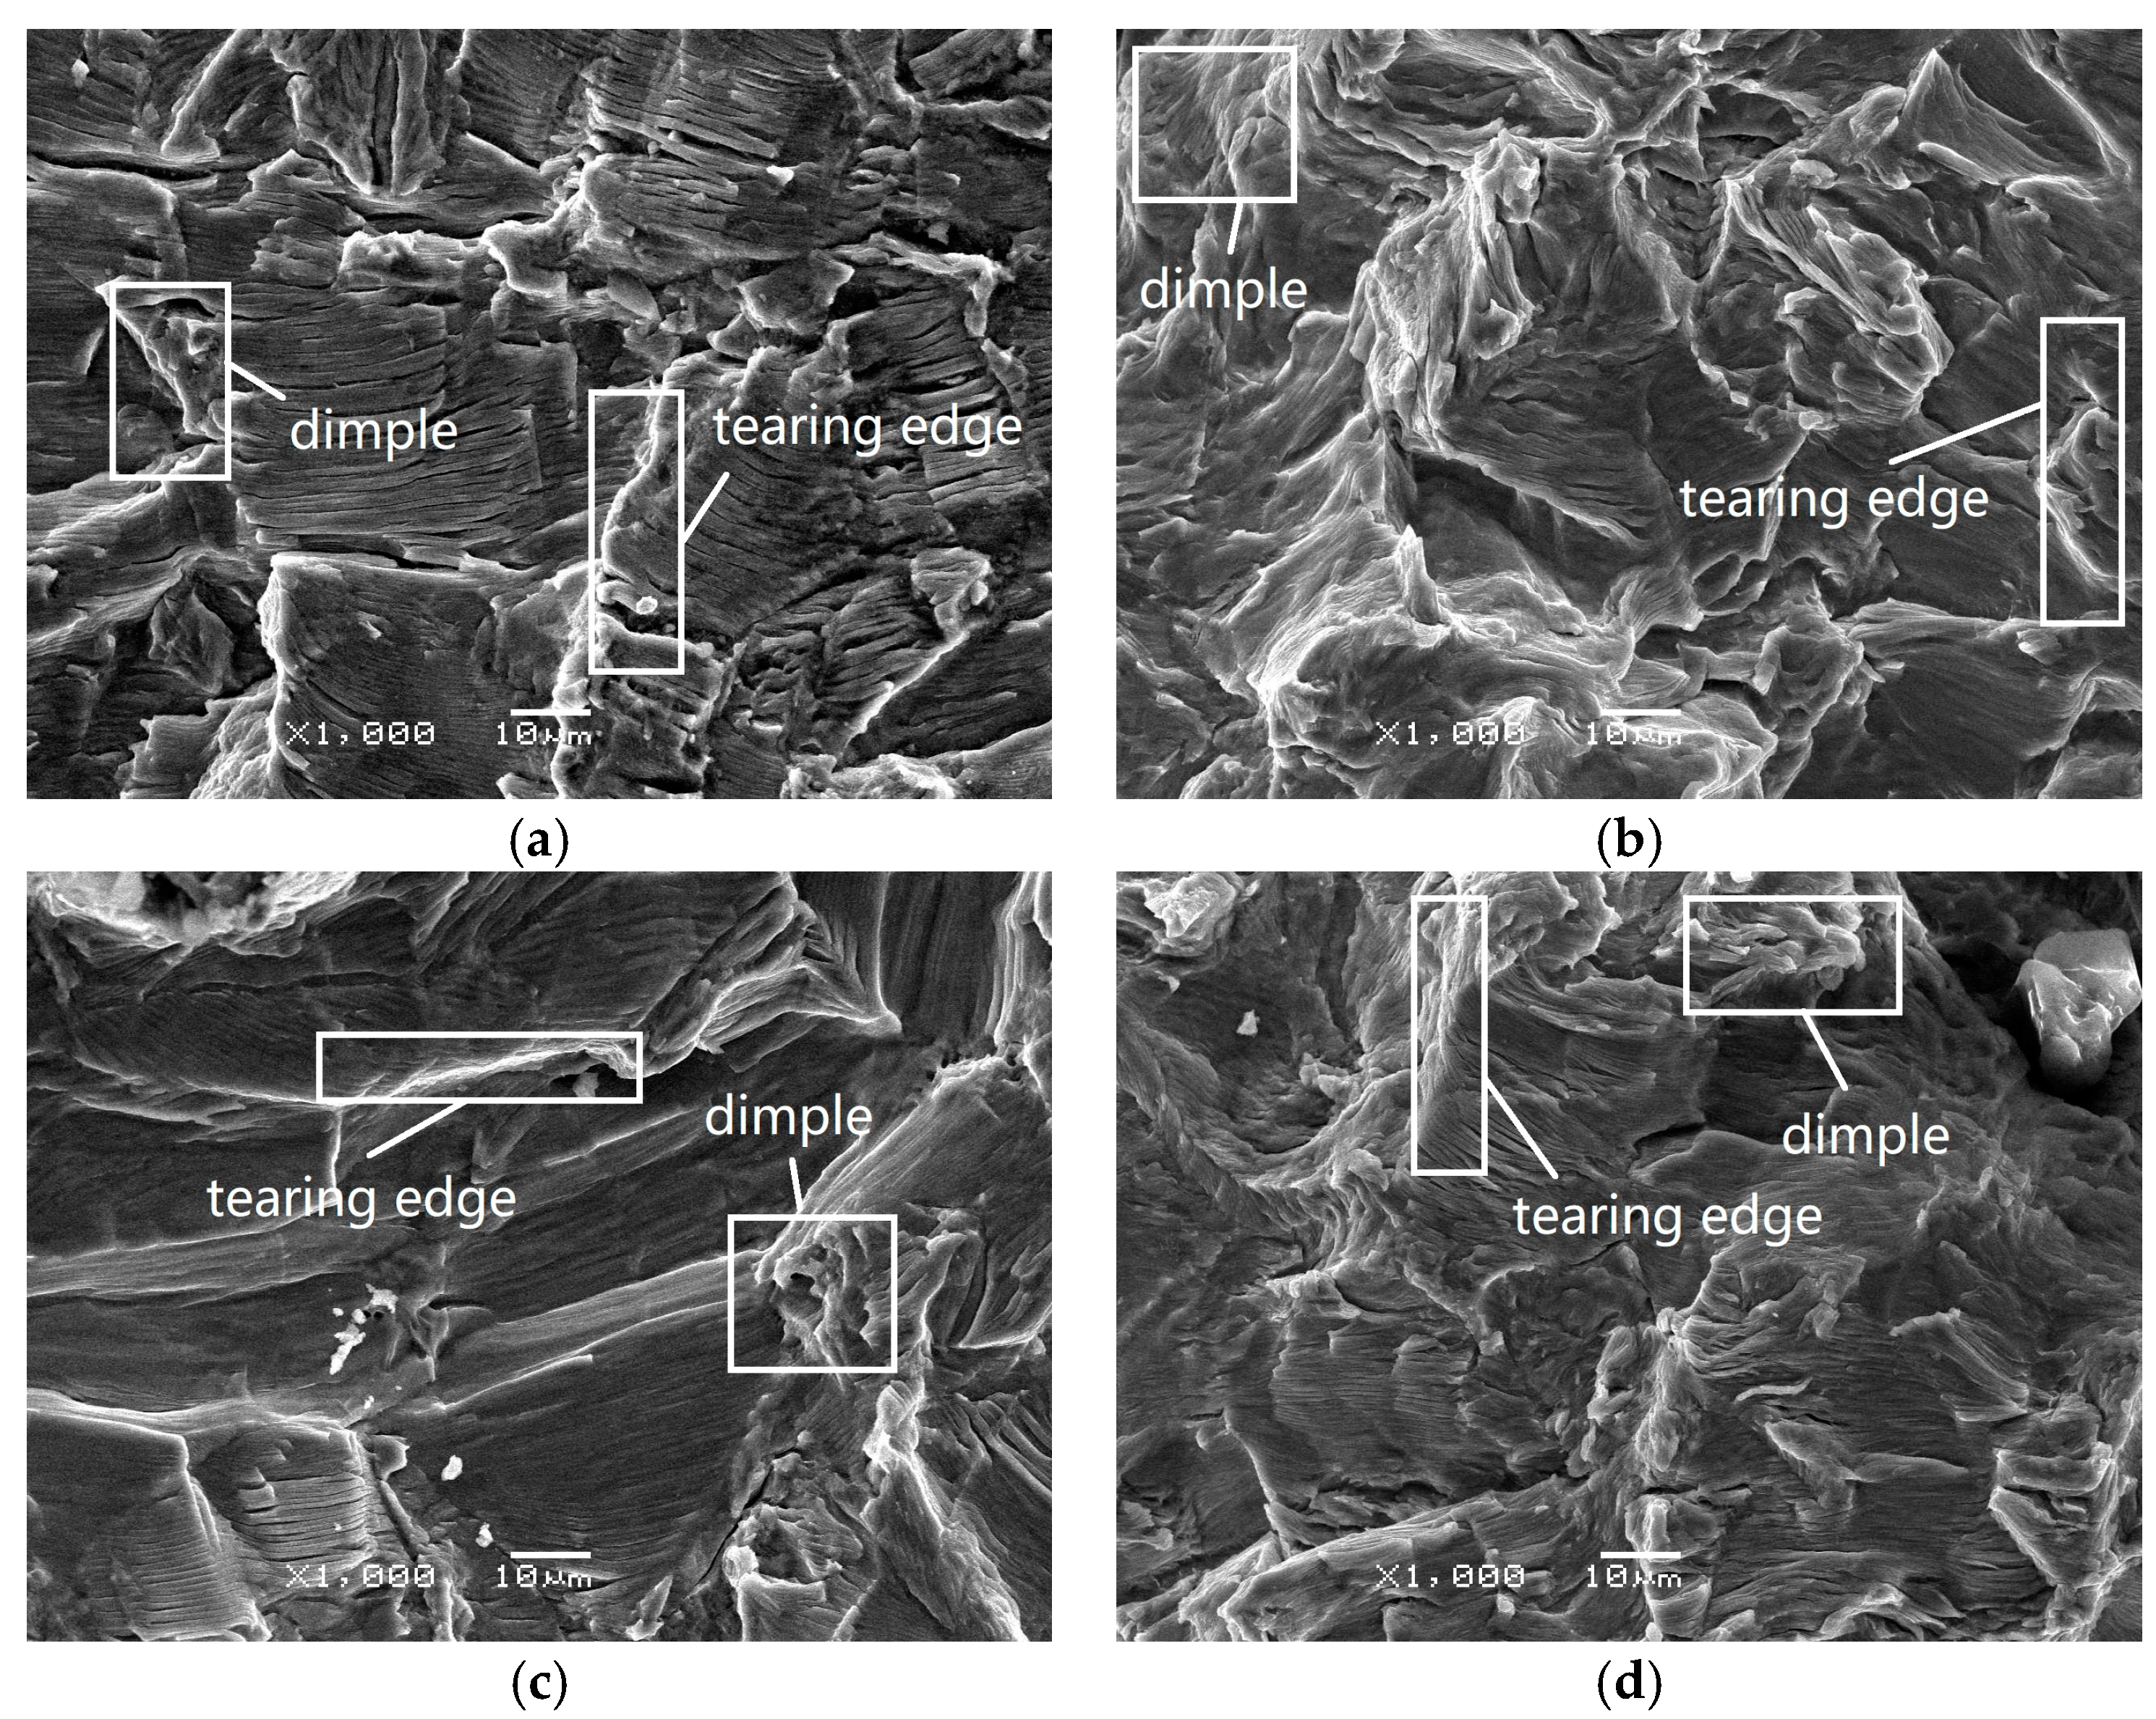
3.4. SEM Observation of the Fracture Surface

The fracture surface morphology under different load ratios at different temperatures is shown in Figure 13, Figure 14, Figure 15, Figure 16 and Figure 17. Under low load ratio, the temperature had a significant effect on the fracture surface morphology of CP-Ti.
As shown in Figure 13, the fatigue fracture mode had typical linear elastic fracture characteristics in pure fatigue under low load ratio. Moreover, there were tearing edges and steep facets of quasi-cleavage fracture characteristics. However, as the energy of the crack tip was released rapidly, there were many secondary cracks, and the length or depth of some secondary cracks increased with temperature. It is a typical fracture surface morphology of high-temperature FCG of titanium alloy [4]. Besides, the width of the fatigue striations of fracture surface increased and there was a more concentrated area of fatigue striations. In addition, the overall roughness of the fracture surface was increased. According to related studies [25], the increase of fracture surface roughness is due to the increased FCG rate.
As shown in Figure 14, for the dwell fatigue under low load ratio, there was a certain degree of quasi-cleavage fracture characteristics in the initial stage of fracture surface morphology due to creep deformation, which was more significant at 300 °C. There were more secondary cracks compared with Figure 13. Besides, some secondary cracks and the concentrated area of fatigue striations were further enlarged with the increasing temperature. The reason is that the creep damage in the crack tip region during the dwell fatigue crack growth increases with the temperature [26].
Secondary cracks and fatigue striations are more obvious with increasing temperature and dwell time as the load ratio increases. The effect of the creep on the FCG is also enhanced. Besides, plastic deformation becomes more pronounced in the final stage [25].
As shown in Figure 15, the quasi-cleavage feature of the fracture surface morphology under high load ratio was more obvious than under low load ratio in the initial stage.
As shown in Figure 16, under high load ratio, the quasi-cleavage fracture characteristics of fracture surface of dwell-fatigue condition was obvious in the initial stage, while it was similar to that in the steady stage under low load ratio.
As shown in Figure 17, under high load ratio, there were many dimples and plastic slip bands around the dimples in the final stage at different temperatures, under pure fatigue and dwell fatigue conditions. At the same time, the number of dimples increased and gradually became larger and deeper as the temperature increased or a dwell time was present. It is shown that both high temperature and dwell time caused plastic deformation characteristics in the FCG under high load ratio. Furthermore, this was due to the high stress intensity in front of the crack tip.

4. Conclusions

In this paper, the effects of temperature and dwell time on FCG were investigated at different temperatures under two load ratios. Moreover, the effect of creep on FCG at different temperatures was clearly described. Finally, combined with the fracture surface morphology, the specific characteristics of the FCG rate of CP-Ti were analyzed under pure fatigue and dwell fatigue conditions. As indicated by the above detailed results and discussion, our conclusions are as follows:
(1)
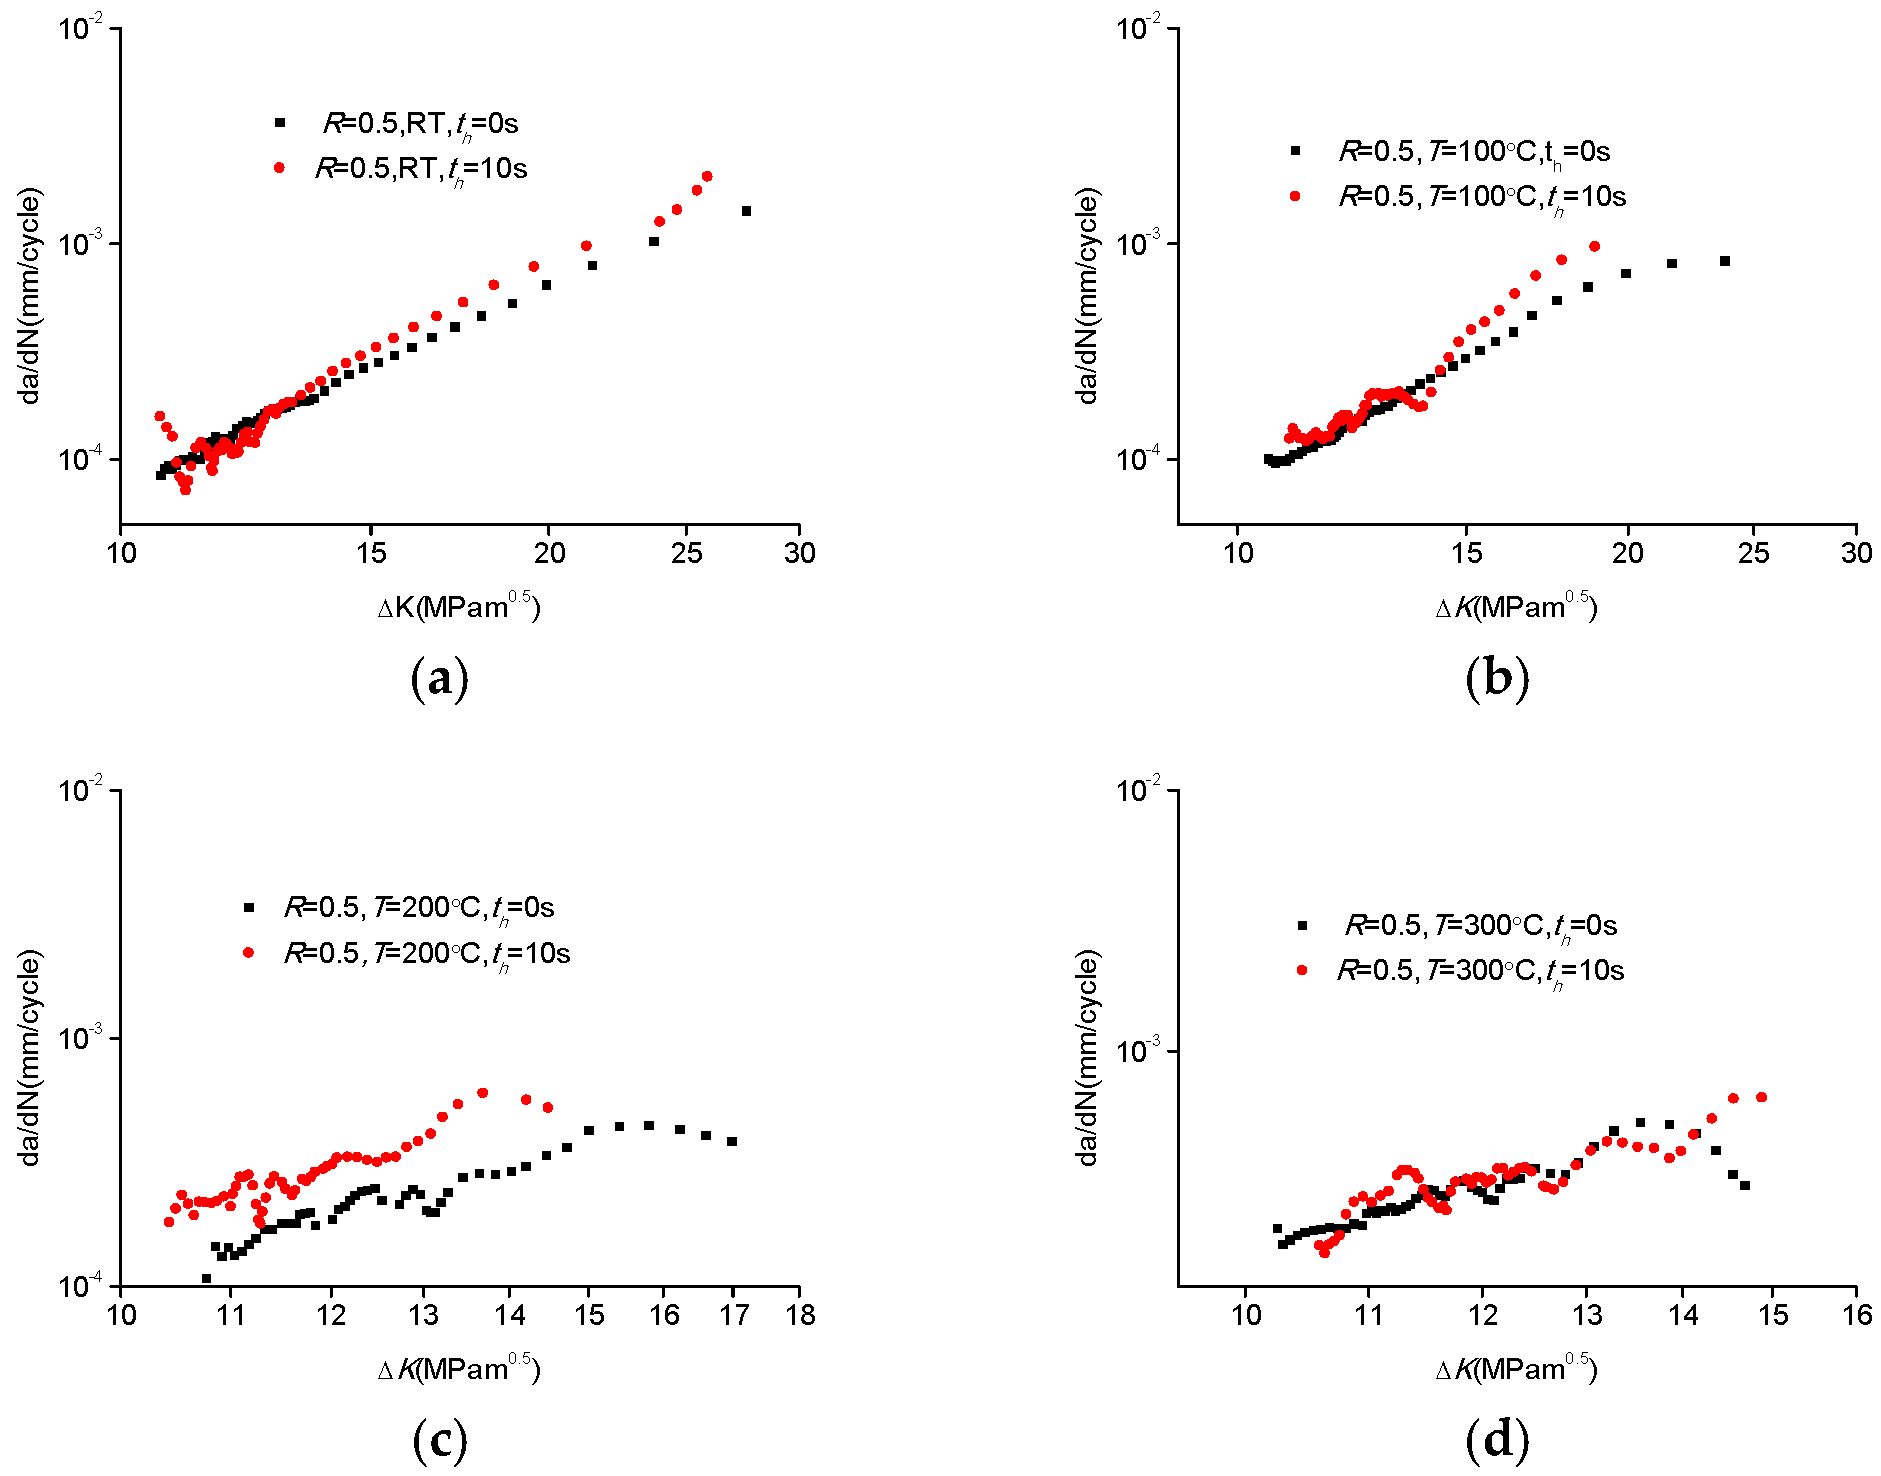
Considering the temperature sensitivity of pure fatigue and dwell fatigue crack growth behavior of CP-Ti, the overall FCG rate increased with temperature under low load ratio. Under high load ratio, the FCG rate of CP-Ti was much higher than under low load ratio.
(2)
The da/dN–ΔK/E FCG curves of CP-Ti had a tendency to approach each other under different load ratios, which indicated that E-modulus is an important reason for the difference of FCG behavior. The oxidation resistance of CP-Ti obviously weakened with temperature increase. Besides, the overall oxidation effect on the crack tip and the grain boundary was higher than the oxidation-induced crack closure effect, which led to the FCG rate increase at different temperatures under different load ratios.
(3)
The dwell fatigue crack growth rate was higher than that of pure fatigue under low load ratio, and the creep deformation mechanism of CP-Ti played a major role in the dwell fatigue crack growth behavior from room temperature to 300 °C. Under high load ratio, the effect of dwell time on the FCG rate was most significant at 200 °C. However, the dwell FCG rate of CP-Ti at 300 °C was almost close to that of pure fatigue due to creep saturation and oxidation-induced crack closure.
(4)
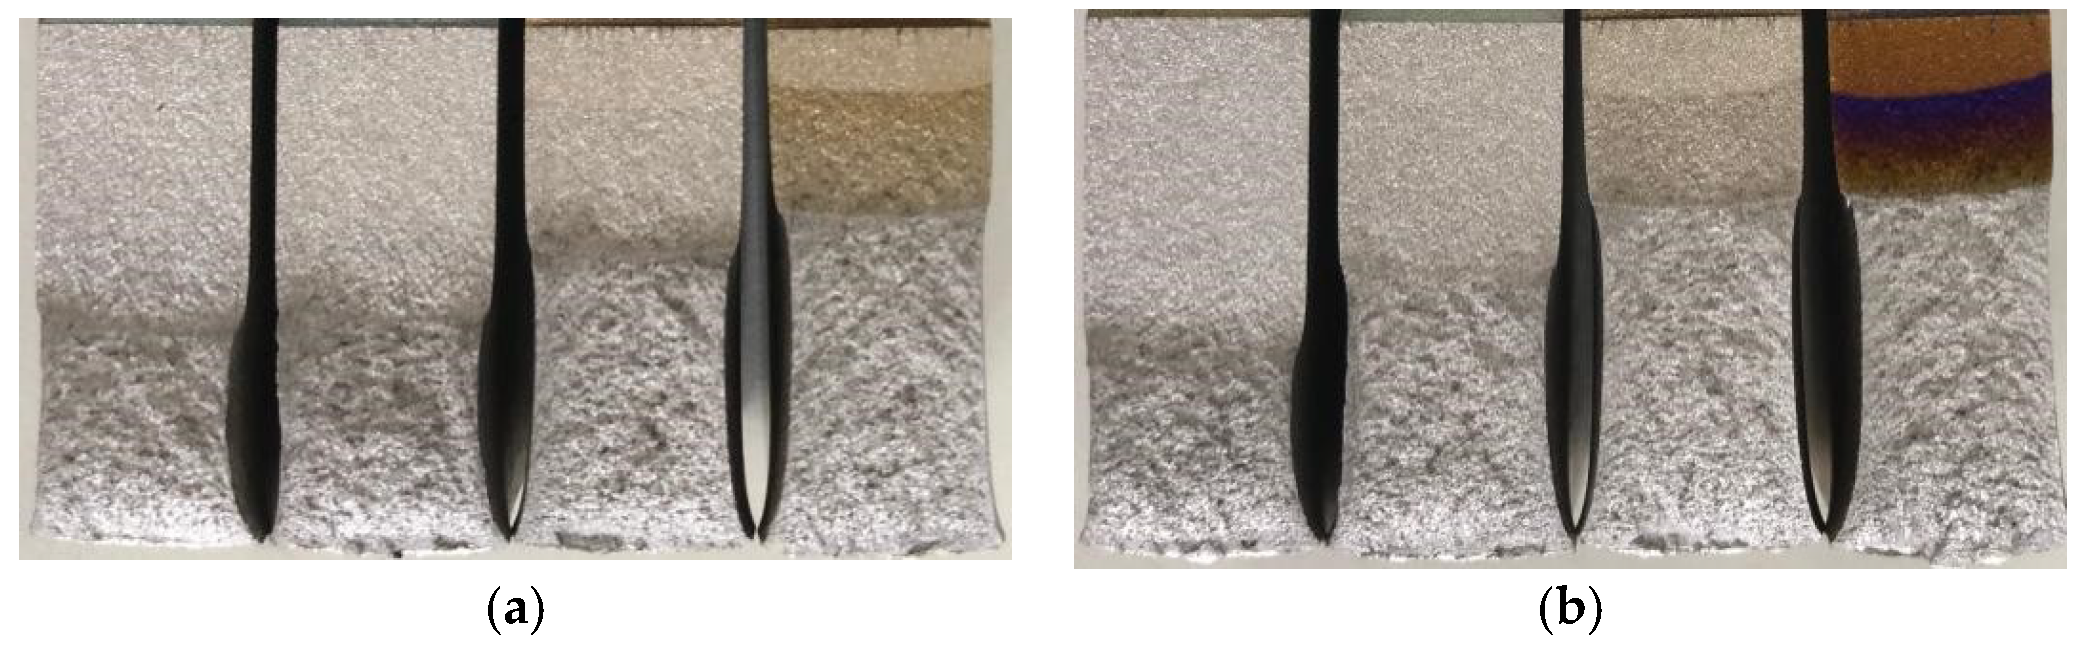
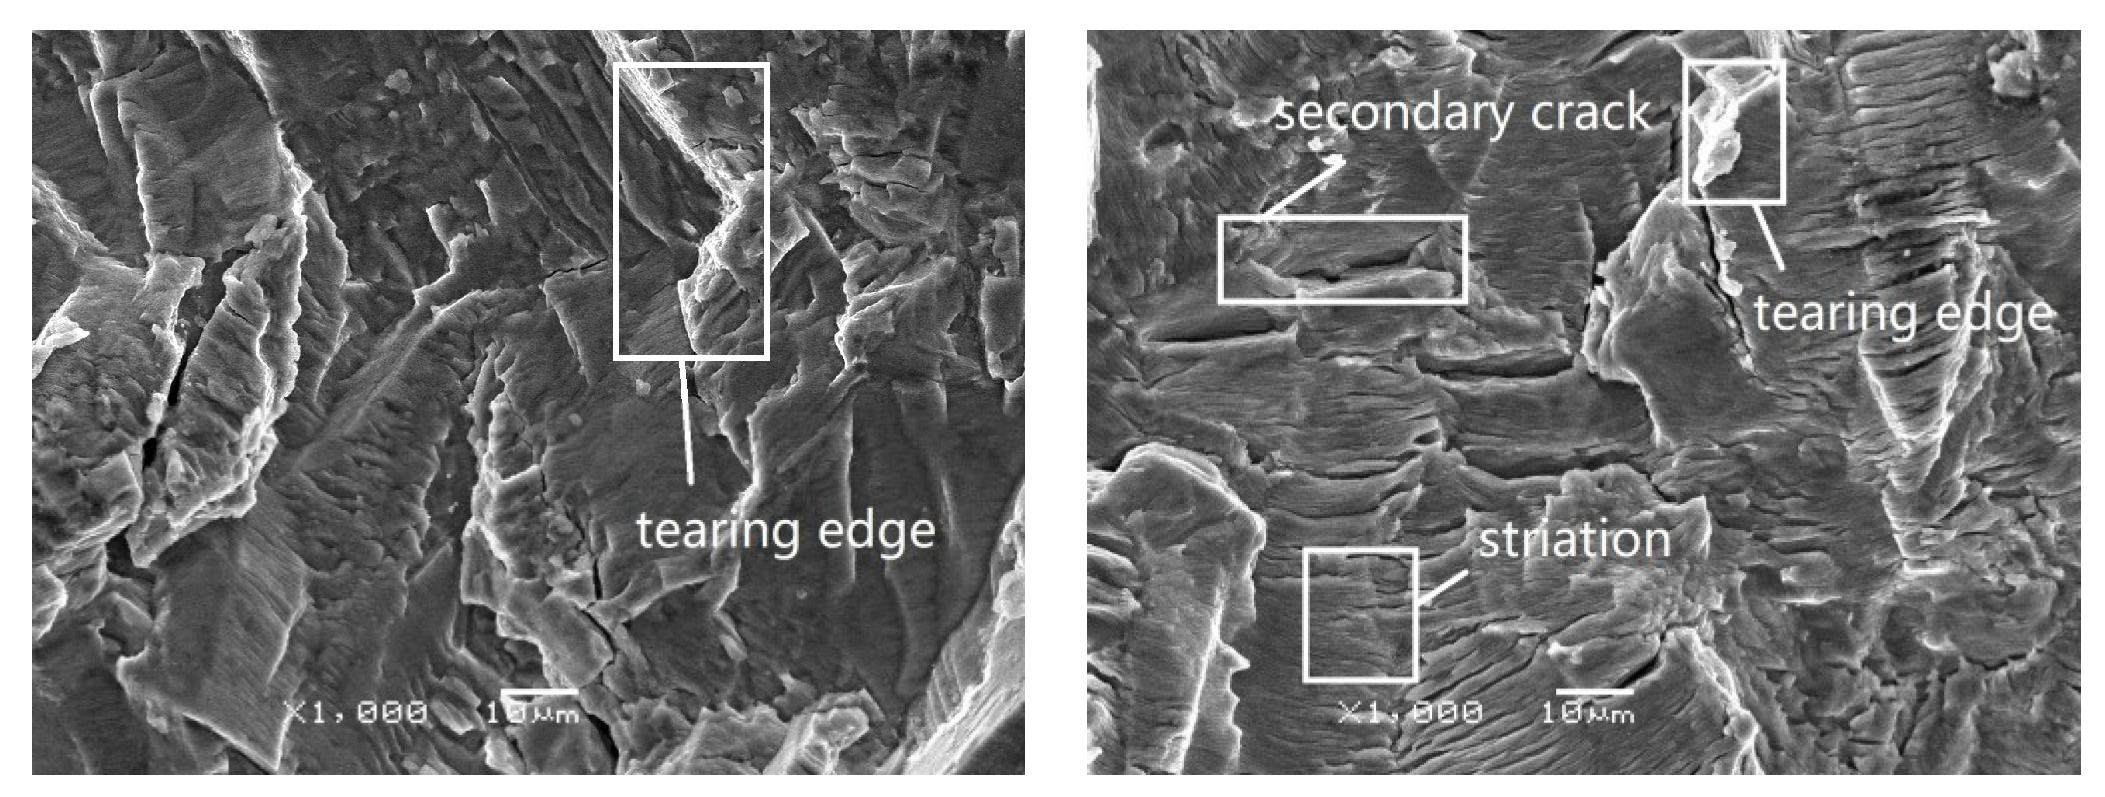
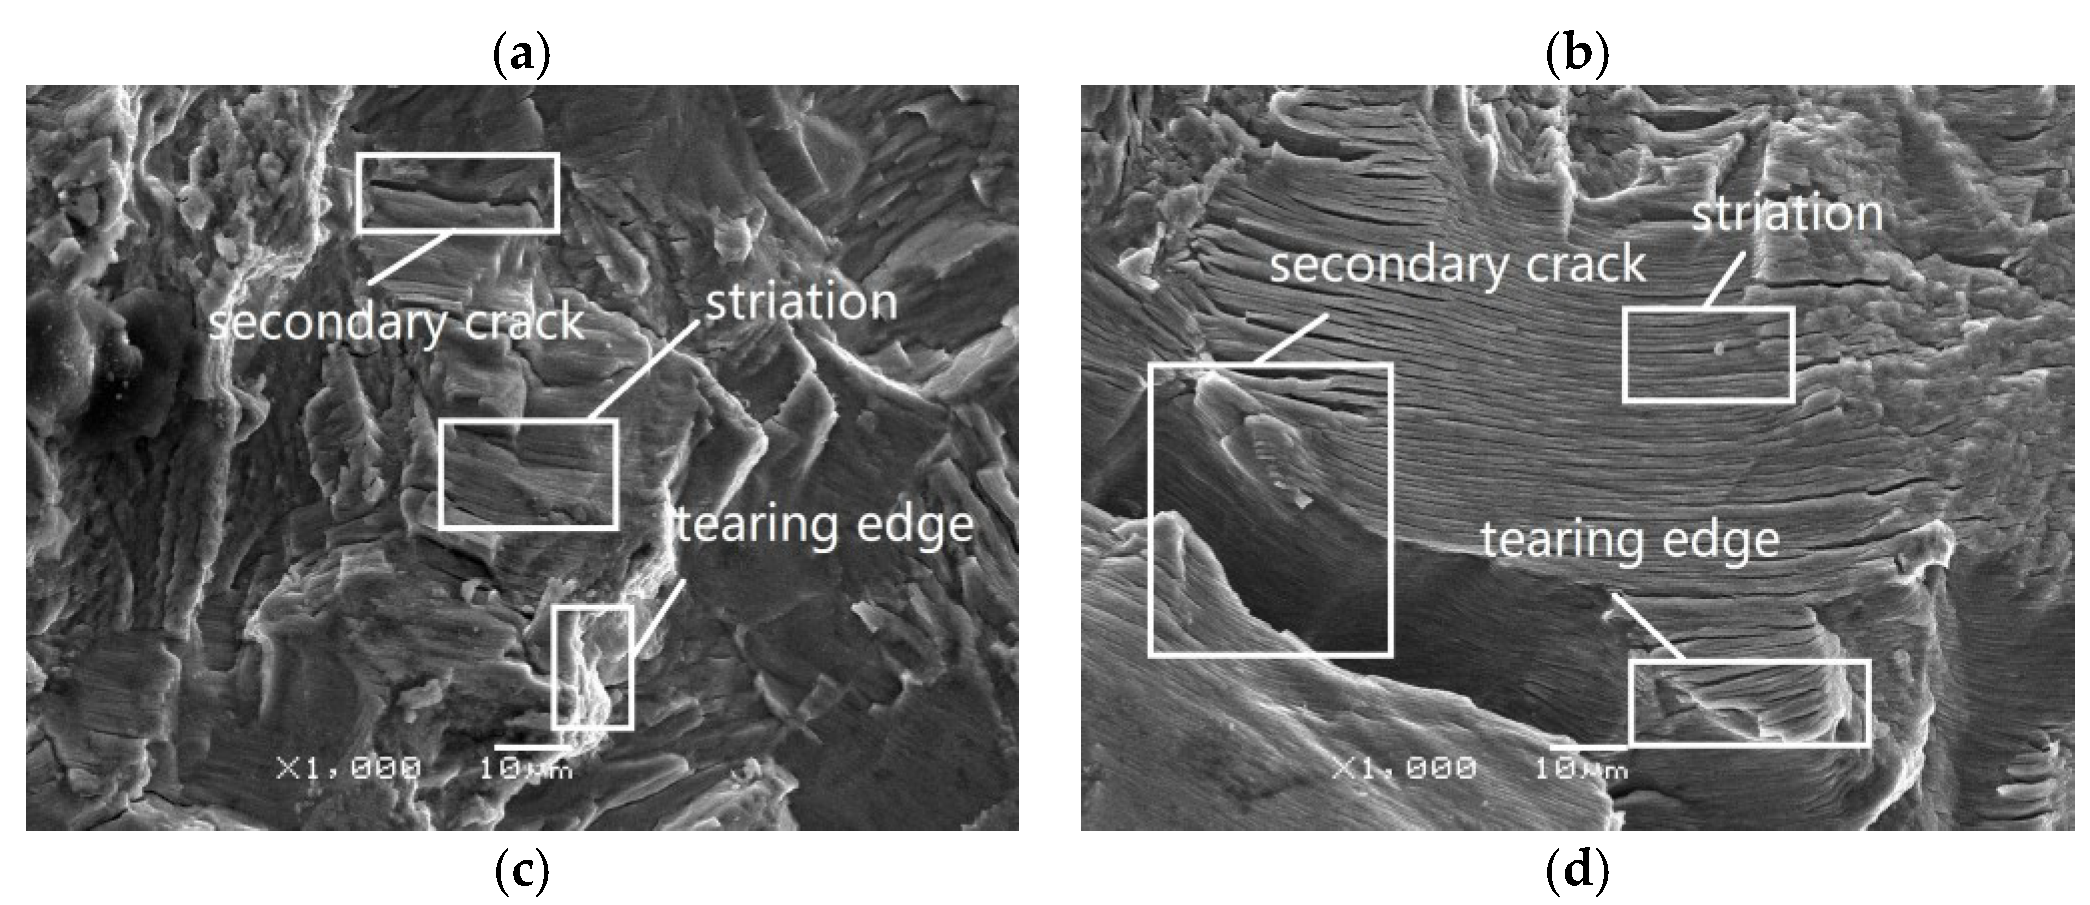
For the pure fatigue condition under low load ratio, there was no difference in the fracture surface morphology, which means that the fatigue fracture mode has typical linear elastic fracture characteristics. Besides, there were many secondary cracks, and the length or depth of some secondary cracks increased with the temperature. Under high load ratio, the secondary cracks and fatigue striations were more obvious with the increase of temperature and dwell time, as the load ratio increased. The effect of the creep on the FCG was also enhanced. Besides, plastic deformation became more pronounced in the final stage.

Author Contributions

Conceptualization, C.-Y.S. and C.-Y.Z.; methodology, C.-Y.S.; software, C.-Y.S.; validation, C.-Y.S., C.-Y.Z. and L.L.; formal analysis, C.-Y.S.; investigation, C.-Y.S.; resources, L.L.; data curation, P.-Y.S.; writing-original draft preparation, J.L.; writing-review and editing, C.-Y.Z.; visualization, J.L.; supervision, P.-Y.S.; project administration, X.-H.H.

Funding

This research was funded by [National Natural Science Foundation of China] grant number [51475223, 51675260]. And the APC was funded by [National Natural Science Foundation of China].

Conflicts of Interest

The authors declare no conflict of interest.

References

  1. Li, J.; Zhang, P.; Lu, L.; Lv, F.; Miao, X.T.; Chang, L.; Zhou, B.B.; He, X.H. Effect of pre-strain on FCG behavior for commercial pure titanium at ambient temperature. Int. J. Fatigue 2018, 117, 27–38. [Google Scholar] [CrossRef]
  2. Zhu, Y.; Xiong, J.; Lv, Z.; Zhao, Y. Testing and evaluation for fatigue crack propagation of Ti-6Al-4V/ELI and 7050-T7452 alloys at high temperatures. Chin. J. Aeronaut. 2017, 31, 1388–1398. [Google Scholar] [CrossRef]
  3. Foerch, R.; Madsen, A.; Ghonem, H. Environmental interactions in high-temperature FCG of Ti-1100. Met. Trans. A 1993, 24, 1321–1332. [Google Scholar] [CrossRef]
  4. Ogawa, T.; Hayashi, Y.; Tokaji, K.; Hirose, M. FCG of Ti-6Al-4V Alloy at Elevated Temperatures. J. Soc. Mater. Sci. Jpn. 1993, 42, 1186–1192. [Google Scholar] [CrossRef]
  5. Zhu, S.J.; Peng, L.M.; Moriya, T.; Mutoh, Y. Effect of stress ratio on FCG in TiAl intermetallics at room and elevated temperatures. Mater. Sci. Eng. A 2000, 290, 198–206. [Google Scholar] [CrossRef]
  6. Arakere, N.K.; Goswami, T.; Krohn, J.; Ramachandran, N. High Temperature FCG Behavior of Ti-6Al-4V. High Temp. Mater. Process. 2002, 21, 229–236. [Google Scholar]
  7. Sinha, V.; Mills, M.J.; Williams, J.C.; Spowart, J.E. Observations on the faceted initiation site in the dwell-fatigue tested Ti-6242 alloy: Crystallographic orientation and size effects. Met. Mater. Trans. A 2006, 37, 1507–1518. [Google Scholar] [CrossRef]
  8. Evans, W.J.; Bache, M.R. Dwell-sensitive fatigue under biaxial loads in the nearalpha titanium alloy IMI685. Int. J. Fatigue 1994, 16, 443–452. [Google Scholar] [CrossRef]
  9. Guo, T.C.; Deng, Y.L.; Zhang, X.M.; Zhong, Y.Y. Creep behavior of Mg-2Nd-0.5Zn-0.4Zr at ambient temperature. Mater. Sci. Eng. A 2010, 527, 5801–5804. [Google Scholar] [CrossRef]
  10. Neeraj, T.; Hou, D.-H.; Daehn, G.S.; Mills, M.J. Phenomenological and microstructural analysis of room temperature creep in titanium alloys. Acta Mater. 2000, 48, 1225–1238. [Google Scholar] [CrossRef]
  11. Bache, M.R.; Cope, M.; Davies, H.M.; Evans, W.J.; Harrison, G. Dwell sensitive fatigue in a near alpha titanium alloy at ambient temperature. Int. J. Fatigue 1997, 19, 83–88. [Google Scholar] [CrossRef]
  12. Lefranc, P.; Sarrazin-Baudoux, C.; Doquet, V.; Petit, J. Investigation of the dwell period’s influence on the FCG of a titanium alloy. Scr. Mater. 2009, 60, 281–284. [Google Scholar] [CrossRef]
  13. Wang, K.; Wang, F.; Cui, W.C.; Tian, A.-L. Prediction of Cold Dwell-FCG of Titanium Alloys. Acta Met. Sin. 2015, 28, 619–627. [Google Scholar] [CrossRef]
  14. Wang, Z.; Yue, Y.; Li, Y. Prediction of Load-FCG Rate of Titanium Alloy Based on Zencrack. Chin. Ocean Platf. 2018, 1, 22–28. [Google Scholar]
  15. Li, J.; Lu, L.; Zhang, P.; Miao, X.T.; Chang, L.; Zhou, B.B.; Wang, Y.Z.; He, X.H.; Zhou, C.Y. Effect of cold creep on FCG behavior for commercial pure titanium. Theor. Appl. Fract. Mech. 2018, 97, 177–188. [Google Scholar] [CrossRef]
  16. Er, Q.L.; Dong, J.X.; Zhang, M.C.; Zheng, L.; Yao, Z.H.; Qu, J.L. Temperature sensitivity of FCG rate of GH4720Li alloy. Rare Met. Mater. Eng. 2017, 46, 2915–2921. [Google Scholar]
  17. Xu, C.; Qi, Q.L.; Yao, Z.H.; Jiang, H.; Dong, J.X. Effect of grain boundary oxidation on FCG of GH4738 superalloy. Acta Met. Sin. 2017, 53, 1453–1460. [Google Scholar]
  18. ASTM. Standard Test Method for Measurement of FCG Rates (E647-15); Annual Book of ASTM Standards; ASTM: West Conshohocken, PA, USA, 2015; Volume 3, pp. 647–695. [Google Scholar]
  19. Wu, H.; Zhao, Y.Q.; Zeng, W.D.; Li, Q. FCG behavior of Ti40 alloy at different Temperatures. Rare Met. Mater. Eng. 2008, 37, 1403–1406. [Google Scholar]
  20. Soboyejo, W.O.; Deffeyes, J.E.; Aswath, P.B. Investigation of room- and elevated-temperature FCG in Ti48Al. Mater. Sci. Eng. A 1991, 138, 95–101. [Google Scholar] [CrossRef]
  21. Mabru, C.; Bertheau, D.; Pautrot, S.; Petit, J.; Henaff, G. Influence of temperature and environment on fatigue crack propagation in a TiAl-based alloy. Eng. Fract. Mech. 1999, 64, 23–47. [Google Scholar] [CrossRef]
  22. Mercer, C.; Allameh, S.M.; Lou, J.; Soboyejo, W.O. Effects of temperature on the FCG behavior of cast gamma-based titanium aluminides. Met. Mater. Trans. A 2001, 32, 2781–2794. [Google Scholar] [CrossRef]
  23. Peng, J.; Zhou, C.Y.; Dai, Q.; He, X.H. Isochronic stress-strain curve of low-temperature creep of commercial pure titanium. Rare Met. Mater. Eng. 2016, 45, 346–352. [Google Scholar]
  24. Chang, L.; Zhou, C.Y.; Peng, J.; Li, J.; He, X.H. Study on cold creep characteristics of commercial pure titanium TA2. Rare Met. Mater. Eng. 2017, 7, 1463–1468. [Google Scholar]
  25. Jiang, R.; Everitt, S.; Lewandowski, M.; Gao, N.; Reed, P.A.S. Grain size effects in a Ni-based turbine disc alloy in the time and cycle dependent crack growth regimes. Int. J. Fatigue 2014, 62, 217–227. [Google Scholar] [CrossRef]
  26. Lu, Y.L.; Chen, L.J.; Liaw, P.K.; Wang, G.Y.; Brooks, C.R.; Thompson, S.A.; Blust, J.W.; Browning, P.F.; Bhattacharya, A.K.; Aurrecoechea, J.M.; et al. Effects of temperature and hold time on creep-fatigue crack-growth behavior of HAYNES® 230® alloy. Mater. Sci. Eng. A 2006, 429, 1–10. [Google Scholar] [CrossRef]
Figure 1. Schematic drawing of the tensile specimen.
Metals 08 01031 g001
Figure 2. Schematic drawing of the standard compact tensile (CT) specimen.
Metals 08 01031 g002
Figure 3. Optical micrograph of CP-Ti.
Metals 08 01031 g003
Figure 4. Schematic drawing of the loading waveforms: (a) triangular for the pure fatigue loading; (b) trapezoidal for the dwell fatigue loading.
Metals 08 01031 g004
Figure 5. FCG behavior of CP-Ti at different temperatures under low load ratio: (a) pure fatigue; (b) dwell fatigue.
Metals 08 01031 g005
Figure 6. FCG behavior of CP-Ti at different temperatures under high load ratio: (a) pure fatigue; (b) dwell fatigue.
Metals 08 01031 g006
Figure 7. Diagrams of da/dN–ΔK/E FCG curves of CP-Ti at different temperatures under low load ratio: (a) pure fatigue; (b) dwell fatigue.
Metals 08 01031 g007
Figure 8. Diagrams of da/dN–ΔK/E FCG curves of CP-Ti at different temperatures under high load ratio: (a) pure fatigue; (b) dwell fatigue.
Metals 08 01031 g008
Figure 9. Macroscopic fracture surface under low load ratio: (a) pure fatigue; (b) dwell fatigue (the temperature increases from left to right).
Metals 08 01031 g009
Figure 10. Macroscopic fracture surface under high load ratio: (a) pure fatigue; (b) dwell fatigue (the temperature increases from left to right).
Metals 08 01031 g010
Figure 11. The effect of dwell time on CP-Ti FCG at different temperatures under low load ratio: (a) RT; (b) 100 °C; (c) 200 °C; (d) 300 °C.
Metals 08 01031 g011
Figure 12. The effect of dwell time on CP-Ti FCG at different temperatures under high load ratio: (a) RT; (b) 100 °C; (c) 200 °C; (d) 300 °C.
Metals 08 01031 g012
Figure 13. Typical SEM micrographs showing pure fatigue fracture surface morphology at different temperatures under low load ratio:(a) steady stage, room temperature; (b)steady stage, T = 300 °C.
Metals 08 01031 g013
Figure 14. Typical SEM micrographs showing dwell fatigue fracture surface morphology at different temperatures under low load ratio: (a) initial stage, room temperature; (b) initial stage, T = 300 °C; (c) steady stage, room temperature; (d) steady stage, T = 300 °C.
Metals 08 01031 g014aMetals 08 01031 g014b
Figure 15. Typical SEM micrographs showing pure fatigue fracture surface morphology at different temperatures under high load ratio: (a) steady stage, room temperature; (b) steady stage, T = 300 °C.
Metals 08 01031 g015
Figure 16. Typical SEM micrographs showing dwell fatigue fracture surface morphology at different temperatures under high load ratio: (a) initial stage, room temperature; (b) initial stage, T = 300 °C, (c) steady stage, room temperature; (d) steady stage, T = 300 °C.
Metals 08 01031 g016
Figure 17. Typical SEM micrographs showing dwell fatigue fracture surface morphology in the final stage at different temperatures under high load ratio: (a) room temperature, td = 0 s; (b) T = 300 °C, td = 0 s; (c) room temperature, td = 10 s; (d) T = 300 °C, td = 10 s.
Metals 08 01031 g017
Table 1. Chemical composition of commercial pure titanium (CP-Ti) (weight %).
FeCNHOTi
0.080.010.020.0010.01Other
Table 2. Mechanical properties of CP-Ti.
Temperature (°C)E-Modulus (MPa)Yield Strength (MPa)Ultimate Strength (MPa)Elongation (%)
RT104,000303.2413.423.6
10096,250258.4351.522.5
20092,000175.3248.138.8
30089,000105.9185.935.3
Table 3. Scheme of Fatigue Crack Growth (FCG) tests of CP-Ti under different load ratios and temperatures.
Specimen No.Load RatioTemperature (°C)Dwell Time (s)
001Low (0.1)RT0
002--10
003-1000
004--10
005-2000
006--10
007-3000
008--10
009High (0.5)RT0
010--10
011-1000
012--10
013-2000
014--10
015-3000
016--10

