Fatigue Damage Accumulation Modeling of Metals Alloys under High Amplitude Loading at Elevated Temperatures


Abstract
:1. Introduction
2. Materials and Methods
2.1. Fatigue Life of EN AW-2024T3 Aluminum Alloy at Elevated Temperatures
2.2. Modeling of Damage Accumulation and Fracture of Material at Elevated Temperatures
3. Results
4. Conclusions
Author Contributions
Funding
Conflicts of Interest
References
- Tomczyk, A.; Seweryn, A.; Gradzka-Dhalke, M. The effect of dynamic recrystallization on monotonic and cyclic behaviour of Al-Cu-Mg alloy. Materials 2018, 11, e874. [Google Scholar] [CrossRef] [PubMed]
- Juijerm, P.; Altenberger, I. Effect of temperature on cyclic deformation behavior and residual stress relaxation of deep rolled under-aged aluminium alloy AA6110. Mater. Sci. Eng. 2007, 452–453, 475–482. [Google Scholar] [CrossRef]
- Karakas, O.; Szusta, J. Monotonic and Low Cycle Fatigue Behaviour of 2024-T3 Aluminium Alloy between Room Temperature and 300 °C for Designing VAWT Components, Fatigue. Fract. Eng. Mater. Struct. 2016, 39, 95–109. [Google Scholar]
- Szusta, J.; Seweryn, A. Damage accumulation modeling under uniaxial low cycle fatigue at elevated temperatures. Eng. Fail. Anal. 2015, 56, 474–483. [Google Scholar] [CrossRef]
- Szusta, J.; Seweryn, A. Experimental study of the low-cycle fatigue life under multiaxial loading of aluminum alloy EN AW-2024-T3 at elevated temperatures. Int. J. Fatigue 2017, 96, 28–42. [Google Scholar] [CrossRef]
- Samec, A.; Potrc, I.; Sraml, M. Low cycle fatigue of nodular cast iron used for railway brake discs. Eng. Fail. Anal. 2011, 18, 1424–1434. [Google Scholar] [CrossRef]
- Pevec, M.; Oder, G.; Potrc, I.; Sraml, M. Elevated temperature low cycle fatigue of grey cast iron used for automotive brake discs. Eng. Fail. Anal. 2014, 42, 221–230. [Google Scholar] [CrossRef]
- Li, Z.; Han, J.; Li, W.; Pan, L. Low cycle fatigue behavior of Cr–Mo–V low alloy steel used for railway brake discs. Mater. Des. 2014, 56, 146–157. [Google Scholar] [CrossRef]
- Ishii, T.; Fukaya, K.; Nishiyama, Y.; Suzuki, M.; Eto, M. Low cycle fatigue properties of 8Cr-2WVTa ferritic steel at elevated temperatures. J. Nucl. Mater. 1998, 258–263, 1183–1186. [Google Scholar] [CrossRef]
- Mariappan, K.; Shankar, V.; Sandhya, R.; Laha, K. Low cycle fatigue design data for India-specific reduced activation ferritic-martensitic (IN-RAFM) steel. Fusion Eng. Des. 2016, 104, 76–83. [Google Scholar] [CrossRef]
- Shankar, V.; Kumar, A.; Mariappan, K.; Sandhya, R.; Laha, K.; Bhaduri, A.K.; Narasaiah, N. Occurrence of dynamic strain aging in Alloy 617M under low cycle fatigue loading. Int. J. Fatigue 2017, 100, 12–20. [Google Scholar] [CrossRef]
- Nagode, M.; Zingsheim, F. An online algorithm for temperature influenced fatigue–life estimation: Strain–life approach. Int. J. Fatigue 2004, 26, 155–161. [Google Scholar] [CrossRef]
- Nagode, M.; Hack, M. An online algorithm for temperature influenced fatigue life estimation: Stress–life approach. Int. J. Fatigue 2004, 26, 163–171. [Google Scholar] [CrossRef]
- Schlesinger, M.; Seifert, T.; Preussner, J. Experimental investigation of the time and temperature dependent growth of fatigue cracks in Inconel 718 and mechanism based lifetime prediction. Int. J. Fatigue 2017, 99, 242–249. [Google Scholar] [CrossRef]
- Maderbacher, H.; Oberwinkler, B.; Gänser, H.-P.; Tan, W.; Rollett, M.; Stoschka, M. The influence of microstructure and operating temperature on the fatigue endurance of hot forged Inconels 718 components. Mater. Sci. Eng. A 2013, 585, 123–131. [Google Scholar] [CrossRef]
- Tunthawiroona, P.; Lib, Y.; Koizumia, Y.; Chibaa, A. Strain-controlled iso-thermal fatigue behavior of Co–29Cr–6Mo used for tooling materials in Al die casting. Mater. Sci. Eng. A 2017, 703, 27–36. [Google Scholar] [CrossRef]
- Gopinath, K.; Gogia, A.K.; Kamat, S.V.; Balamuralikrishnan, R.; Ramamurty, U. Low cycle fatigue behaviour of a low interstitial Ni-base superalloy. Acta Mater. 2009, 57, 3450–3459. [Google Scholar] [CrossRef]
- He, Y.H.; Chen, L.J.; Liaw, P.K.; McDaniels, R.L.; Brooks, C.R.; Seeley, R.R.; Klarstrom, D.L. Low-cycle fatigue behavior of HAYNES HR-120 alloy. Int. J. Fatigue 2002, 24, 931–942. [Google Scholar] [CrossRef]
- Kim, Y.-J.; Ho, J. High temperature fatigue resistance of an ACI HH50-type cast austenitic stainless steel. Mater. Sci. Eng. 2010, 527, 5415–5420. [Google Scholar] [CrossRef]
- Pavlou, D.G. Creep life prediction under stepwise constant uniaxial stress and temperature conditions. Eng. Struct. 2001, 23, 656–662. [Google Scholar] [CrossRef]
- Grell, W.A.; Niggeler, G.H.; Groskreutz, M.E.; Laz, P.J. Evaluation of creep damage accumulation models: Considerations of stepped testing and highly stressed volume. Fatigue Fract. Eng. Mater. Struct. 2007, 30, 689–697. [Google Scholar] [CrossRef]
- Altenberger, I.; Nalla, R.K.; Sano, Y.; Wagner, L.; Ritchie, R.O. On the effect of deep-rolling and laser-peening on the stress-controlled low- and high-cycle fatigue behavior of Ti–6Al–4V at elevated temperatures up to 550 °C. Int. J. Fatigue 2012, 44, 292–302. [Google Scholar] [CrossRef]
- Heckel, T.K.; Christ, H.J. Thermomechanical Fatigue of the TiAl Intermetallic Alloy TNB-V2. Exp. Mech. 2009, 50, 717–724. [Google Scholar] [CrossRef]
- Chen, L.J.; Eang, Z.G.; Yao, G.; Tian, J.F. 1The influence of temperature on low cycle fatigue behavior of nickel base superalloy GH4049. Int. J. Fatigue 1999, 21, 791–797. [Google Scholar] [CrossRef]
- Bar-Cohen, Y. High Temperature Materials and Mechanisms; CRC Press: Boca Raton, FL, USA, 2017. [Google Scholar]
- Szusta, J.; Seweryn, A. Low-cycle fatigue model of damage accumulation—The strain approach. Eng. Fract. Mech. 2010, 77, 1604–1616. [Google Scholar] [CrossRef]
- Szusta, J.; Seweryn, A. Fatigue damage accumulation modelling in the range of complex low-cycle loadings—The strain approach and its experimental verification on the basis of EN AW-2007 aluminum alloy. Int. J. Fatigue 2011, 33, 255–264. [Google Scholar] [CrossRef]
- Seweryn, A.; Buczynski, A.; Szusta, J. Damage accumulation model for low cycle fatigue. Int. J. Fatigue 2008, 30, 756–765. [Google Scholar] [CrossRef]


| T (°C) | E (GPa) | ν | σyp (MPa) | σuts (MPa) | A5 (%) |
|---|---|---|---|---|---|
| 20 | 72 | 0.33 | 370 | 536 | 16.7 |
| 100 | 64 | 0.33 | 368 | 516 | 18.4 |
| 200 | 53 | 0.33 | 367 | 500 | 18.8 |
| 300 | 52 | 0.33 | 308 | 418 | 21.6 |
| T | 20 °C | 100 °C | 200 °C | 300 °C |
|---|---|---|---|---|
| K(T) | 605.23 | 652.57 | 996.42 | 492.98 |
| n(T) | 0.0651 | 0.0893 | 0.1881 | 0.0602 |
| T | 20 °C | 100 °C | 200 °C | 300 °C |
|---|---|---|---|---|
| σf′(T) | 850 MPa | 592 MPa | 700 MPa | 591 MPa |
| b(T) | −0.086 | −0.0498 | −0.083 | −0.065 |
| εf′(T) | 0.22 | 0.43 | 0.168 | 0.25 |
| c(T) | −0.462 | −0.562 | −0.446 | −0.544 |
| Load Path | T20 | T100 | T200 | T300 | ||||
|---|---|---|---|---|---|---|---|---|
| Nf | Nf | Nf | Nf | |||||
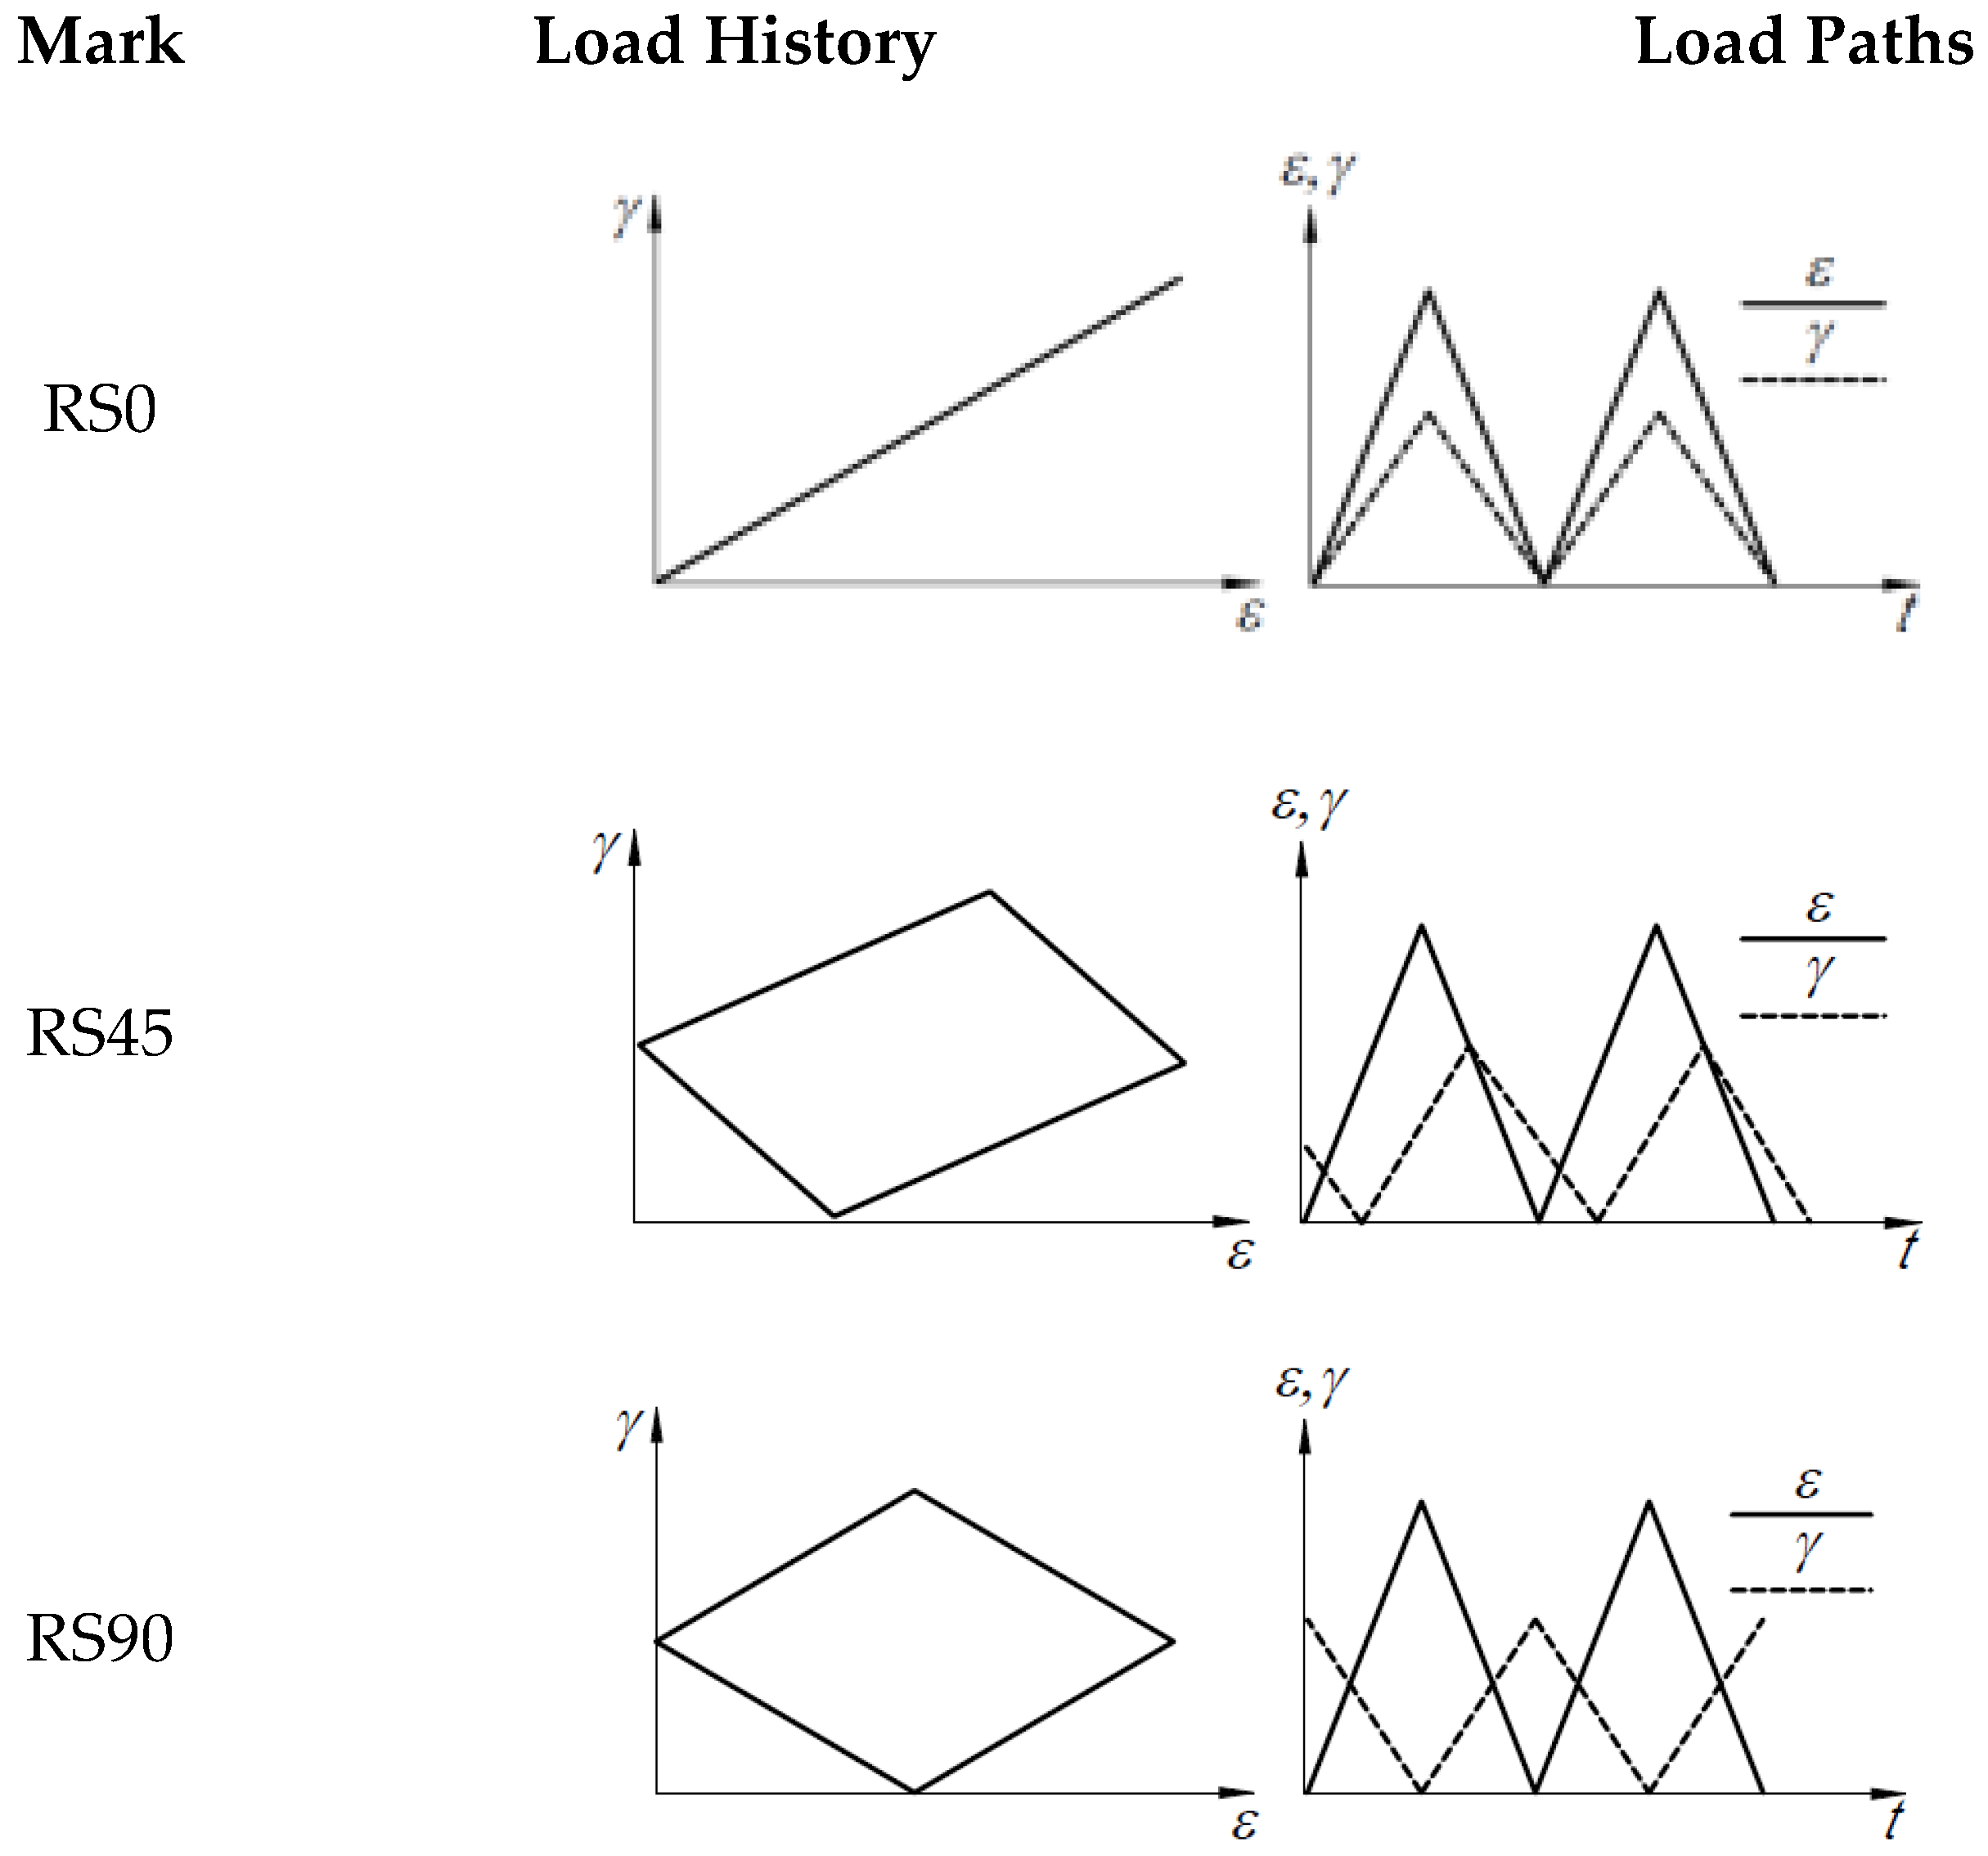
| RS0 | 6663 | 6376 | 3765 | 3414 | 1276 | 1432 | 770 | 894 |
| 6638 | 3456 | 1316 | 992 | |||||
| 5826 | 3020 | 1705 | 920 | |||||
| RS45 | 6740 | 8287 | 3522 | 3775 | 2361 | 2015 | 846 | 1115 |
| 7638 | 3911 | 2002 | 1120 | |||||
| 10482 | 3891 | 1683 | 1379 | |||||
| RS90 | 10290 | 9446 | 4822 | 4237 | 2100 | 2157 | 1500 | 1292 |
| 8026 | 3556 | 2295 | 1390 | |||||
| 10,023 | 4332 | 2075 | 987 | |||||
| Strain Level | Calculations Nf (cycle) | Exp. Nf | ||
|---|---|---|---|---|
| M-C-B | S-S_1 | S-S_2 | (cycle) | |
| 20 °C | ||||
| 0.015 | 575 | 734 | 534 | 572 |
| 0.01 | 2510 | 3358 | 2181 | 2704 |
| 0.0095 | 3205 | 4151 | 3529 | 4156 |
| 0.008 | 6724 | 6717 | 5231 | 6458 |
| 0.006 | 12,838 | 12,316 | 14,164 | 14,597 |
| 100 °C | ||||
| 0.015 | 695 | 452 | 424 | 464 |
| 0.01 | 3100 | 2135 | 2252 | 2164 |
| 0.0095 | 2200 | 3282 | 3381 | 3209 |
| 0.008 | 6250 | 5098 | 5308 | 5168 |
| 0.006 | 12,000 | 11,524 | 10,630 | 10,755 |
| 200 °C | ||||
| 0.015 | 550 | 301 | 368 | 355 |
| 0.01 | 1955 | 1424 | 1589 | 1679 |
| 0.0095 | 3700 | 2188 | 2315 | 2178 |
| 0.008 | 4960 | 3399 | 4527 | 4435 |
| 0.006 | 9520 | 7683 | 9119 | 8328 |
| 300 °C | ||||
| 0.015 | 250 | 151 | 218 | 225 |
| 0.01 | 850 | 712 | 509 | 464 |
| 0.0095 | 1056 | 1094 | 865 | 870 |
| 0.008 | 1623 | 1700 | 1867 | 1882 |
| 0.006 | 4450 | 3842 | 3870 | 3775 |
| Load Path | Calculations Nf (cycle) | Exp. Nf | |
|---|---|---|---|
| SS1 | SS2 | (cycle) | |
| 20 °C | |||
| RS0 | 5876 | 5983 | 6376 |
| RS45 | 8347 | 7739 | 8287 |
| RS90 | 10,583 | 9655 | 9446 |
| 100 °C | |||
| RS0 | 3020 | 3122 | 3414 |
| RS45 | 3891 | 3538 | 3775 |
| RS90 | 4332 | 3459 | 4237 |
| 200 °C | |||
| RS0 | 1705 | 1426 | 1432 |
| RS45 | 1683 | 1995 | 2015 |
| RS90 | 2075 | 2103 | 2157 |
| 300 °C | |||
| RS0 | 920 | 764 | 894 |
| RS45 | 1379 | 1099 | 1115 |
| RS90 | 987 | 1230 | 1292 |
© 2018 by the authors. Licensee MDPI, Basel, Switzerland. This article is an open access article distributed under the terms and conditions of the Creative Commons Attribution (CC BY) license (http://creativecommons.org/licenses/by/4.0/).
Share and Cite
Szusta, J.; Seweryn, A. Fatigue Damage Accumulation Modeling of Metals Alloys under High Amplitude Loading at Elevated Temperatures. Metals 2018, 8, 1030. https://doi.org/10.3390/met8121030
Szusta J, Seweryn A. Fatigue Damage Accumulation Modeling of Metals Alloys under High Amplitude Loading at Elevated Temperatures. Metals. 2018; 8(12):1030. https://doi.org/10.3390/met8121030
Chicago/Turabian StyleSzusta, Jarosław, and Andrzej Seweryn. 2018. "Fatigue Damage Accumulation Modeling of Metals Alloys under High Amplitude Loading at Elevated Temperatures" Metals 8, no. 12: 1030. https://doi.org/10.3390/met8121030
APA StyleSzusta, J., & Seweryn, A. (2018). Fatigue Damage Accumulation Modeling of Metals Alloys under High Amplitude Loading at Elevated Temperatures. Metals, 8(12), 1030. https://doi.org/10.3390/met8121030