Non-Destructive Evaluation of Steel Surfaces after Severe Plastic Deformation via the Barkhausen Noise Technique

 , ,
, , 
Abstract
1. Introduction
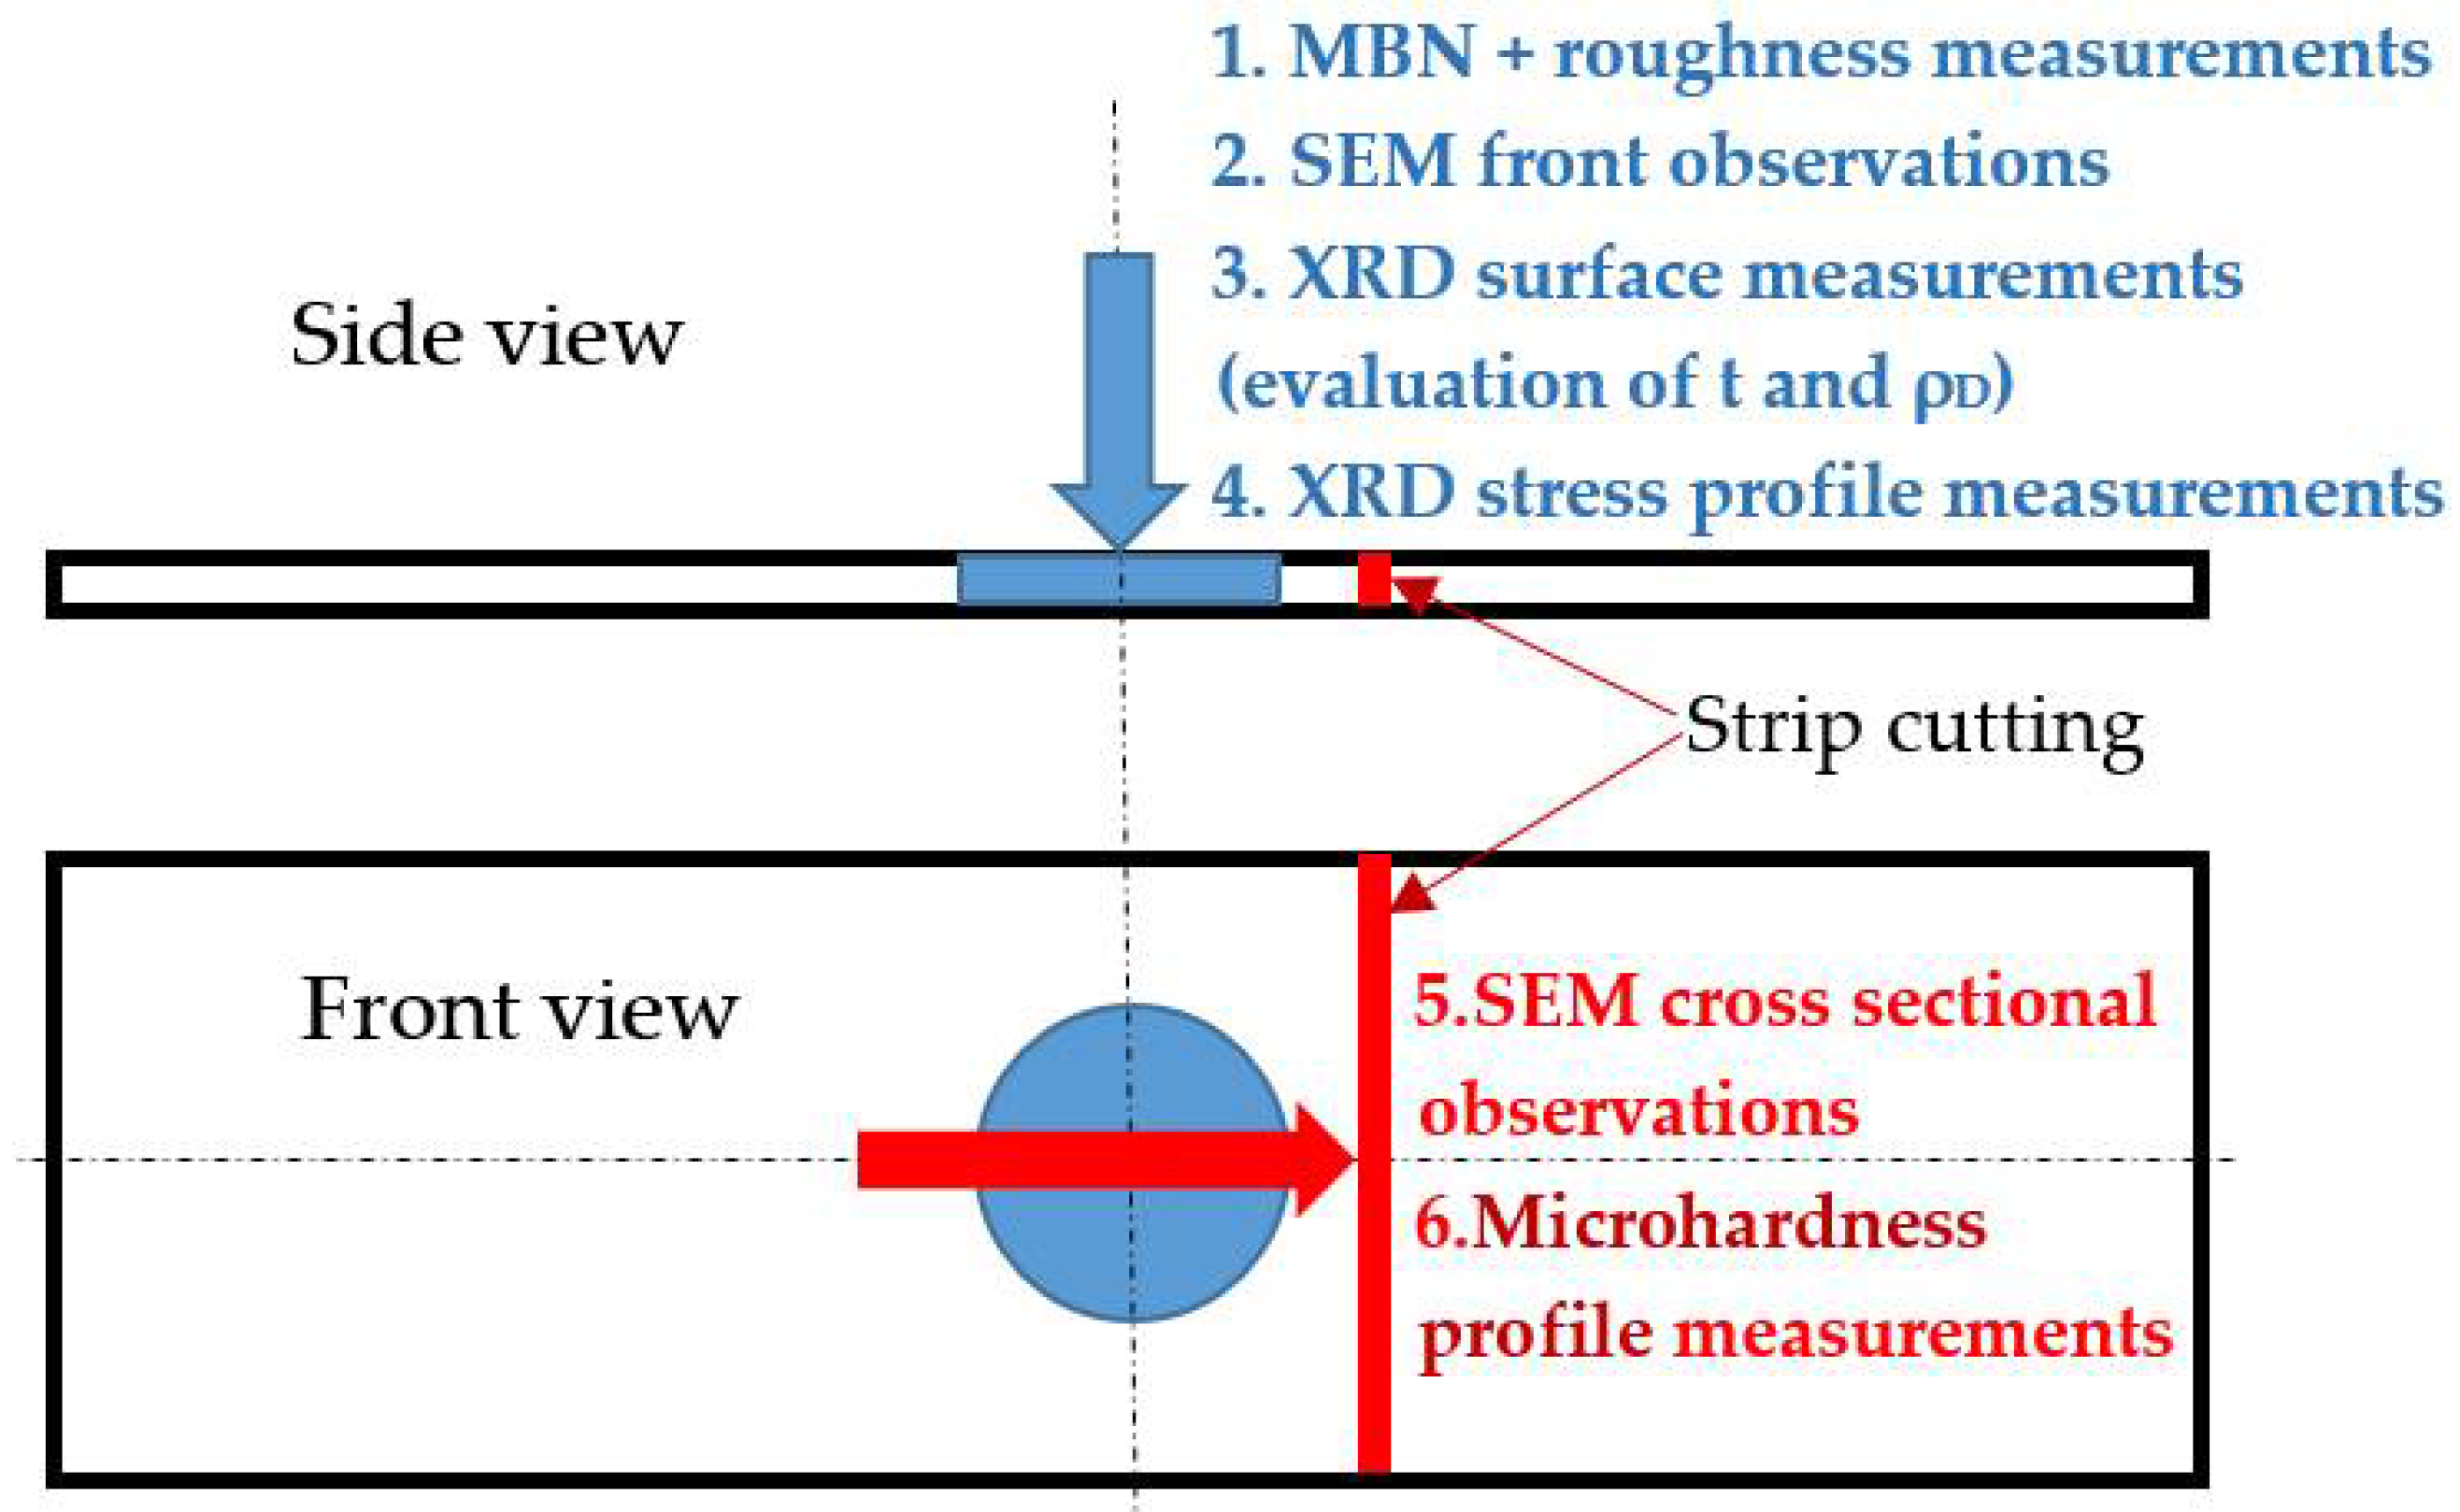
2. Materials and Methods
3. Results
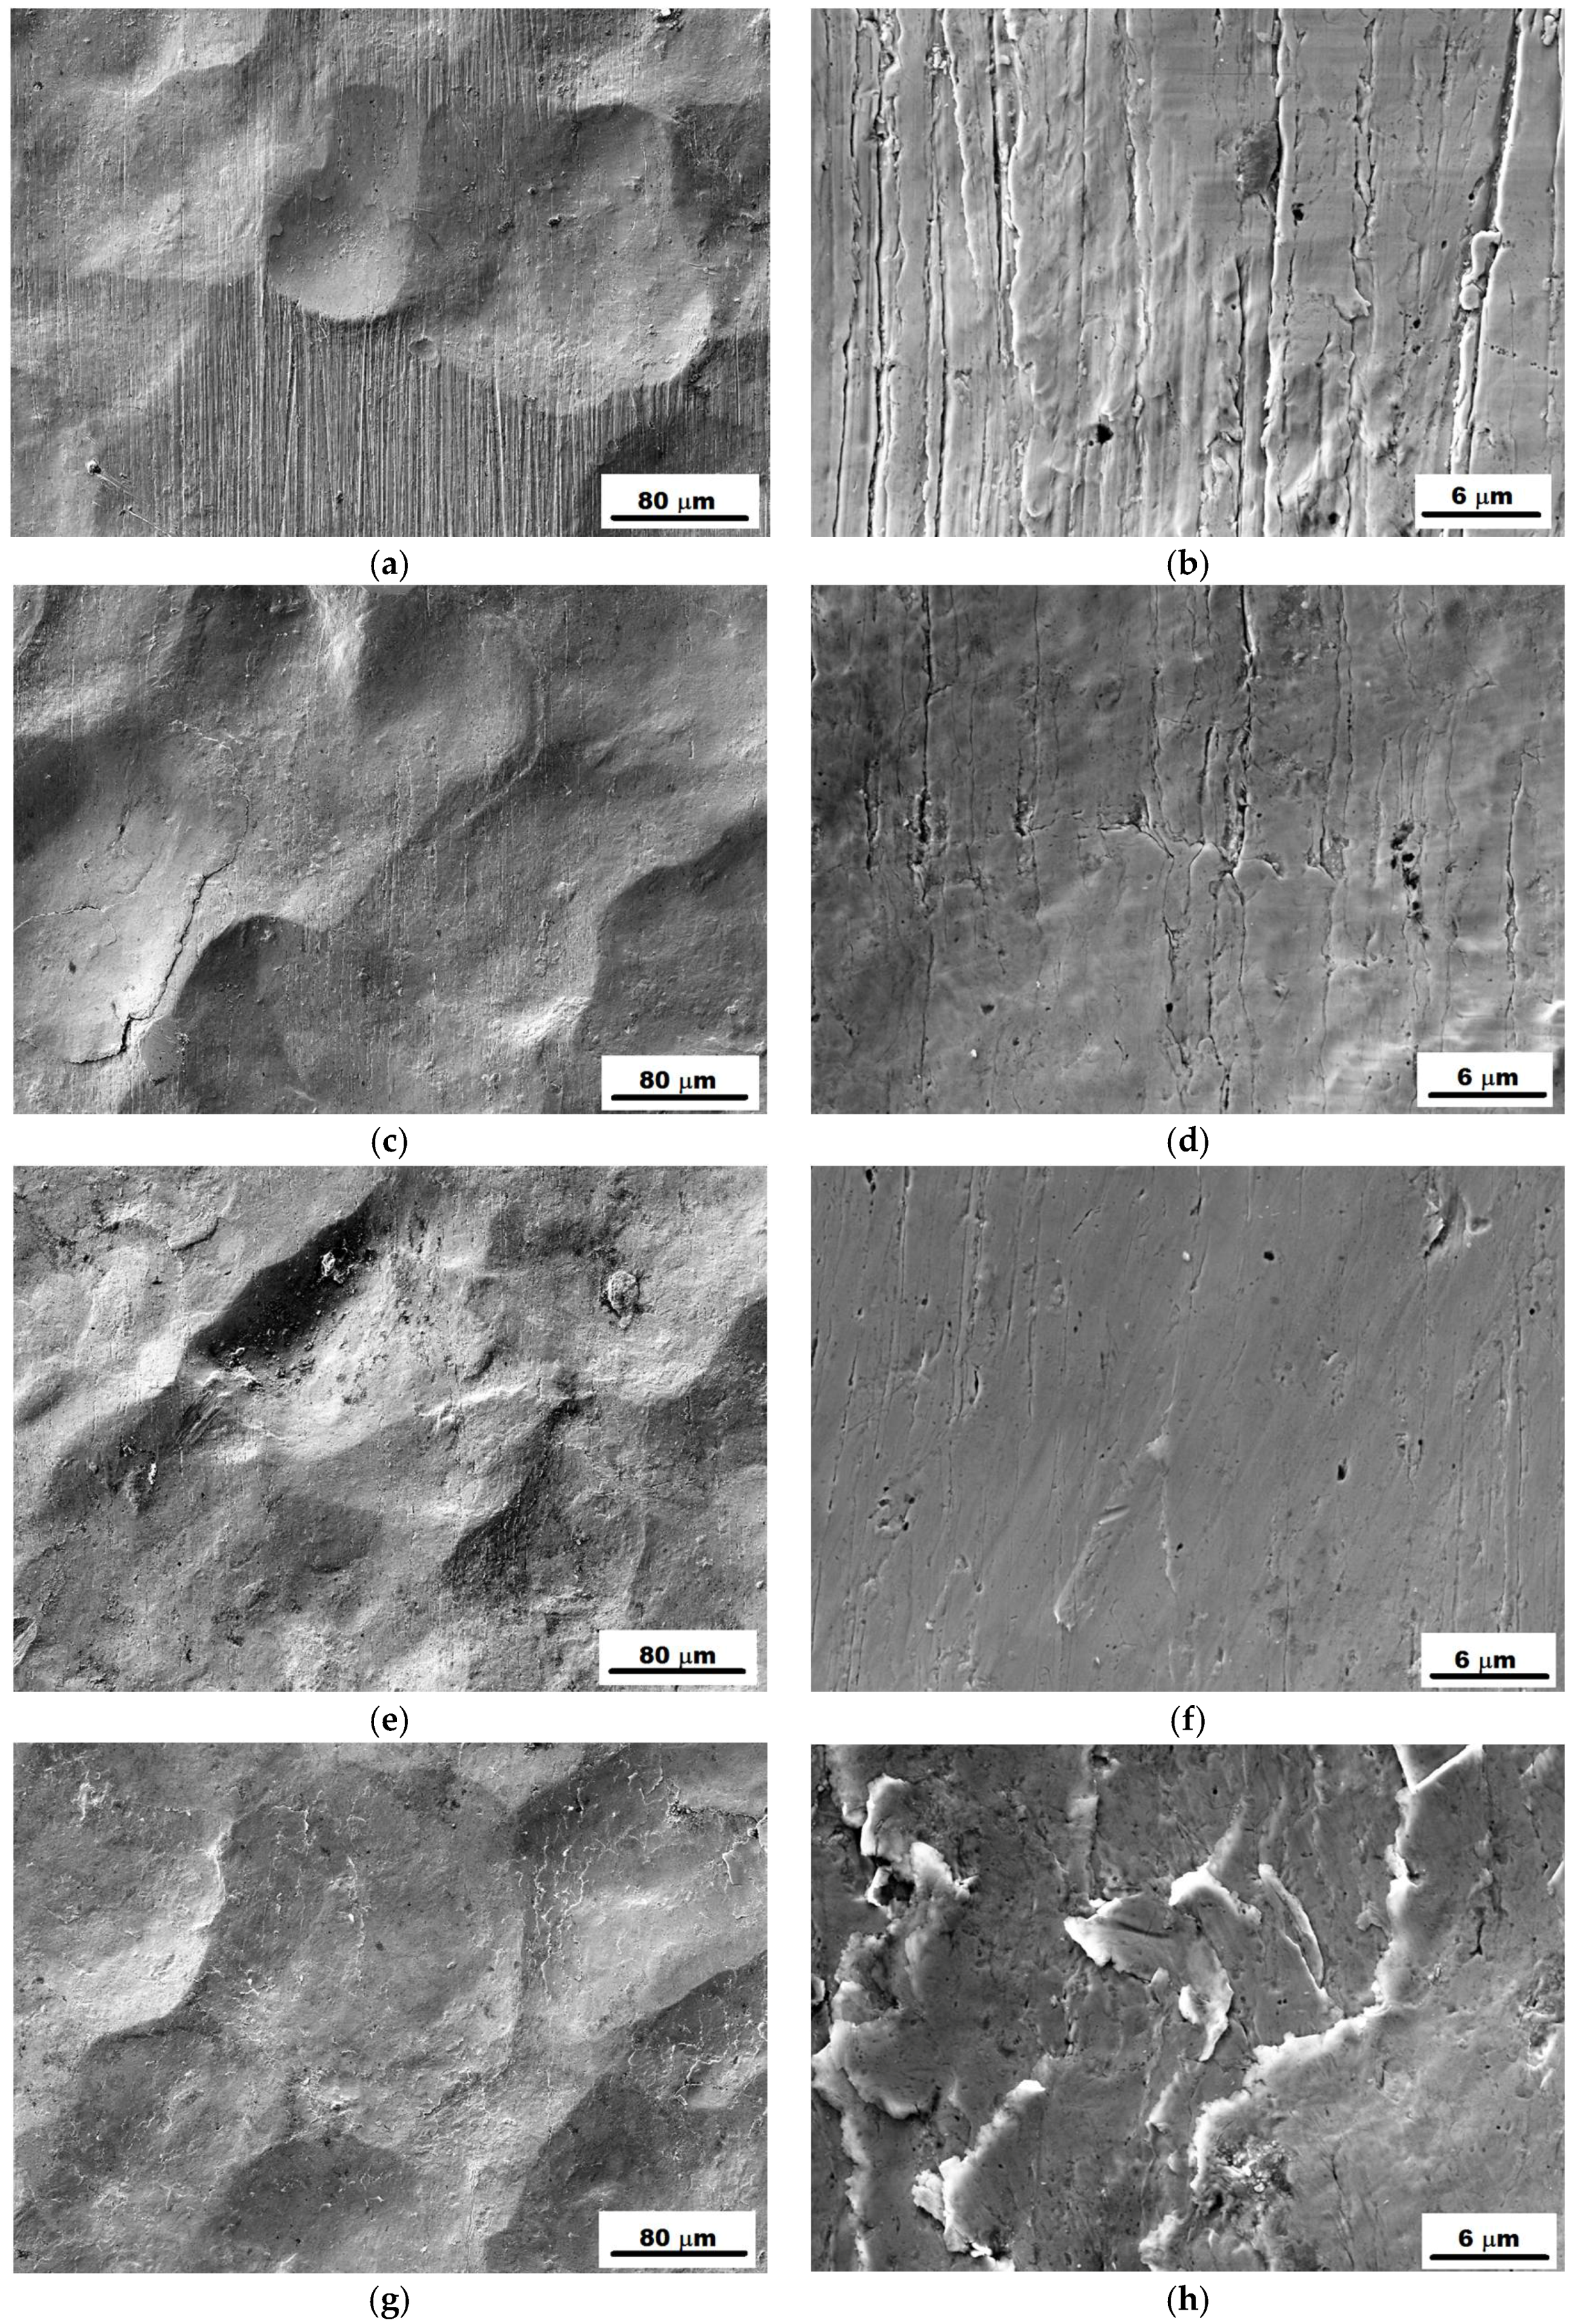
3.1. SEM Observations
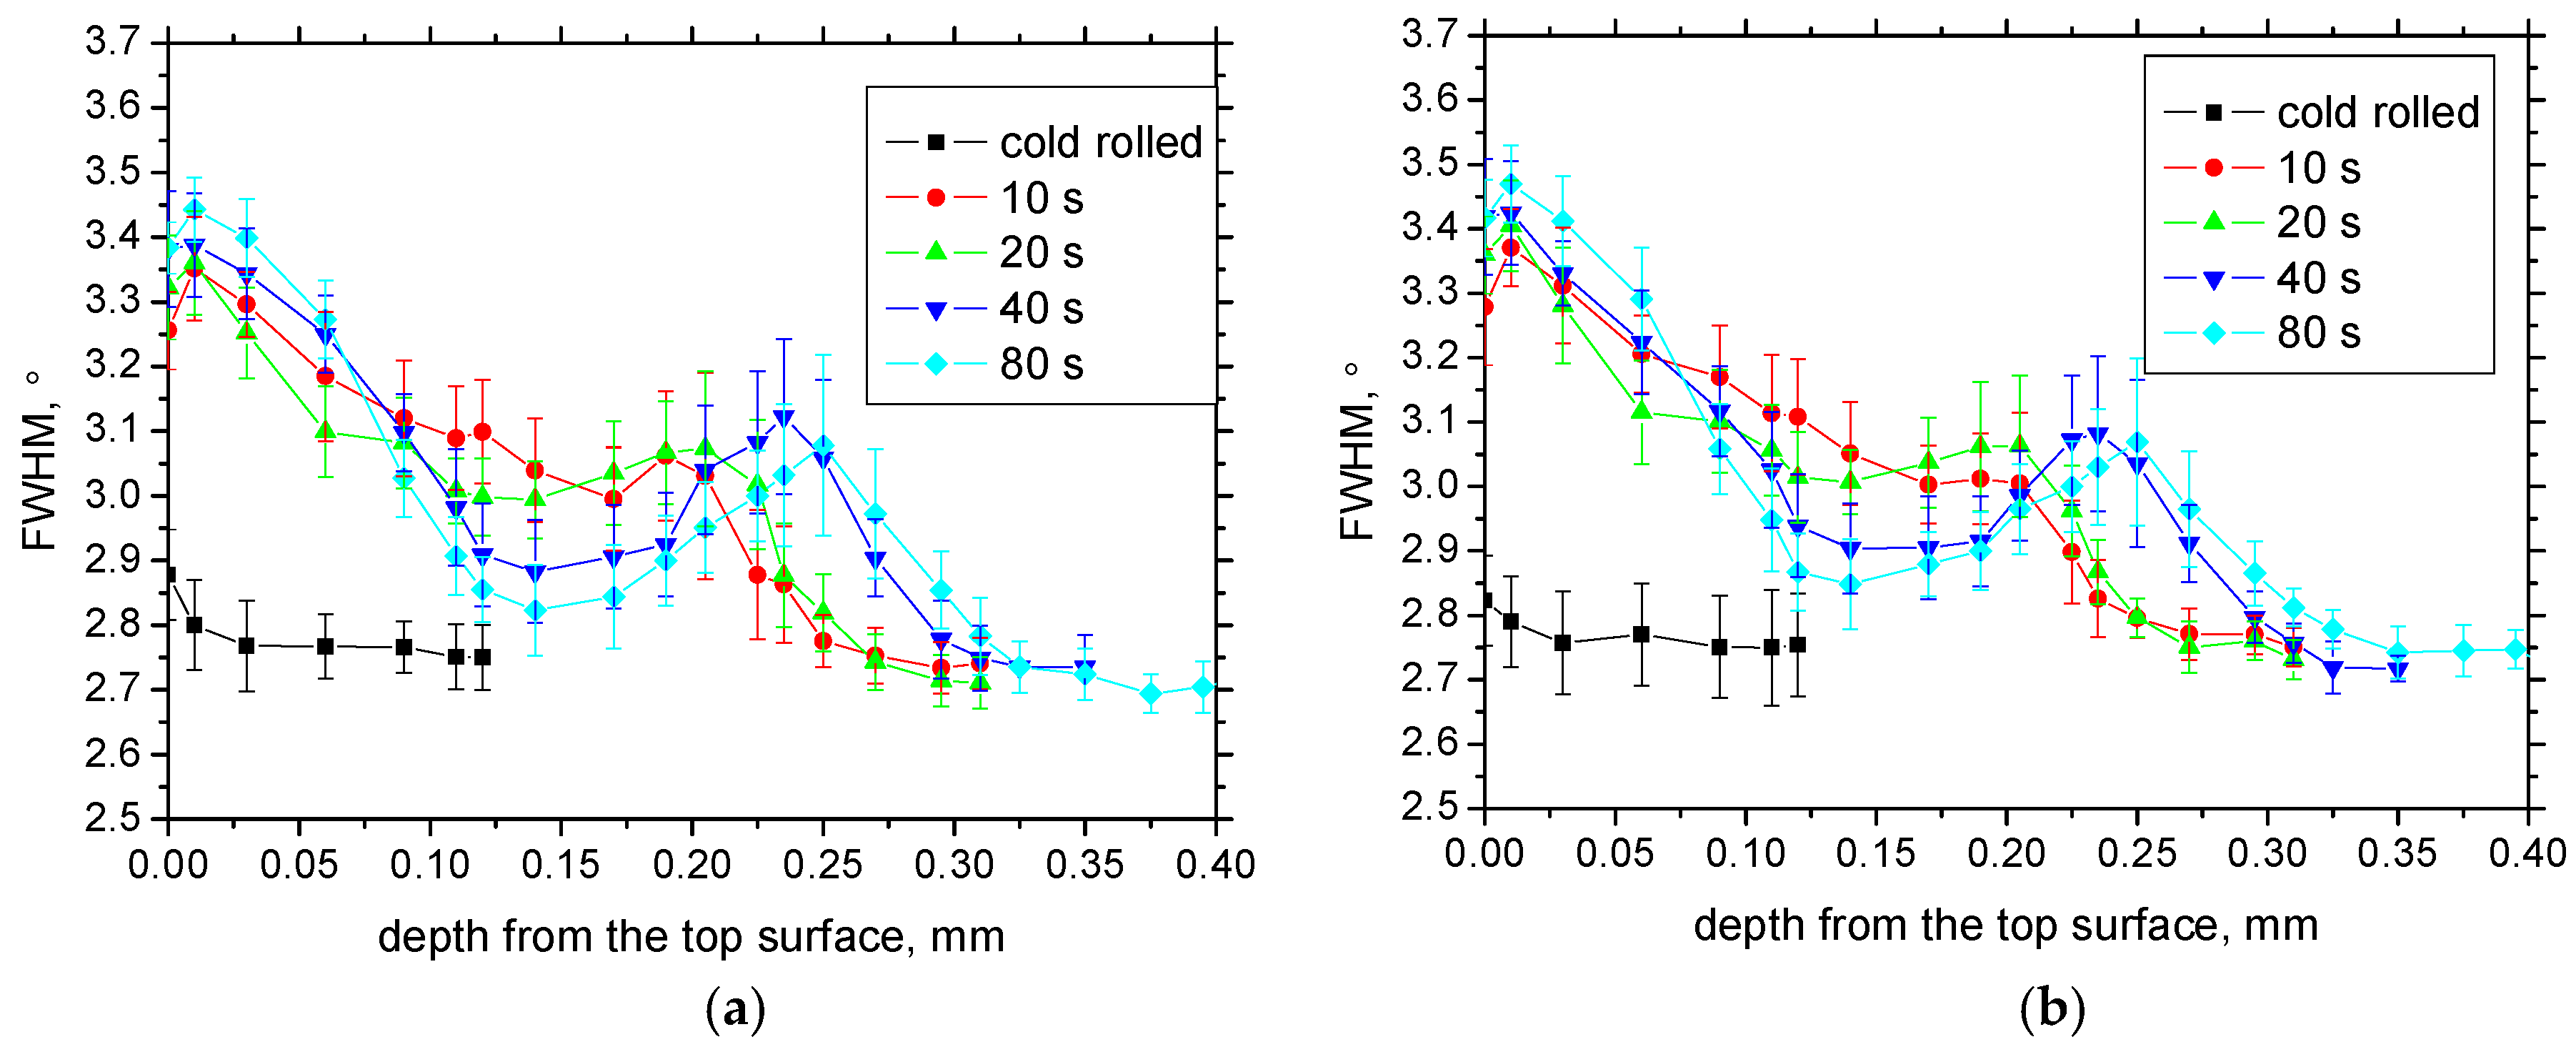
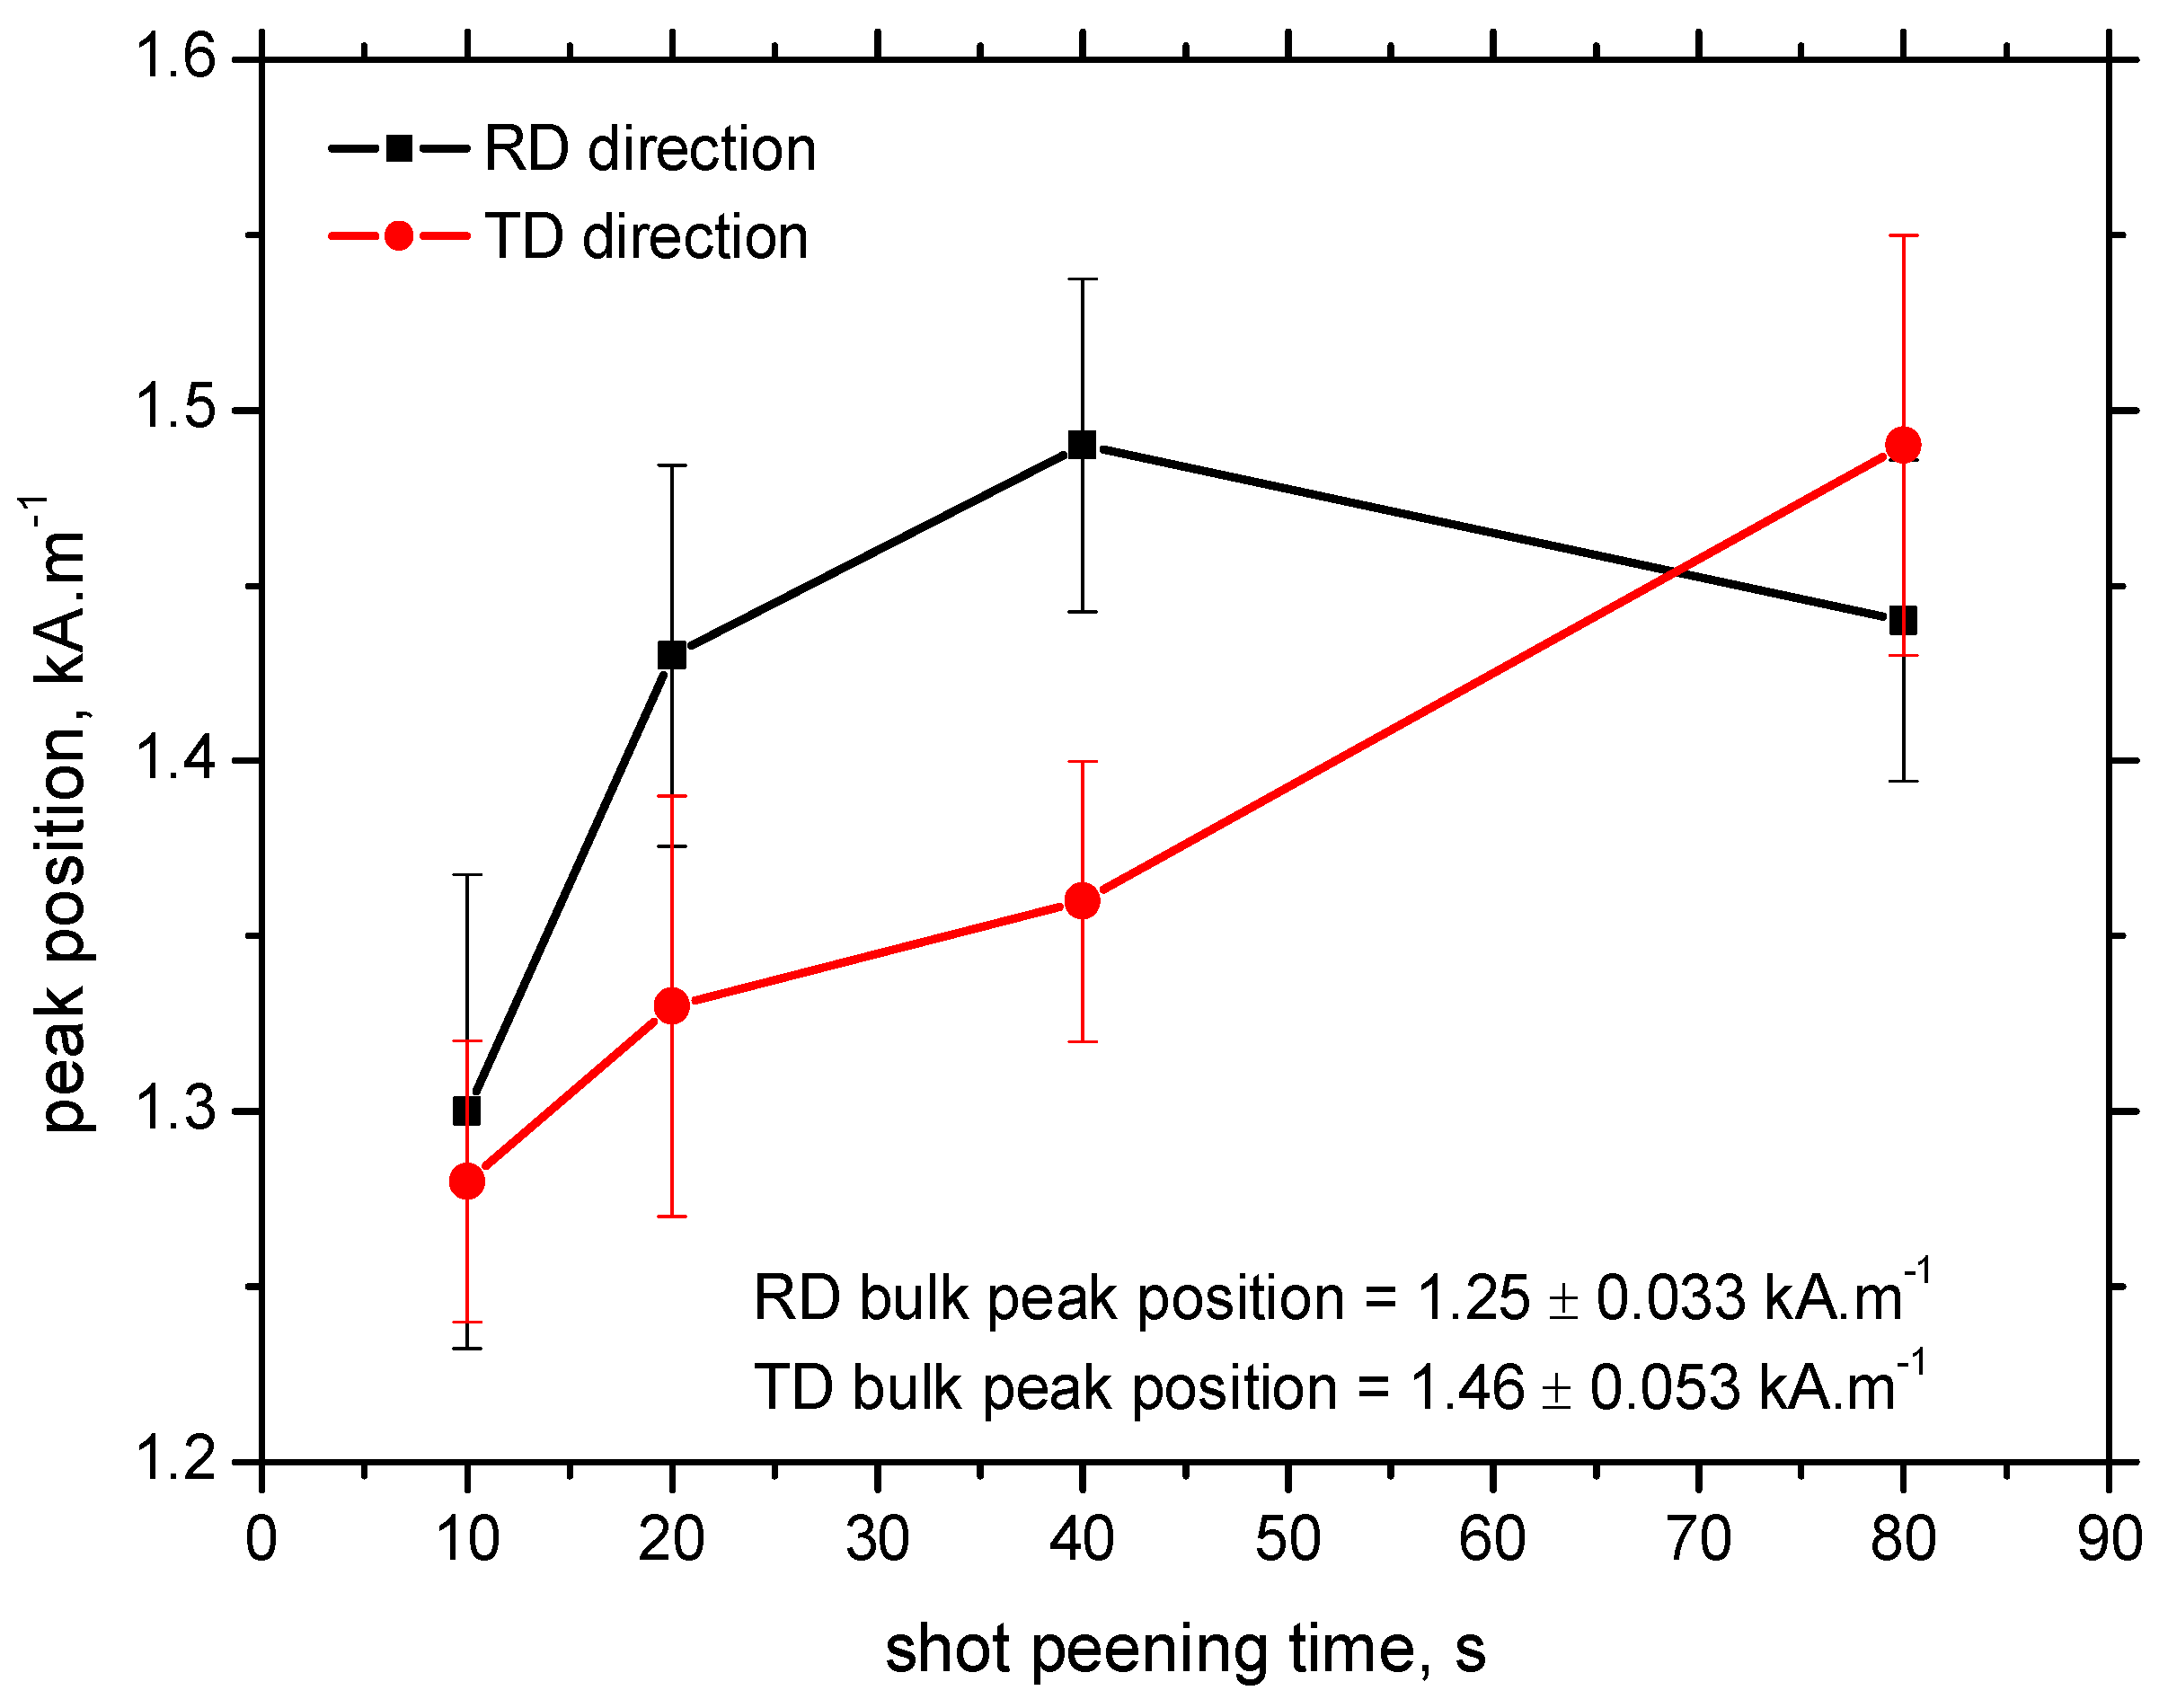
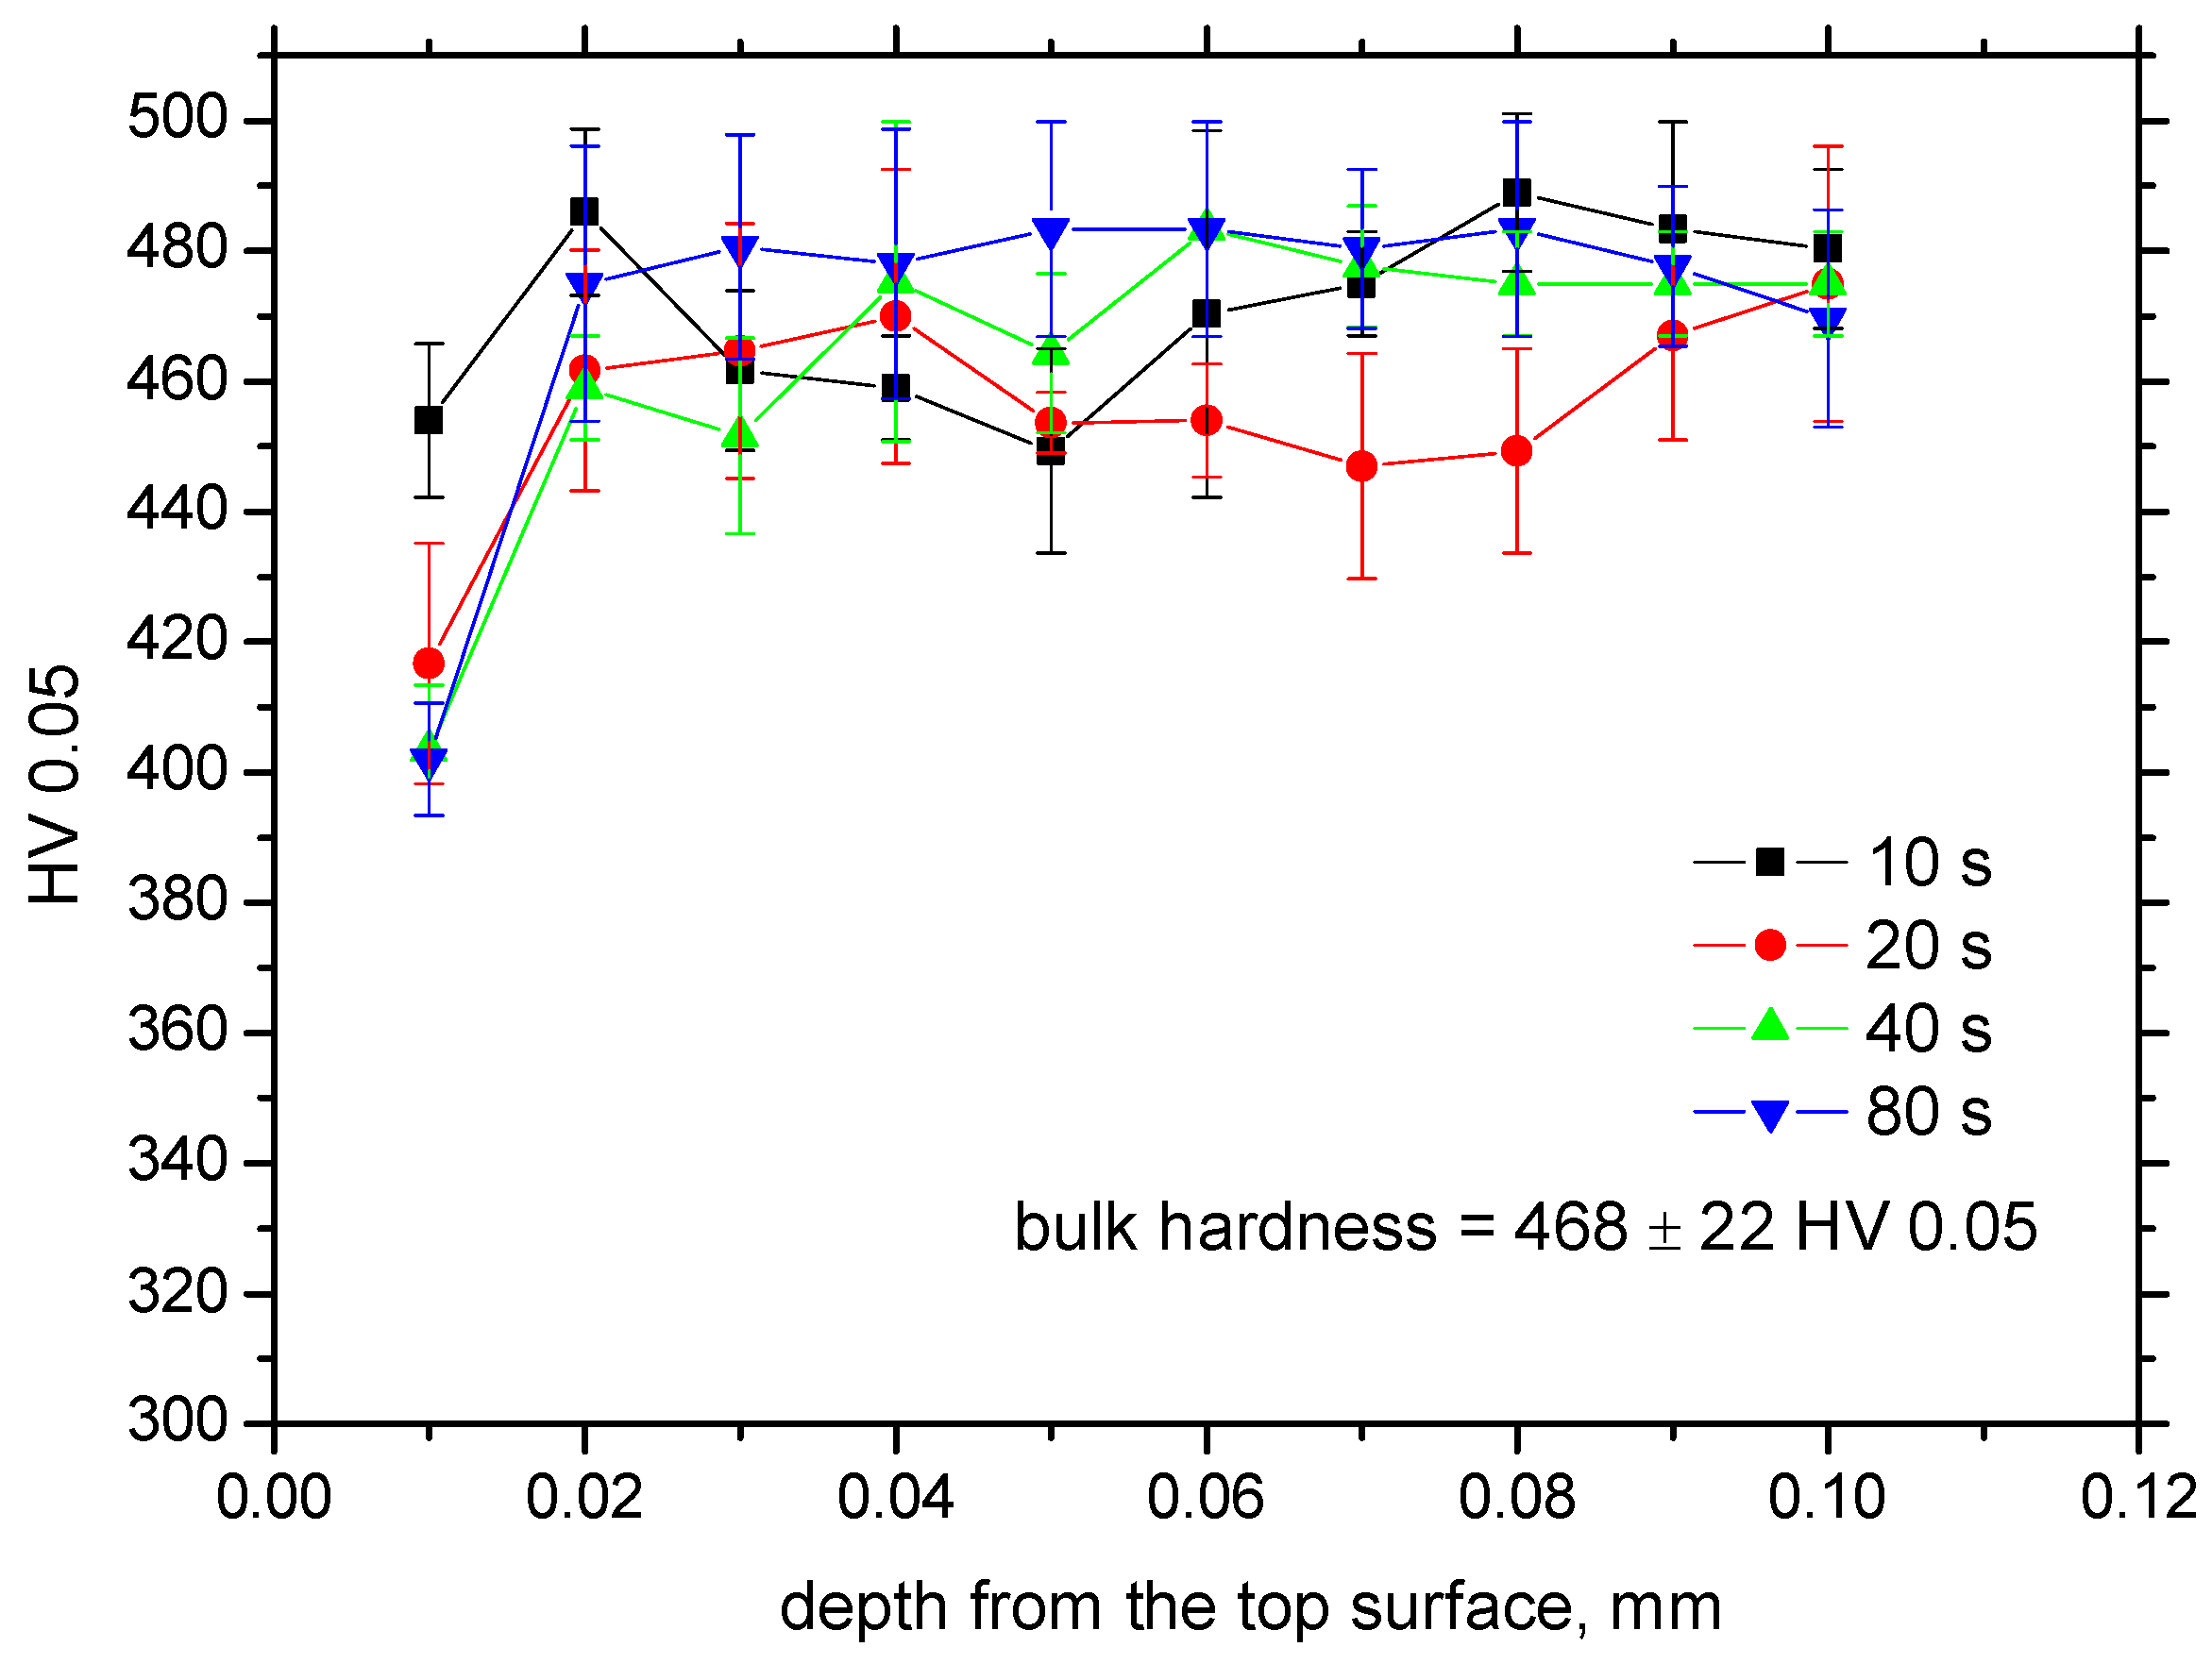
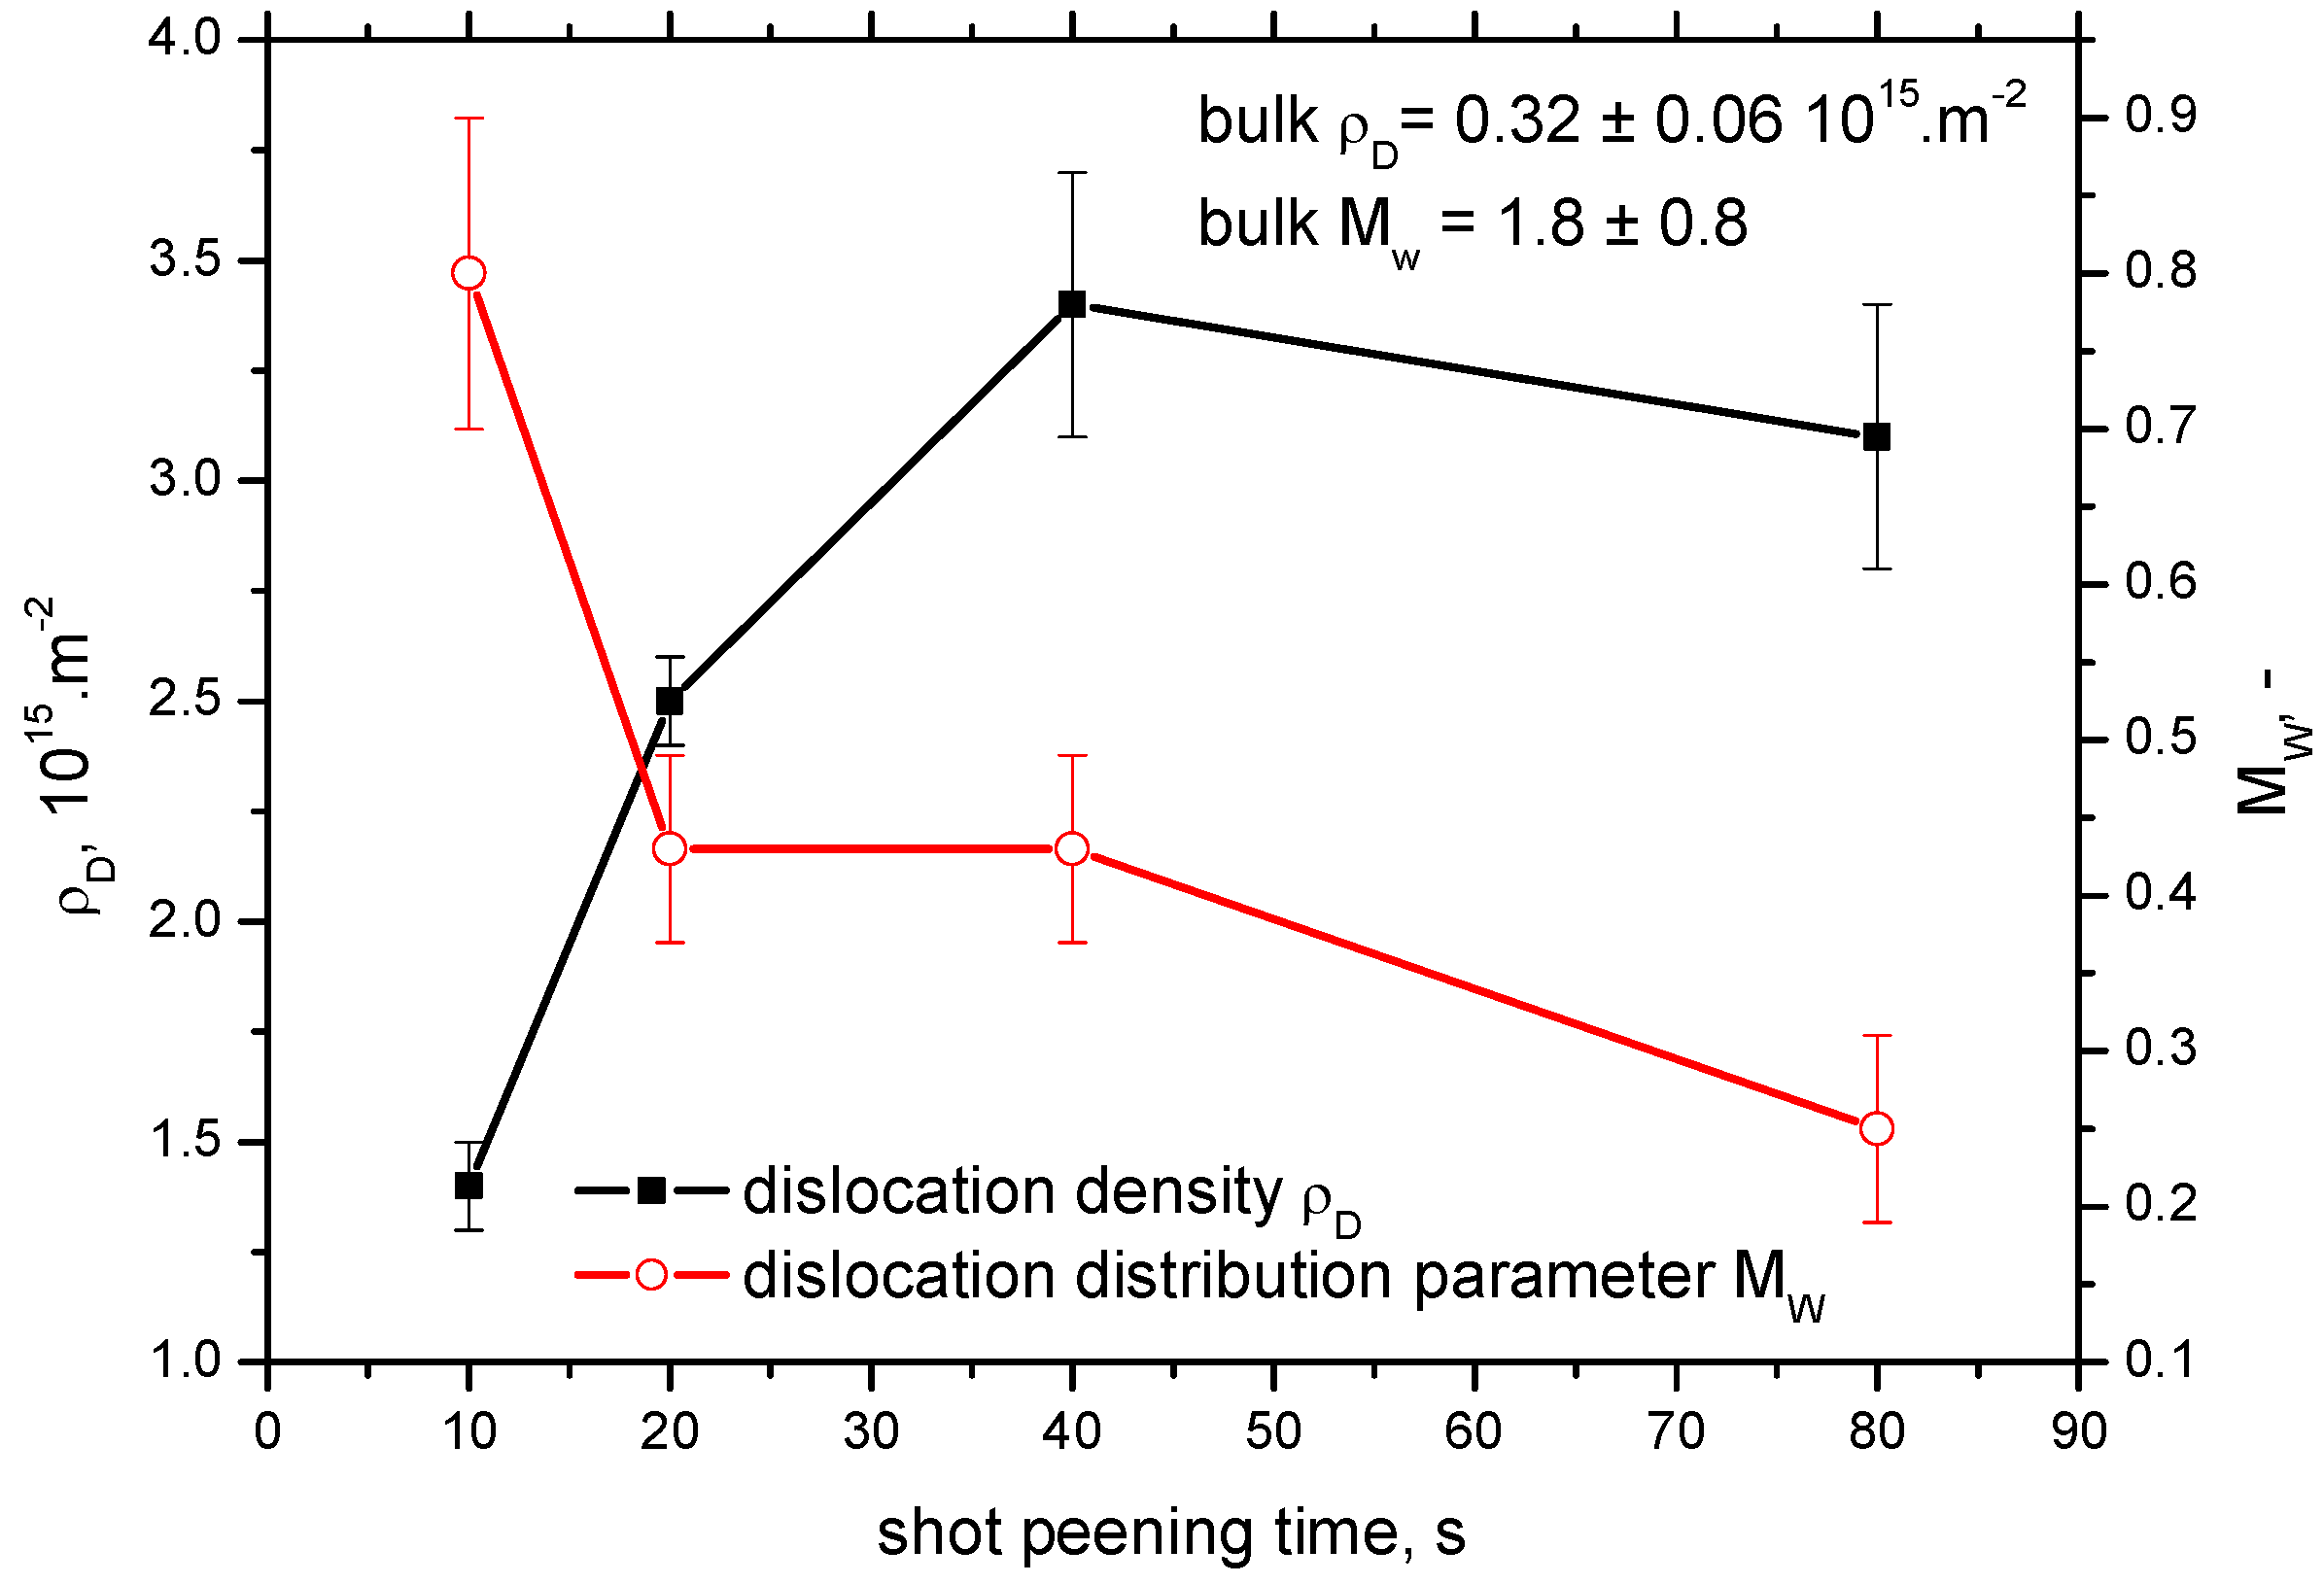
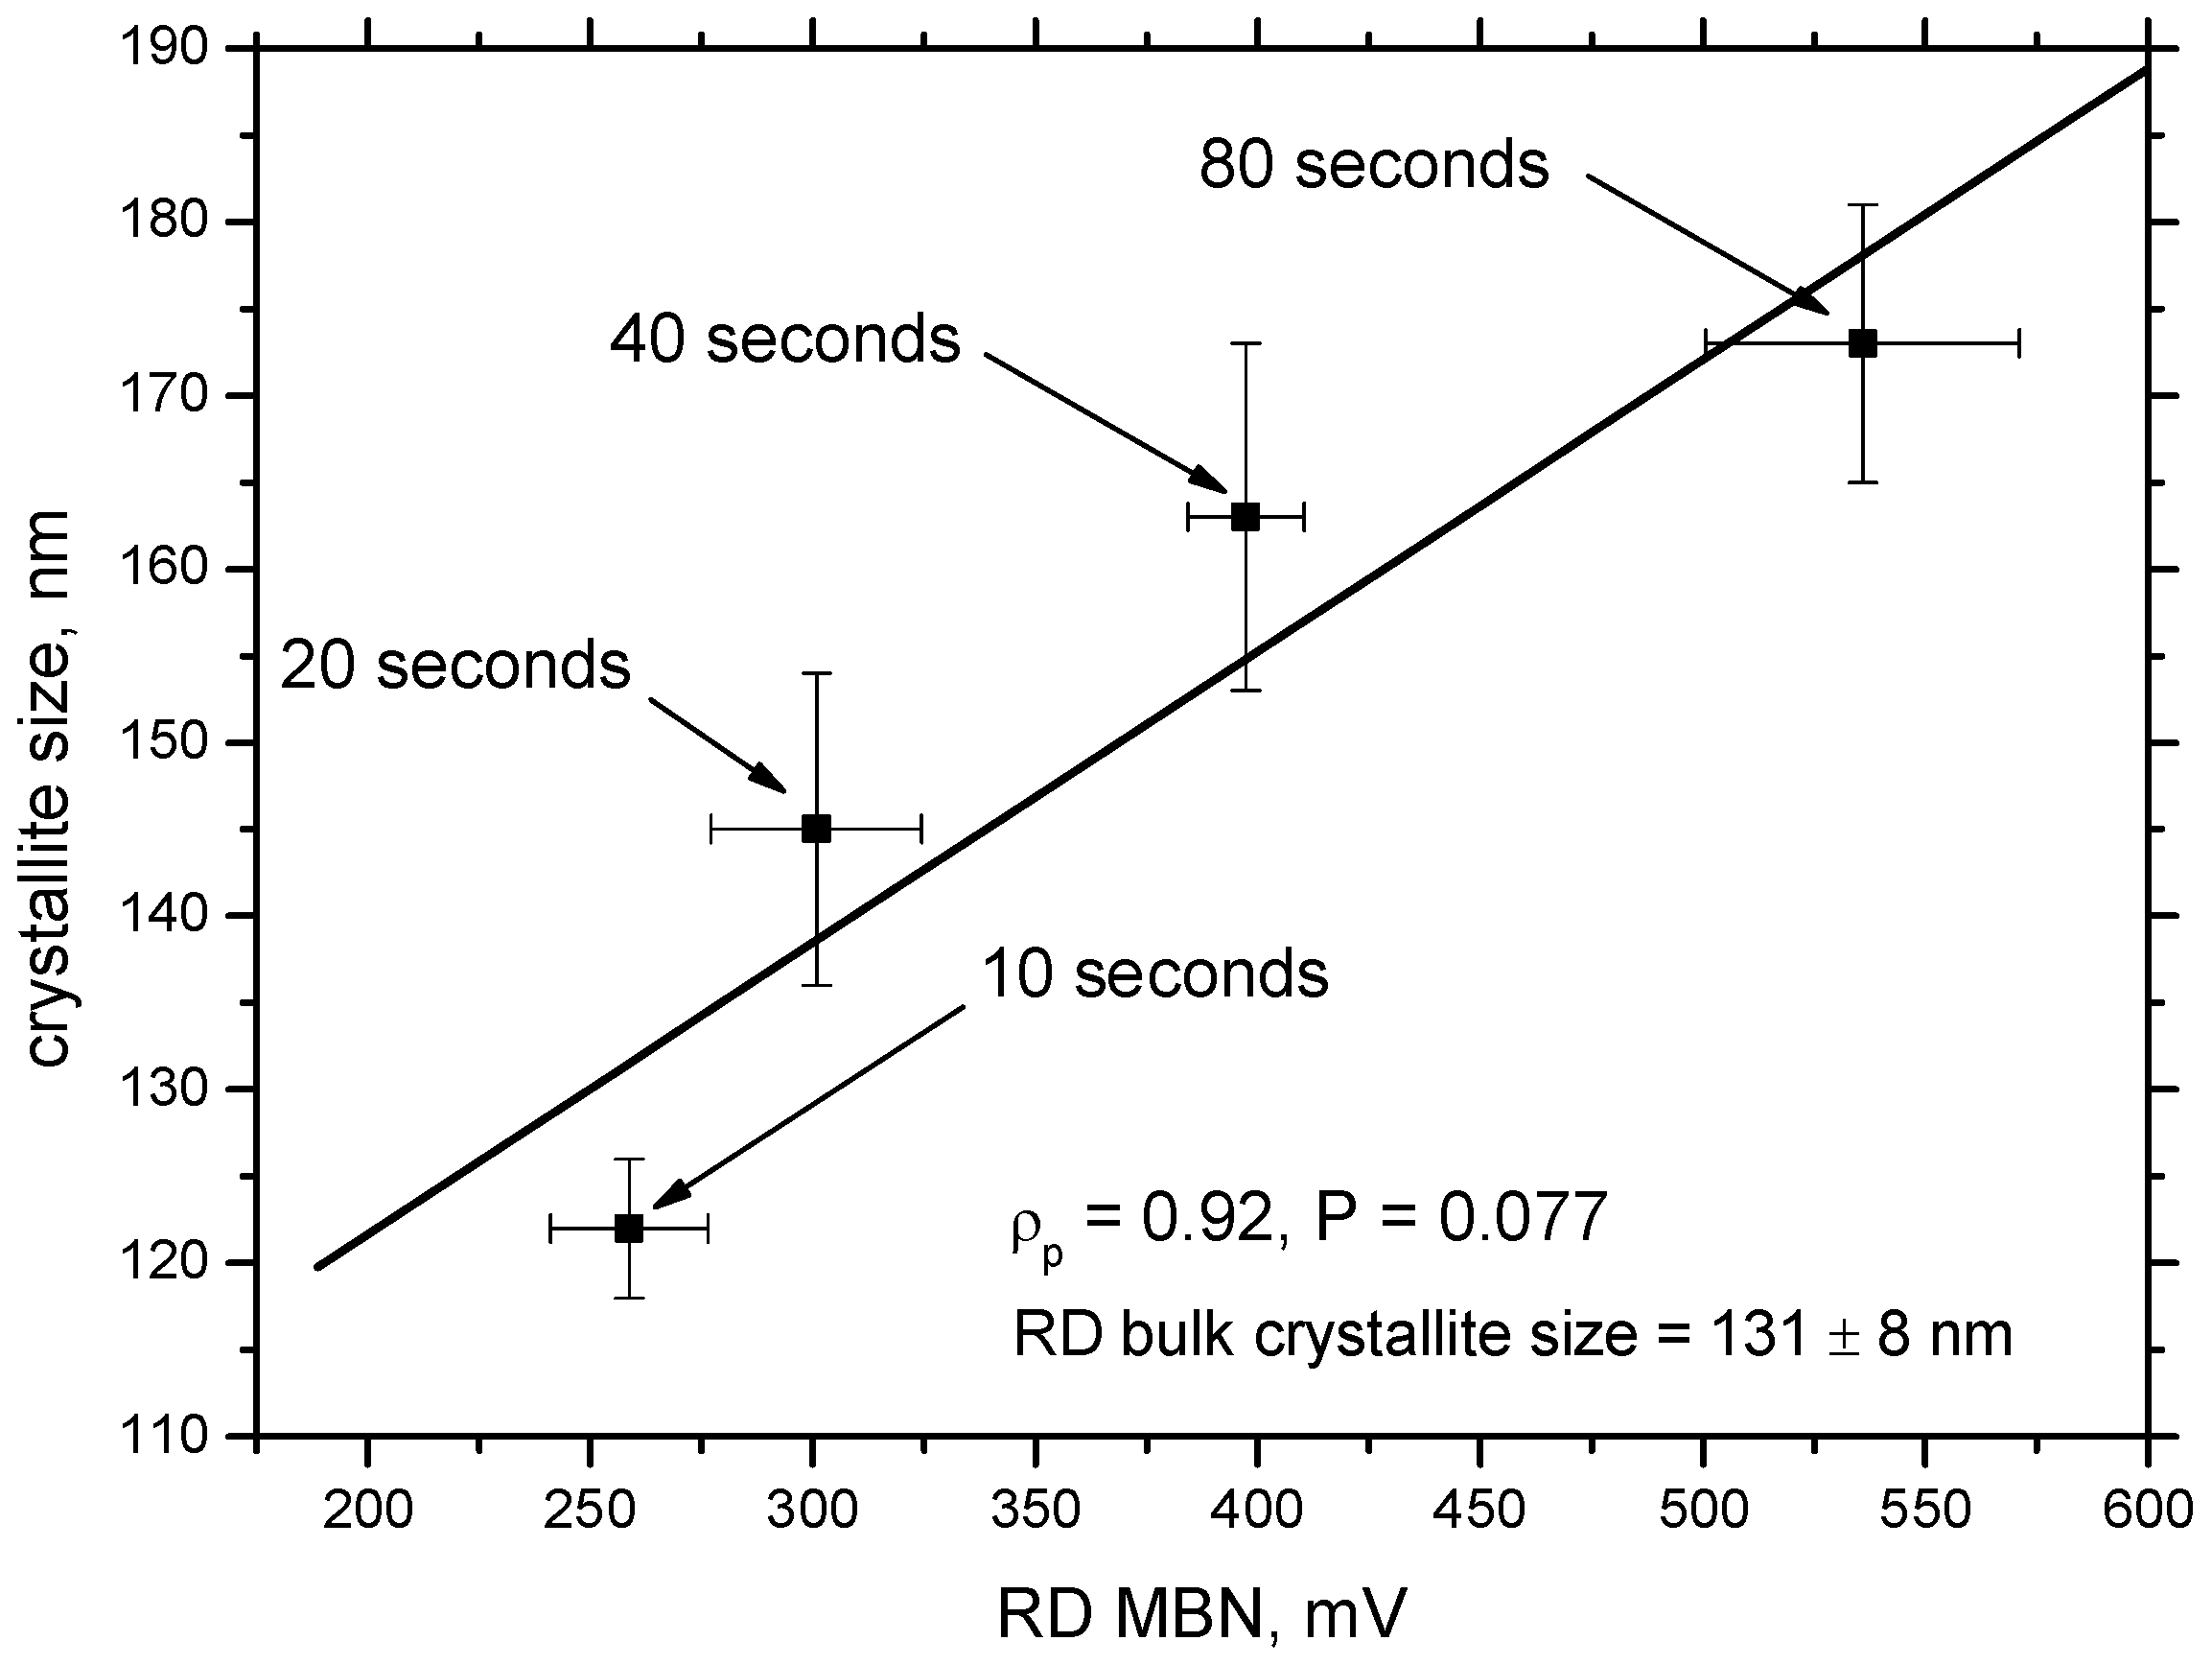
3.2. XRD Measurements
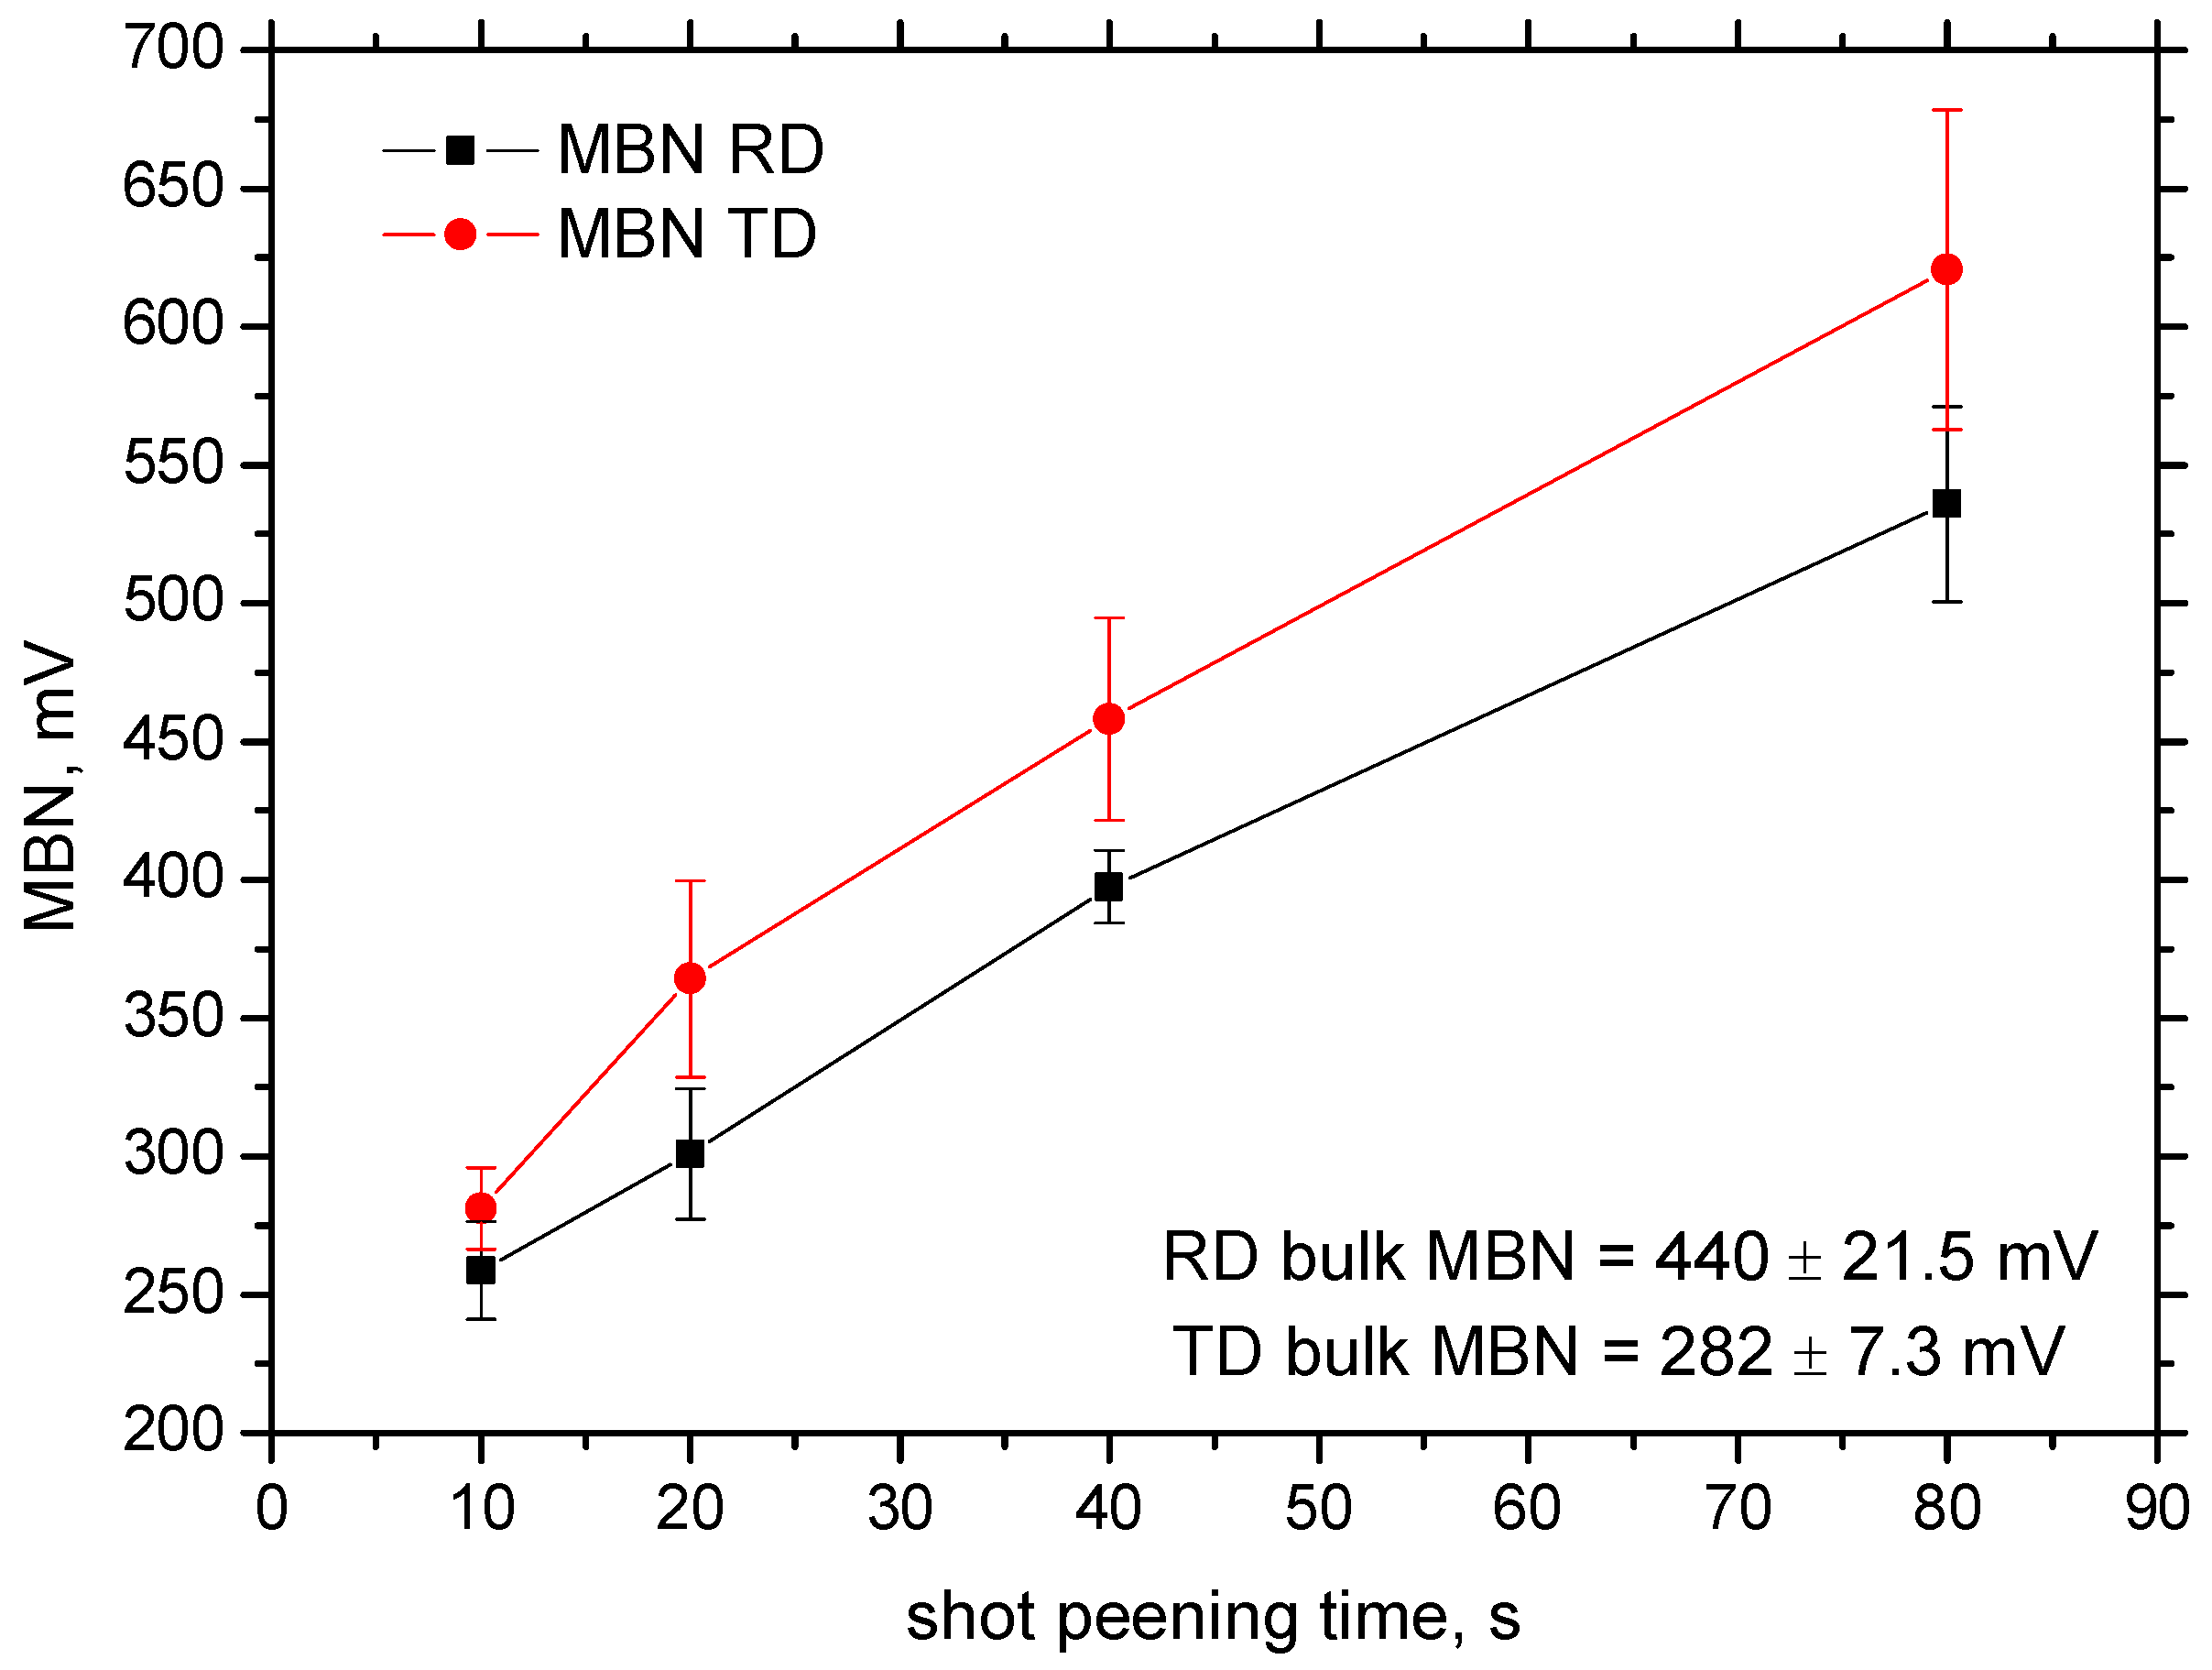
3.3. MBN Measurements
4. Discussion of Obtained Results
5. Conclusions
Author Contributions
Funding
Conflicts of Interest
References
- Kleber, X.; Barroso, S.P. Investigation of shot-peened austenitic stainless steel 304L by means of magnetic Barkhausen noise. Mater. Sci. Eng. A 2010, 527, 6046–6052. [Google Scholar] [CrossRef]
- Unal, O.; Varol, R. Surface severe plastic deformation of AISI 304 via conventional shot peening, severe shot peening and re-peening. Appl. Surf. Sci. 2015, 351, 289–295. [Google Scholar] [CrossRef]
- Fu, P.; Chu, R.; Xu, Z.; Ding, G.; Jiang, C. Relation of hardness with FWHM and residual stress of GCr15 steel after shot peening. Appl. Surf. Sci. 2018, 431, 165–169. [Google Scholar] [CrossRef]
- Sekine, Y.; Soyama, H. Evaluation of the surface of alloy tool steel treated by cavitation shot less peening using an eddy current method. Surf. Coat. Technol. 2009, 203, 2254–2259. [Google Scholar] [CrossRef]
- Unal, O. Optimization of shot peening parameters by response surface methodology. Surf. Coat. Technol. 2016, 305, 99–109. [Google Scholar] [CrossRef]
- Fargas, G.; Roa, J.J.; Mateo, A. Effect of shot peening on metastable austenitic stainless steels. Mater. Sci. Eng. A 2015, 641, 290–296. [Google Scholar] [CrossRef]
- Chen, M.; Liu, H.; Wang, L.; Wang, C.; Zhu, K.; Xu, Z.; Jiang, C.; Ji, V. Evaluation of the residual stress and microstructure character in SAF 2507 duplex stainless steel after multiple shot peening process. Surf. Coat. Technol. 2018, 344, 132–140. [Google Scholar] [CrossRef]
- Segurado, E.; Belzunce, F.J.; Pariente, I.F. Effect of low intensity shot peening treatments applied with different types of shots on the fatigue performance of a high-strength steel. Surf. Coat. Technol. 2018, 340, 25–35. [Google Scholar] [CrossRef]
- Maleki, E.; Unal, O.; Kashyzadeh, K.R. Effect of conventional, severe, over and re-shot peening process on the fatigue behaviour of mild carbon steel. Surf. Coat. Technol. 2018, 344, 62–74. [Google Scholar] [CrossRef]
- Maleki, E.; Unal, O. Roles of surface coverage increase and re-peening on properties of AISI 1045 carbon steel in conventional and severe shot peening processes. Surf. Interfaces 2018, 11, 82–90. [Google Scholar] [CrossRef]
- Trško, L.; Bokůvka, O.; Nový, F.; Guagliano, M. Effect of severe shot peening on ultra-high-cycle fatigue of a low-alloy steel. Mat. Des. 2014, 57, 103–113. [Google Scholar] [CrossRef]
- Trško, L.; Guagliano, M.; Bokůvka, O.; Nový, F.; Jambor, M.; Florková, Z. Influence of Severe Shot Peening on the Surface State and Ultra-High-Cycle Fatigue Behavior of an AW 7075 Aluminum Alloy. J. Mater. Eng. Perform. 2017, 26, 2784–2797. [Google Scholar] [CrossRef]
- Trško, L.; Fintová, S.; Nový, F.; Bokůvka, O.; Jambor, M.; Pastorek, F.; Florková, Z.; Oravcová, M. Study of Relation between Shot Peening Parameters and Fatigue Fracture Surface Character of an AW 7075 Aluminium Alloy. Metals 2018, 8, 111. [Google Scholar] [CrossRef]
- Moorthy, V.; Shaw, B.A.; Mountford, P.; Hopkins, P. Magnetic Barkhausen noise emission technique for evaluation of residual stress alteration by grinding in case—Carburized En36 steel. Acta Mater. 2005, 53, 4997–5006. [Google Scholar] [CrossRef]
- Dhar, A.; Clapham, L.; Atherton, D.L. Influence of uniaxial plastic deformation on magnetic Barkhausen noise in steel. NDTE Int. 2001, 34, 507–514. [Google Scholar] [CrossRef]
- Fiorillo, F.; Küpferling, M.; Appino, C. Magnetic hysteresis and Barkhausen noise in plastically deformed steel sheets. Metals 2018, 8, 15. [Google Scholar] [CrossRef]
- Baak, N.; Schaldach, F.; Nickel, J.; Biermann, D.; Walther, F. Barkhausen noise assessment of the surface conditions due to deep hole drilling and their influence on the fatigue behavior of AISI 4140. Metals 2018, 8, 720. [Google Scholar] [CrossRef]
- Santa-aho, S.; Vippola, M.; Sorsa, A.; Leiviskä, K.; Lindgren, M.; Lepistö, T. Utilization of Barkhausen noise magnetizing sweeps for case-depth detection from hardened steel. NDTE Int. 2012, 52, 95–102. [Google Scholar] [CrossRef]
- Baak, N.; Garlich, M.; Schmiedt, A.; Bambach, M.; Walther, F. Characterization of residual stresses in austenitic disc springs induced by martensite formation during incremental forming using micromagnetic methods. Mater. Test. 2017, 59, 309–314. [Google Scholar] [CrossRef]
- Čížek, J.; Neslušan, M.; Čilliková, M.; Mičietová, A.; Melikhova, O. Modification of steel surfaces induced by turning: Non-destructive characterization using Barkhausen noise and positron annihilation. J. Phys. D Appl. Phys. 2014, 47, 1–17. [Google Scholar] [CrossRef]
- Bayramoglu, S.; Gür, C.H.; Alexandrov, I.V.; Abramova, M.M. Characterization of ultra-fine grained steel samples produced by high pressure torsion via magnetic Barkhausen noise analysis. Mater. Sci. Eng. A 2010, 527, 927–933. [Google Scholar] [CrossRef]
- Neslušan, M.; Čížek, J.; Kolařík, K.; Minárik, P.; Čilliková, M.; Melikhová, O. Monitoring of grinding burn via Barkhausen noise emission in case-hardened steel in large-bearing production. J. Mater. Process. Technol. 2017, 240, 104–117. [Google Scholar] [CrossRef]
- Neslušan, M.; Čížek, J.; Zgútová, K.; Kejzlar, P.; Šrámek, J.; Čapek, J.; Hruška, P.; Melikhova, O. Microstructural transformation of a rail surface induced by severe thermoplastic deformation and its non-destructive monitoring via Barkhausen noise. Wear 2018, 402, 38–48. [Google Scholar] [CrossRef]
- Theiner, W.A.; Hauk, V. Non-Destructive Characterization of Shot Peened Surface States by the Magnetic Barkhausen Noise Method. In Proceedings of the 12th World Conference on Non-Destructive Testing, Amsterdam, The Netherland, 23–28 April 1989; pp. 583–587. [Google Scholar]
- Sorsa, A.; Santa-Aho, S.; Wartiainen, J.; Souminen, L.; Vippola, M.; Leviskä, K. Effect of shot peening parameters to residual stress profiles and Barkhausen noise. J. Non-Destruct. Eval. 2018, 37, 1–11. [Google Scholar] [CrossRef]
- Gur, C.H.; Savas, S. Measuring of surface residual stresses in shot peened steel components by magnetic Barkhausen noise method. In Proceedings of the 18th World Conference on Non-Destructive Testing, Durban, South Africa, 16–20 April 2012. [Google Scholar]
- Tiitto, K.; Francino, P. Testing shot peening stresses in the field. Int. Newslett. Shot Peening Surf. Finish. Ind. 1991, 4, 1–2. [Google Scholar]
- Marconi, P.; Lauro, M.; Bozzolo, W. Shot peening on Pelton wheels: Methods of control and results. In Proceedings of the 4th International Conference on Barkhausen Noise and Micromagnetic Testing, Brescia, Italy, 3–4 July 2003; pp. 151–158. [Google Scholar]
- Moorthy, V.; Shaw, B.A.; Evans, J.T. Evaluation of tempering induced changes in the hardness profile of case-carburised EN36 steel using magnetic Barkhausen noise analysis. NDT&E Int. 2003, 36, 43–49. [Google Scholar] [CrossRef]
- Scardi, P.; Leoni, M. Line profile analysis: Pattern modeling versus profile fitting. J. Appl. Crystallogr. 2006, 39, 24–31. [Google Scholar] [CrossRef]
- Ribárik, G.; Ungár, T.; Gubicza, J. MWP-fit: A program for multiple whole-profile fitting of diffraction peak profiles by ab initio theoretical functions. J. Appl. Crystallogr. 2001, 34, 669–676. [Google Scholar] [CrossRef]
- Ribárik, G.; Ungár, T. Characterization of the microstructure in random and textured polycrystals and single crystals by diffraction line profile analysis. Mater. Sci. Eng. A 2010, 528, 112–121. [Google Scholar] [CrossRef]
- Scardi, P.; Leoni, M. Whole powder pattern modeling. Acta Crystallogr. A 2002, 58, 190–200. [Google Scholar] [CrossRef]
- Matěj, Z.; Kužel, R.; Nichtová, L. XRD total pattern fitting applied to study of microstructure of TiO2 films. Powder Diffr. 2010, 25, 125–131. [Google Scholar] [CrossRef]
- Karpuschewski, B.; Bleicher, O.; Beutner, M. Surface integrity inspection on gears using Barkhausen noise analysis. Proc. Eng. 2011, 19, 162–171. [Google Scholar] [CrossRef]
- Krause, T.W.; Mandala, K.; Atherton, D.L. Modeling of magnetic Barkhausen noise in single and dual easy axis systems in steel. J. Magn. Magn. Mater. 1999, 195, 193–205. [Google Scholar] [CrossRef]
- Kleber, X.; Vincent, A. On the role of residual internal stresses and dislocations on Barkhausen noise in plastically deformed steel. NDTE Int. 2004, 37, 439–445. [Google Scholar] [CrossRef]
- He, Y.; Mehdi, M.; Hilinski, E.J.; Edrisy, A. The coarse-process characterization of local anisotropy on non-oriented electrical steel using magnetic Barkhausen noise. J. Magn. Magn. Mater. 2018, 453, 149–162. [Google Scholar] [CrossRef]
- Varga, R. Domain Walls and Their Dynamics, 1st ed.; Pavol Jozef Šafárik University: Košice, Slovakia, 2014; pp. 32–41. [Google Scholar]
- Ng, D.H.L.; Cho, K.S.; Wong, M.L.; Chan, S.L.I.; Ma, X.Y.; Lo, C.C.H. Study of microstructure, mechanical properties, and magnetization process in low carbon steel bars by Barkhausen emission. Mater. Sci. Eng. A 2003, 358, 186–198. [Google Scholar] [CrossRef]


| Fe | C | Mn | P | S |
|---|---|---|---|---|
| balance | 0.70 | 0.75 | max. 0.04 | max. 0.05 |
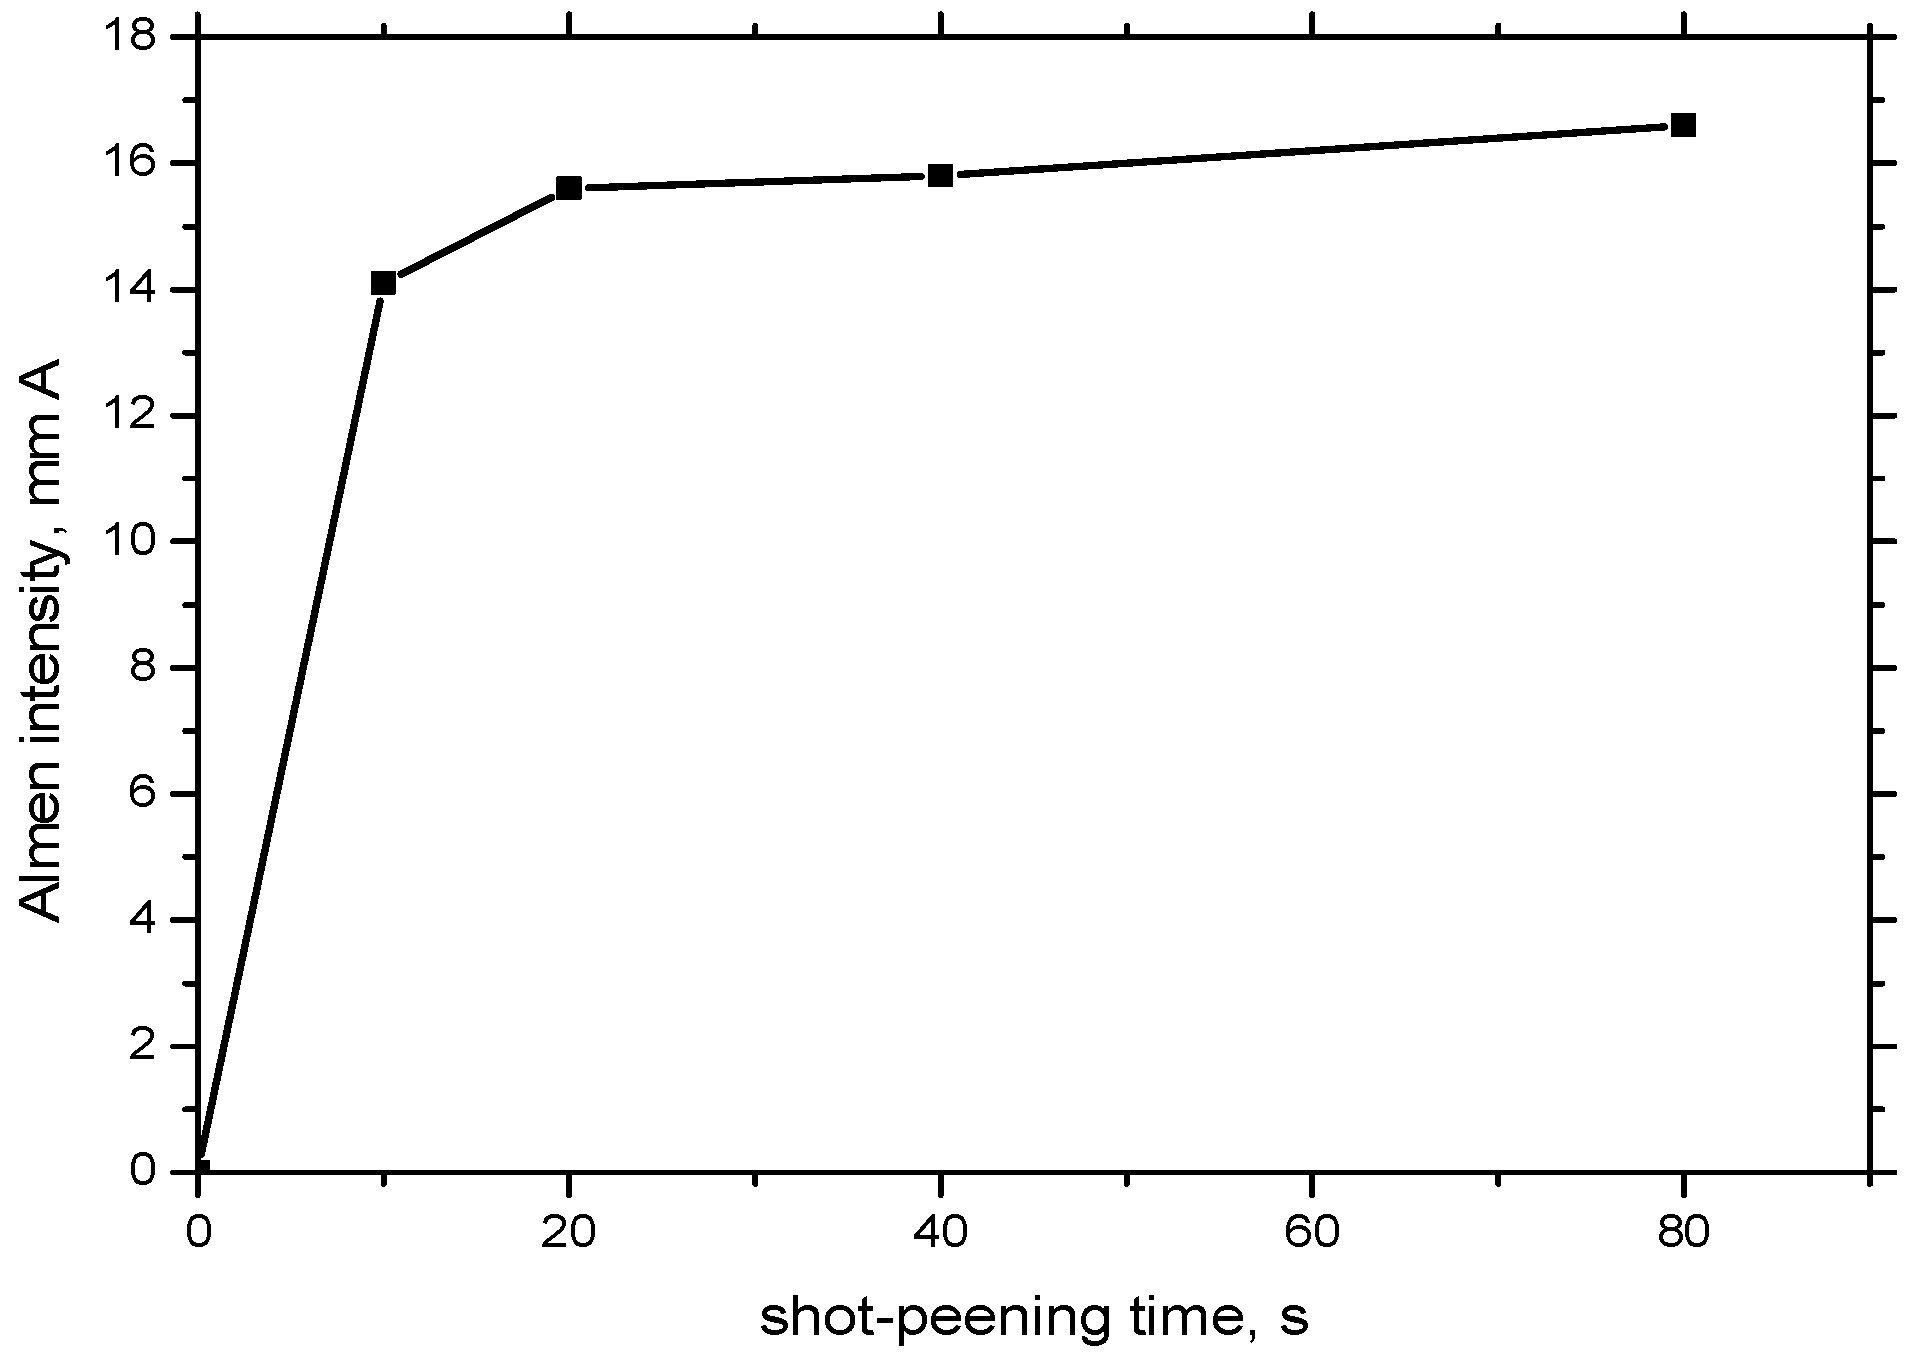
| Shot Peening Time (s) | Shot Size (mm-S170) | Almen Intensity (mm A) | Ra (µm) | Rz (µm) |
|---|---|---|---|---|
| 10 | 0.4318 | 14.1 | 4.41 ± 0.20 | 31.53 ± 2.50 |
| 20 | 0.4318 | 15.6 | 4.70 ± 0.18 | 34.00 ± 1.73 |
| 40 | 0.4318 | 15.8 | 4.59 ± 0.14 | 33.02 ± 4.01 |
| 80 | 0.4318 | 16.6 | 5.48 ± 0.41 | 37.67 ± 3.06 |
© 2018 by the authors. Licensee MDPI, Basel, Switzerland. This article is an open access article distributed under the terms and conditions of the Creative Commons Attribution (CC BY) license (http://creativecommons.org/licenses/by/4.0/).
Share and Cite
Neslušan, M.; Trško, L.; Minárik, P.; Čapek, J.; Bronček, J.; Pastorek, F.; Čížek, J.; Moravec, J. Non-Destructive Evaluation of Steel Surfaces after Severe Plastic Deformation via the Barkhausen Noise Technique. Metals 2018, 8, 1029. https://doi.org/10.3390/met8121029
Neslušan M, Trško L, Minárik P, Čapek J, Bronček J, Pastorek F, Čížek J, Moravec J. Non-Destructive Evaluation of Steel Surfaces after Severe Plastic Deformation via the Barkhausen Noise Technique. Metals. 2018; 8(12):1029. https://doi.org/10.3390/met8121029
Chicago/Turabian StyleNeslušan, Miroslav, Libor Trško, Peter Minárik, Jiří Čapek, Jozef Bronček, Filip Pastorek, Jakub Čížek, and Ján Moravec. 2018. "Non-Destructive Evaluation of Steel Surfaces after Severe Plastic Deformation via the Barkhausen Noise Technique" Metals 8, no. 12: 1029. https://doi.org/10.3390/met8121029
APA StyleNeslušan, M., Trško, L., Minárik, P., Čapek, J., Bronček, J., Pastorek, F., Čížek, J., & Moravec, J. (2018). Non-Destructive Evaluation of Steel Surfaces after Severe Plastic Deformation via the Barkhausen Noise Technique. Metals, 8(12), 1029. https://doi.org/10.3390/met8121029