Article

Crystallization Kinetics of 50% W Particles/Zr41.2Ti13.8Cu12.5Ni10Be22.5 Metallic Glass Matrix Composite

Department of Basic Course, Naval University of Engineering, Wuhan 430033, China
*
Author to whom correspondence should be addressed.
Metals 2018, 8(12), 1011; https://doi.org/10.3390/met8121011
Submission received: 14 October 2018 / Revised: 27 November 2018 / Accepted: 27 November 2018 / Published: 2 December 2018

Abstract

:
The crystallization kinetics of the 50% W particles/Zr41.2Ti13.8Cu12.5Ni10Be22.5 metallic glass matrix composite were studied by differential scanning calorimetry (DSC), X-ray diffraction (XRD), and scanning electron microscopy/energy dispersive spectroscopy (SEM/EDS). The results showed that the crystallization and the glass transition of the composite both have a kinetic effect. The characteristic temperatures Tg and Tx of the composite are linearly related to the natural logarithm of the heating rate (lnφ), and the presence of W particles increases the dependence of the glass transition on the heating rate. With the addition of W particles, the viscosity of the amorphous matrix in the supercooled liquid region increases, which hinders the spread and migration of the alloy elements and causes the thermal stability of the supercooled liquid to improve. In the isothermal crystallization, the mode of nucleation and the growth process of the crystal changes with the annealing temperature. The Avrami exponent with the crystallized fraction at 698 K was about 2.5 in the middle stage of the crystallization, implying three-dimensional growth with a constant nucleation rate.

1. Introduction

The important application value of Zr-based bulk metallic glass (BMG) can be attributed to its unique properties, such as high strength, high hardness, self-sharpening, and good corrosion resistance [1,2,3,4,5,6,7], but its brittleness at room temperature limits its further application. Currently, the main solution to the brittleness is improving the room temperature plasticity of BMG via the in situ or ex situ introduction of appropriate second phases to the amorphous matrix to obtain bulk metallic glass matrix composite (BMGMC), which has been widely researched [8,9,10,11,12,13,14,15]. The addition of plastic W into Zr-based metallic glass can significantly improve its comprehensive mechanical properties and penetrating capability, so the W/Zr based metallic glass composite has been considered to have good application prospects in weapons such as armored bombs [16,17]. Therefore, much research has been conducted on W/Zr-based metallic glass composites [18,19,20,21,22,23,24]. Conner et al. studied the mechanical properties of a tungsten fiber-reinforced Zr41.25Ti13.75Cu12.5Ni10Be22.5 metallic glass matrix composite and found that tungsten reinforcement increases the compressive strain to failure by over 900% compared to the unreinforced Zr41.25Ti13.75Cu12.5Ni10Be22.5 [18]. Xue et al. introduced a Zr-based BMGMC by infiltrating the Zr38Ti17Cu10.5Co12Be22.5 melt into porous tungsten and studied the dynamic mechanism of fracture and deformation behavior of this composite [21]. Qiu and his team prepared 60 vol.% W particles-reinforced Zr41.2Ti13.8Cu12.5Ni10Be22.5 BMGMC and reported that the plasticity and dynamic compression strength for the composite both increased when W particles were added [23]. The crystallization kinetics of the W/Zr-based metallic glass composite in the supercooled liquid phase plays an important role in the superplastic formation and application of the composite. However, relevant studies have not been reported to date.
As an ideal amorphous material, the Zr41.2Ti13.8Cu12.5Ni10Be22.5 alloy has a strong glass-forming ability and good thermal stability [25], which is suitable for matrix material. In this paper, the 50% W particles/Zr41.2Ti13.8Cu12.5Ni10Be22.5 metallic glass matrix composite was prepared, and the crystallization kinetics of the material were studied by X-ray diffraction (XRD), scanning electron microscopy/energy dispersive spectroscopy (SEM/EDS), and differential scanning calorimetry (DSC).

2. Materials and Methods

Ingots of the Zr41.2Ti13.8Cu12.5Ni10Be22.5 master alloy were prepared by arc melting a mixture of the elements having a purity of 99.95 at.% or better. Subsequently, the pre-alloyed ingots were ground into powder and then the pre-alloyed powder and the 50 vol.% W particles (200–700 μm in size, purity of 99%) were mixed by ball milling for 5 min under argon gas protection. The mixing powder was pressed into a lump, and the lump was loaded into a steel tube with a diameter of 6 mm at a vacuum degree of 1 × 10⁻³ Pa. The steel tube was then quickly introduced into a resistance furnace at 1370 K and kept for 5 min, and finally the steel tube was quenched in saturated brine [23].
The Zr41.2Ti13.8Cu12.5Ni10Be22.5 metallic glass and the W particles/Zr41.2Ti13.8Cu12.5Ni10Be22.5 metallic glass matrix composite were cut into Φ3 × 0.5 mm sheets by wire-cutting, and polished using metallographic paper for DSC (Mettler–Toledo TGA/DSC 1, METTLER TOLEDO, Zurich, Switzerland) tests. The structure of the materials was identified by XRD (Cu Kα radiation, Philips X’pert PRO, Philips Japan, Ltd., Tokyo, Japan) and SEM combined with EDS (QUANTA 400, FEI, Eindhoven, Netherlands). Five points were selected for EDS and the error of the result was less than 5%. DSC measurements were performed under a constant flow of high-purity Ar, the non-isothermal DSC was carried out from 298 K to 923 K at heating rates ranging from 10 to 80 K/min, and the isothermal DSC was carried out at various temperatures in the supercooled liquid region for 60 min. In order to reduce the measurement error, three replicas were performed for each heating rate.

3. Results and Discussion

3.1. Structure

The XRD patterns of the Zr41.2Ti13.8Cu12.5Ni10Be22.5 metallic glass and the W particles/Zr41.2Ti13.8Cu12.5Ni10Be22.5 metallic glass matrix composite are shown in Figure 1. The typical scattering diffusion peak is found from the curve of the Zr41.2Ti13.8Cu12.5Ni10Be22.5 BMG, which indicates an amorphous structure of the material. Apart from the characteristic diffraction peak of W and the amorphous scattering diffusion peak, no other crystalline-phase diffraction peaks are observed in the curve of the composite, implying that the amorphous matrix and the W particles retain their original structures.
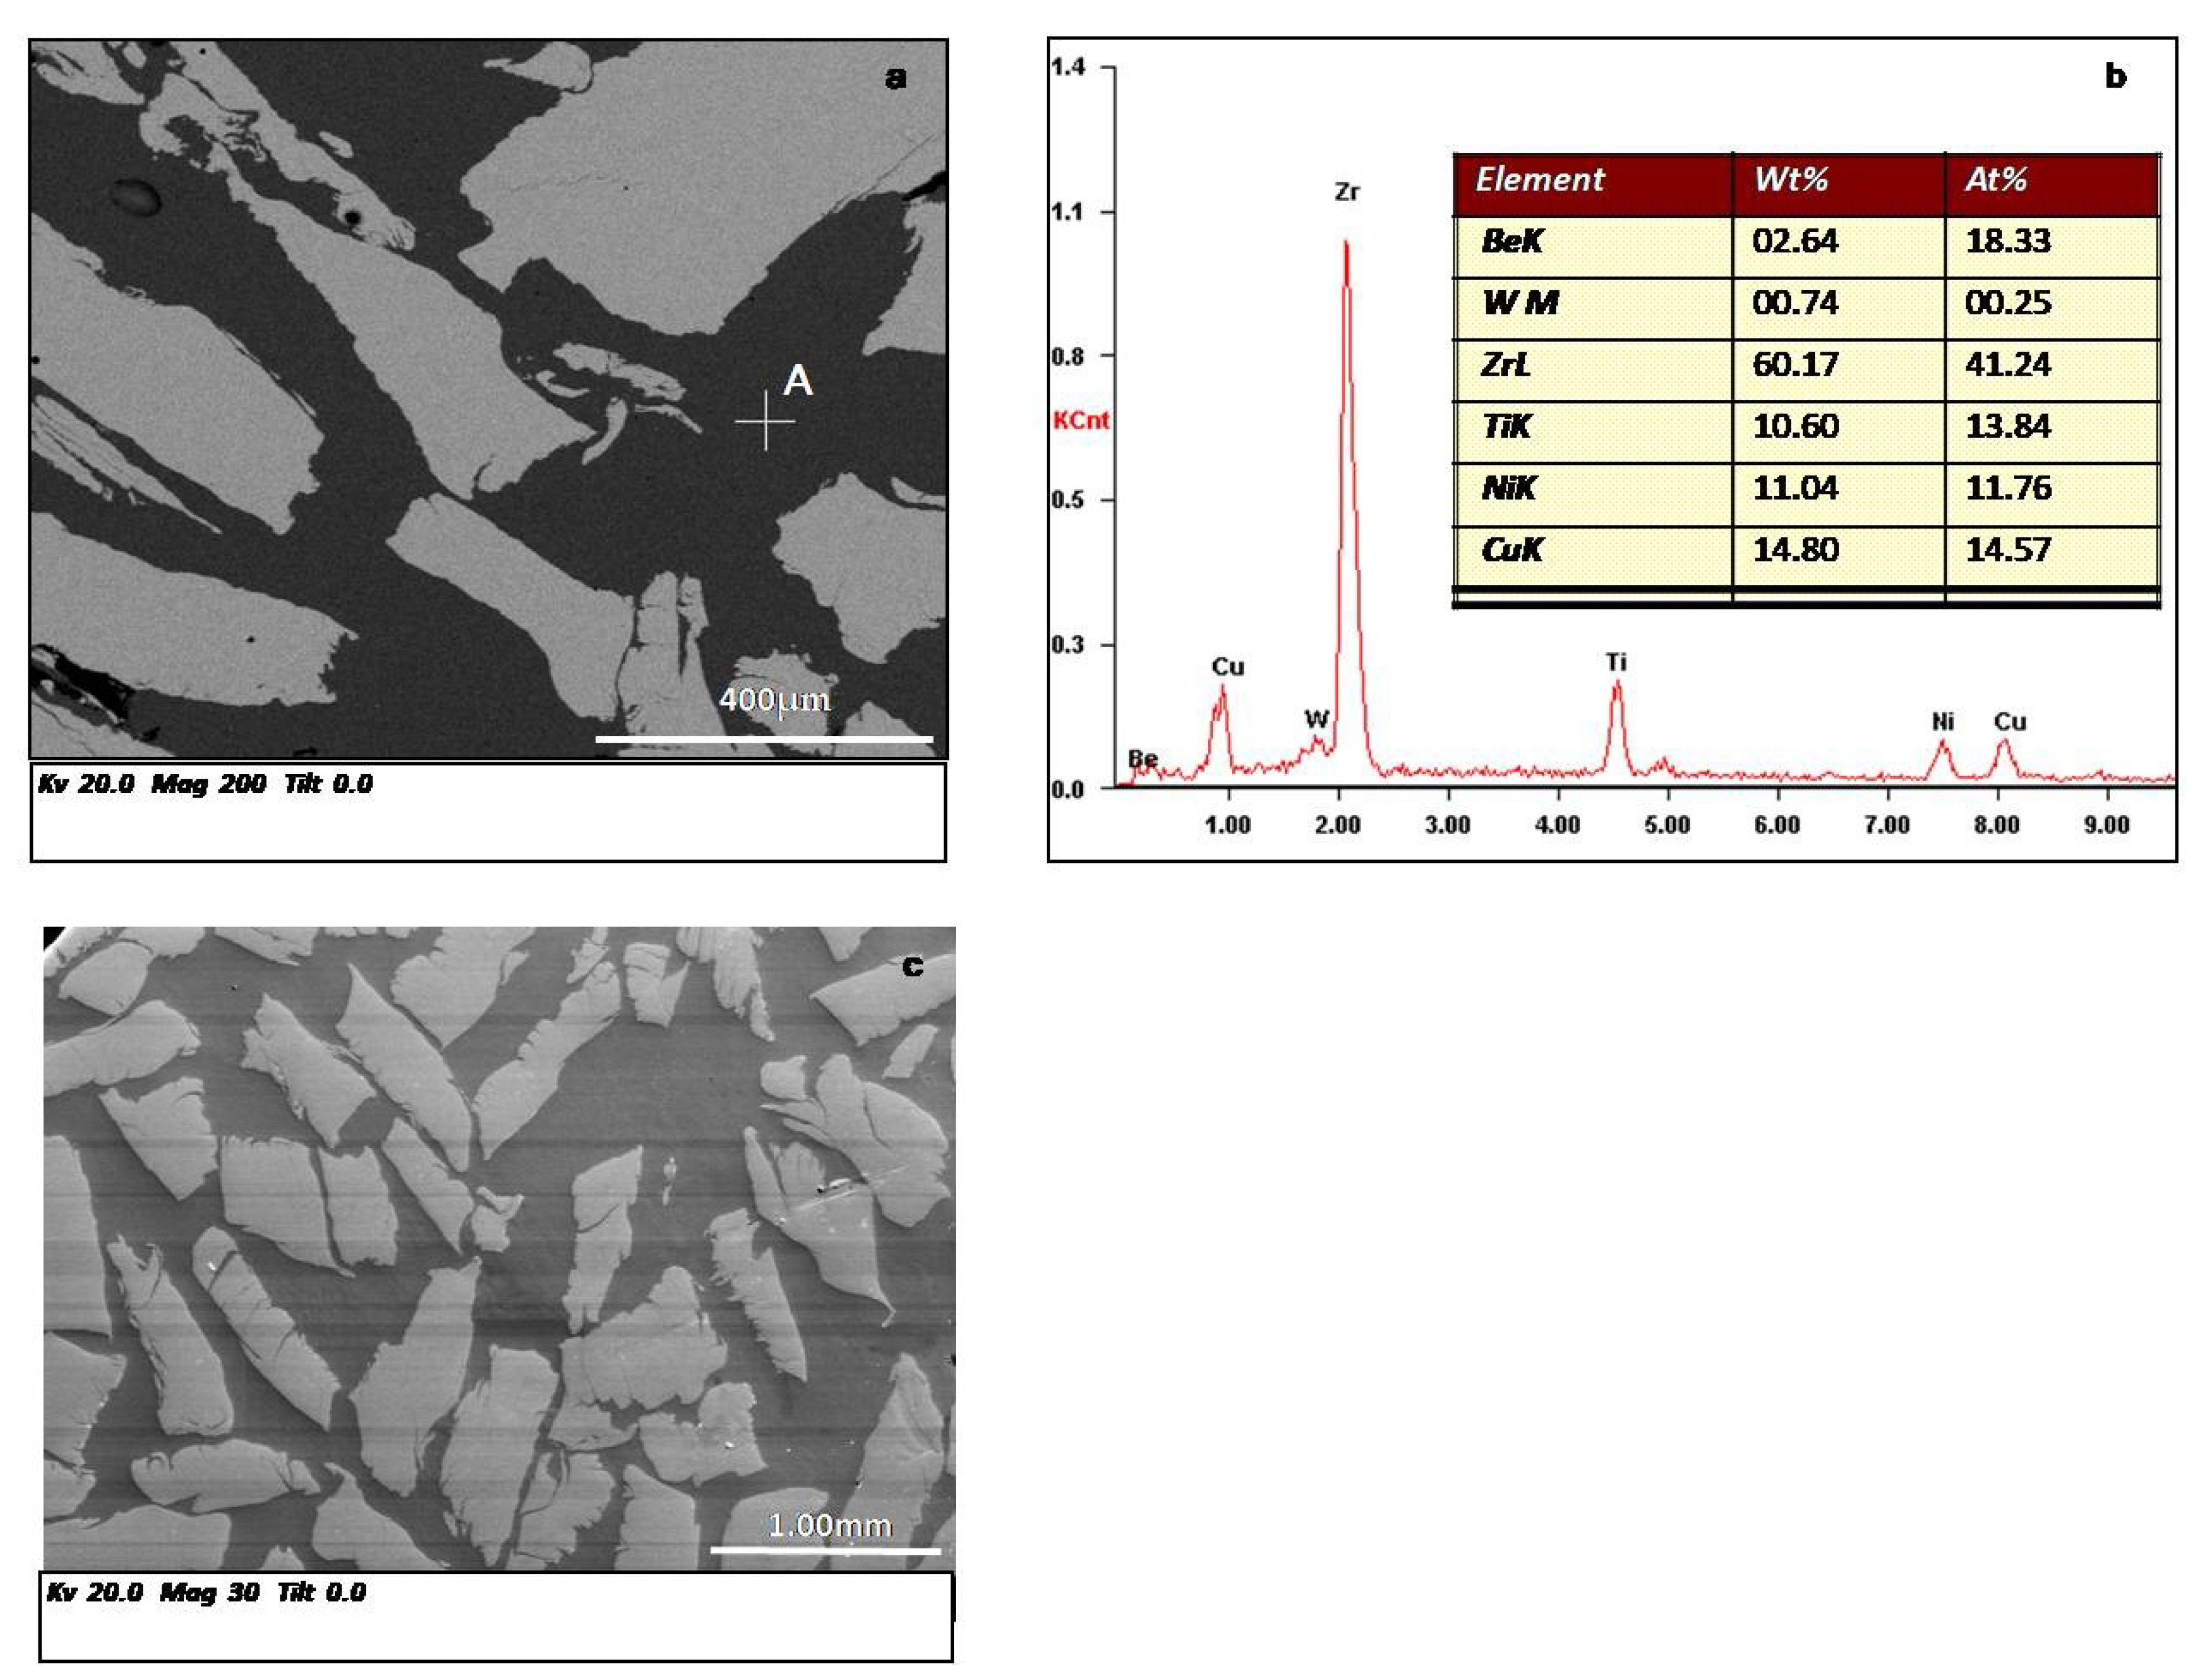
The SEM micrograph of the W particles/Zr41.2Ti13.8Cu12.5Ni10Be22.5 metallic glass matrix composite is shown in Figure 2a,c, in which the white W particles are evenly dispersed in the black metallic glass matrix. At the same time, there are no reaction layers in the interface between the W particles and the amorphous matrix. According to the EDS spectrum (Figure 2b) of the black metallic glass matrix in region A, the W content of 0.36% in the amorphous matrix indicates that the second-phase W atoms are partly dissolved into the amorphous matrix during the preparation of the composite. Similar results were reported in the W particles/Zr57Nb5Al10Cu15.4Ni12.6 metallic glass matrix composite [26].

3.2. Crystallization Kinetics

The DSC curves at different heating rates of the Zr41.2Ti13.8Cu12.5Ni10Be22.5 metallic glass and the W particles/Zr41.2Ti13.8Cu12.5Ni10Be22.5 metallic glass matrix composite are shown in Figure 3. The DSC curves for the two materials exhibit a distinct endothermic event at the characteristic temperatures for the glass transition Tg, the onset of crystallization Tx, the first crystallization peak Tp1, the second crystallization peak Tp2, and an extended supercooled liquid region ΔT. All the characteristic thermal parameters are listed in Table 1.
It is presented in Table 1 that all the characteristic temperatures Tg, Tx, and Tp of the metallic glass Zr41.2Ti13.8Cu12.5Ni10Be22.5 and the W particles/Zr41.2Ti13.8Cu12.5Ni10Be22.5 metallic glass matrix composite move to high-temperature regions with an increase in the heating rate, and the error of the characteristic temperature is ±0.5 K. The DSC results indicate that the crystallization behavior and glass transition behavior of the two materials both have a kinetic effect. In addition to this, the supercooled liquid regions ΔT for the composite is larger than that of the metallic glass, indicating that the thermal stability of the composite is improved [27,28].
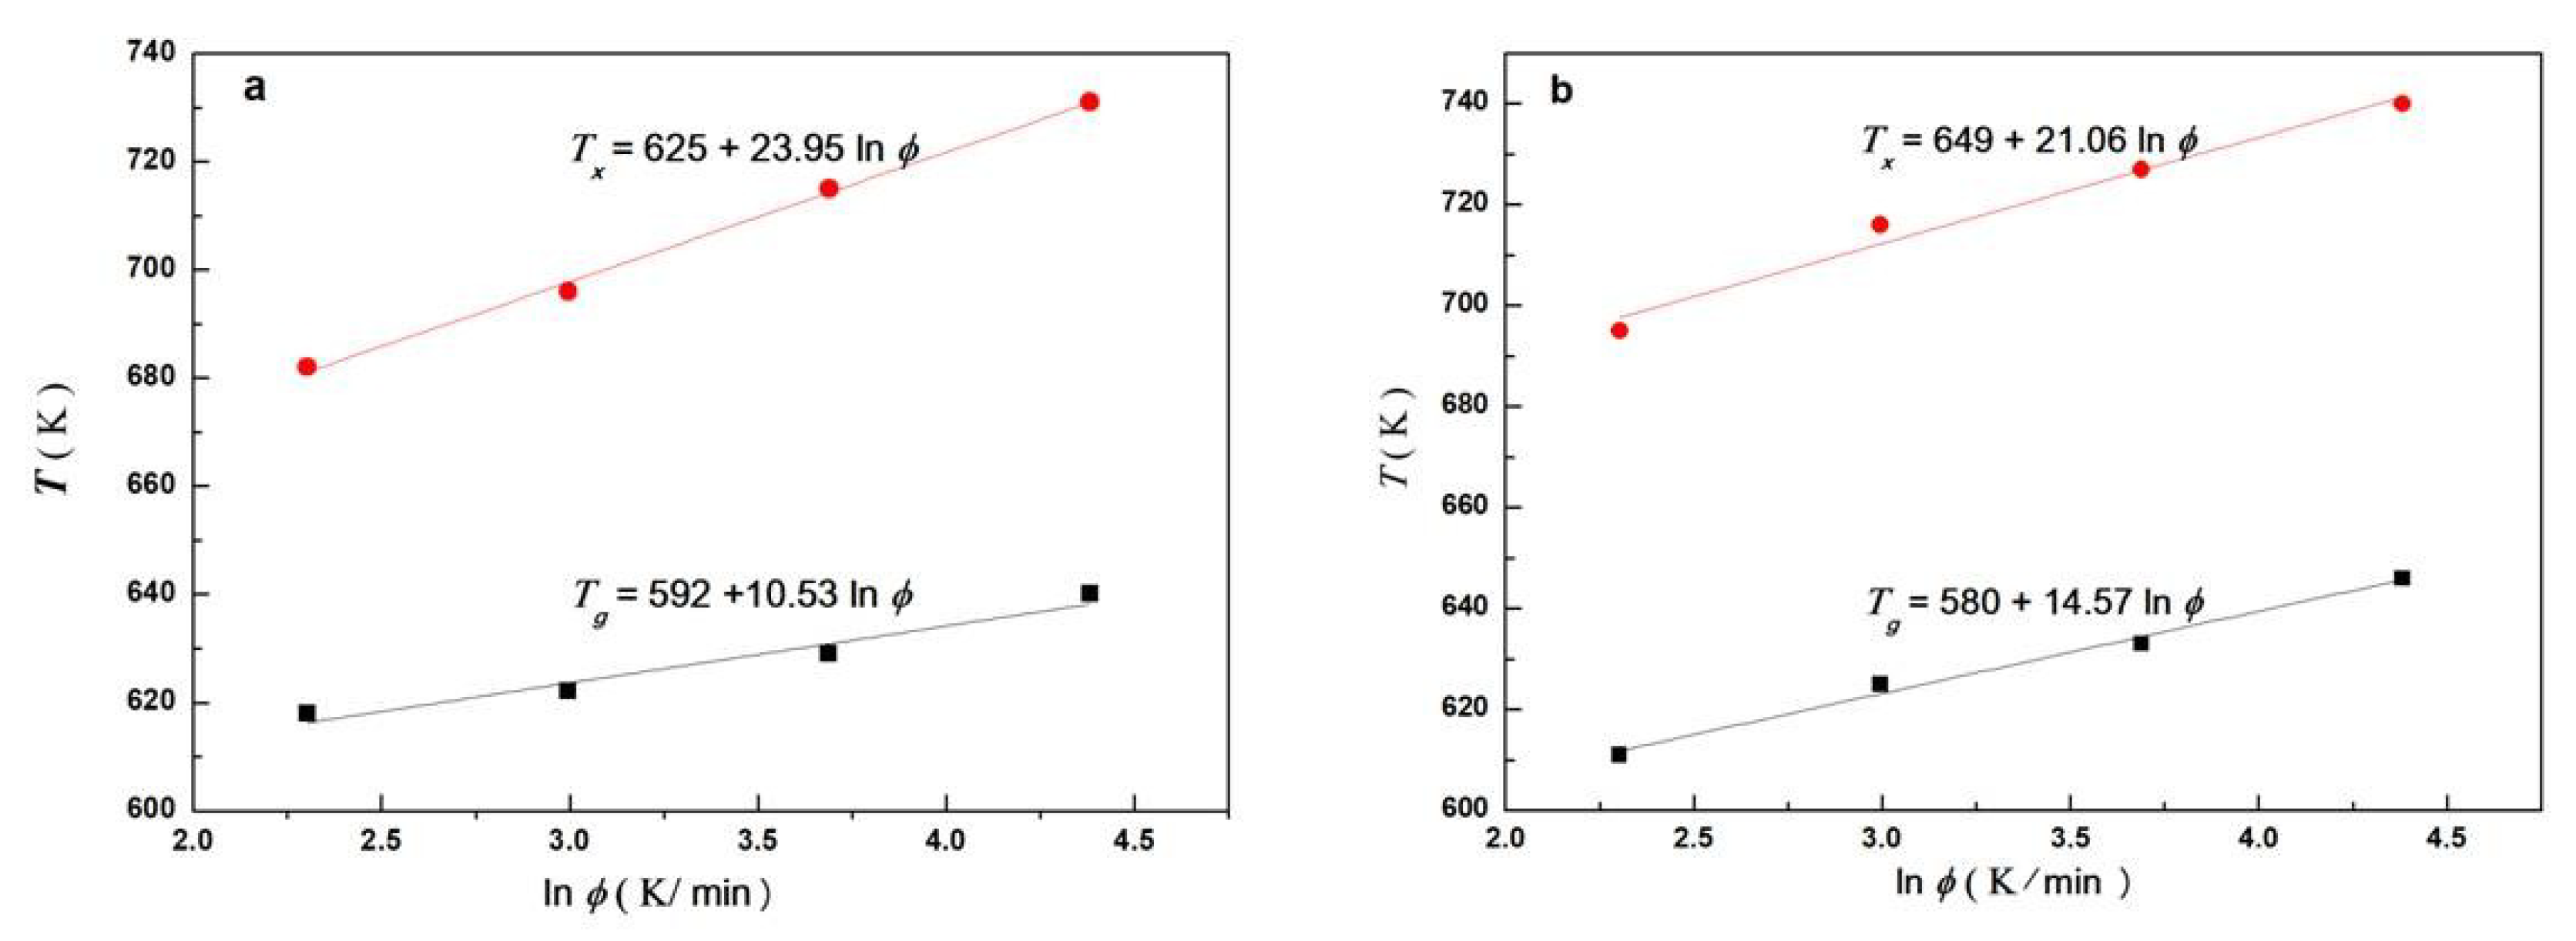
The Tg and Tx curves of the metallic glass and the composite with respect to the heating rate φ are shown in Figure 4. The characteristic temperature T (including Tg and Tx of the two materials) is linearly related to lnφ, and this relationship is called Lasocka’s relationship [29], which can be written as follows:
T = A + Blnφ
where T stands for the characteristic temperature, A and B are constants, and φ is the heating rate. The value of B reflects the dependence of Tg and Tx on the heating rate φ. The B values for the crystallization of the metallic glass and the composite are 23.95 (error of 0.93%) and 21.06 (error of 2.2%), respectively. However, the B values for the glass transition of the two materials are only 10.53 (error of 1.60%) and 14.57 (error of 1.13%), respectively. Therefore, the kinetic effect of crystallization is stronger than that of glass transition. In addition to this, the B value of 14.57 of the glass transition for the composite is greater than that of the metallic glass (10.53), indicating that the 50% W particles in the composite increase the dependence of the glass transitions on the heating rate.
The activation energy of the Zr41.2Ti13.8Cu12.5Ni10Be22.5 metallic glass and the W particles/Zr41.2Ti13.8Cu12.5Ni10Be22.5 metallic glass matrix composite in a continuous heating process can be obtained using the Kissinger equation, as follows:
ln(T2/φ) = E/RT + C
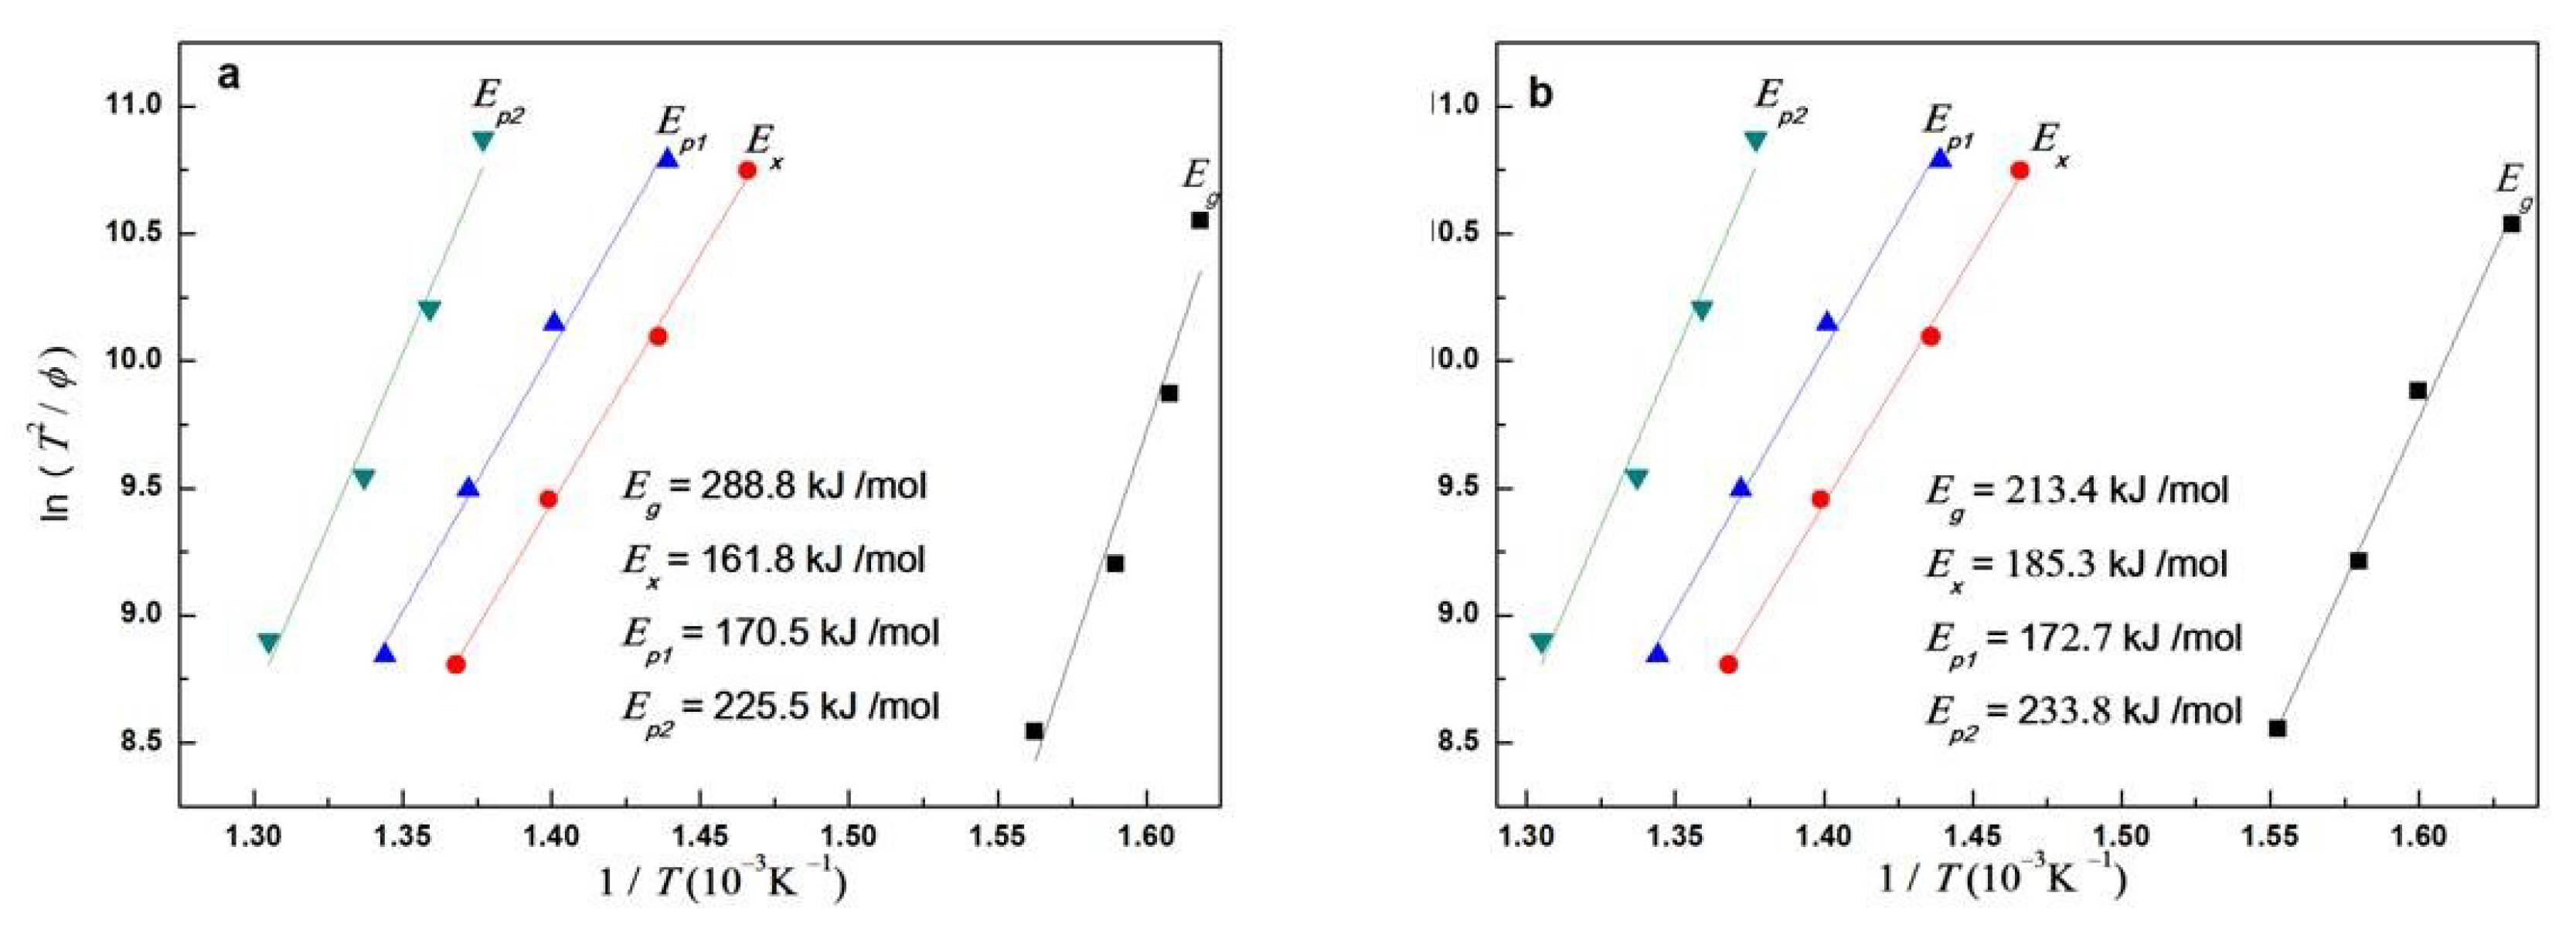
where T stands for the characteristic temperature, φ is the heating rate, E is the activation energy, R is the gas constant, and C is a constant. The curves of ln(T2/φ) and 1/T of the corresponding characteristic temperatures at different heating rates are obtained and shown in Figure 5. By a linear fitting method, the activation energy for the glass transition Eg, the activation energy for the onset temperature of crystallization Ex, the activation energy for the first peak temperature of crystallization Ep1, and the activation energy for the second peak temperature of crystallization Ep2 are calculated by the slope of the line, and the values of the activation energies are shown in Table 2. Table 2 shows that the activation energy for the glass transition of the composite is 213.4 kJ/mol, which is clearly lower than that of the metallic glass (288.8 kJ/mol). The reduction of the activation energy from the amorphous state to the supercooled liquid (glass transition) indicates that the barrier for the composite to overcome in the glass transition is lower than that of the metallic glass. At the same time, considering the experimental error, the crystallization activation energy for the onset crystallization (185.3 kJ/mol) of composites is similar to or even slightly above that of the metallic glass (161.8 kJ/mol), implying that the composite has a good thermal stability in the supercooled liquid region.
It can be concluded from the above data that the thermal stability of the W particles/Zr41.2Ti13.8Cu12.5Ni10Be22.5 metallic glass matrix composite is improved, which may be related to the viscosity of the composite melt in the supercooled liquid region. With the addition of W particles, the viscosity of the composite in the supercooled liquid region increases, which hinders the spread and migration of the alloy elements, allowing the thermal stability of the supercooled liquid to be improved [30]. On the question of whether the 0.36% W atoms dissolved in the amorphous matrix affect the thermal stability of the composite, Choi-Yim et al. conducted a similar study and found that nearly 0.4% W dissolved in the amorphous matrix Zr57Nb5Al10Cu15.4Ni12.6 bulk metallic glass, but the thermal stability of the matrix did not change after the addition of the W particles [26].
It was reported in Reference [31] that the influence of temperature on viscosity near the glass transition temperature can be expressed by the VTF (Vogel-Tamman-Fulcher) equation, and the viscosity decreases sharply with increasing the temperature. Thus, the Eg of the composite is lower than that of the metallic glass due to the increasing of the glass transition temperature. However, near the crystallization transition temperature, the viscosity of the supercooled liquid changes little with temperature, and the main influencing factor on viscosity is the addition of 50% W particles, so the Ex of the composite is similar to or even slightly above that of the metallic glass.

3.3. Isothermal Crystallization

The isothermal DSC curves of the W particles/Zr41.2Ti13.8Cu12.5Ni10Be22.5 metallic glass matrix composite at various temperatures in the supercooled liquid region are shown in Figure 6. The crystallization reaction occurs in the amorphous matrix after a certain incubation time at different temperatures. The time–temperature–transformation (TTT) curve for onset crystallization is shown in Figure 7, and the curve starts with the time point of crystallization phase volume fraction of 1%. With the increase of annealing temperature, the incubation period of crystallization becomes shorter and the crystallization peak becomes lower and broader. The reduction of the incubation time indicates that the crystallization rate of the composite increases with increasing the crystallization temperature. Figure 8 shows the crystallized fraction x as a function of annealing time. The curves at various temperatures all show a typical “S” shape, implying that the crystallization pathway is typical nucleation and growth. It is presented that the crystallization volume fraction changes relatively slowly in the early stage of crystallization because the atoms in the solid state are unable to spread. With increasing the annealing time, the crystallization volume fraction rapidly increases. At the late stage of crystallization, the crystallization volume fraction changes very little with the annealing time because less and less amorphous phase remains.
The isothermal crystallization kinetics of the W particles/Zr41.2Ti13.8Cu12.5Ni10Be22.5 metallic glass matrix composite is modeled by the JMA (Johnson–Mehl–Avrami) equation:
ln[−ln(1 − x)] = lnk + nln(t − τ)
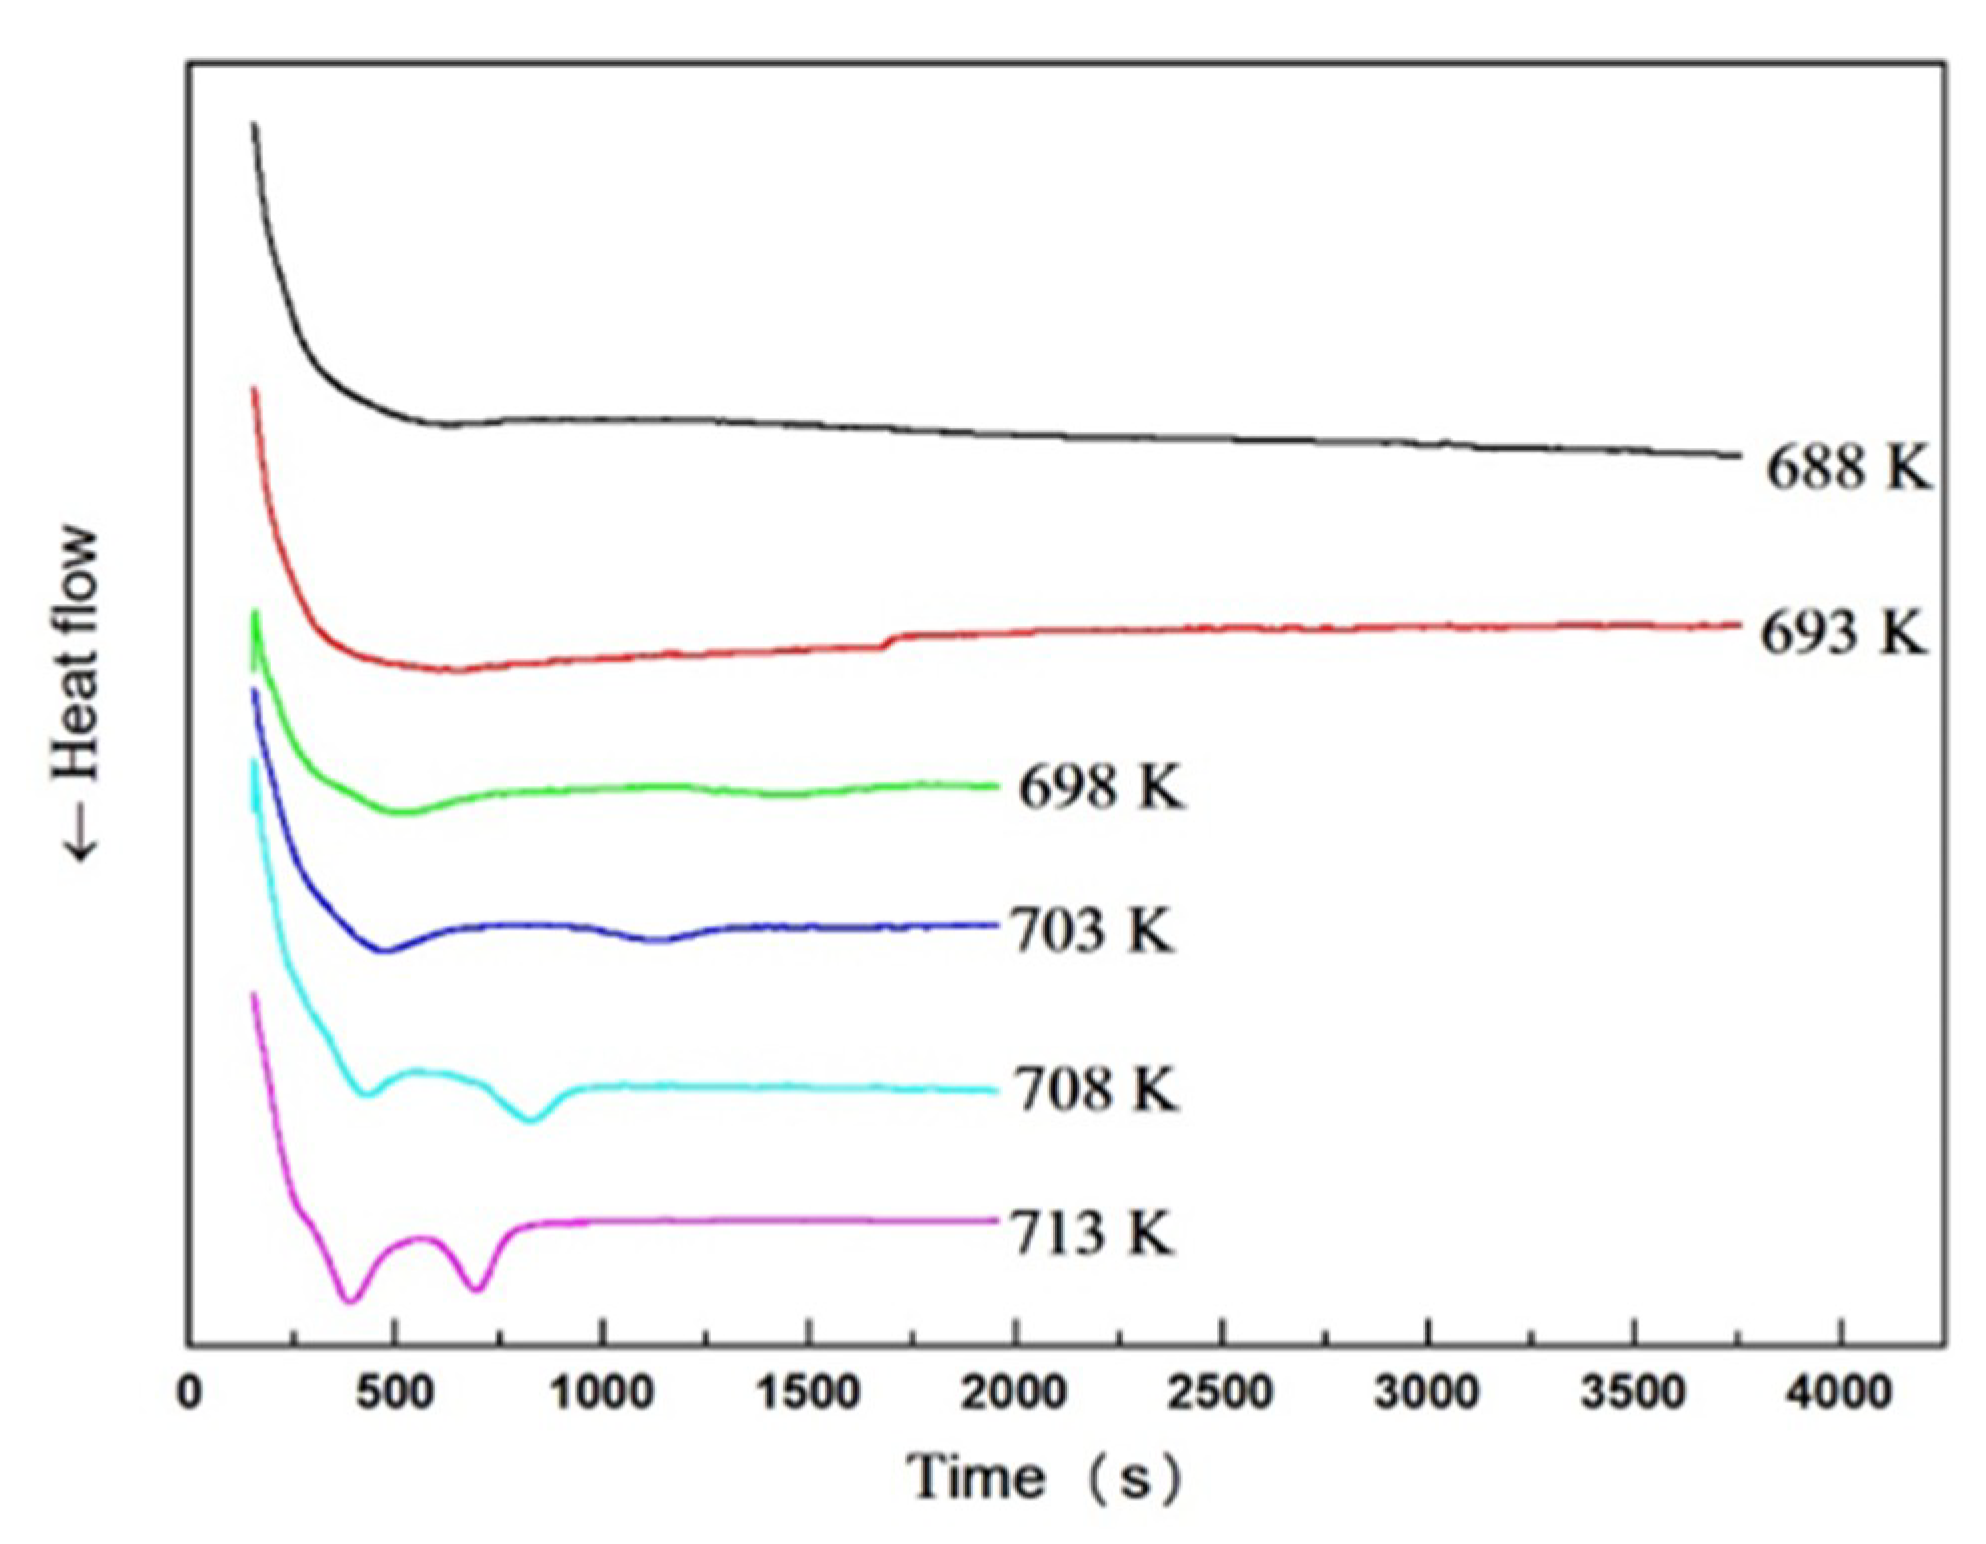
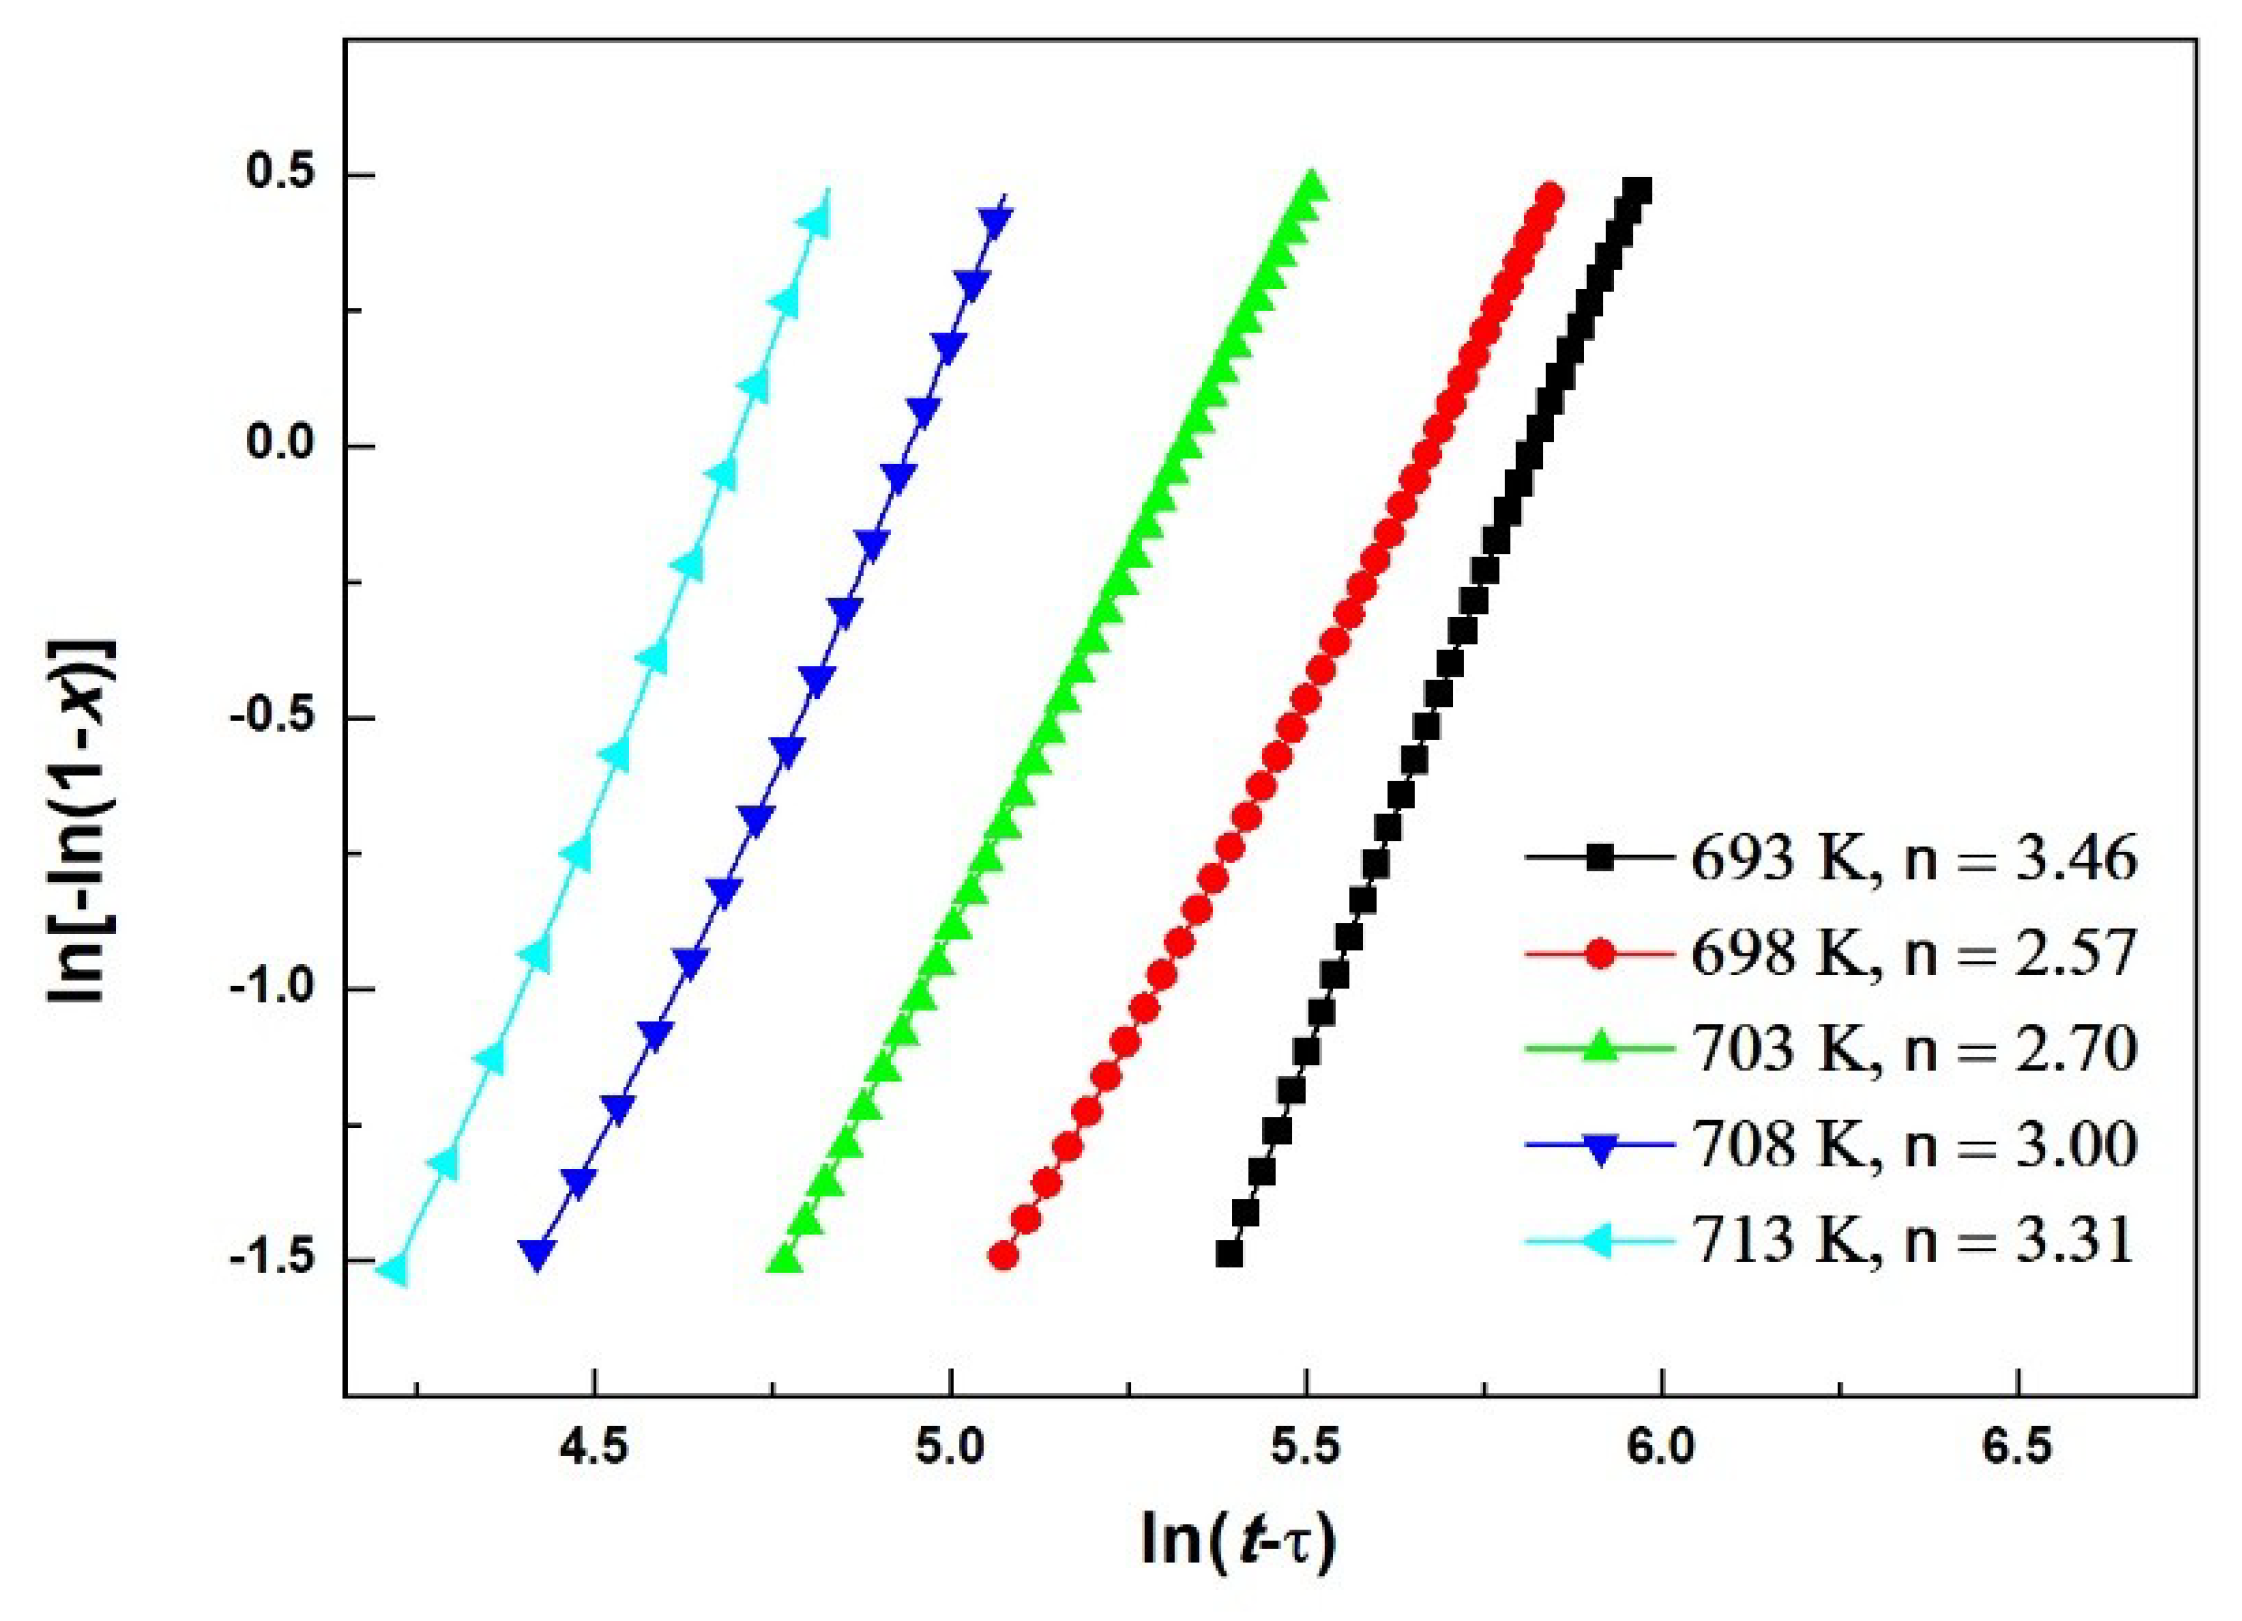
where x is the crystallized volume fraction (%), n is the Avrami exponent reflecting the mode of nucleation and growth in the amorphous alloy during crystallization, k is a reaction rate constant, t is the holding time, and τ is the incubation time taken as the interval between the time when the materials reach the annealing temperature and the start of the transformation. The JMA plots of isothermal crystallization at different temperatures for the composite obtained by ln[−ln(1 − x)] vs. ln(t − τ) (20% < x < 80%) are shown in Figure 9. The Avrami index n changes as the temperature changes, and the change of n reflects the constant change of the nucleation and growth process of the crystal [32]. At 698 K, n is close to 2.5 considering the experimental error, suggesting that the nucleation rate is constant and the growth of the crystal nucleus is controlled by diffusion. When the temperature is 703 K, n = 2.7, the nucleation rate increases with time, and the growth of the crystal nucleus is still controlled by diffusion. As the temperature rises to 708 K, n = 3.0, the growth of the crystal nucleus is controlled by the interface, and the nucleation rate is zero. As the temperature of isothermal crystallization continues to rise to 713 K, 3 < n < 4, indicating that the growth of the crystal nucleus is still controlled by the interface, but the nucleation rate decreases with time [33,34].
In order to investigate the details of the crystallization process, the local Avrami exponent n(x) is calculated using the following equation [35]:
n ( x ) = ln [ ln ( 1 x ) ] ln ( t τ )
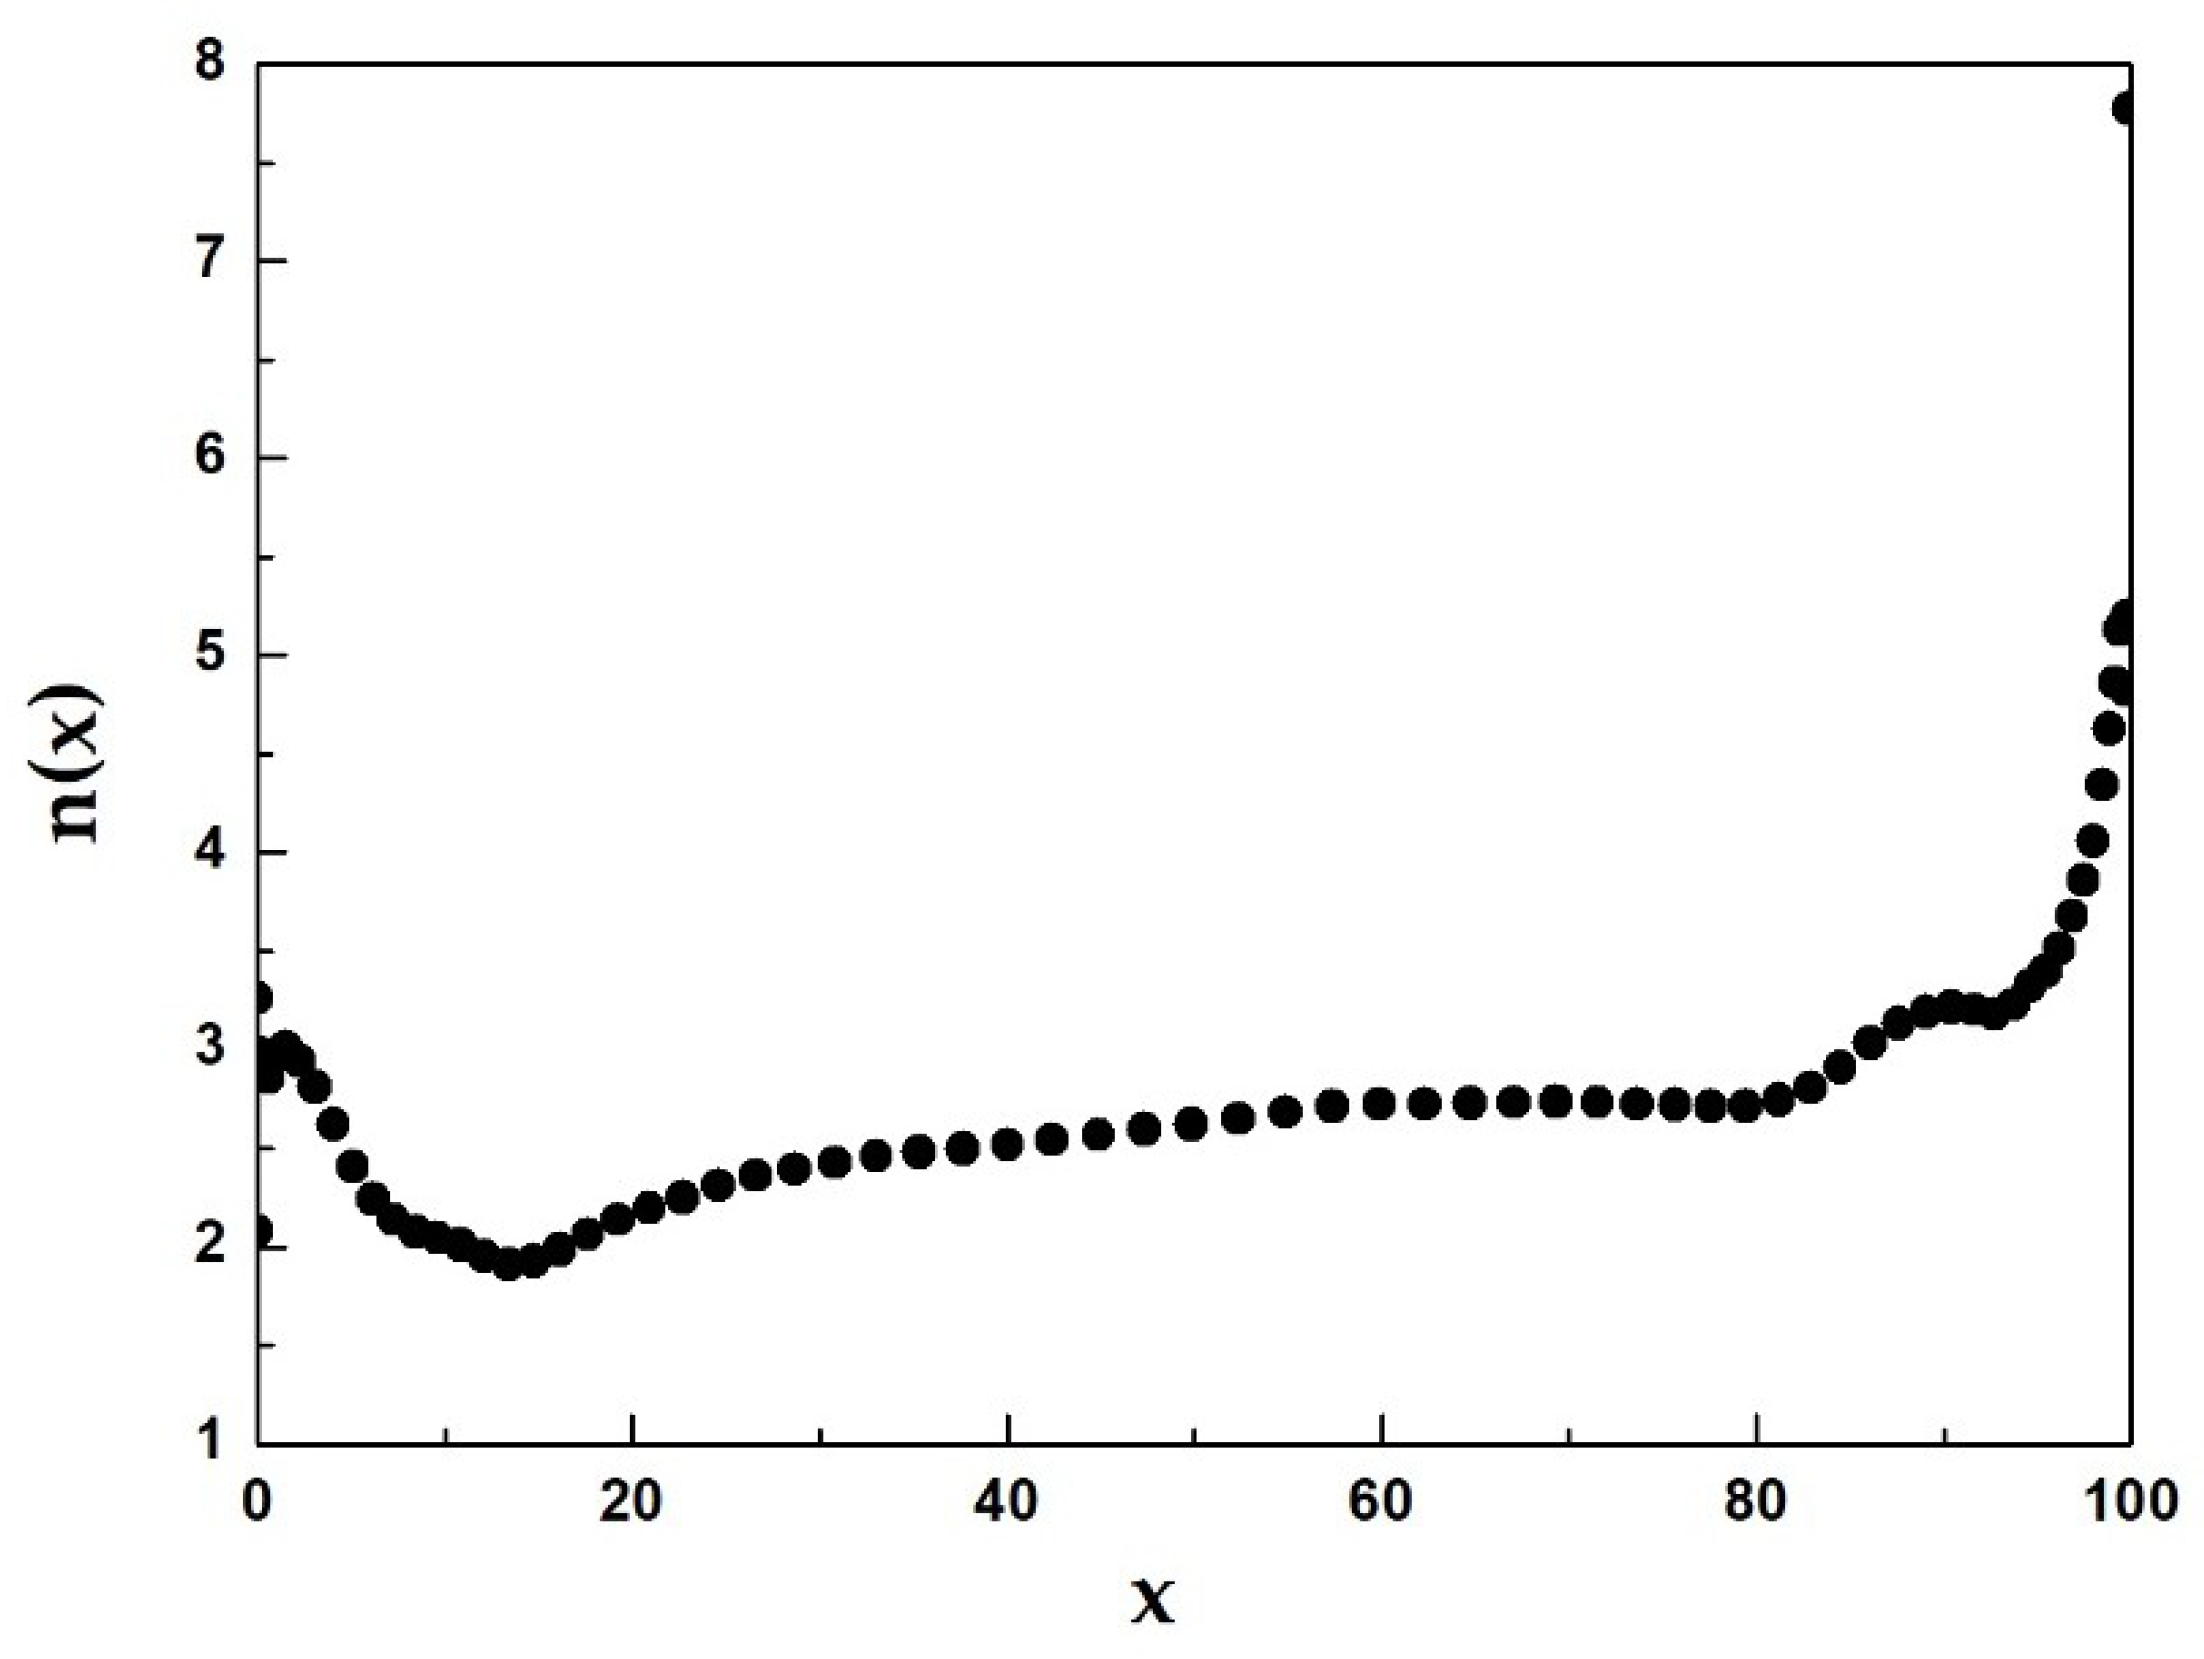
The value of n(x) gives information on the nucleation and growth behavior when the crystallized volume fraction is x. Figure 10 shows the change in the Avrami exponent with crystallized fraction at 698 K. The Avrami exponent in the initial stages of crystallization is close to 3. With an increasing crystallized volume fraction, the n steadily decreases and reaches 2, implying that the growth of the crystal nucleus is controlled by the interface, and the nucleation rate decreases with increasing the crystallized volume fraction. In the middle stage, covering a wide range of 20% < x < 80%, the Avrami exponent tends to be 2.5, implying three-dimensional growth with a constant nucleation rate; the observed increase in n at the last stage of crystallization may be due to errors derived from isothermal DSC.
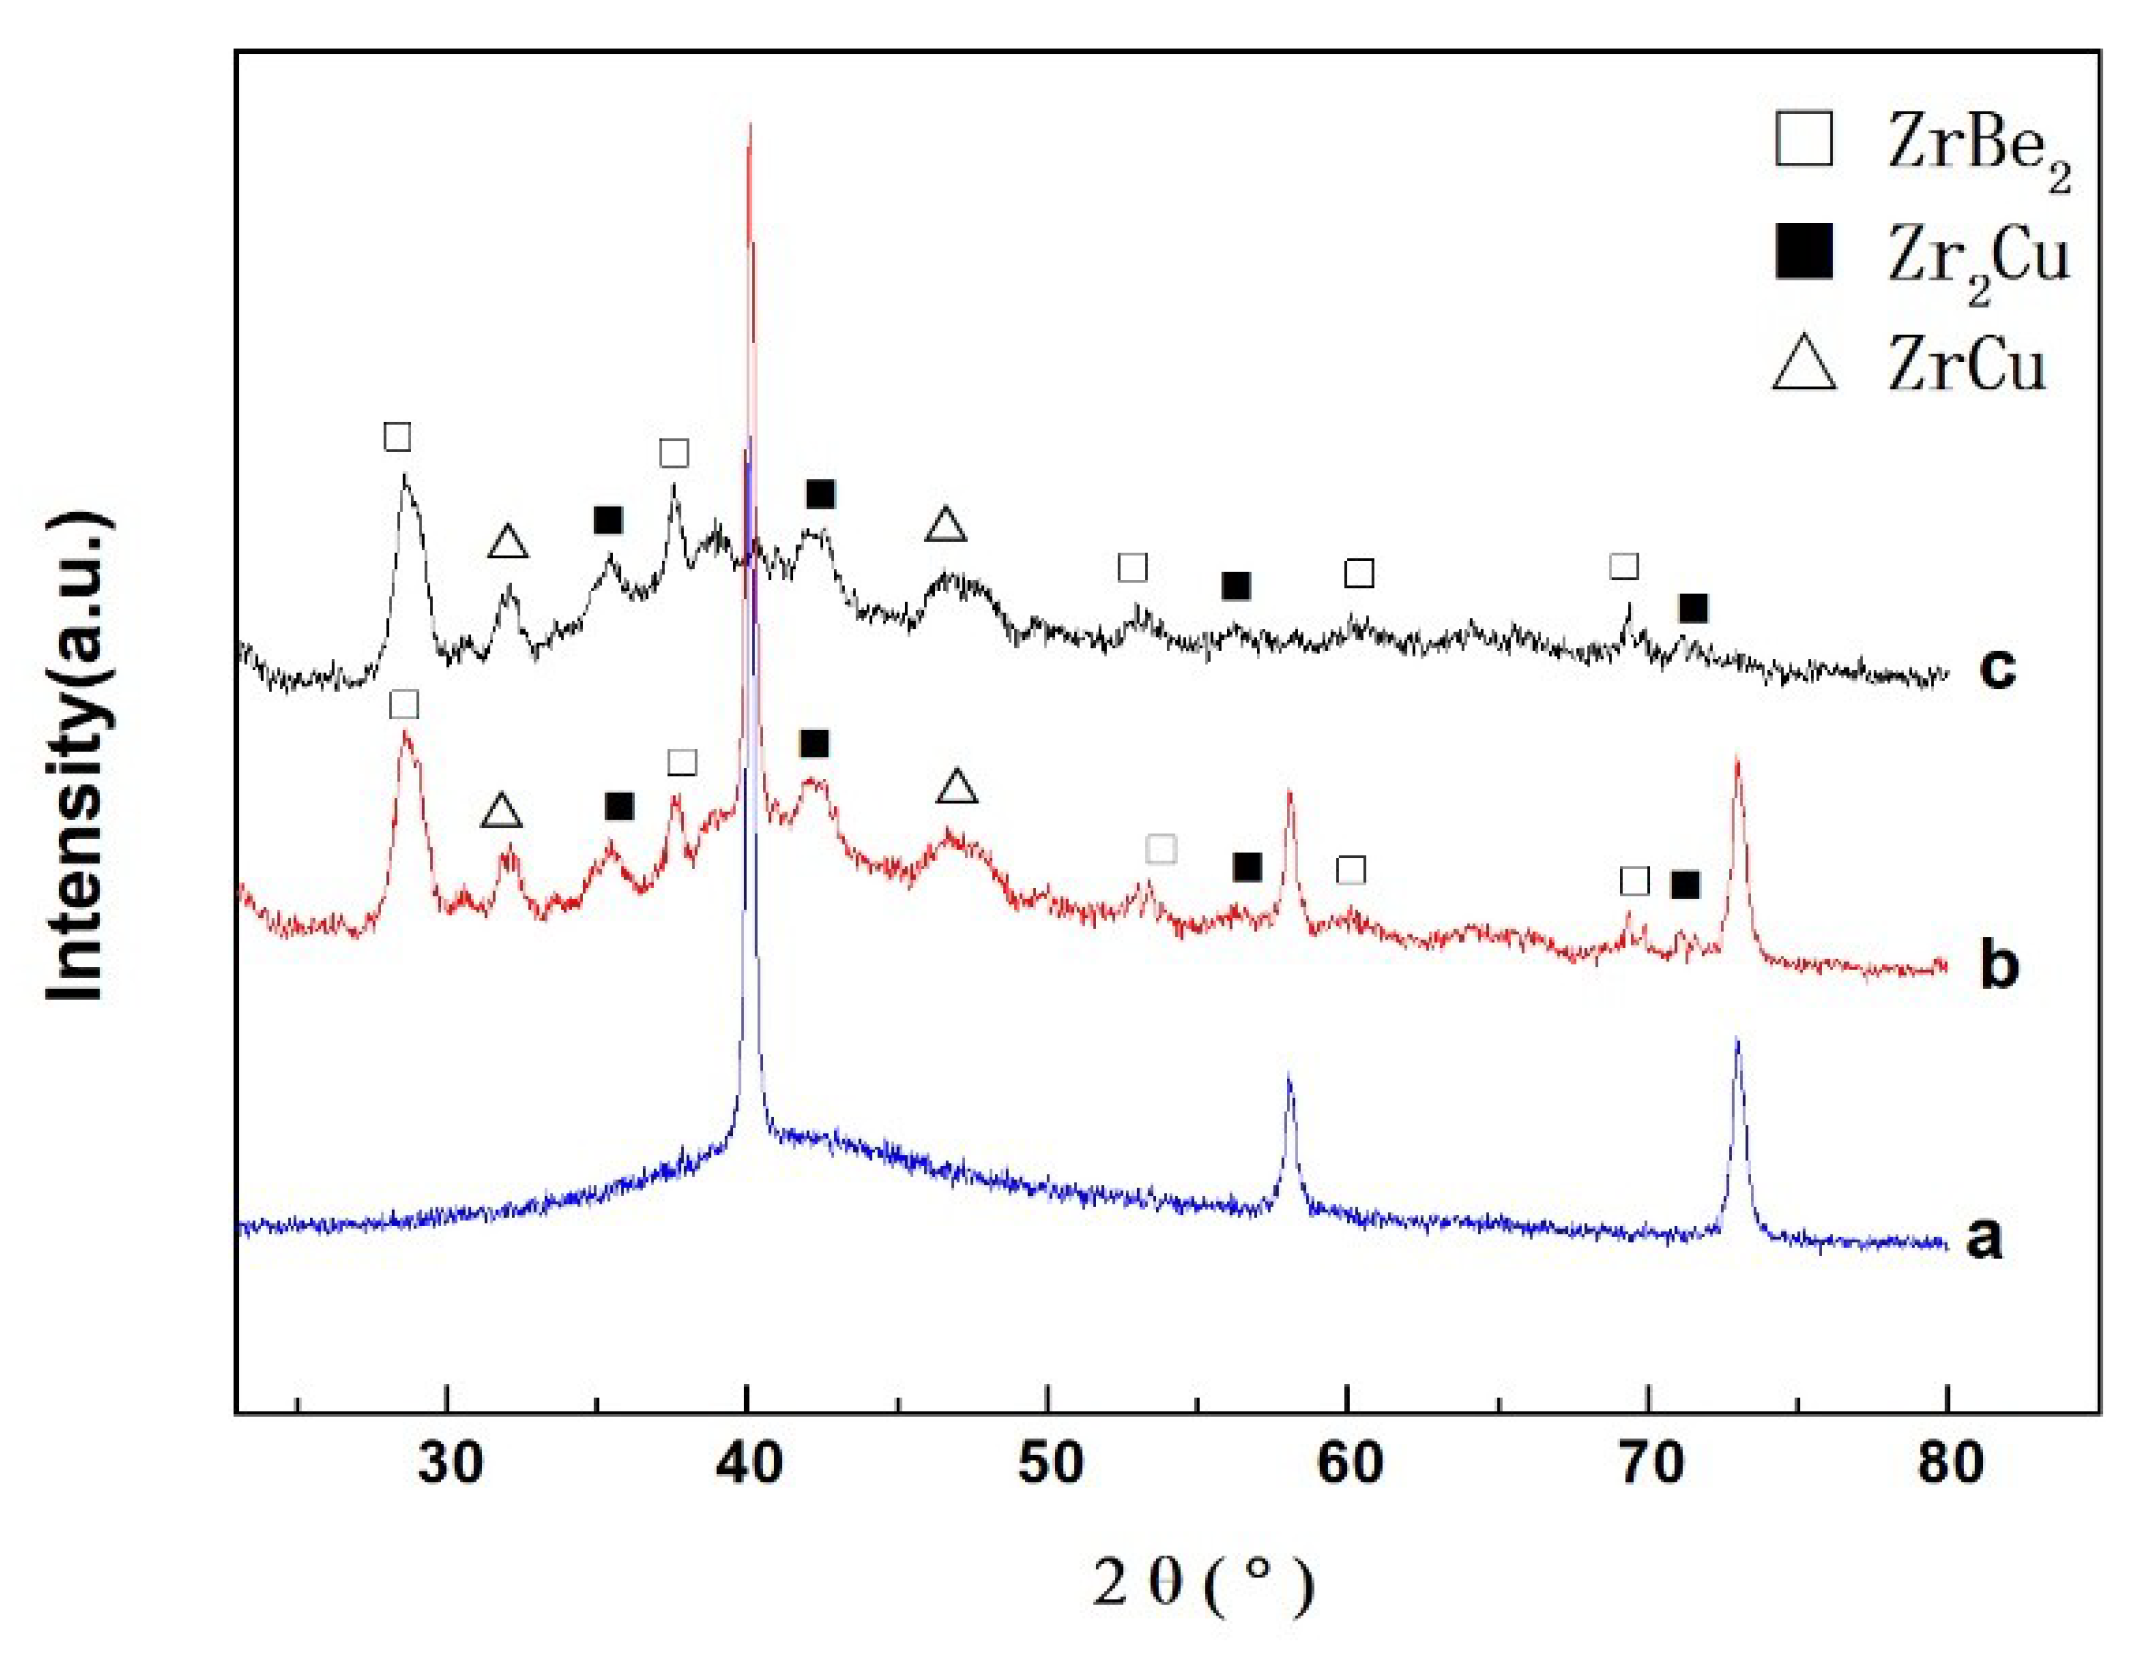
Figure 11 shows the X-ray diffraction patterns of the two materials after annealing at 703 K. The amorphous scattering diffusion peak of the amorphous matrix and the characteristic diffraction peaks of the W particles in curve a imply a fully amorphous structure of the matrix. After the incubation period in annealing at 703 K, the crystals precipitate out from the matrix, as shown in the X-ray diffraction pattern of the W particles/Zr41.2Ti13.8Cu12.5Ni10Be22.5 metallic glass matrix composite annealed at 703 K (curve b). Except the sharp peaks of the additional W particles, the locations of the other peaks are basically consistent with the peaks of the metallic glass Zr41.2Ti13.8Cu12.5Ni10Be22.5 (curve c). This implies that the crystalline phases are roughly the same for the metallic glass and the composite after annealing at 703 K for 60 min, and that the diffraction peak calibration mainly indicates the presence of ZrBe2, Zr2Cu, and ZrCu.

4. Conclusions

(1) The crystallization and glass transition of the W particles/Zr41.2Ti13.8Cu12.5Ni10Be22.5 metallic glass matrix composite both have a kinetic effect, and the characteristic temperatures Tg and Tx of the composite are linearly related to lnφ, as the 50% W particles in the composite increase the dependence of the glass transition on the heating rate.
(2) With the addition of W particles, the viscosity of the amorphous matrix in the supercooled liquid region increases, which hinders the spread and migration of the alloy elements and improves the thermal stability of the supercooled liquid.
(3) In the isothermal crystallization, the mode of the nucleation and growth process of crystal changes as the temperature changes from 698 K to 713 K. The Avrami exponent at 698 K was about 2.5 with the crystallized fraction in the middle stage (20% < x < 80%), implying three-dimensional growth with a constant nucleation rate, and the crystalline phases mainly indicated the presence of ZrBe2, Zr2Cu, and ZrCu.

Author Contributions

Conceptualization, X.S., H.H.; Data curation, X.S.; Formal analysis, X.S., H.H., X.K.; Investigation, X.S., Z.L.; Project administration, H.H.; Writing—original draft, X.S.; Writing—review and editing, H.H., X.K.

Funding

This work was supported by the National Natural Science Foundation of China under Grant Nos.51575522 and the Basic Research Foundation of the Department of Basic Course in the Naval University of Engineering under Grant Nos.HGDJCB17ZK008.

Conflicts of Interest

The authors declare no conflict of interest.

References

  1. Inoue, A.; Zhang, T.; Masumoto, T. Zr-Al-Ni amorphous alloys with high glass transition temperature and significant supercooled liquid region. Mater. Trans. JIM 1990, 31, 177–183. [Google Scholar] [CrossRef]
  2. Subhash, G.; Dowding, R.J.; Kecskes, L.J. Characterization of uniaxial compressive response of bulk amorphous Zr-Ti-Cu-Ni-Be alloy. Mater. Sci. Eng. A 2002, 334, 33–40. [Google Scholar] [CrossRef]
  3. Yuan, F.; Prakash, V.; Lewandowski, J.J. Spall strength and Hugoniot elastic limit of a Zirconium-based bulk metallic glass under planar shock compression. J. Mater. Res. 2007, 22, 402–411. [Google Scholar] [CrossRef]
  4. Inoue, A.; Zhang, T.; Saida, J. High strength and good ductility of bulk quasicrystalline base alloys in Zr65Al7.5Ni10Cu17.5-xPdx system. Mater. Trans. JIM 1999, 40, 1137–1143. [Google Scholar] [CrossRef]
  5. Bruck, H.A.; Christman, T.; Rosakis, A.J.; Johnson, W.L. Quasi-static constitutive behavior of Zr41.25Ti13.75Ni10Cu12.5Be22.5 bulk amorphous alloys. Scr. Metal. Mater. 1994, 30, 429–434. [Google Scholar] [CrossRef]
  6. Raju, V.R.; Kuhn, U.; Wolff, U.; Schneider, F.; Eckert, J.; Reiche, R.; Gebert, A. Corrosion behavior of Zr-based bulk glass-forming alloys containing Nb or Ti. Mater. Lett. 2002, 57, 173–177. [Google Scholar] [CrossRef]
  7. Ma, M.Z.; Liu, R.P.; Xiao, Y.; Lou, D.C.; Liu, L.; Wang, Q.; Wang, W.K. Wear resistance of Zr-based bulk metallic glass applied in bearing rollers. Mater. Sci. Eng. A 2004, 386, 326–330. [Google Scholar] [CrossRef]
  8. Fan, C.; Li, C.; Inoue, A. Deformation behavior of Zr-based bulk nanocrystalline amorphous alloys. Phys. Rev. B 2000, 61, 3761. [Google Scholar] [CrossRef]
  9. Fan, C.; Inoue, A. Ductility of bulk nanocrystalline composites and metallic glasses at room temperature. Appl. Phys. Lett. 2000, 77, 46. [Google Scholar] [CrossRef]
  10. Lu, K. Phase transformation from an amorphous alloy into nanocrystalline materials. Acta Met. Sin. 1994, 30, 1–21. [Google Scholar]
  11. Wang, Q.; Wang, D.K. High temperature homogeneous plastic flow behavior of a Zr based bulk metallic glass matrix composite. J. Alloys Compd. 2010, 495, 50–54. [Google Scholar] [CrossRef]
  12. Zhu, Z.; Zhang, H.; Hu, Z.; Zhang, W.; Inoue, A. Ta-particulate reinforced Zr-based bulk metallic glass matrix composite with tensile plasticity. Scr. Mater. 2010, 62, 278–281. [Google Scholar] [CrossRef]
  13. Choi-Yim, H.; Conner, R.D.; Szuecs, F.; Johnson, W.L. Processing, microstructure and properties of ductile metal particulate reinforced Zr57Nb5Cu15.4Ni12.6 bulk metal lie glass composites. Acta Mater. 2002, 50, 2737–2745. [Google Scholar] [CrossRef]
  14. Dandliker, R.B.; Conner, R.D.; Johnson, W.L. Melt infiltration casting of bulk metallic-glass matrix composites. J. Mater. Res. 1998, 13, 2896–2901. [Google Scholar] [CrossRef] [Green Version]
  15. Xie, G.Q.; Dmirei, V.L.L.; Kimura, H.; Inoue, A. Fabrication of ZrCuAlNi metallic glassy matrix composite containing ZrO2 particles by spark plasma sintering process. Mater. Trans. 2007, 48, 158–162. [Google Scholar] [CrossRef]
  16. Ma, L.L.; Wang, L.; Xue, Y.F.; Wang, Y. An in situ high-energy X-ray diffraction study of micromechanical behavior of Zr-based metallic glass reinforced porous W matrix composite. Mater. Sci. Eng. A 2011, 530, 344–348. [Google Scholar] [CrossRef]
  17. Choi-Yim, H.; Conner, R.D.; Szuecs, F.; Johnson, W.L. Quasistatic and dynamic deformation of tungsten reinforced Zr57Nb5Al10Cu15.4Ni12.6 bulk metallic glass matrix composites. Scr. Mater. 2001, 45, 1039–1054. [Google Scholar] [CrossRef]
  18. Conner, R.D.; Dandliker, R.B.; Johnson, W.L. Mechanical properties of tungsten and steel fiber reinforced Zr41.25Ti13.75Cu12.5Ni10Be22.5 metallic glass matrix composites. Acta. Mater. 1998, 46, 6089–6102. [Google Scholar] [CrossRef]
  19. Zhang, X.Q.; Xue, Y.F.; Zhang, H.F. Thermal residual stresses in W fibers/Zr-based metallic glass composites by high-energy synchrotron X-ray diffraction. J. Mater. Sci. Technol. 2015, 31, 159–163. [Google Scholar] [CrossRef]
  20. Rong, G.; Huang, D.W.; Yang, M.C. Penetrating behaviors of Zr-based metallic glass composite rods reinforced by tungsten fibers. Theor. Appl. Fract. Mech. 2012, 58, 21–27. [Google Scholar] [CrossRef]
  21. Xue, Y.F.; Cai, H.N.; Wang, L.; Wang, F.C.; Zhang, H.F. Dynamic compressive deformation and failure behavior of Zr-based metallic glass reinforced porous tungsten composite. Mater. Sci. Eng. A 2007, 275, 445–446. [Google Scholar] [CrossRef]
  22. Choi-Yim, H.; Schroers, J.; Johnson, W.L. Microstructures and mechanical properties of tungsten wire/particle reinforced ZrNbAlCuNi metallic glass matrix composites. Appl. Phys. Lett. 2002, 80, 1906. [Google Scholar] [CrossRef]
  23. Qiu, K.Q.; Ren, Y.L. Tungsten particulate reinforced Zr based bulk metallic glass composites. Rare Met. Mater. Eng. 2006, 35, 66–69. [Google Scholar]
  24. Li, H.; Subhash, G.; Kecskes, L.J.; Dowding, R.J. Mechanical behavior of tungsten perform reinforced bulk metallic glass composites. Mater. Sci. Eng. A 2005, 403, 134–143. [Google Scholar] [CrossRef]
  25. Peker, A.; Johnson, W.L. A highly process able metallic glass: Zr41.2Ti13.8Cu12.5Ni10.0Be22.5. Appl. Phys. Lett. 1993, 63, 2342–2344. [Google Scholar] [CrossRef]
  26. Choi-Yim, H.; Busch, R.; Köster, U.; Johnson, W.L. Synthesis and characterization of particulate reinforced Zr57Nb5Al10Cu15.4Ni12.6 bulk metallic glass composites. Acta. Mater. 1999, 47, 2455–2462. [Google Scholar] [CrossRef]
  27. Zhang, W.; Inoue, A. High glass-forming ability and good mechanical properties of new bulk glassy alloys in Cu–Zr–Ag ternary system. J. Mater. Res. 2006, 21, 234–241. [Google Scholar] [CrossRef]
  28. Lu, Z.P.; Liu, C.T. Glass formation criterion for various glass-forming systems. Phys. Rev. Lett. 2003, 91, 115505. [Google Scholar] [CrossRef] [PubMed]
  29. Lasocka, M. The effect of scanning rate on glass transition temperature of splat-cooled Te85Ge15. Mater. Sci. Eng. 1976, 23, 173–177. [Google Scholar] [CrossRef]
  30. Chen, H.S. A method for evaluating viscosities of metallic glasses from the rates of thermal transformations. J. Non-Cryst. Solids 1978, 27, 257–263. [Google Scholar] [CrossRef]
  31. Glasstone, S.; Laidler, K.J.; Eyring, H. The Theory of Rate Process; McGraw-Hill Book Company: New York, NY, USA, 1994. [Google Scholar]
  32. Wang, Y.C.; Wang, Y.R.; Wei, B.C.; Li, W.; Sun, Y. Kinetics of glass transition and crystallization of carbon nanotube reinforced Mg-Cu-Gd bulk metallic glass. J. Chin. Rare Earth Soc. 2006, 24, 327–331. [Google Scholar] [CrossRef]
  33. Mansour, S.A.; Al-Kotb, M.S.; Kotkata, M.F. Model-free transformation kinetics for ZnS quantum dots synthesized via colloidal reaction. Phys. B Condens. Matter 2014, 433, 127–132. [Google Scholar] [CrossRef]
  34. Krause, B.; Gregorys, A.; Michel, A. Direct observation of the thickness-induced crystallization and stress build-up during sputter-deposition of nanoscale silicide films. ACS Appl. Mater. Interfaces 2016, 8, 34888. [Google Scholar] [CrossRef] [PubMed]
  35. Calka, A.; Radliński, A.P. Decoupled bulk and surface crystallization in Pd85Si15 glassy metallic alloys: Description of isothermal crystallization by a local value of the Avrami exponent. J. Mater. Res. 1988, 3, 59–66. [Google Scholar] [CrossRef]
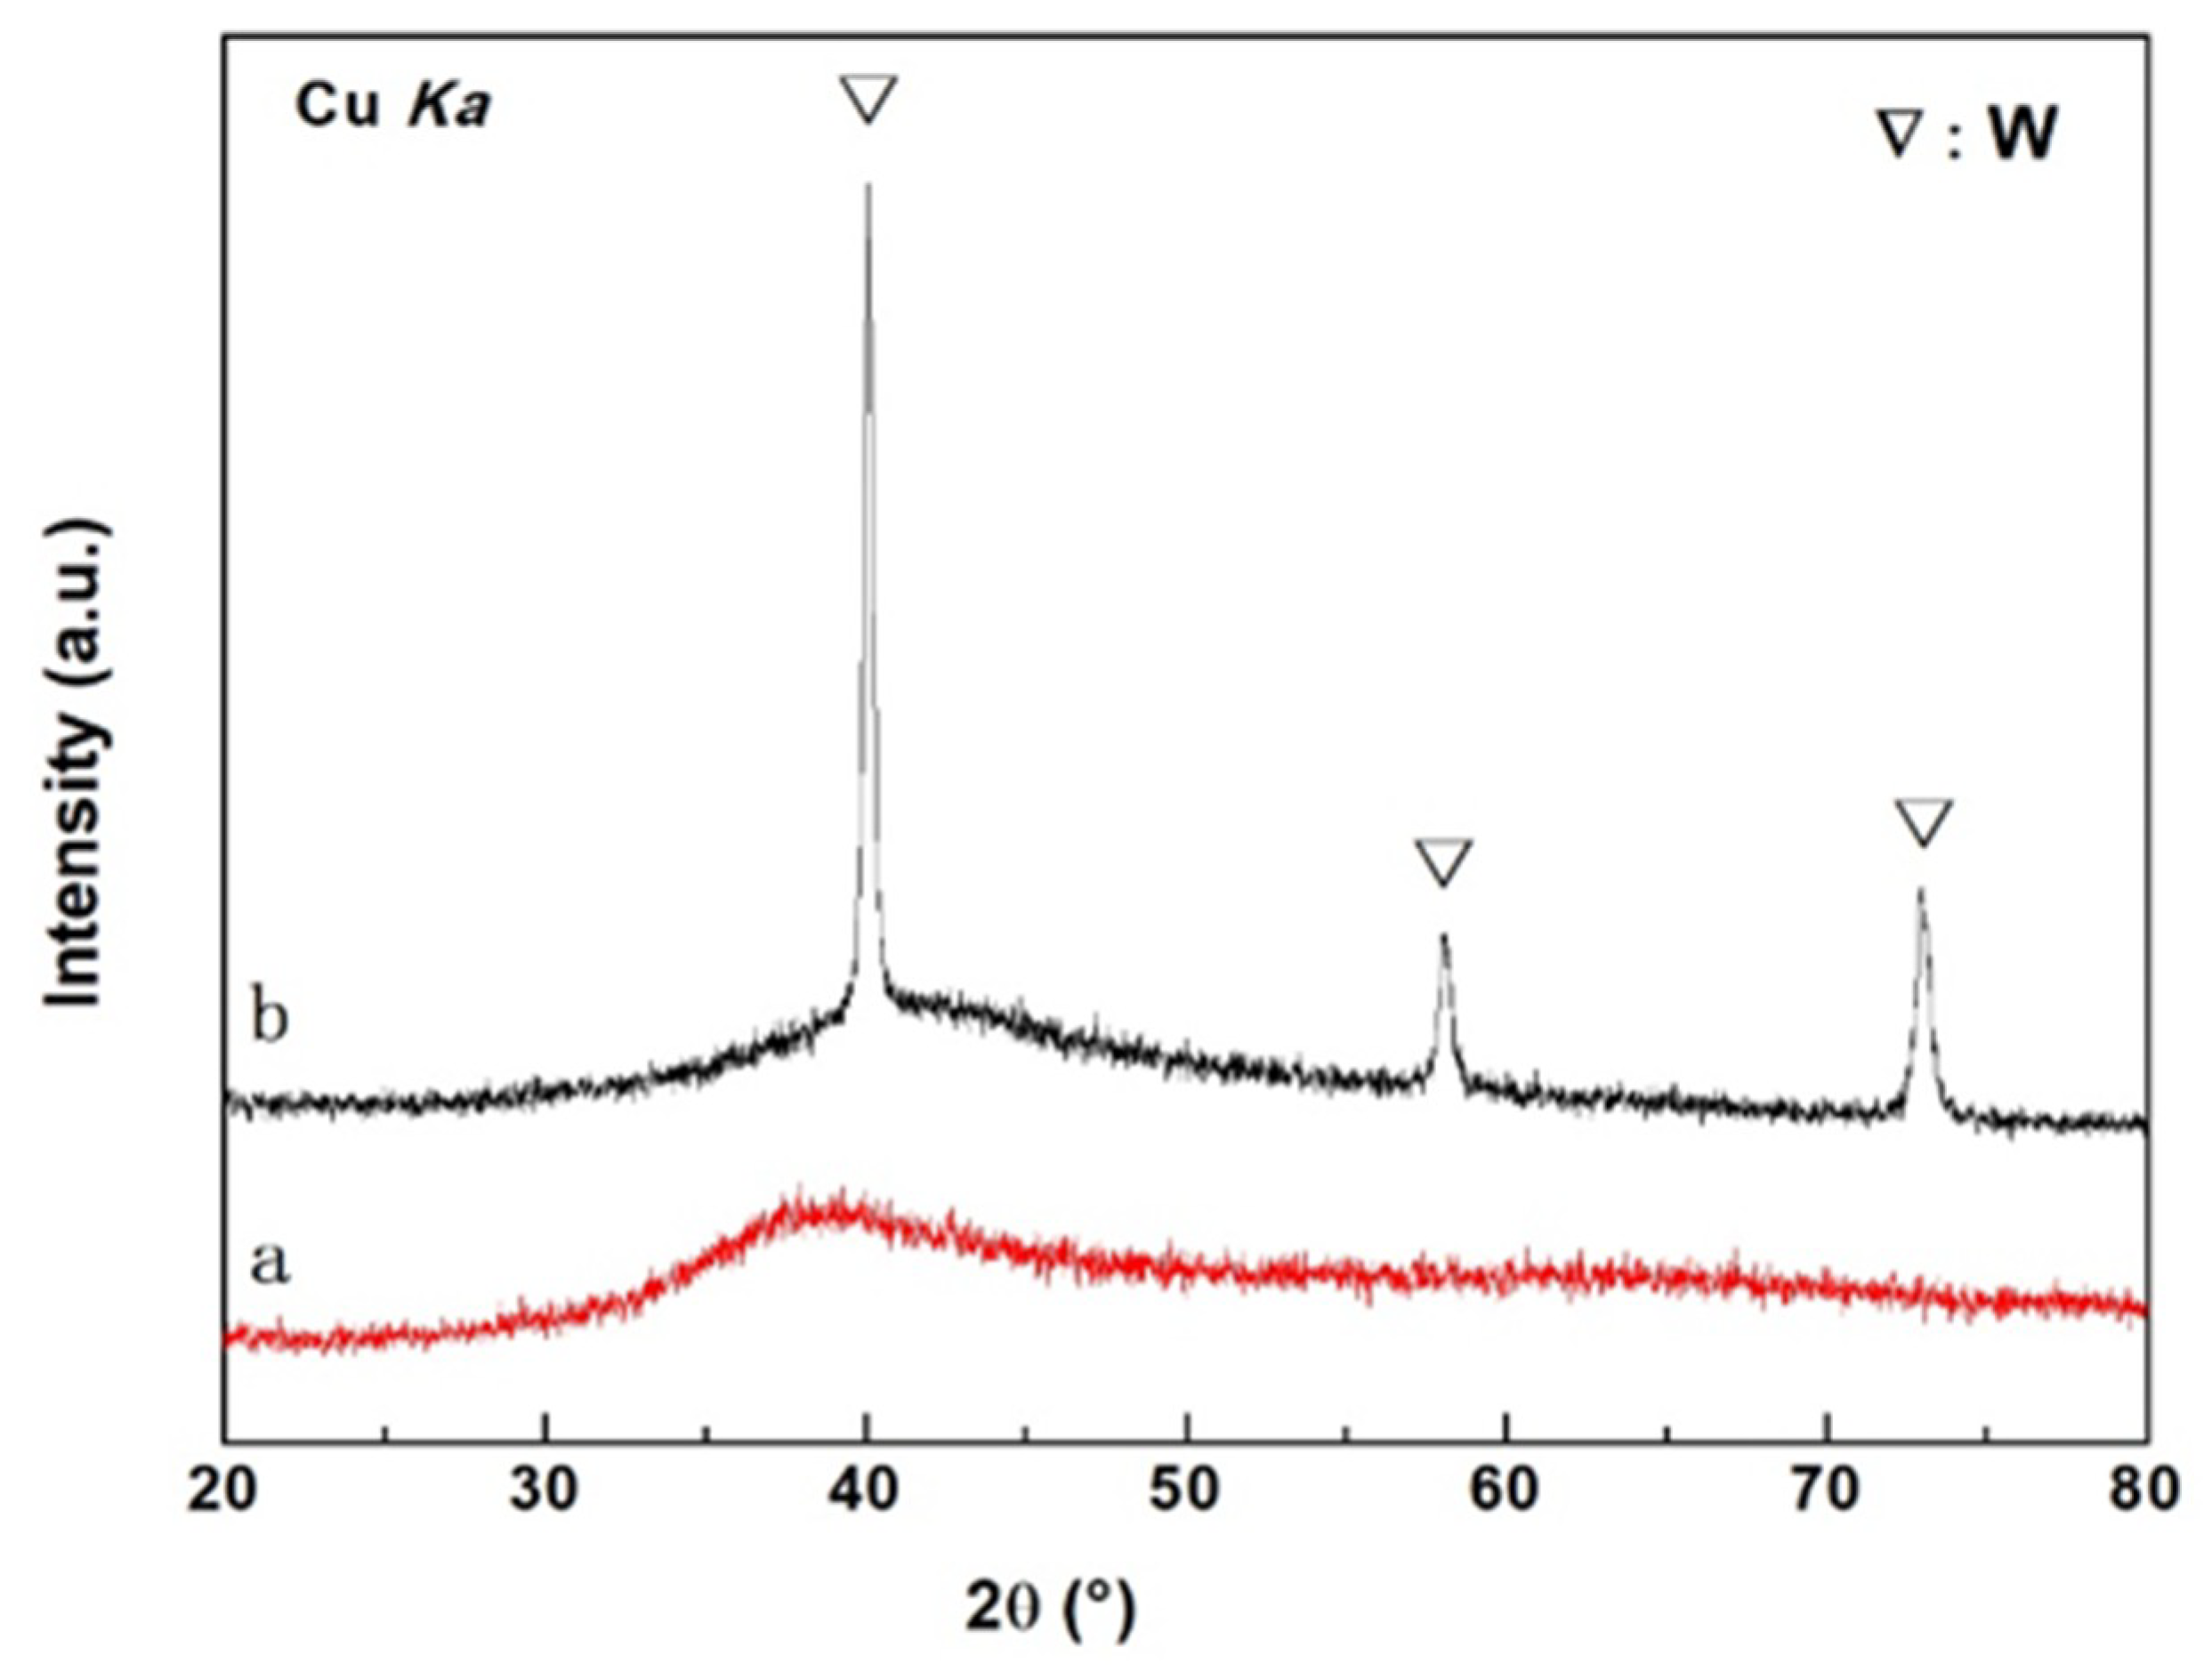
Figure 1. The X-ray diffraction patterns of two materials (curve a corresponds to the metallic glass Zr41.2Ti13.8Cu12.5Ni10Be22.5, curve b corresponds to the W particles/Zr41.2Ti13.8Cu12.5Ni10Be22.5 metallic glass matrix composite).
Metals 08 01011 g001
Figure 2. SEM micrograph (a,c) and energy dispersive spectroscopy (EDS) spectrum (b) of the W particles/Zr41.2Ti13.8Cu12.5Ni10Be22.5 metallic glass matrix composite.
Metals 08 01011 g002
Figure 3. Differential scanning calorimetry (DSC) curves of two materials at different heating rates: (a) the metallic glass Zr41.2Ti13.8Cu12.5Ni10Be22.5; (b) the W particles/Zr41.2Ti13.8Cu12.5Ni10Be22.5 metallic glass matrix composite.
Metals 08 01011 g003
Figure 4. Plots for Tg and Tx vs. lnφ of two materials: (a) the metallic glass Zr41.2Ti13.8Cu12.5Ni10Be22.5; (b) the W particles/Zr41.2Ti13.8Cu12.5Ni10Be22.5 metallic glass composite.
Metals 08 01011 g004
Figure 5. Kissinger plots for two materials at different heating rates: (a) the metallic glass Zr41.2Ti13.8Cu12.5Ni10Be22.5; (b) the W particles/Zr41.2Ti13.8Cu12.5Ni10Be22.5 metallic glass matrix composite.
Metals 08 01011 g005
Figure 6. Isothermal DSC curves at various temperatures for the W particles/Zr41.2Ti13.8Cu12.5Ni10Be22.5 metallic glass matrix composite.
Metals 08 01011 g006
Figure 7. Time–temperature–transformation curves of the onset crystallization for the W particles/Zr41.2Ti13.8Cu12.5Ni10Be22.5 metallic glass matrix composite.
Metals 08 01011 g007
Figure 8. Crystallization volume fraction as a function of holding time at different temperatures for the W particles/Zr41.2Ti13.8Cu12.5Ni10Be22.5 metallic glass matrix composite.
Metals 08 01011 g008
Figure 9. JMA (Johnson–Mehl–Avrami) plots of crystallization at different temperatures for the W particles/Zr41.2Ti13.8Cu12.5Ni10Be22.5 metallic glass matrix composite.
Metals 08 01011 g009
Figure 10. Variation of the local Avrami exponent with crystallized volume fraction for the W particles/Zr41.2Ti13.8Cu12.5Ni10Be22.5 metallic glass matrix composite.
Metals 08 01011 g010
Figure 11. The X-ray diffraction patterns of the materials (curve a corresponds to the metallic glass Zr41.2Ti13.8Cu12.5Ni10Be22.5 annealed at 703 K, curve b corresponds to the W particles/Zr41.2Ti13.8Cu12.5Ni10Be22.5 metallic glass matrix composite annealed at 703 K, curve c corresponds to the W particles/Zr41.2Ti13.8Cu12.5Ni10Be22.5 metallic glass matrix composite as-cast).
Metals 08 01011 g011
Table 1. Tg, Tx, ΔT, and Tp of the metallic glass Zr41.2Ti13.8Cu12.5Ni10Be22.5 and the W particles/Zr41.2Ti13.8Cu12.5Ni10Be22.5 metallic glass matrix composite.
MaterialHeating RatesTg (K)Tx (K)ΔT (K)Tp1 (K)Tp2 (K)
Metallic glass Zr41.2Ti13.8Cu12.5Ni10Be22.510 K/min618 ± 0.5682 ± 0.564695 ± 0.5726 ± 0.5
20 K/min622 ± 0.5696 ± 0.574714 ± 0.5736 ± 0.5
40 K/min629 ± 0.5715 ± 0.586729 ± 0.5748 ± 0.5
80 K/min640 ± 0.5731 ± 0.591744 ± 0.5766 ± 0.5
W particles/Zr41.2Ti13.8Cu12.5Ni10Be22.5 metallic glass matrix composite10 K/min613 ± 0.5695 ± 0.582712 ± 0.5738 ± 0.5
20 K/min625 ± 0.5716 ± 0.591726 ± 0.5750 ± 0.5
40 K/min633 ± 0.5727 ± 0.594740 ± 0.5761 ± 0.5
80 K/min644 ± 0.5740 ± 0.596760 ± 0.5779 ± 0.5
Table 2. Eg, Ex, and Ep of the metallic glass Zr41.2Ti13.8Cu12.5Ni10Be22.5 and the W particles/Zr41.2Ti13.8Cu12.5Ni10Be22.5 metallic glass matrix composite.
MaterialEg (kJ/mol)Ex (kJ/mol)Ep1 (kJ/mol)Ep2 (kJ/mol)
ValueErrorValueErrorValueErrorValueError
Metallic glass Zr41.2Ti13.8Cu12.5Ni10Be22.5288.85.28%161.80.60%170.51.15%225.52.71%
W particles/Zr41.2Ti13.8Cu12.5Ni10Be22.5 metallic glass matrix composite213.41.51%185.30.61%172.71.17%233.82.60%