1. Introduction
The priority purpose of surface treatment is to protect the surface against degradation by corrosion, fatigue and wear. Further priorities are the acquisition of new functional properties of surfaces and aesthetics of products. To meet such an objective, the surfaces need to be pre-treated. The pre-treatment method depends on requirements imposed on the product. In principle, it comes to obtain the required characteristics, such as creation of suitable topography of surface, obtaining the requested purity of surface, etc.
Abrasive blasting, more commonly known as sandblasting, is the operation of forcibly propelling a stream of abrasive material against a surface under high pressure to smooth a rough surface, roughen a smooth surface, shape a surface or remove surface contaminants. A pressurized fluid, typically compressed air, or a centrifugal wheel is used to propel the blasting material (often called the media). The first abrasive blasting process was patented by Benjamin Chew Tilghman on 18 October 1870 [
1]. Shot peening or blasting are techniques always in direct competition with mechanical treatments such as burnishing [
2], with very good results in mold finishing [
3]. Isotropic finishing is key in brakes, applications in which other cinematically defined methods origin roughness with defined patters. This is a source of problems in several fields of application. Authors [
4] worked on the elimination of the surface spiral pattern after turning operation, which is a challenge to avoid braking problems at the early life of the component.
Another significant positive feature of the abrasive blasting technology, in a relation to a subsequent coating application, is the increase in the actual size of surface area. This creates favourable conditions for the increased adhesion of coatings. In evaluating the actual size of the blasted surface, it is necessary to consider its microscopic and submicroscopic unevenness. By microscopic unevenness, we mean a set of the blasting abrasive notches on the surface of base material, having the character of intersecting fracture surfaces. Submicroscopic unevenness are the result of the different deformation ability of the individual particles of the blasting abrasive which may be caused by a different grain orientation. Furthermore, the blasted surface can also be characterized by a surface volume. The surface volume can be defined as the volume between the imaginary plane passing through the highest peaks and the actual surface area of the base material, per unit of nominal area. It is important to investigate the size of surface volume arisen after the impact of the blasting abrasive of particular material and shape [
5].
The original condition of surface before pre-treatment is determined primarily by its origin of production, storage conditions, or, in case of renovation, its previous quarrying. All the factors mentioned, but also many more, affect the condition of surface, mainly its purity and roughness.
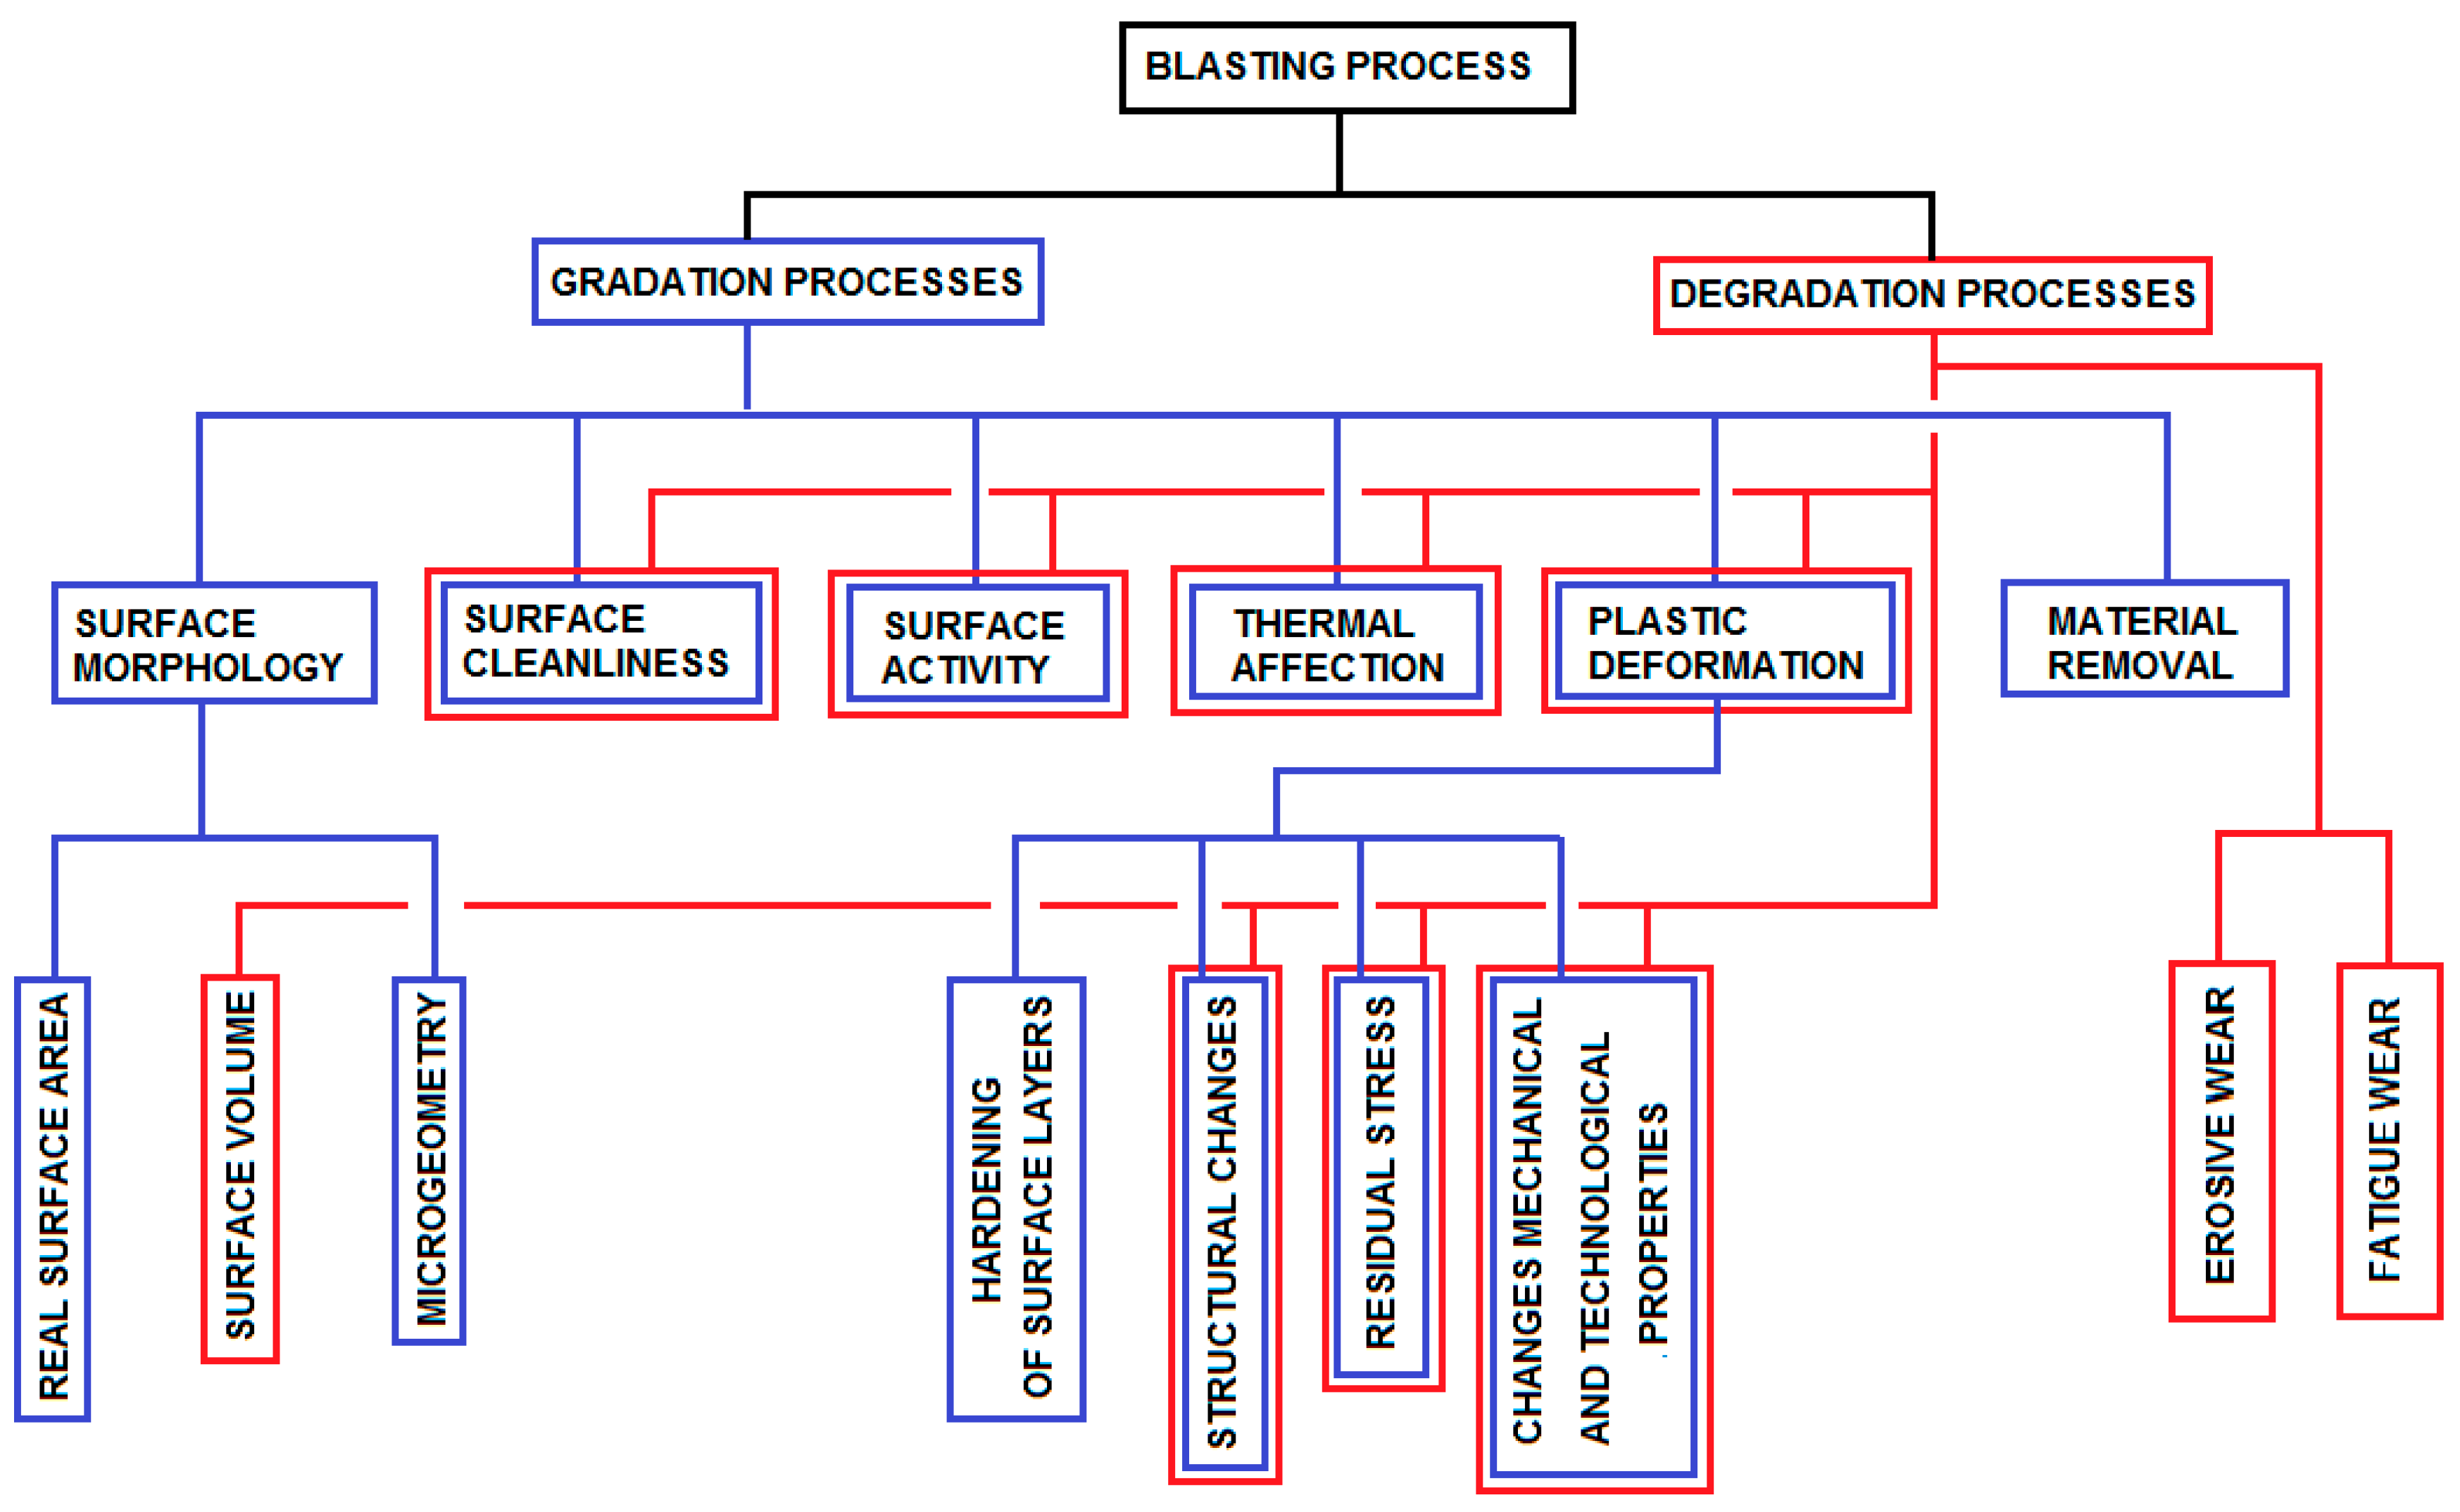
The schematic classification of blasting effects on the substrate is shown in
Figure 1.
The result of application of blasting technology is affected by:
- -
The choice of appropriate blasting abrasives—high level of durability, accurate shape and size of particles and minimal unwanted side effect of particles,
- -
the use of appropriate blasting devices—the effort is to produce blasting devices which would work automatically with a programmed process of blasting,
- -
optimization of technological parameters of blasting—determination of optimal technological parameters which lies in a correct selection of transition of grit blasting abrasives through the nozzle and the correct level of surface coverage by blasting abrasives. Furthermore, in choosing the right kind, shape and size of blasting abrasives, its speed and the angle of hitting the blasted surface,
- -
secondary impact of surface blasting—roughening the surface, hardening the surface, changing mechanical properties of the surface and underground layers,
- -
increase the economy of blasting which is closely related to the optimization of technological parameters of blasting (blasting time), service life of grit blasting equipment and abrasives used in its exposed parts.
The blasted surface quality is important for achieving corrosion resistance of coating [
6,
7,
8]. D. Whitehouse in [
9,
10] brings new look on some issues relating to surfaces interacting with another in many tribological situations. S. Bagherifard [
11] assessed surface roughness of low alloy steel shot peened using three shot diameters and velocities. Authors also viewed models of peened surfaces with 100% coverage.
Large particles concentrate considerable energy in the place of impact which triggers the deformation of impurities (oxides, hydroxides, dust etc.) and base material layers resulting in its hardening. Spherical particle which hits base material creates marks the edges of which rise above the metal surface. Due to tension caused by pressure and moving in the place of impact, the impurities gets disintegrated and largely peeled off the metal. Sharp shape particles penetrate the surface layer and get stuck in the base material causing impurities are embedded in the surface layer, too. They also give rise to pressure strain. If the strain is enough to overcome the adhesion, the layers of dirt get peeled off and lifted. Further impact of particle will cause the bursting of disturbed dirt from the base metal. Compared with large particles, the effect of small particles, i.e., particles with less kinetic energy, is of a different nature. Small particles do not cause such a great microplastic deformation of the base metal as the large ones do. However, they give rise to a more steady distribution of the pressure strain. Since the number of particles per weigh unit of grit blasting medium with smaller particles is larger than in large particles, the density of impact will be significantly greater and will trigger considerable pressure strain right in the dirt layer, causing the release of impurities from the metal surface.
To achieve optimum blasting process, correct size and shape of the particles of the grit blasting abrasives (density impact) is important on one hand, and suitable kinetic energy of the particles on the other hand. Selecting appropriate type of grit blasting abrasive is also of importance. It is mainly the mutual ratio of particles hardness of the grit blasting abrasives against the base material. Increase in size and hardness of grit blasting particles increases removal ability blasting abrasives as well as the roughness of blasted metal surface. The particles hit the surface at a certain angle which makes them slip down the surface thus triggering abrasive effect on the surface. The number of marks after the particles impact on the cleaned surface increases with the amount of grit blasting abrasive required for complete removal of small residual waste impurities. Due to the fact that the surface must be blasted for a really long time, until the residues are completely eliminated, which sometimes causes blasting through the surface of the base material resulting in its hardening (side-effect of blasting). D. Kirk [
12] deals with the term of surface coverage and solving the problem, how to reach 100% surface coverage in shot peening process, how to predict and control surface coverage in multipass shot peening. D. Wiklund [
13] deals with influence of different steel surface treatment of friction conditions during stamping. D. Zhu [
14] proposed a method how to characterize relation between micro topography of metal surface and fatigue of the metal. C. Nouguier-Lehon in [
15] investigated impact depth of zirconium oxide balls in ultrasonic shot peening of copper tube. Author found good agreement between finite element simulations and experimental results of impact depth and distribution of impacts measured using confocal microscope.
Blasting abrasives are loose materials of granular nature consisting of different large particles (polydispersion). There are mainly two types of blasting media used-metallic and non-metallic ones. Metal blasting abrasives can be in in three different forms:
- -
Blasting abrasive of spherical shape, known as shot,
- -
blasting abrasive of irregular sharp shape—grit,
- -
blasting abrasive of a roller shape, its height is equal to its diameter—chopped wire.
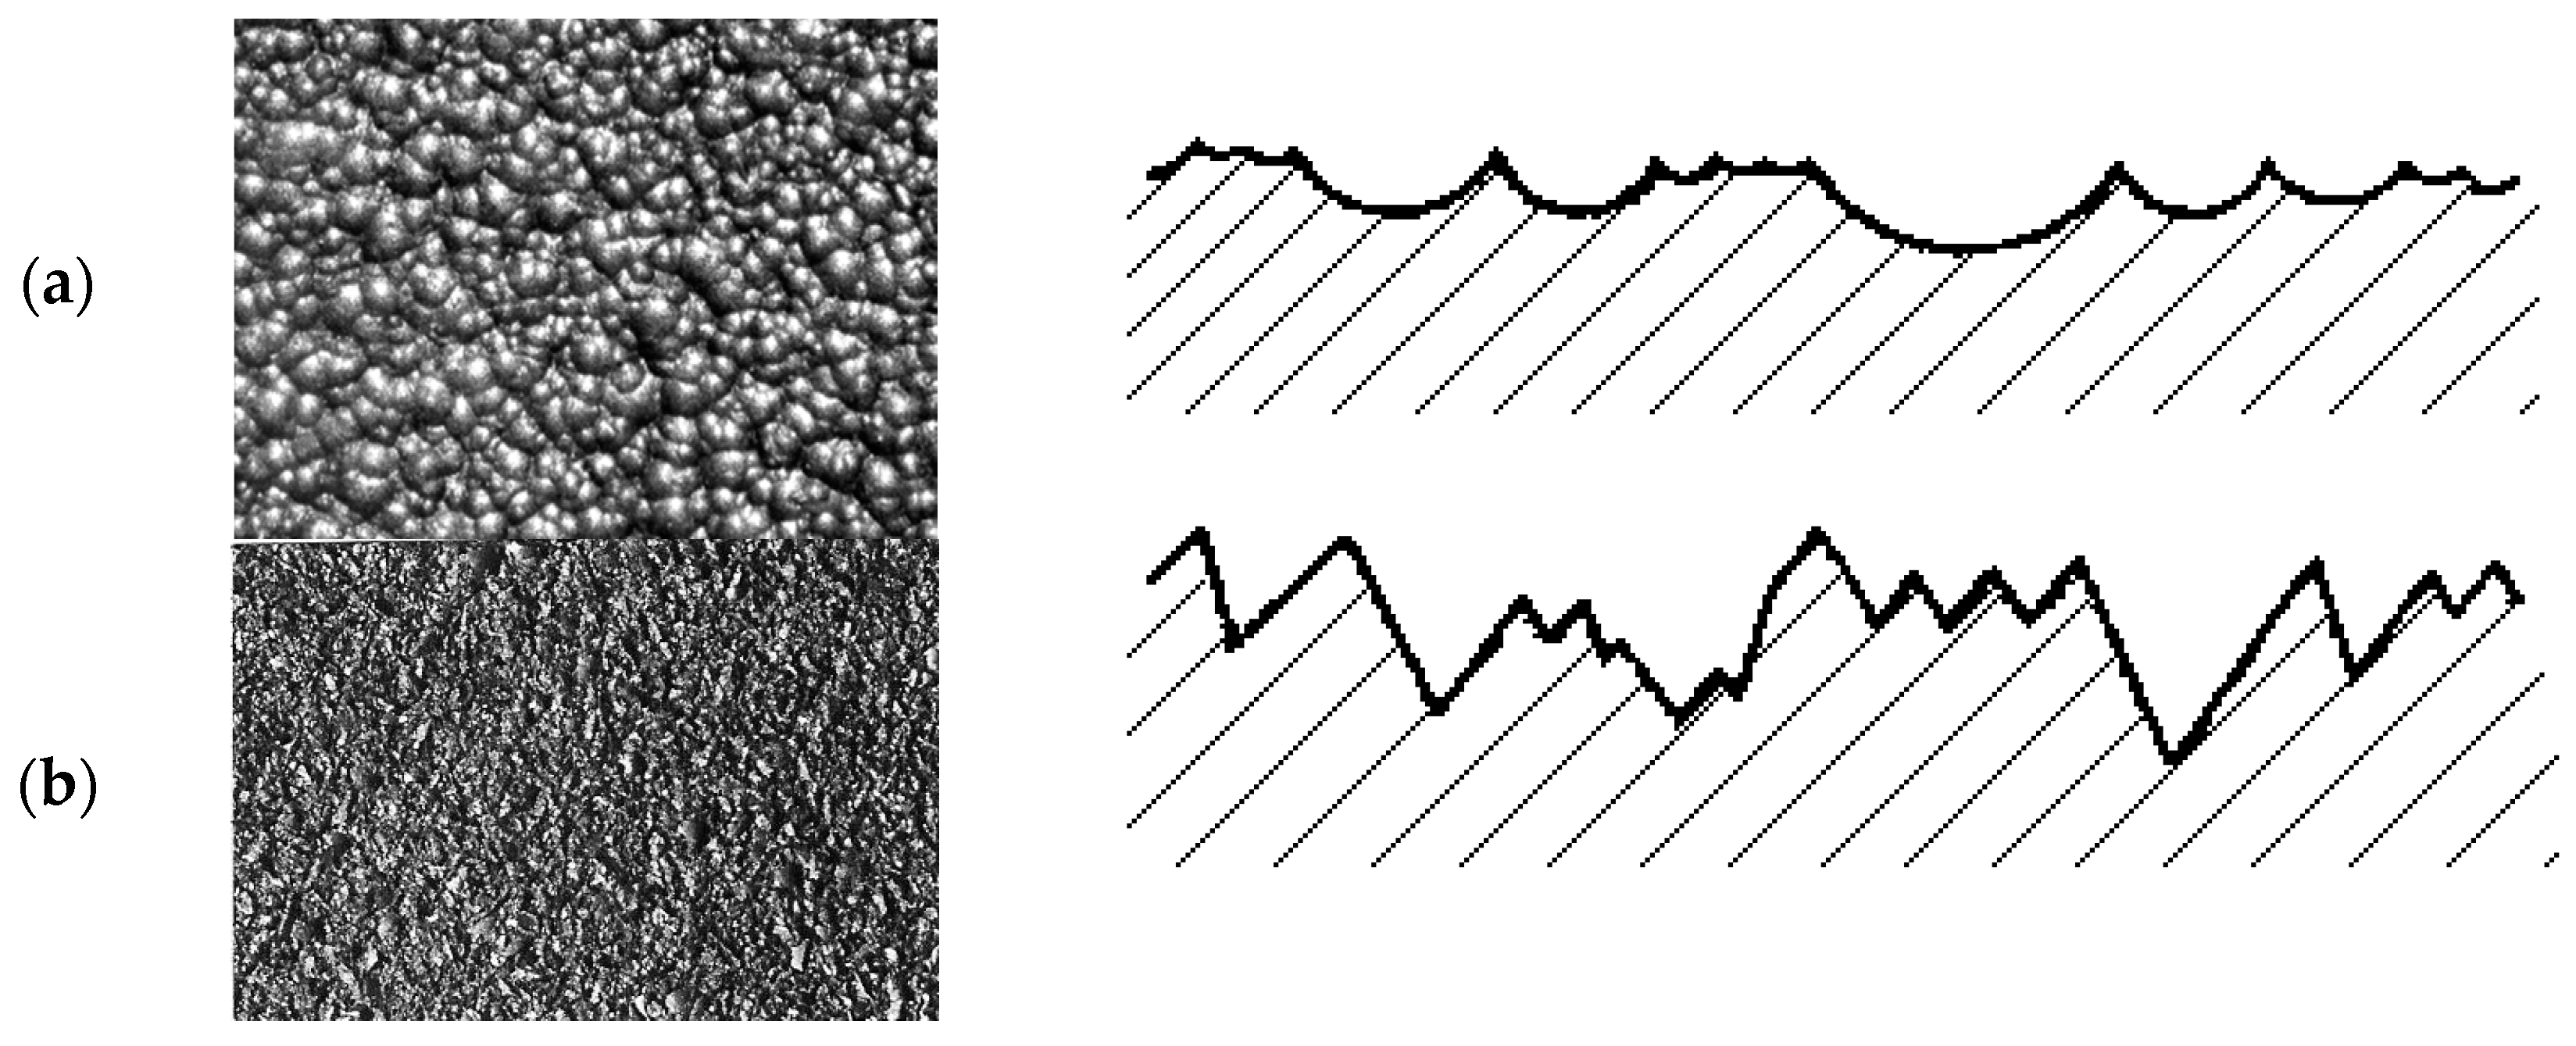
The most widespread abrasives are metal ones, on the basis of iron. They can be heat treated or galvanized. Out of metal blasting abrasives, the most used are cast iron grit, steel shot and chopped wire. The shape of particle of blasting abrasives used determines the resulting surface relief [
5,
16,
17,
18,
19]. Surface has rounded small peaks after the blasting with grit or sharp notches after grit (
Figure 2).
In addition to the above ferrous blasting abrasives, blasting abrasives of non-ferrous nature are used for many reasons, too. Their use is specific to a certain kind of pre-treated material and work. Out of non-metallic blasting abrasives, the most spread are blasting abrasives of mineral origin, both natural and artificial, in particular, corundum (Al2O3—man-made or natural hard crystallized alumina), natural garnet, glass beads as well as secondary raw materials, e.g., different slag from metallurgical processes. All of the above types of non-metallic blasting abrasives have a lower specific weight in comparison with metal blasting abrasives, cause less deformation of the base material as well as lower surface roughness. They also feature low durability and therefore are mainly used for single blasting.
When assessing technical surface, its specific properties as well as the properties of coating—base material interface need to be considered. They are, in several cases, different from the properties of the base material including mechanical, physical, chemical and physical-chemical properties which are researched and assessed by a variety of special methods.
The evaluation of blasting surface properties can be done in terms of:
- -
Surface topography,
- -
degree of purity and degree of coverage,
- -
microhardness,
- -
changes of mechanical and technological properties,
- -
residual tension and structural changes,
- -
physical—chemical properties.
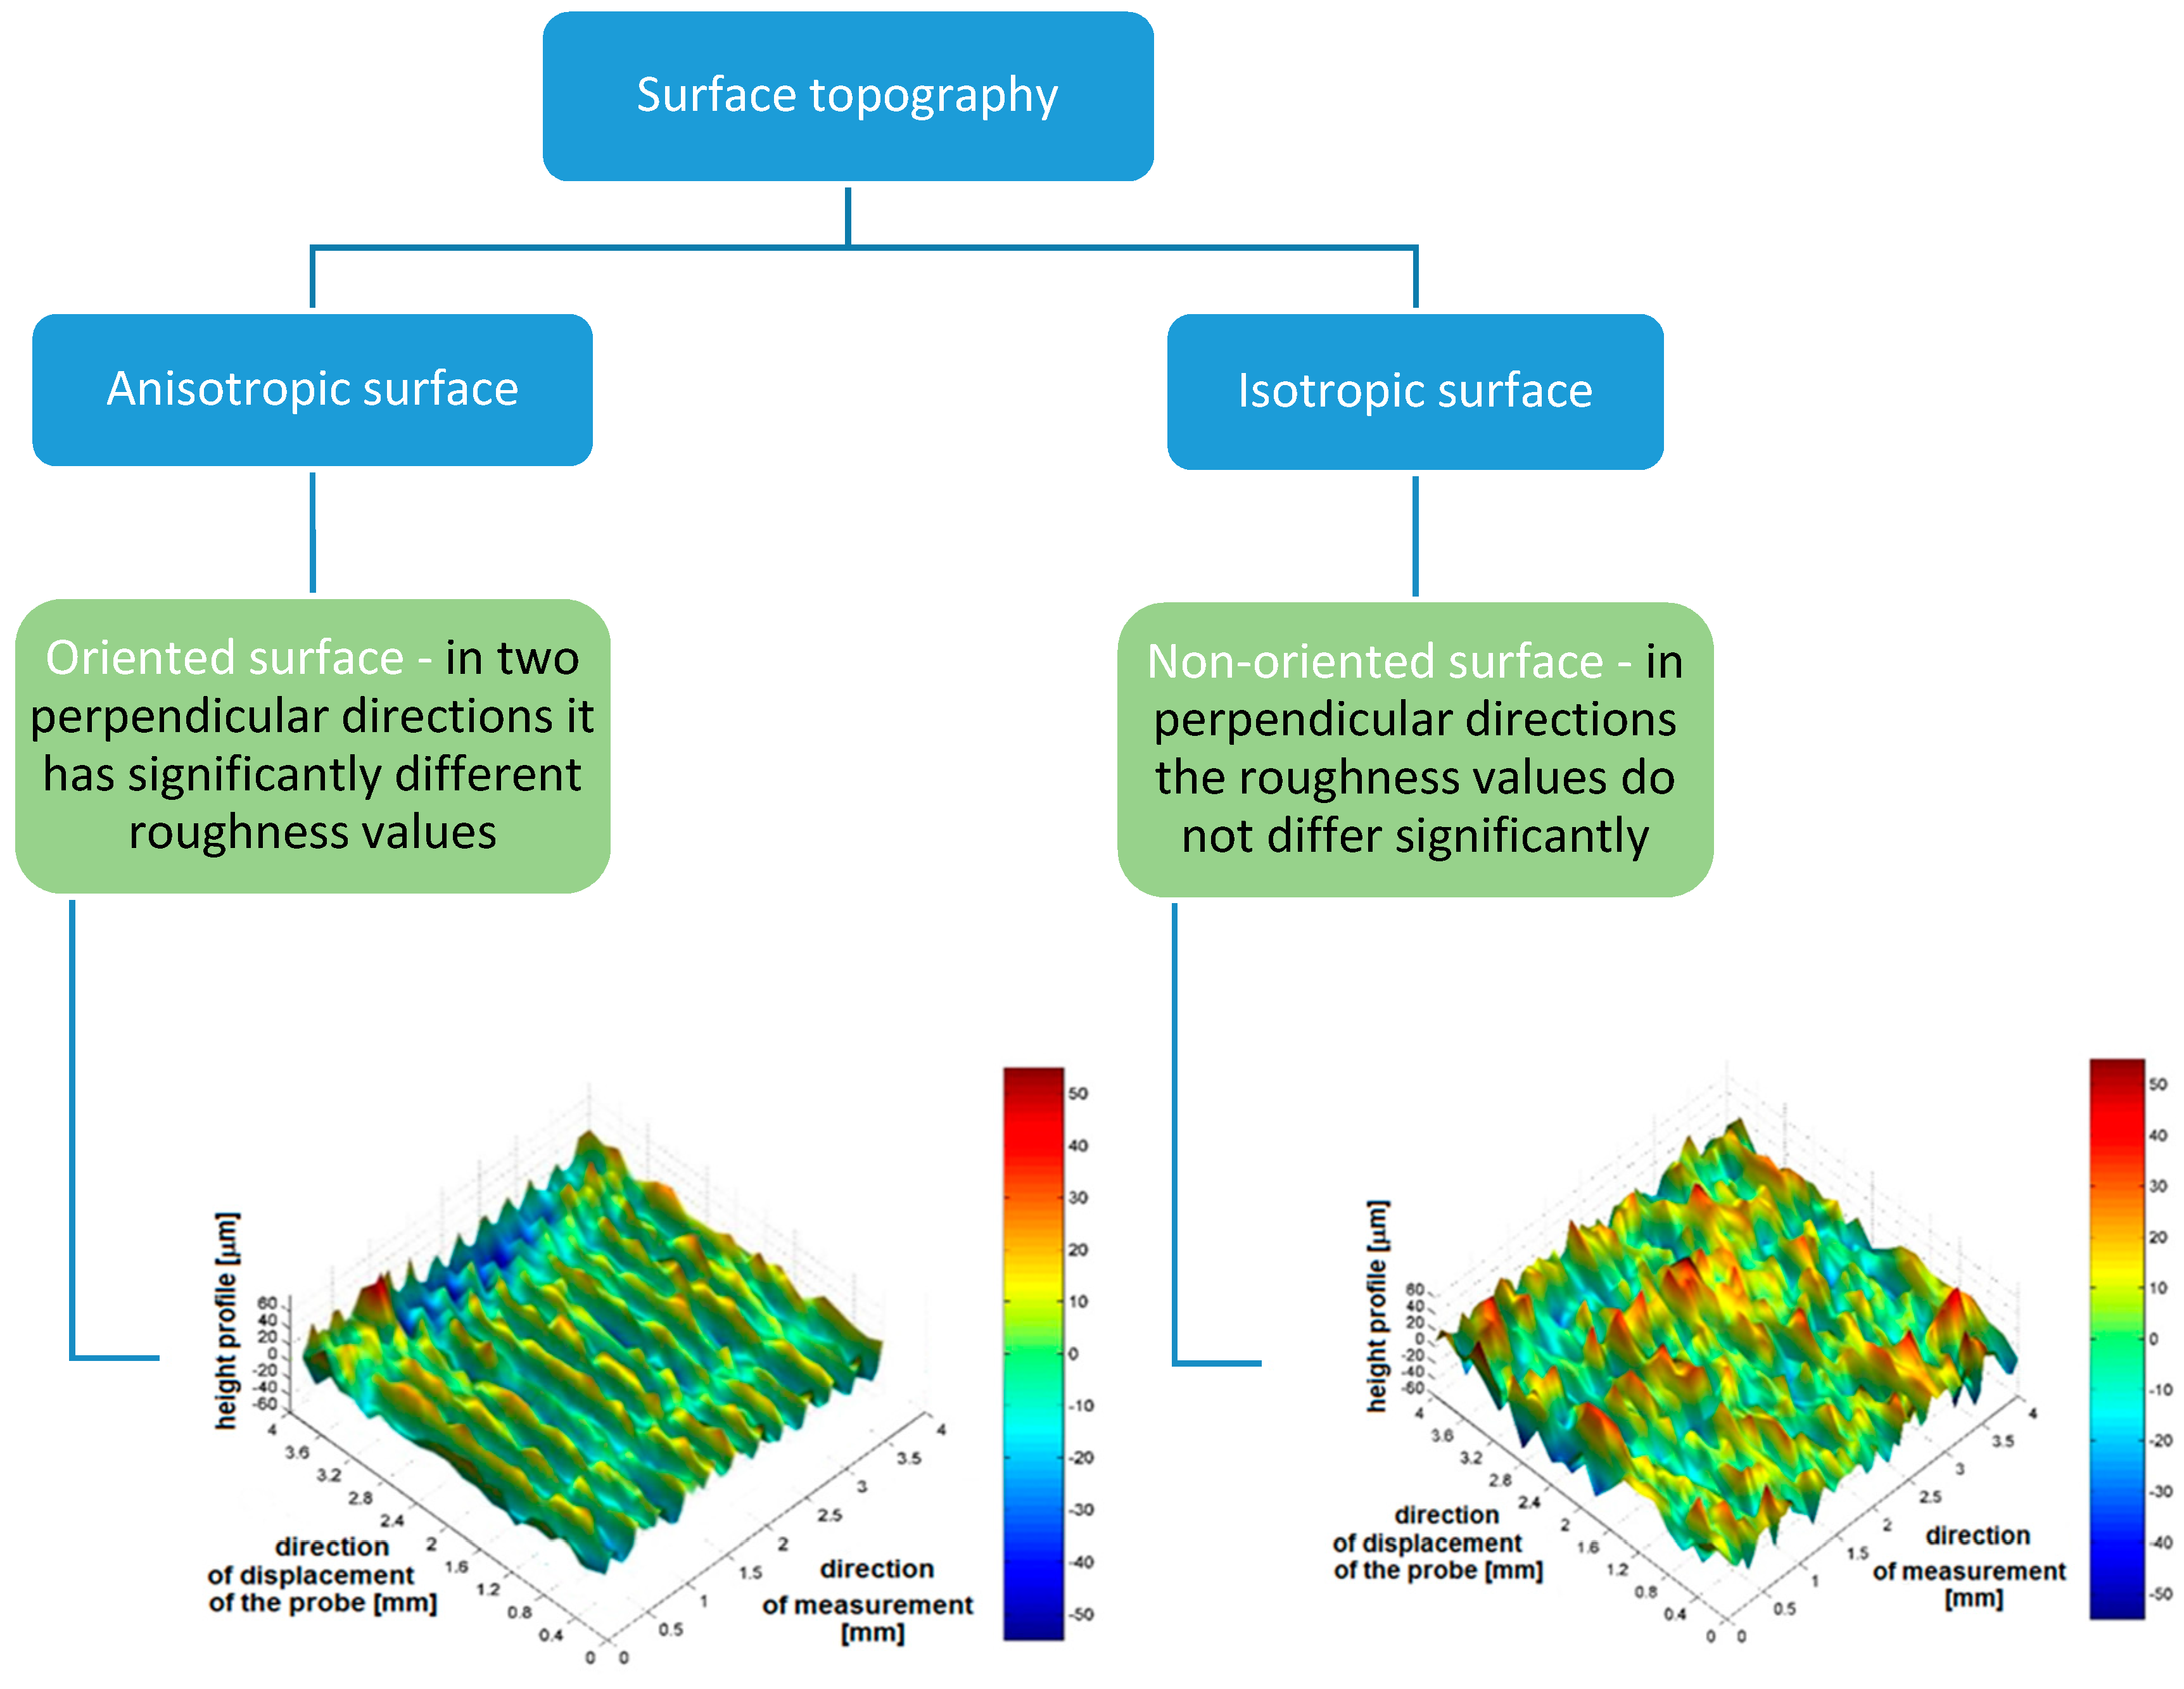
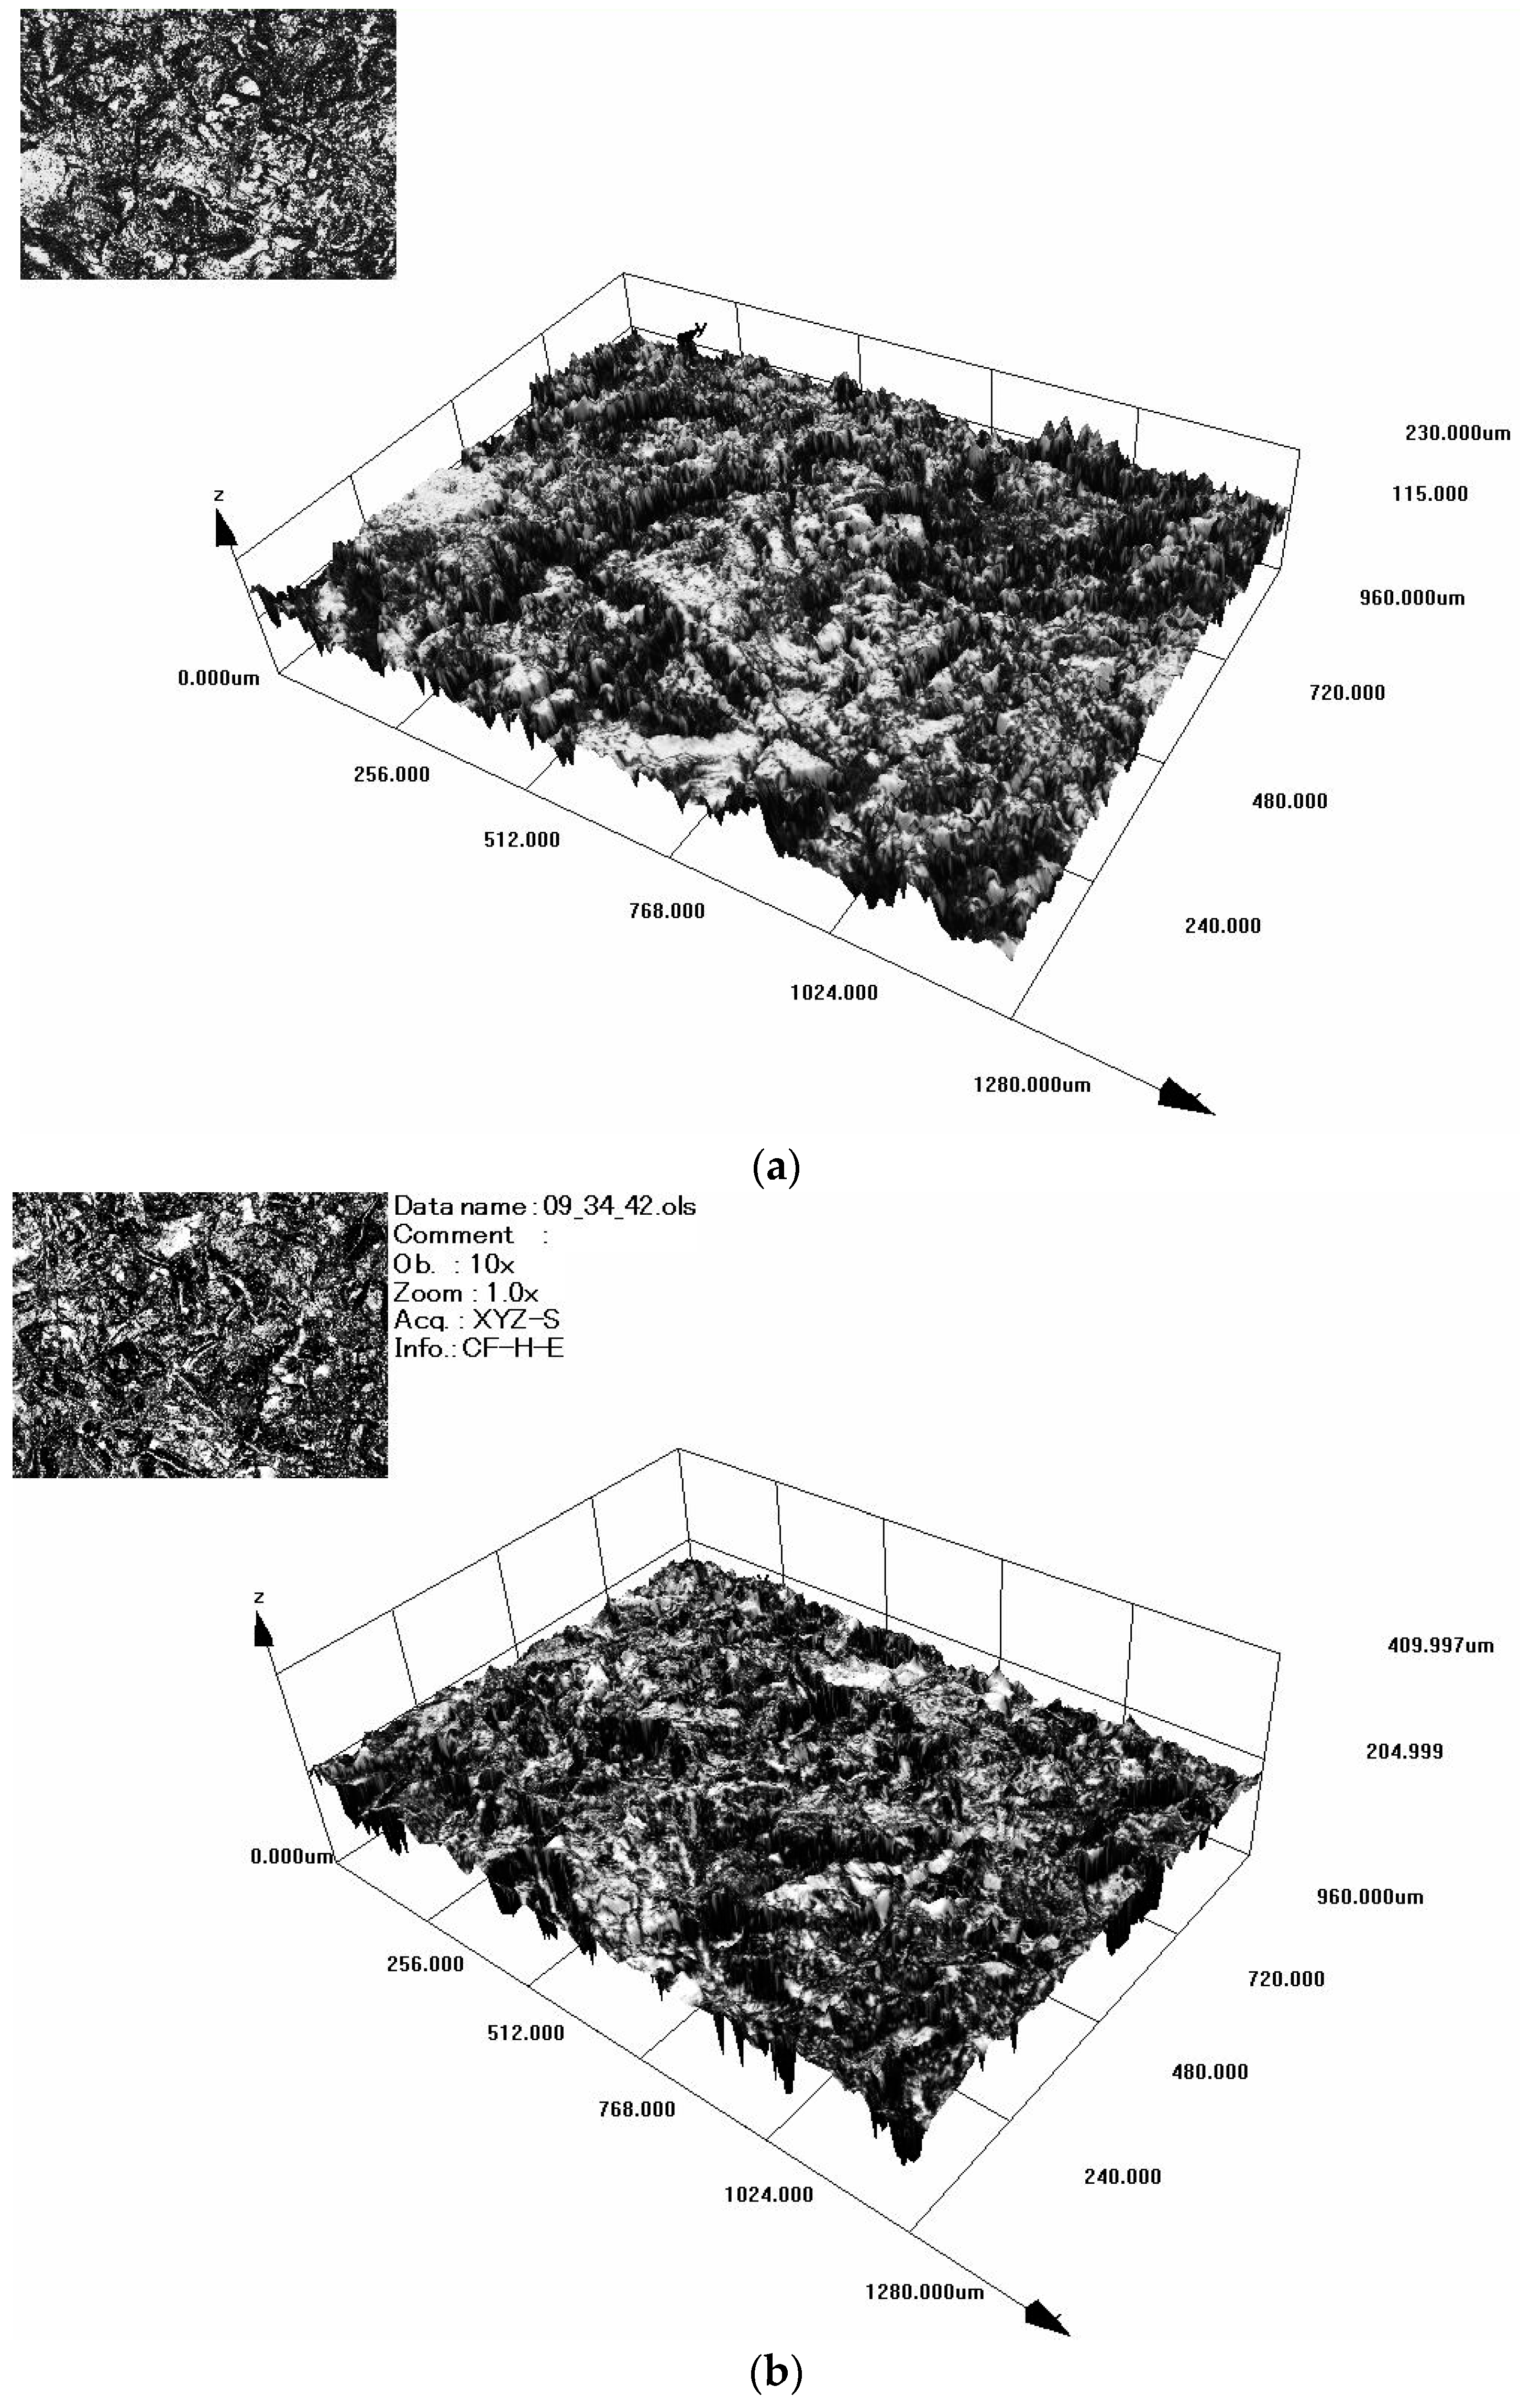
From the point of view topography, blasted surface can be defined as non-oriented (
Figure 3).
Surface topography of blasted material depends on:
- -
Properties of blasted material (mainly its hardness). Material exhibiting higher hardness, when being blasted, will not be as much affected as soft material in terms of surface topography.
- -
the type of used blasted abrasive. Hard blasting abrasives with larger diameter of particles harden the surface more than particles of small diameter. The ratio of blasting abrasive hardness to the hardness of blasted metal is important from the point of view of qualitative impact on surface and also in terms of removal of metal material itself,
- -
the same blasted abrasive invokes different topography for various parameters of blasting (landing speed, angle of impact, etc.) [
20,
21,
22].
M.N. Durakbasa in [
23] investigated surface roughness on flat and spherical specimens prepared using different machining processes with periodic and random profiles. Author compared results reached using stylus profilometer, confocal laser scanning microscope and infinite focus microscope. H. Zhu [
24] monitored development of surface roughness at different stages of wear and proposed specific parameter reflecting both fractal dimension and scale coefficient of rough surfaces.
The aim of the paper is to create a mathematical model describing the relationship between the surface roughness parameters of the blasted surface. The obtained model can serve for predicting roughness parameters on the metal surface after abrasive blasting. Monitoring of the achieved roughness of steel surfaces is an important part of ensuring repeatability and reproducibility of the pre-treatment process. From the very principle of the blasting process, it follows that the repeated use of blasting abrasives leads to irreversible changes in their shape, dimensions, depletion of their plasticity and thus the change of their mechanical properties, which results in a change in the resulting topography of the surface. Breaking of the abrasive grains causes surface contamination by dust particles, decreasing of roughness values, and consequently a change in the adhesion of subsequently applied coatings. It is therefore important to monitor roughness parameters during the surface preparation process.
3. Results and Discussion
The measurement results are shown in
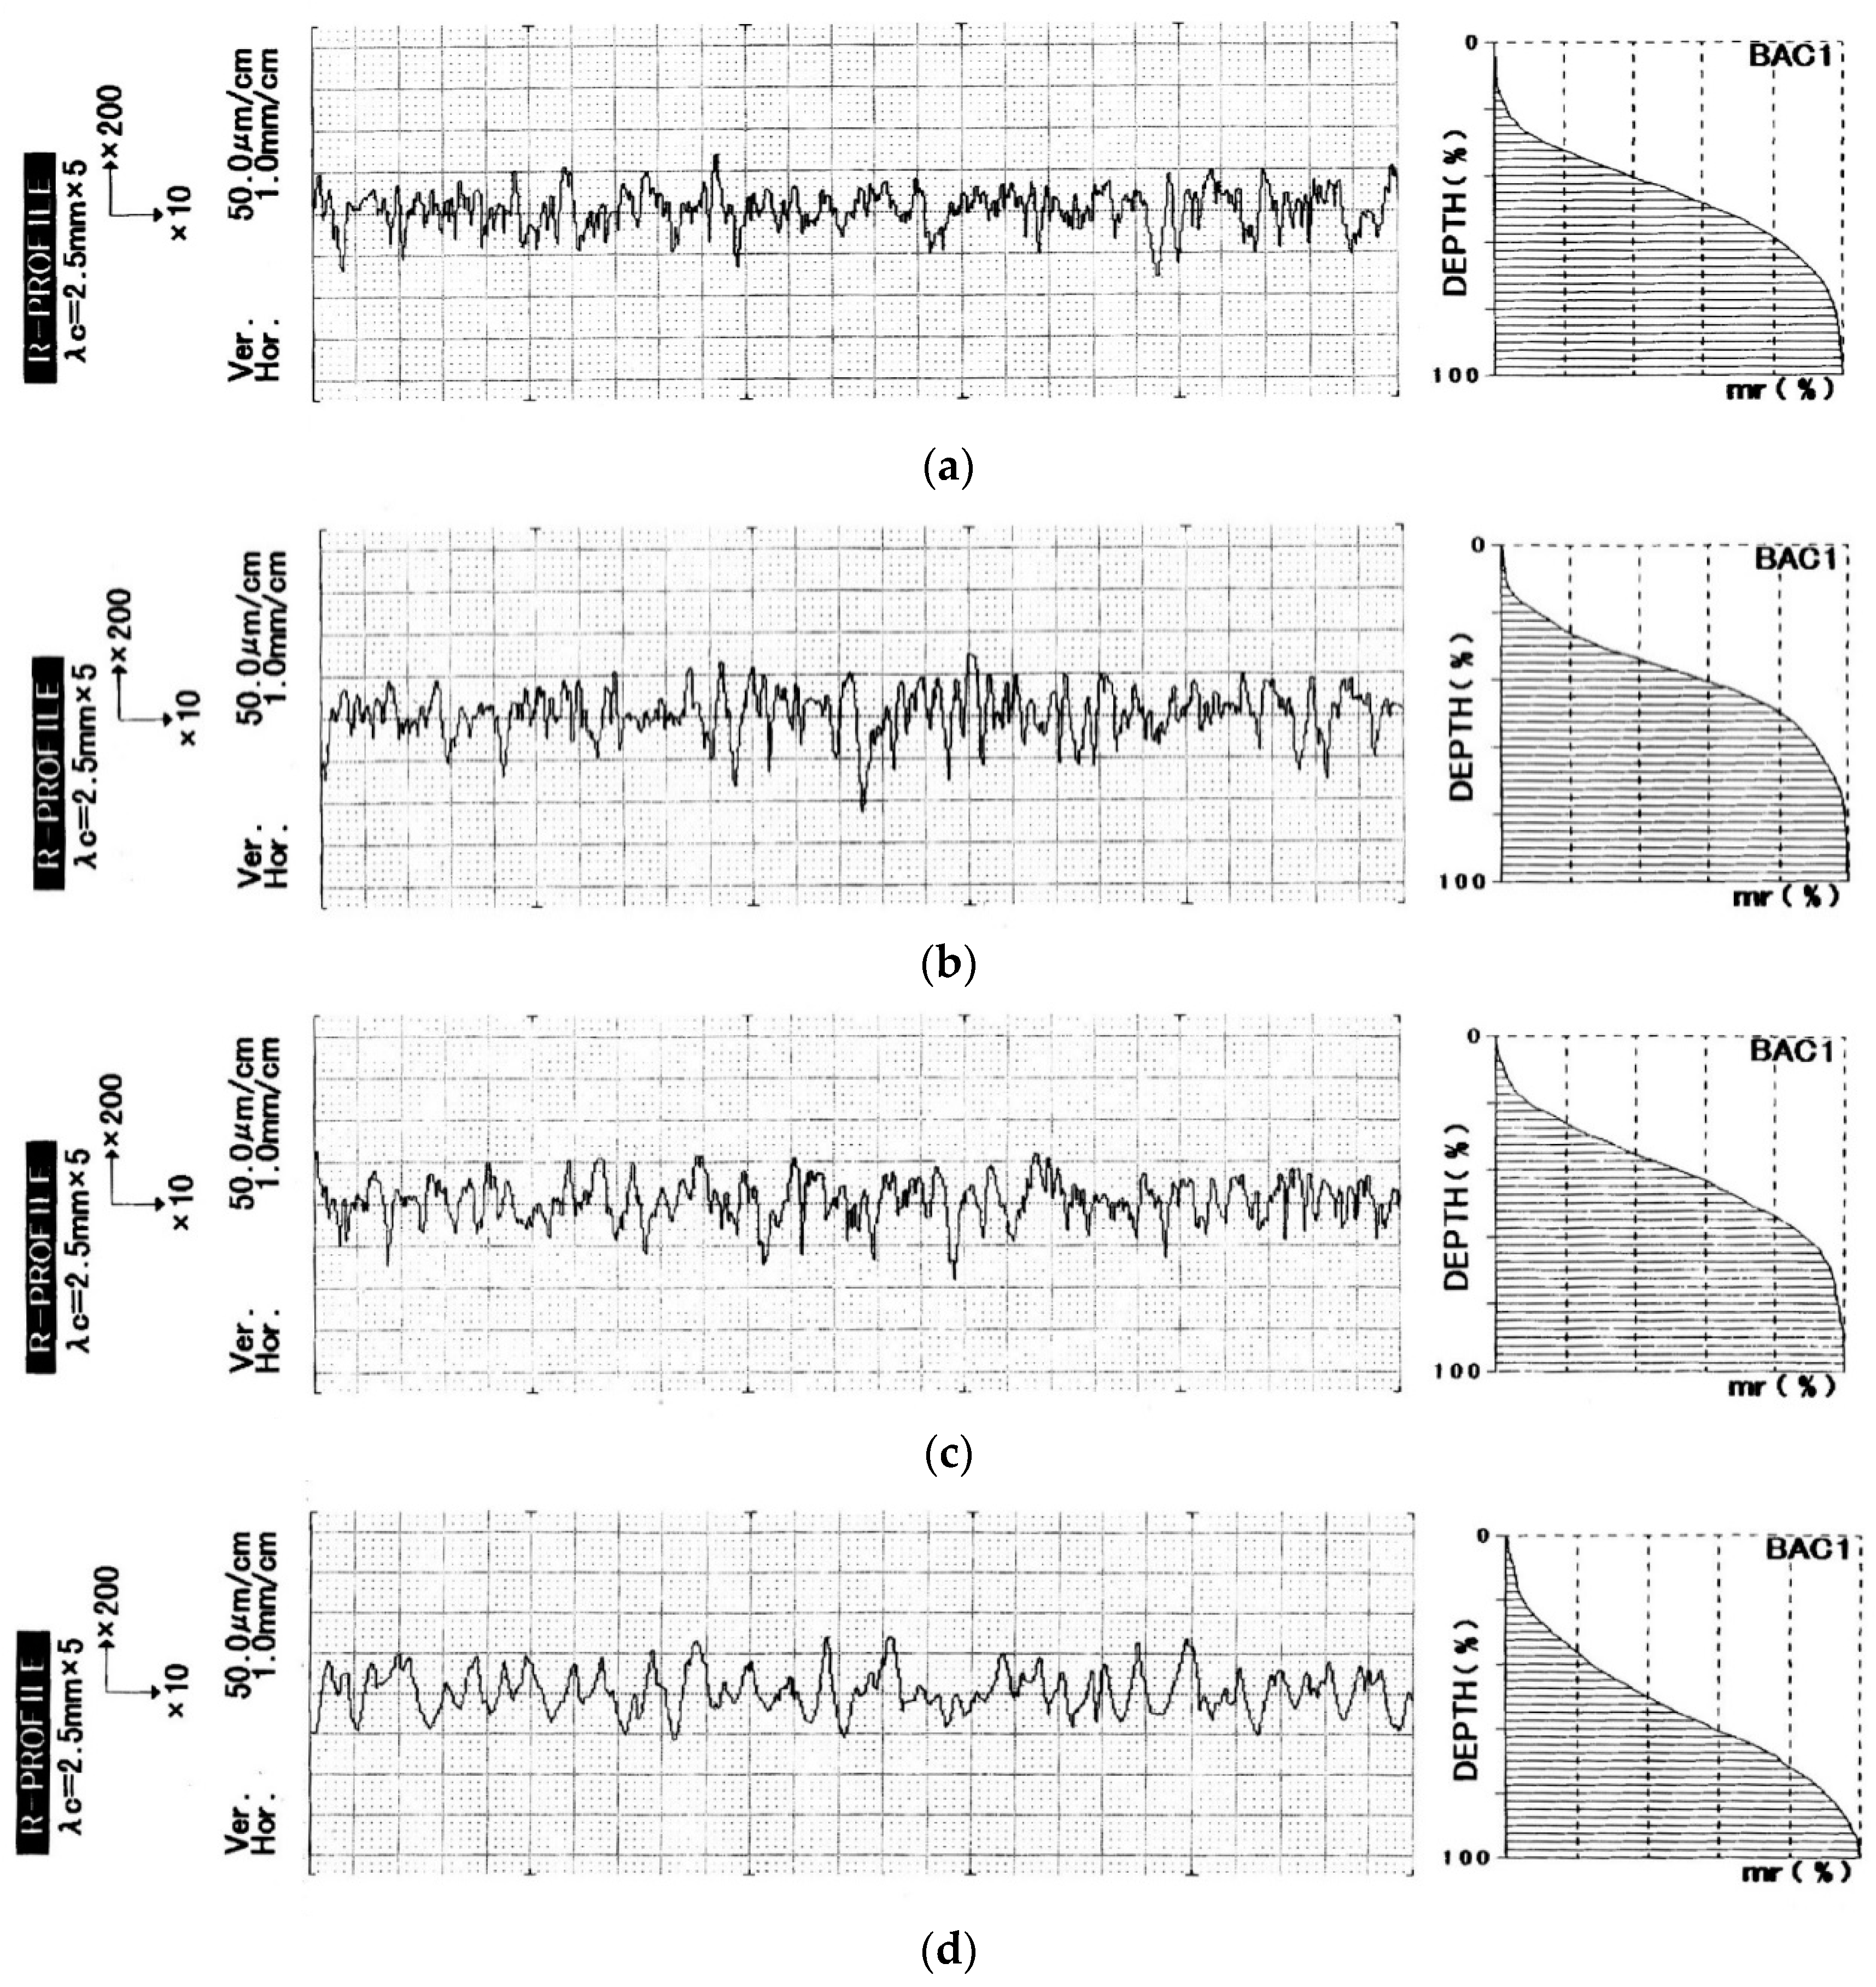
Table 6. Ra parameter is the basic and most common evaluated that is why it was used as the basis for comparison of surfaces. All evaluated surfaces featured comparable parameter Ra, the types of surfaces were correctly chosen and can be compared mutually. Profilographs of surfaces with Abbot—Fireston curves of material proportion for all evaluated types of surfaces are in
Figure 5.
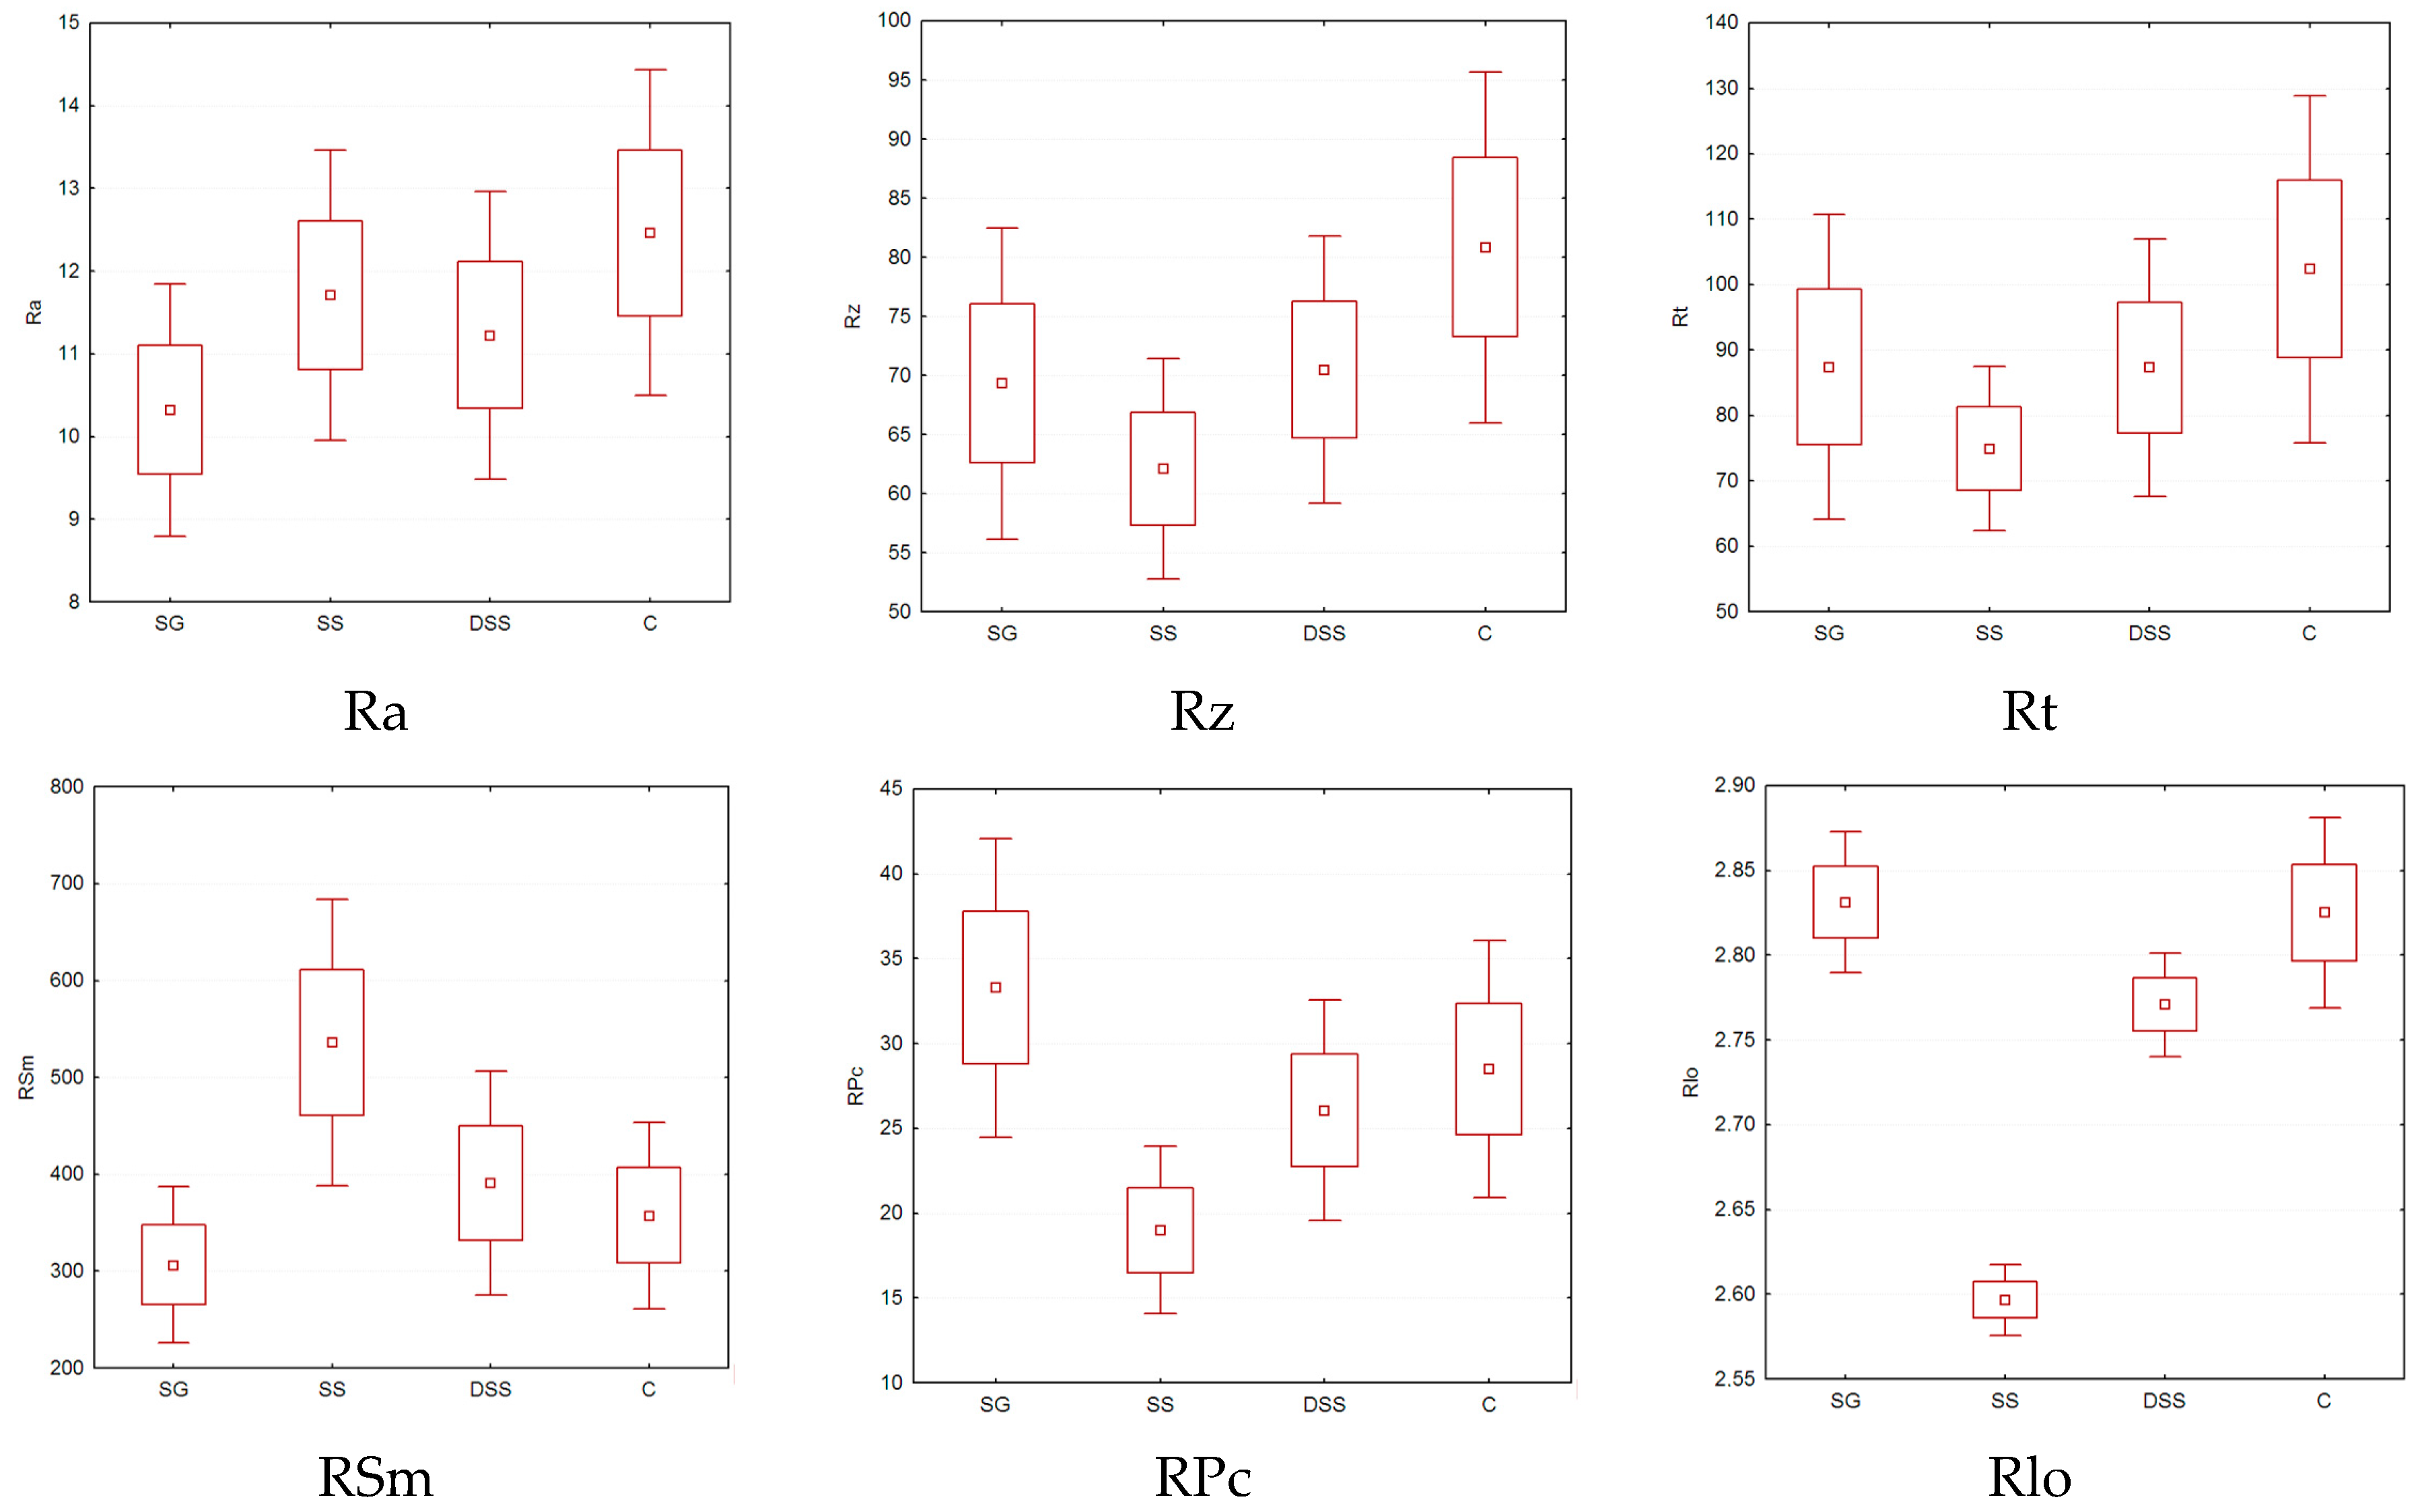
On the basis of performed measurements and their results, differences in their granularity caused by the use of different shapes of blasting abrasives (sharp shape or spherical) can be stated. Best rugged surface was achieved in blasting with sharp particles (corundum), where parameter RSm has reached the lowest value among the evaluated surfaces (or parameter RPc the highest). On the contrary, the lowest surface roughness was recorded for spherical particle (shot). Boxplot (average and 1.96 standard deviation) for roughness parameters is shown in
Figure 6.
Differences are also evident from the waveforms of curves of material proportion profiles, where the main difference can be observed in the upper section of cut—40%. The smallest material proportion can be reported for surface blasted with round blasting abrasive. Out of surfaces blasted with sharp shape blasting abrasive, the smallest material proportion is reported for blasting with grit, followed by surface blasted with demetalized steelmaking slag and finally the surface blasted with corundum.
In a comprehensive assessment of surfaces topography, the evaluation of only Ra parameter is not enough. For the same values of parameter Ra, the nature and smoothness of blasted surfaces differs. Due to this, the evaluation of surface needs to implement a set of parameters of roughness out of which following combinations can be recommended:
- -
Ra, Rz, RSm
- -
Ra, Rz, RPc or
- -
Ra, Rz, Rlo.
These allow you to effectively distinguish differences in topography of blasted surfaces from the point of view of other follow-up technologies, respectively to evaluate previous effects that had led to their creation.
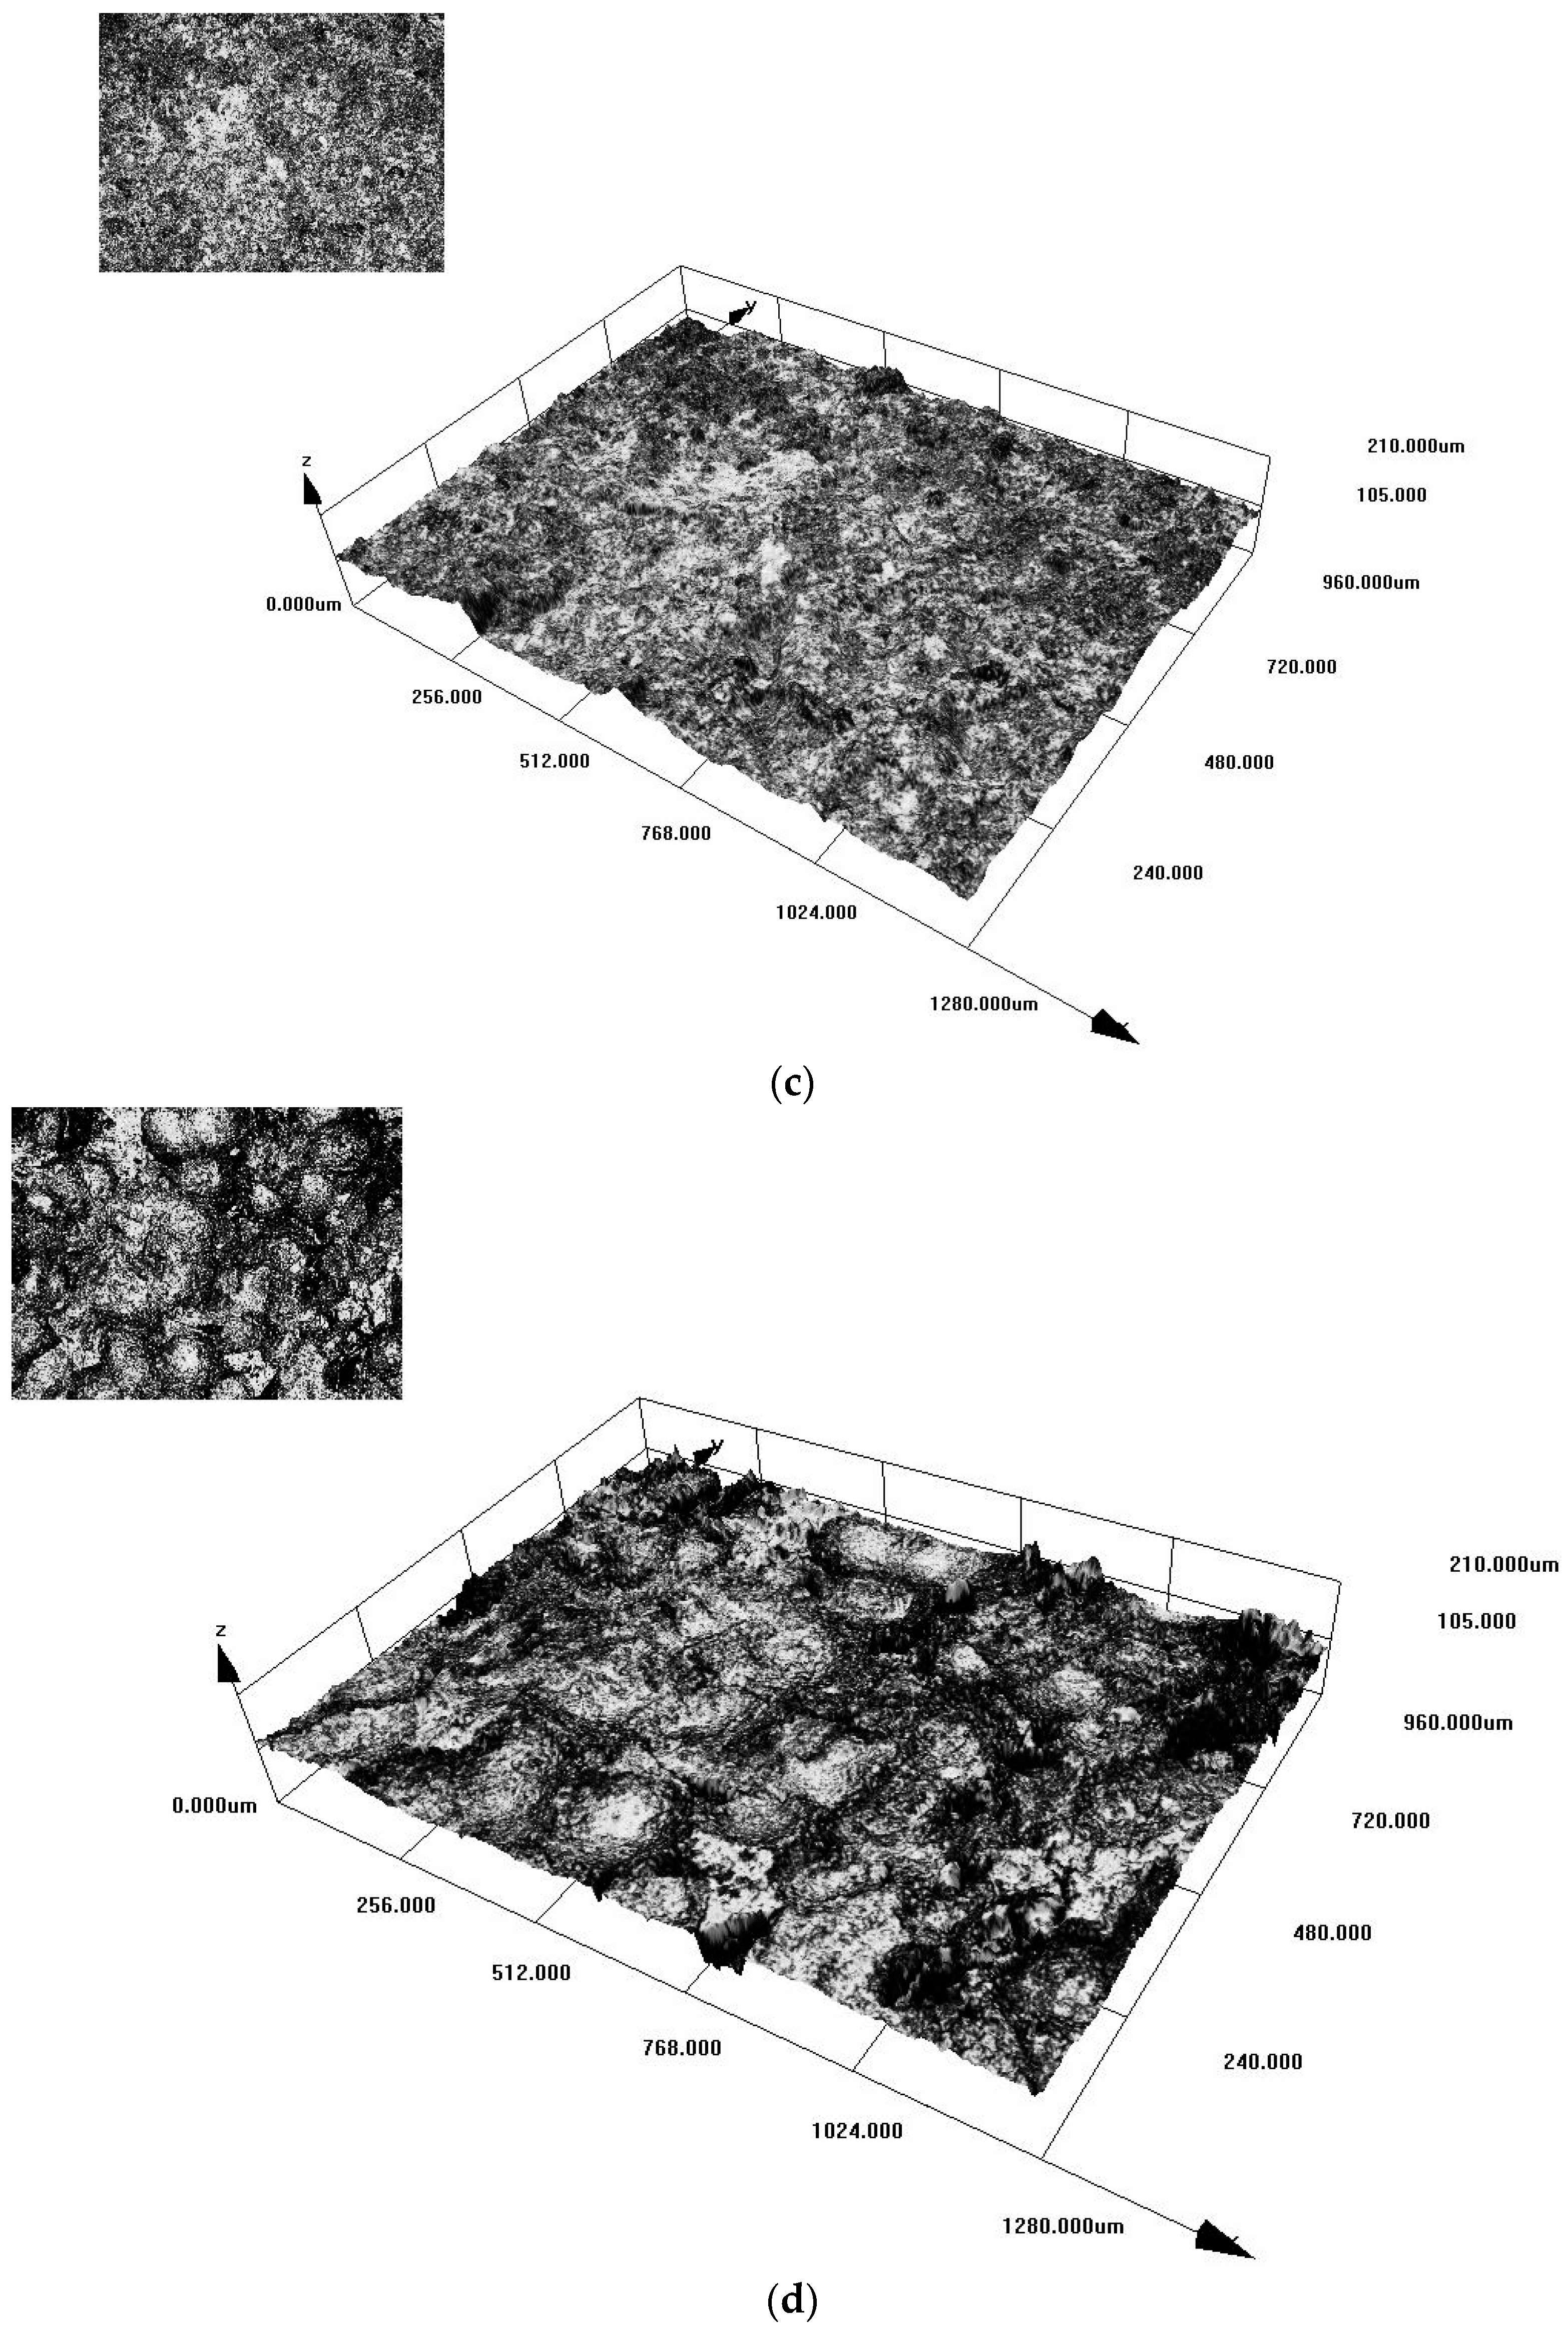
At a mutual visual comparing of assessed surfaces, a difference is visible as in a character of surfaces blasted by various TP types. The different character of blasting surface is shown on
Figure 7. At such types an uneven surface is reached, resulting by an incidental fall of particles—blasting abrasives. A surface blasted by a sharp blasting abrasives—steel and corundum grit and DOT does not show such uniformity as at blasting by round particles. Notches are on the surface in a various orientation, intersected mutually and a notable part of holes and juts is sharp. From utilized sharp TP, the most segmented surface was detected at the surface blasted by a steel grit, what corresponds moreover with the results achieved by 2D measurement of RPc and RSm parameters. At blasting by round blasting abrasives—a steel shot, more uniformed surface modification was achieved, which is created by intersected round juts. Holes create round areas which are bounded—lined by angular juts.
Values of the surface volume achieved at individual surfaces are displayed in
Table 7. The biggest surface volume was recorded at blasting by the steel grit and the smallest at utilizing the shot, what corresponds also with a tendency of roughness quantities. Such fact in compliance with a recommendation that under functional coatings an angular type—grit is used as a suitable blasting abrasives, where a surface achieves a bigger segmentation as a surface obtained by the shot which is more suitable under protection coatings.
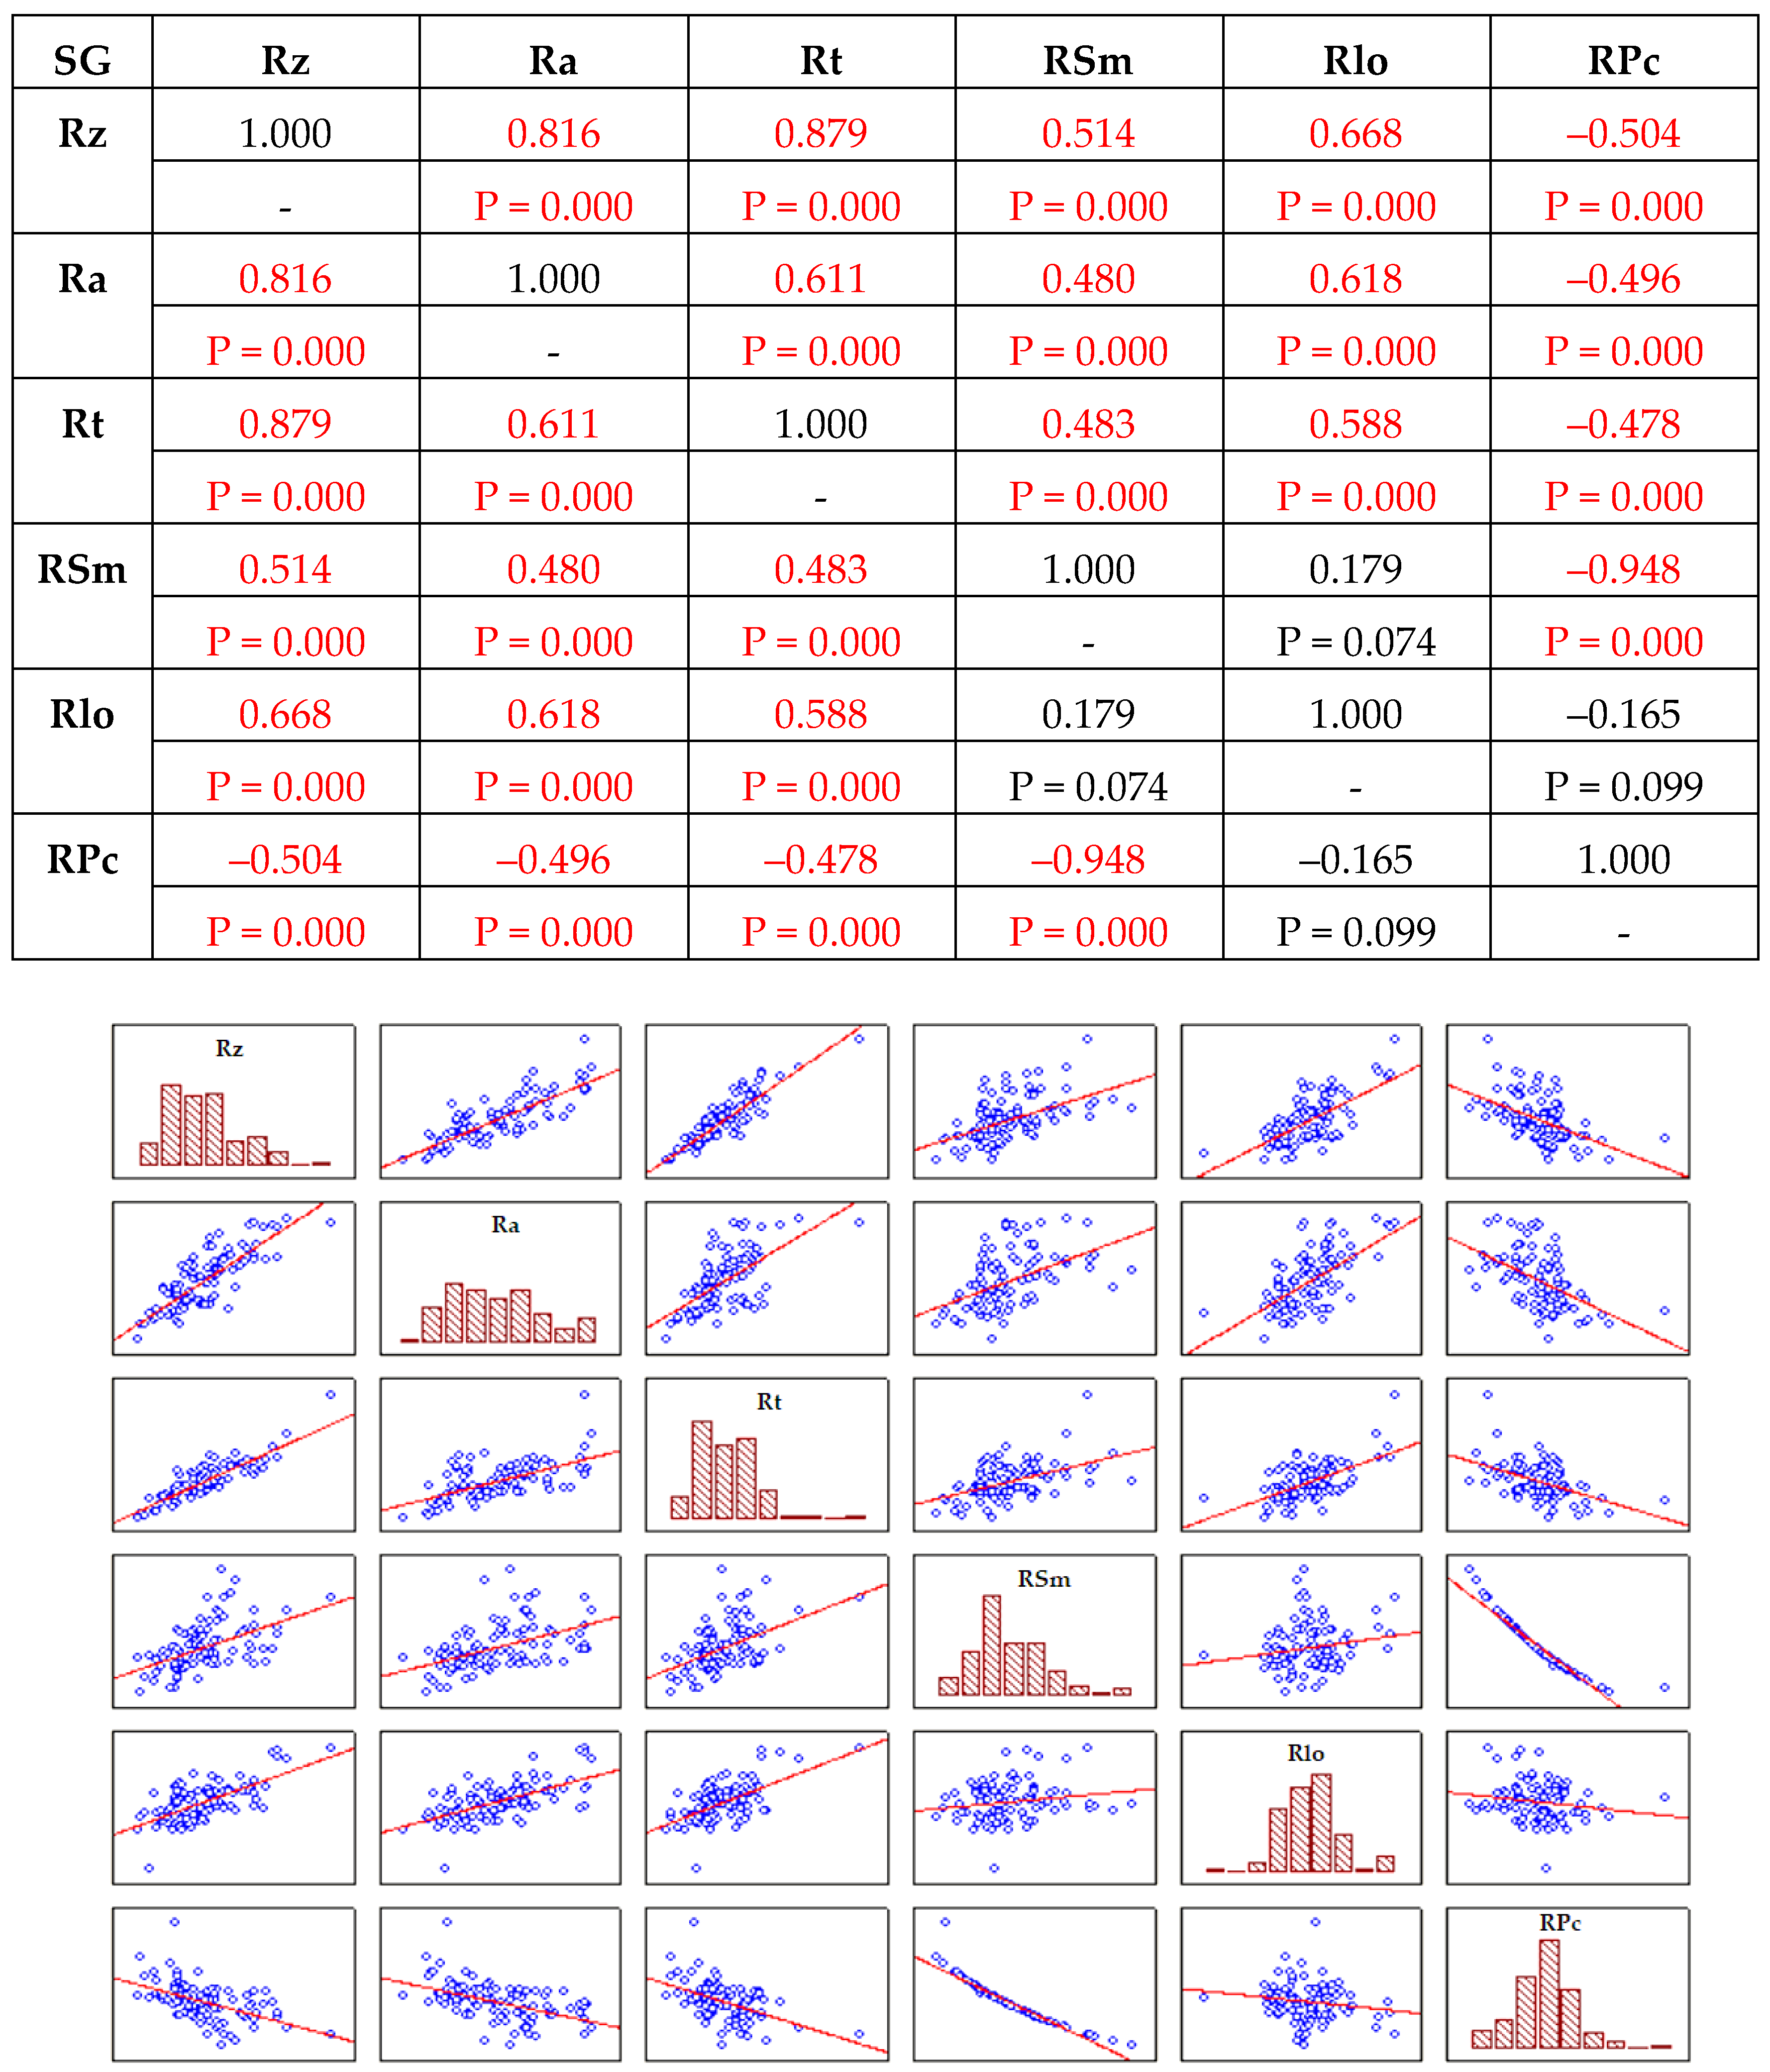
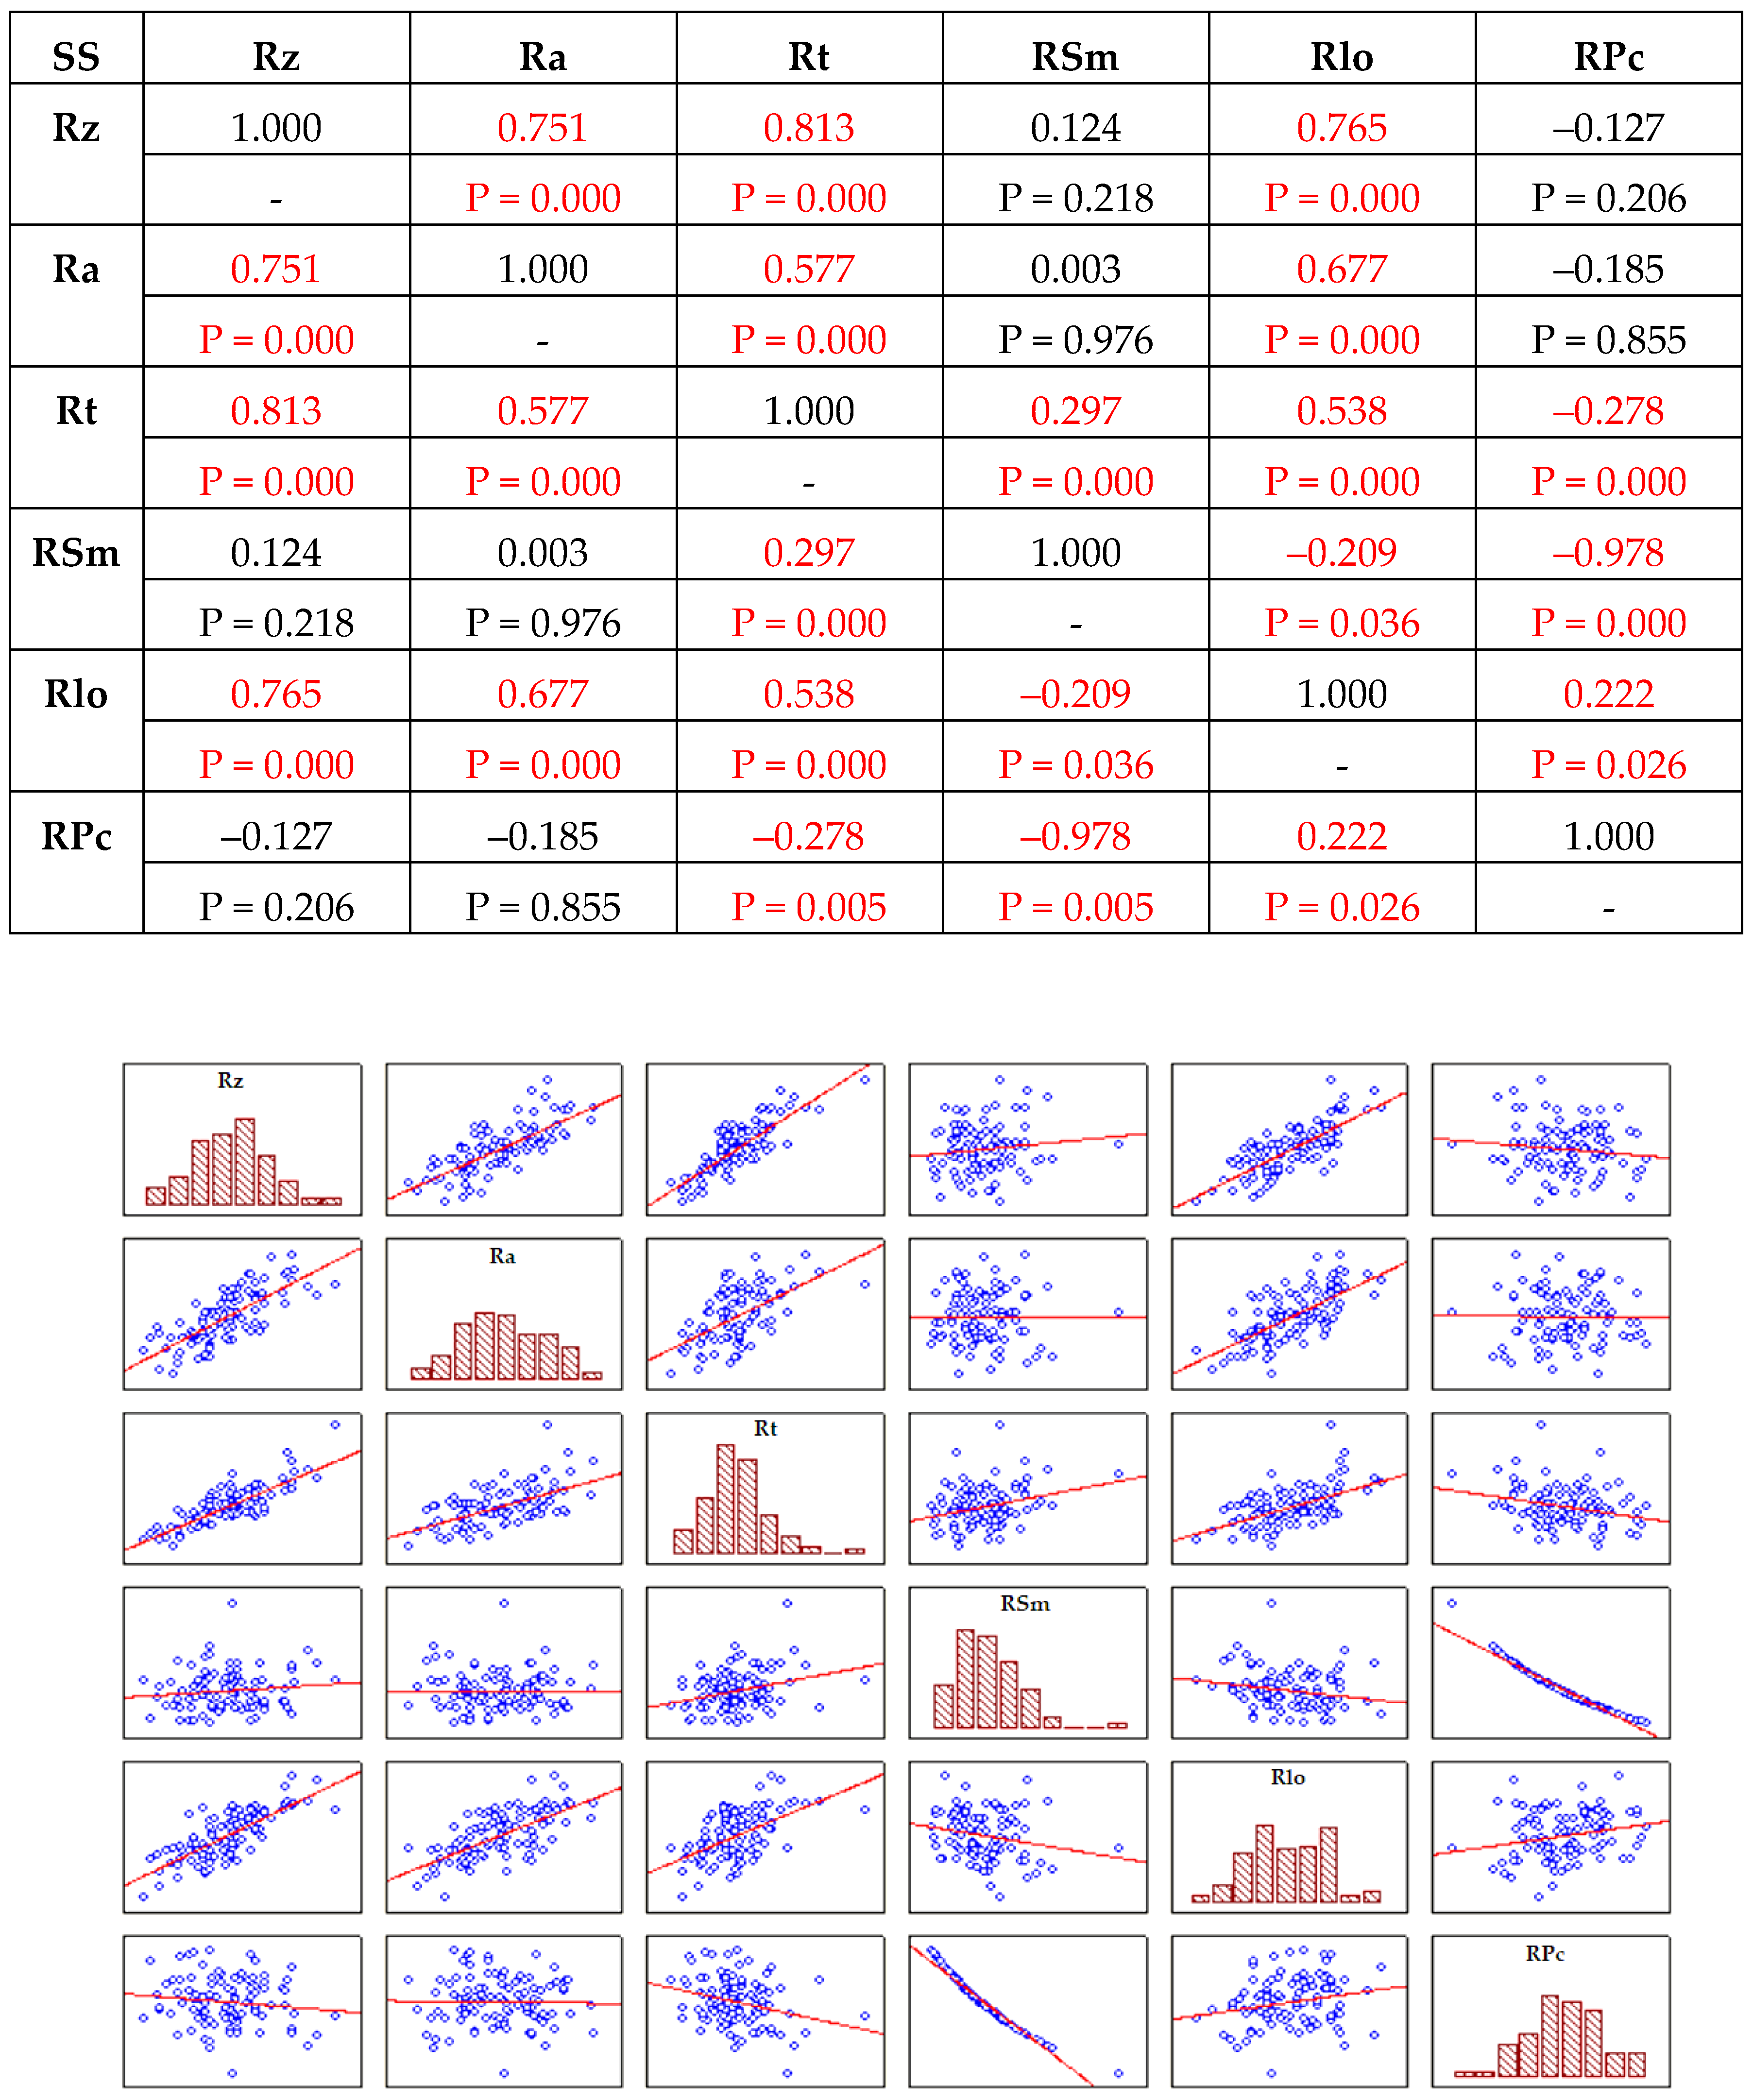
There were observed six parameters of roughness (Ra, Rz, Rt, RSm, Rlo, RPc), i.e., the correlation matrix has a size of 6 × 6, it is the matrix of correlation coefficients for all pairs of parameters. The paired correlation coefficient measures the dependence between the two variables mutually. In
Figure 8,
Figure 9,
Figure 10 and
Figure 11, significant dependencies are indicated in red.
Figure 8 shows the correlation matrix and matrix graphs of the individual roughness parameters for the surface blasted with steel grit. There is statistically significant correlation between all monitored parameters, with the exception of Rlo-RSm and Rlo-RPc pairs. There is a strong direct dependence between the Rz-Ra and Rz-Rt pairs, and a strong indirect dependence between RPc-RSm. Between parameters Ra-Rz-Rt-RSm-Rlo, there is always a direct dependence. There is an indirect dependence between RPc and the other parameters, the strongest in RPc-RSm pair.
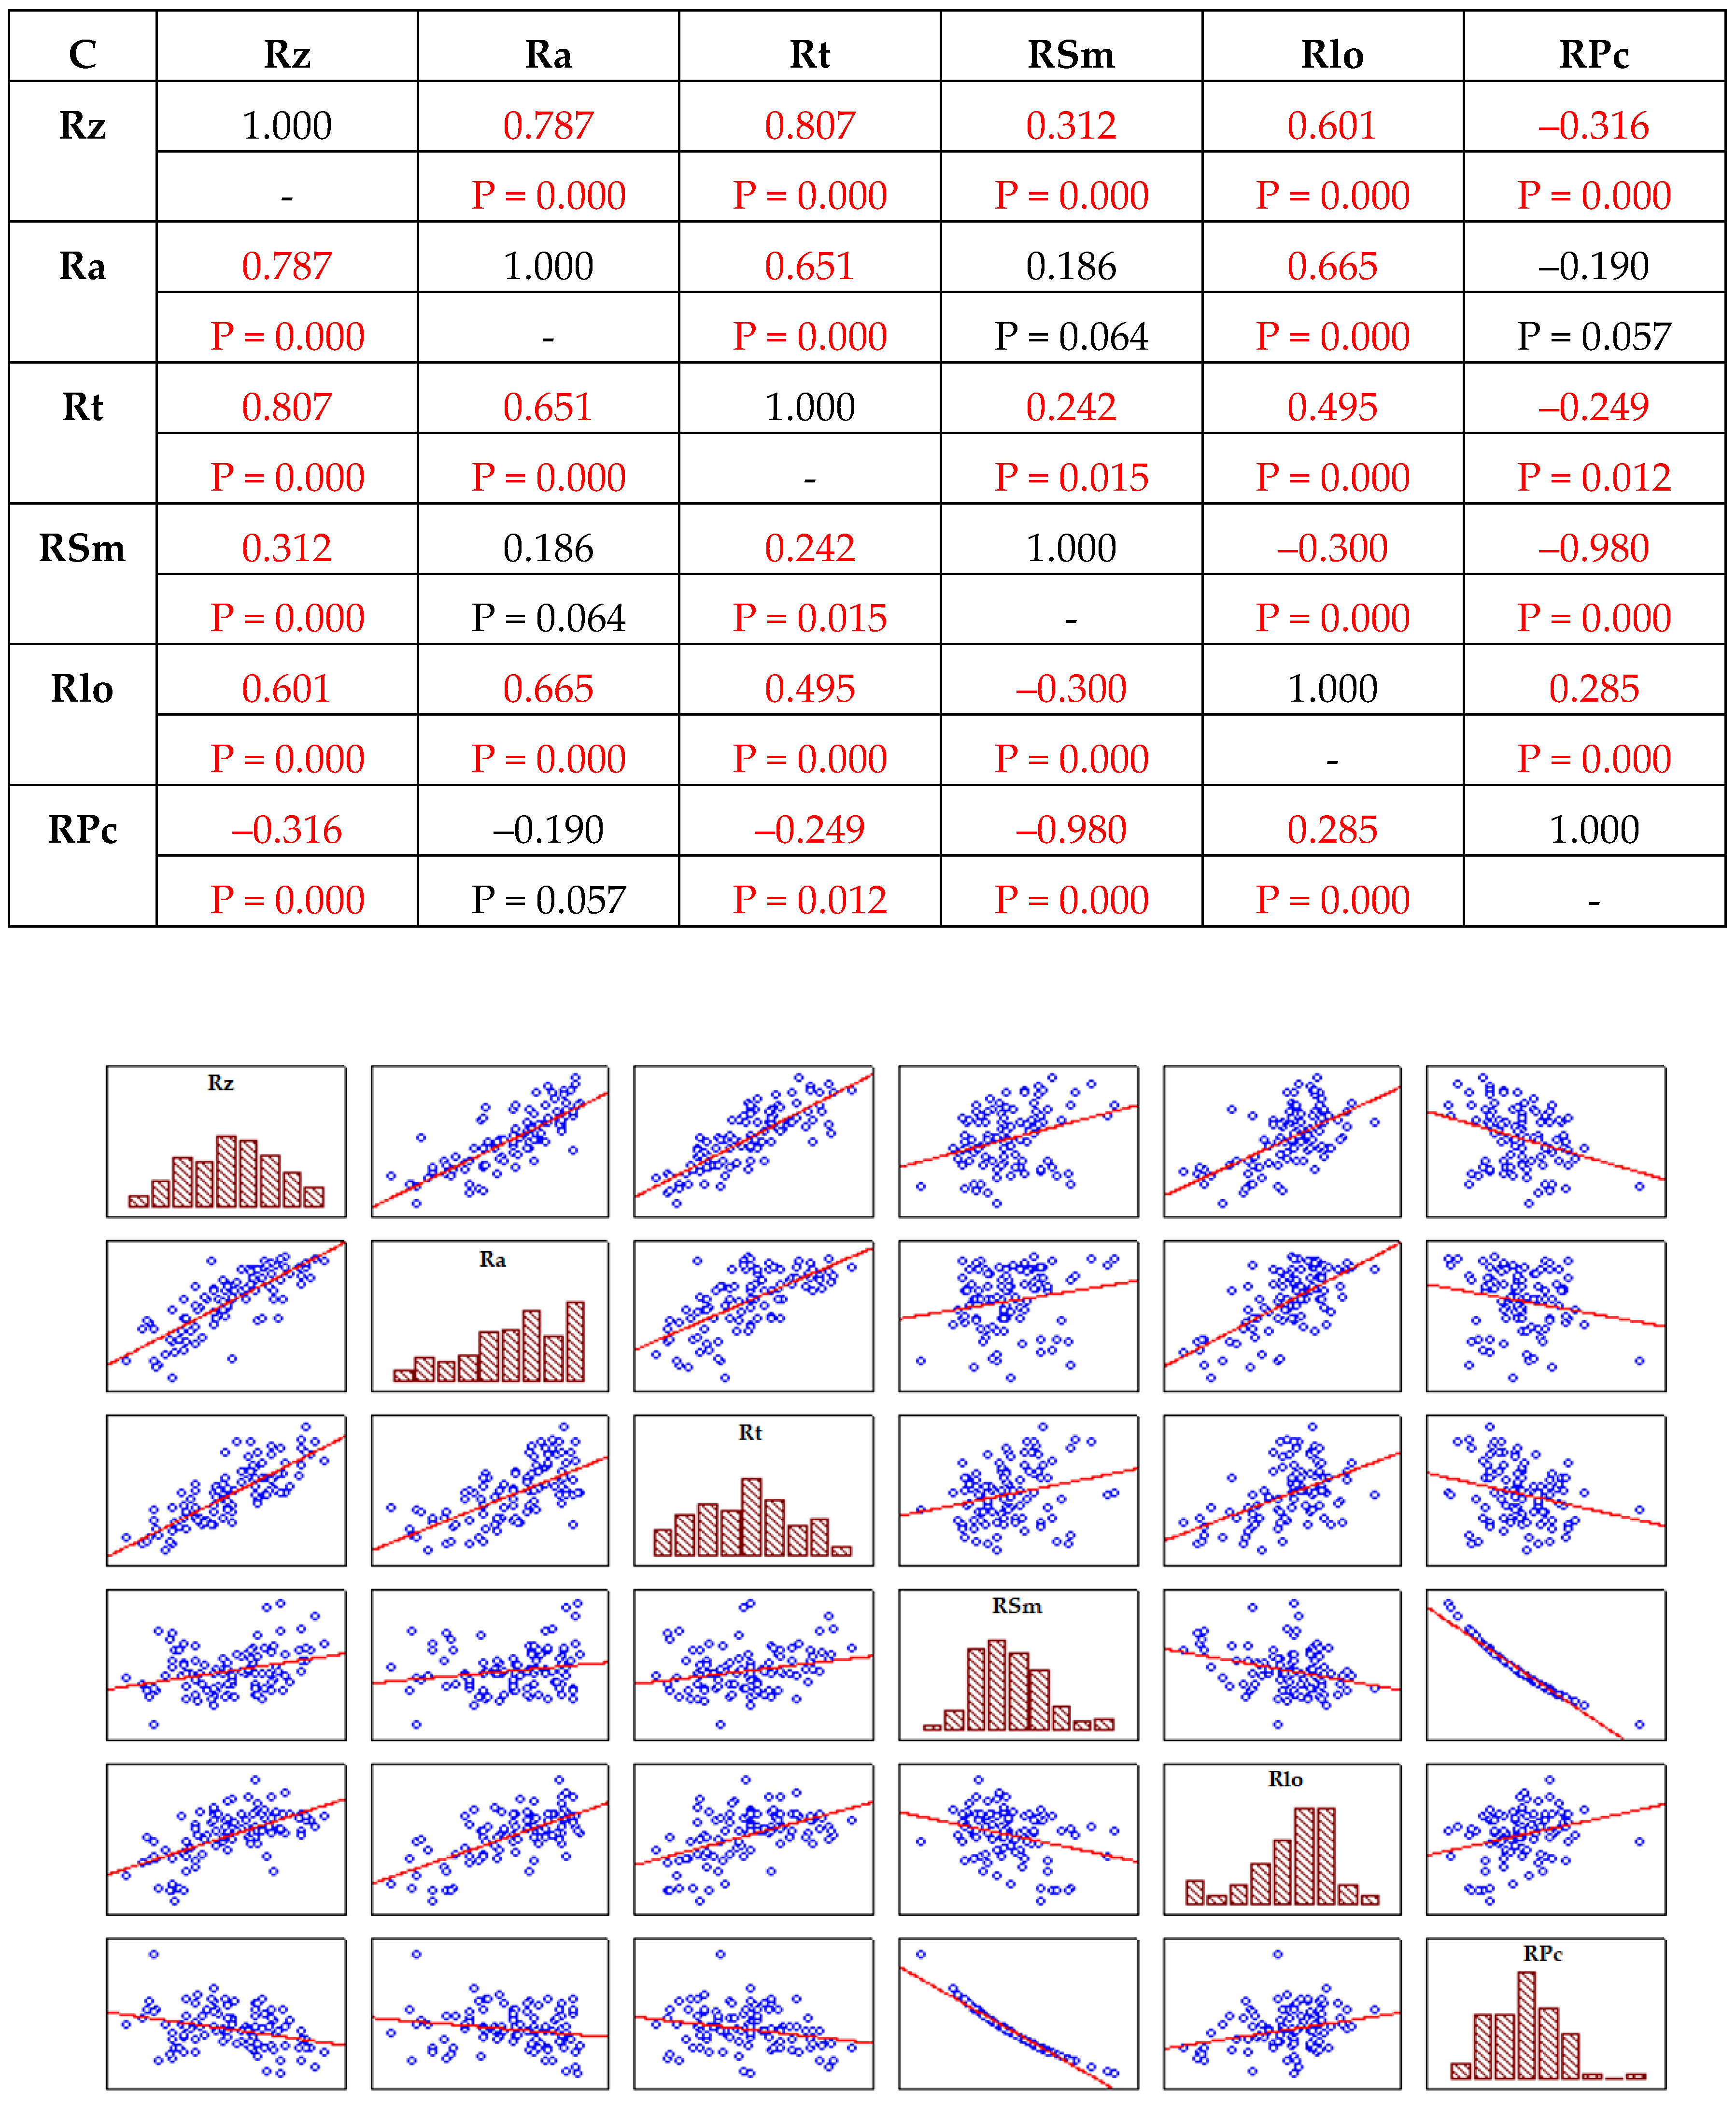
Figure 9 shows the correlation matrix and matrix graphs of the individual roughness parameters for the surface blasted with steel shot. There is statistically significant correlation between the observed parameters, with the exception of Ra-RSm, Ra-RPc, Rz-RSm and Rz-RPc pairs. Between parameters Rz-Ra, Rz-Rt and Rz-Rlo are strong direct dependencies. Between parameters Ra-Rz-Rt-RSm-Rlo, there is always a direct dependence, with the exception of Rlo-RSm. Between RPc and other parameters are indirect dependencies, except for Rlo-RPc, between RPc-RSm parameters, there is the strongest dependency (r = −0.9782).
Correlation matrix and graphs of corundum (
Figure 10) show a significant correlation between the observed parameters except for Ra-RSm and Ra-RPc. There is a very close dependence between RPc-RSm. Rz-Ra and Rz-Rt feature a high dependence. Rz-Ra and Rz-Rt feature a strong direct dependence, while RPc-RSm feature a strong indirect dependence. There is an indirect dependence between RPc and other parameters, with the exception of Rlo where there is no dependency.
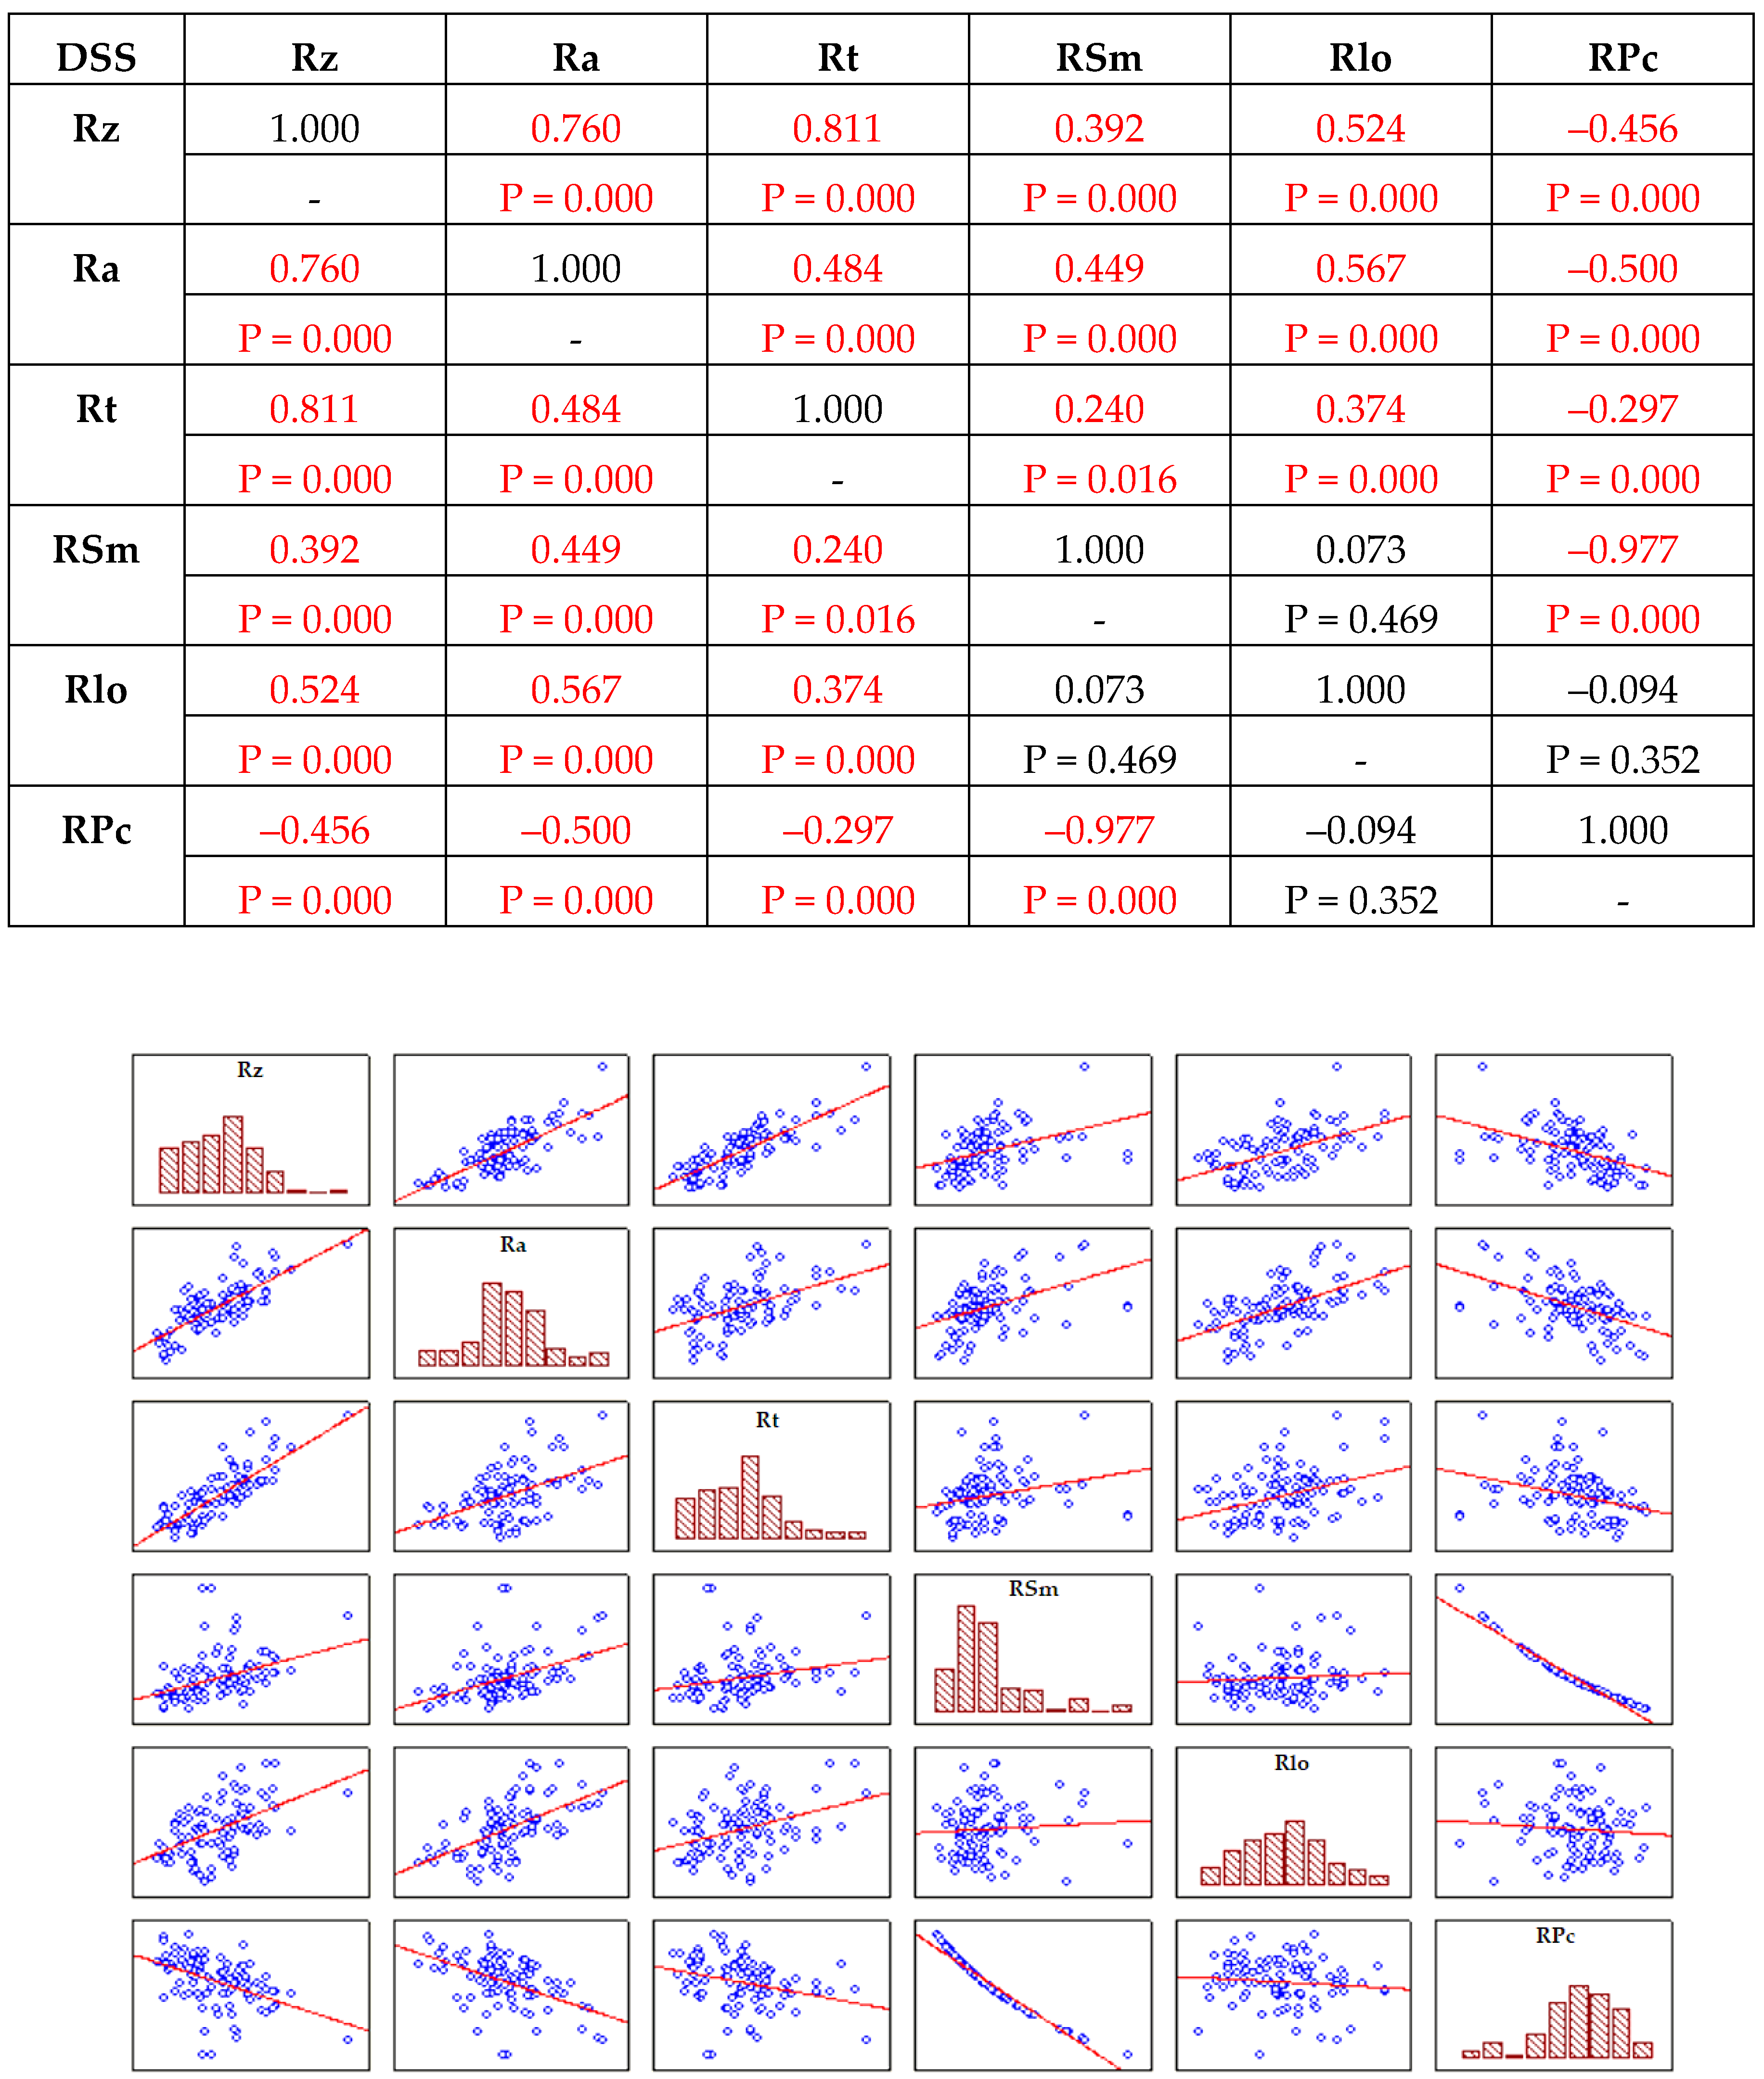
Correlation matrix and graphs of demetalized steelmaking slag (
Figure 11) show a statistically significant correlation between the monitored parameters except for Rlo-RSm and Rlo-RPc. There is a very close dependence between RPc-RSm. Rz-Ra and Rz-Rt feature a high dependence. Parameters Rz-Ra and Rz-Rt feature a strong direct dependence and a strong indirect dependence exists between RPc-RSm. There is an indirect dependence between RPC and other parameters.
Correlation matrices and graphs suggest that parameters of surfaces prepared with the use of blasting abrasives:
- -
Sharp shaped (grit, corundum, demetalized steelmaking slag devices) show a high direct dependence between Rz-Ra and Rz-Rt parameters,
- -
spherical shaped (shot) show that there is also a high direct relationship between Rz-Ra and Rz-Rt parameters, but a high direct dependence between Rz and Rlo parameters,
- -
RPc and RSm parameters feature a high indirect dependence for both shapes of blasting abrasives.
With the use of ANOVA, regression models were set. Ra value was chosen as a dependent variable. Other surface roughness characteristics were considered as independent variables (1)
General regression model can be written in the following form (2)
where a
0 is the locating constant that expresses the expected level of the dependent variable at zero value of the independent variable, a
1–a
5 are regression coefficients expressing by how many units of measure the dependent variable changes when the independent variable changes by one unit of measure.
The relevance of proposed model is tested by means of ANOVA, based on
p-values, the estimated models are statistically significant, (
p < α, α = 0.05). Regression models for Ra variable and
p-values are in
Table 8.
To evaluate the significance of a locating constant and the regression coefficients,
p-values are used. Statistically significant changes are shown in the
Table 9 which also implies that Rz and Rlo are statistically significant for all types of blasting abrasives (statistical significance marked in bold).
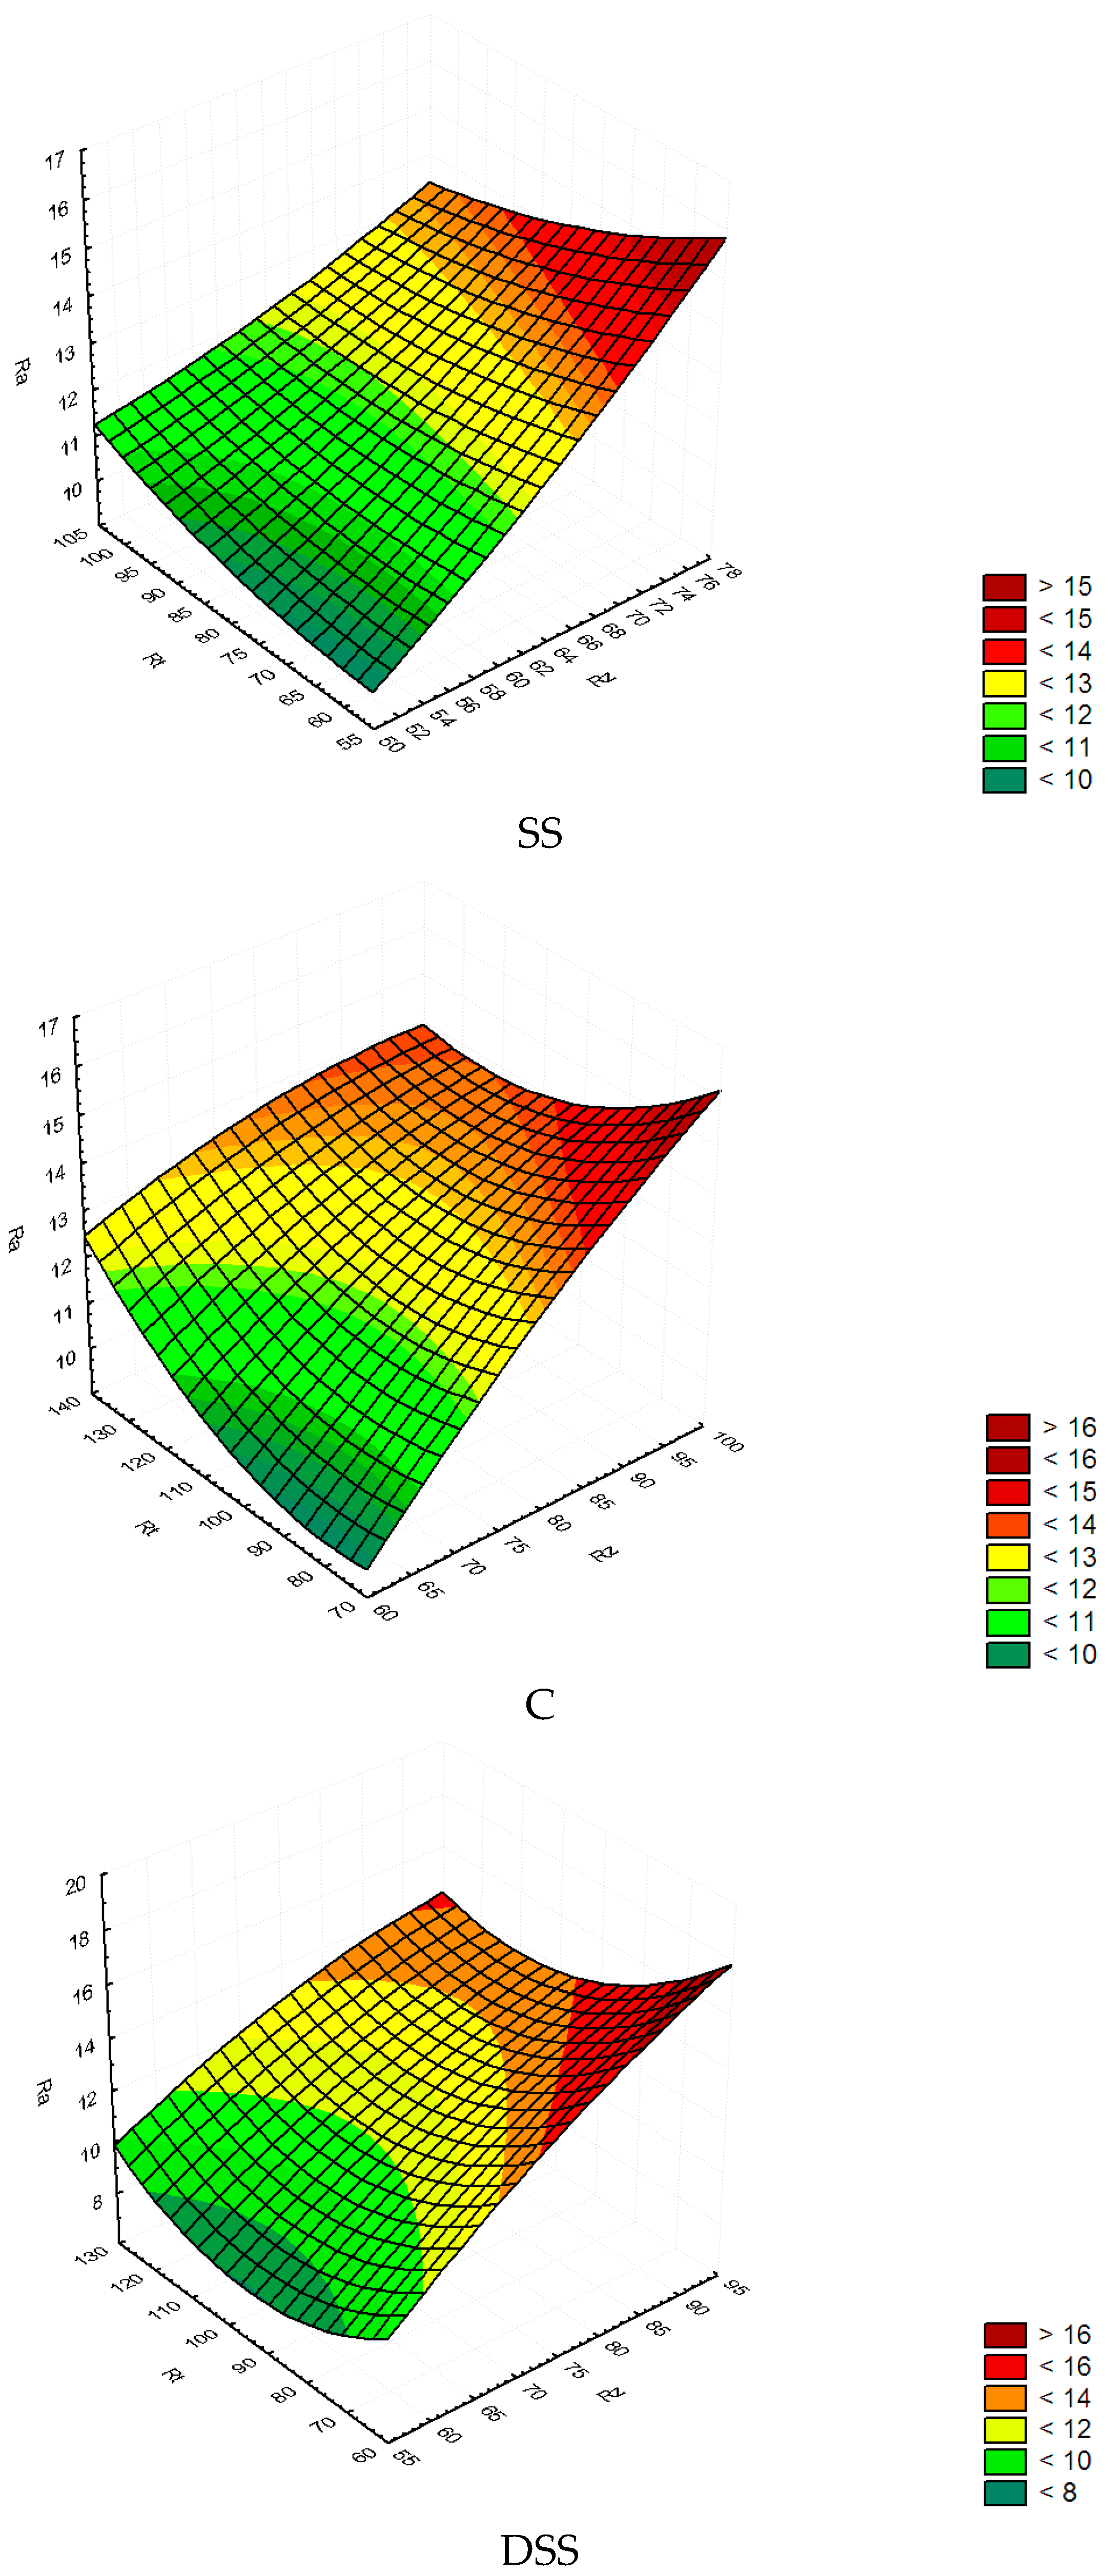
3D graphs in
Figure 12 show the relationship between a mean arithmetic deviation of the profile at the base length Ra, maximum height of the profile on the base length Rz and total height of the profile on the evaluated length Rt. If Rz rises, Ra rises too. Ra values are the highest for corundum blasting and lowest for steel grit blasting.
Measured values of the observed parameters in blasting with various blasting abrasives were compared using Kruskal–Wallis test and subsequently by the multiple comparison method, post hoc analysis,
Table 10. The Kruskal–Wallis test is a nonparametric test, and is used when the assumptions of one-way ANOVA are not met. Both the Kruskal–Wallis test assess for significant differences on a continuous dependent variable by a categorical independent variable (with two or more groups). At the significance level of 0.05, zero hypothesis of the mean values conformity is rejected, i.e., the type of blasting abrasives influences the value of monitored parameters. Statistically significant differences detected by post hoc analysis are indicated in the
Table 10. Statistically significant differences are not found in standardized Rz and Rt parameters for steel grit blasting and demetalized steelmaking slag blasting and for the non-standardized Rlo parameters for steel grit and corundum blasting (use of bold in the
Table 10).


