Abstract
Bolted connections are widely used in various mechanical structures due to their superior fastening properties. However, vibration and fatigue loads in the structure are likely to cause fatigue failure of the bolted joints, especially those under high temperature, such as in aero-engines. This paper mainly studies the low-cycle fatigue life of the pre-tightened bolts working at a high temperature. A novel test fixture is designed for fatigue tests, and low cycle fatigue tests of pre-tightened bolts are conducted at the temperatures of 550 °C and 650 °C, respectively. Furthermore, a new low cycle fatigue model that is based on the Von Mises equivalent stress/strain criterion is proposed. Meanwhile, the proposed model is used to predict the high-temperature low cycle fatigue life of pre-tightened bolts according to the stress/strain results obtained by finite element analysis. There is good agreement between the experimental results and those obtained by theoretical prediction, which validates the accuracy of the proposed fatigue model. Research results will provide a theoretical basis for the low cycle fatigue life prediction of pre-tightened bolts.
1. Introduction
Bolt-nut connections, as one of the most important and basic fastening elements, are widely used in common and special mechanical structures. Many bolts must work at a high temperature for a long time, especially those mounted in aircraft gas turbine engine. Pre-tightened bolts play an important role in the security and reliability of the whole structural system, as the failure of the bolts (e.g., fracture, looseness, etc.) may cause a catastrophic accident [1,2]. Furthermore, most of the failures that are encountered in practice are caused by fatigue of material. It is, therefore, important to search for a proper method to predict the fatigue life of the pre-tightened bolts accurately.
Recently, many researchers have studied the problems of low cycle fatigue for bolt fracture through a large number of experimental and theoretical methods. The main contents include analysis of the serious stress concentration at the root of threads [3], elasto-plastic stress and strain distributions within bolt-nut connections [3,4,5,6], and fatigue life estimation of the bolt [7,8,9]. Ifergane et al. [10] studied the effect of the varied manufacturing process and sequence of thread on the fatigue properties of aeronautical bolts. The results that were obtained by mechanical testing, metallographic inspection, and microhardness testing showed that the fatigue properties of the bolt are significantly influenced by the manufacturing process. The effect of pitch on the fatigue strength of two well-known standards, ISO steel bolts and American Unified bolts, which were fitted with standard nuts was analyzed by Dragoni [11] and Majzoobi [12], respectively. Honarmandi et al. [4] developed an elasto-plastic fatigue code based on strain-life or crack initiation theory. Stress and strain distributions at the thread roots were calculated through the finite element method (FEM) and were used to predict the total fatigue life of the bolt with the proposed fatigue code. The effect of geometric parameters on the fatigue life of bolt-nut fasteners was investigated. Fukuoka et al. [13] established the accurate numerical models of threaded connections including precise helical thread geometry, and the three dimensional finite element models were used to analyze the stress amplitude distributions along the thread helix. Analysis results showed that the maximum stress amplitude is located at the root of the first thread. Furthermore, the location of fatigue failure is closely related to the maximum stress amplitude, which provides a theoretical basis and fundamental data to reveal the fatigue failure mechanism of threaded connections. Schneider et al. [7] developed a fatigue assessment method for bolt-nut components based on the local strain approach. Elastic-plastic stress and strain distributions were computed by the finite element method through two dimensional models, and the results were used to predict the fatigue life of general threaded connections. The good agreement between the prediction life and experimental results verified the accuracy of the proposed method and proved that it can be successfully applied in the life prediction of threaded connections for engineering purposes. Akyildiz and Livatyali [14] investigated the effects of machining parameters, such as cutting force, thread cutting method, tool wear, and radial feed on the fatigue strength of threaded specimens through fatigue tests. Research results showed that there is a large variation of the endurance limits of the threaded specimens, which depends mostly on machining conditions. The cutting velocity and tool wear have a much greater influence on fatigue strength than radial feed and the cutting method. An experimental method that aims to investigate the fatigue behavior of threaded connections under the action of cyclic tensile loading was proposed by Korin and Ipina [15]. Fatigue tests were performed on M12 × 1.75 (The nominal diameter is 10 mm and the pitch is 1.75 mm) threaded rods with the proposed experimental procedure to research the stages of crack initiation and growth, and the results illustrated the suitability of the proposed method. Ferjani et al. [16] proposed a fatigue life prediction method for threaded connections that was based on both mechanical analysis and fatigue analysis using the Dang Van criterion. Fatigue tests of drill string connections that used in the oil and gas industry were carried out on small scale threaded connections to verify the accuracy of the proposed method. Furukawa et al. [17] clarified the relationship between the fatigue strength and the local stress that was located around the thread roots, considering the influence of residual stress induced by pre-tightening. From the fatigue tests of the threaded connections, it was found that the preloaded specimens have higher fatigue strength than those not preloaded, which revealed that the compressive residual stress contributes to the improvement of the fatigue strength. Coating material is also a major factor affecting the fatigue strength of bolts. In view of this, Ince et al. [18] investigated the effect of different kinds of coating on the fatigue behaviors of bolts through fatigue tests. Furthermore, the initiation of cracks that were observed in experiments started from the root of the bolt threads.
According to the current research of the fatigue life for threaded connections, it can be seen that many researchers have studied the fatigue behaviors of bolts through various theoretical and experimental methods. However, few literatures were dedicated to studying the low cycle fatigue of the pre-tightened bolts working at a high temperature. Motivated by this aspect, this paper will study the fatigue failure and life prediction of pre-tightened bolts at a high temperature. A novel low cycle fatigue model is proposed based on the Von Mises equivalent stress/strain criterion to predict the fatigue life. A novel test fixture is designed and the fatigue tests of the pre-tightened bolt under the action of axial cyclic tension at the high temperature of 550 °C and 650 °C will be conducted. The fatigue life of the pre-tightened bolt under each condition is predicted by the proposed model. Predicted results of fatigue life are compared with the experimental data, and good agreement between the two results validates the accuracy of the proposed model. Research results will provide a theoretical basis for the low cycle fatigue life prediction of pre-tightened bolts.
2. Low Cycle Fatigue Model
2.1. Manson-Coffin Equation
The Manson-Coffin equation is one of the classic models to predict the low cycle fatigue life of mechanical structures. It has realized a breakthrough in the aspect of low cycle fatigue life from qualitative analysis to quantitative calculation, and laid a foundation for the development of the predicting technology for low cycle fatigue life. The Manson-Coffin equation is written as [19,20]:
where is total strain range, and are the elastic and plastic strain ranges, respectively. is the uniaxial fatigue strength coefficient, is the uniaxial fatigue ductility coefficient, is the uniaxial fatigue strength exponent, is the uniaxial fatigue ductility exponent, is the fatigue life, and is Young’s modulus.
2.2. Fatigue Models Based on the Manson-Coffin Equation
With the development of the prediction technology for multi-axial fatigue life, fatigue failure criteria have gradually become the focus of attention. Researchers developed several fatigue models according to different failure criteria on the basis of the Manson-Coffin equation. In these models, the strain parameter of varies with the failure criteria.
2.2.1. Maximum Principal Stress/Strain Criterion
This criterion considers that the fatigue failure is mainly caused by maximum principal stress (strain) even though the structures are loaded by a multidirectional loading device and are in a multi-axial stress state. The failure is almost nothing to do with other factors. The related parameters can be expressed as:
where and are equivalent stress and strain, and are maximum principal stress and strain, respectively.
The initiation and propagation of fatigue crack are all dominated by maximum principal strain, which is the primary damage parameter that is used to estimate the fatigue failure of materials. The multi-axial fatigue model that is based on maximum principal strain criterion can be expressed as:
where is the maximum principal strain range.
2.2.2. Von Mises Equivalent Stress/Strain Criterion
This criterion holds an opinion that the fatigue failure is mainly controlled by equivalent stress and strain as shown below:
where and are Von Mises equivalent stress and strain, , , and are three principal stresses, , , and are three principal strains, and , .
The fatigue model based on Von Mises equivalent stress/strain criterion is written as:
where is Von Mises equivalent strain range.
Based on the fourth strength theory, Zhao [21] discussed the influence of the elastic and plastic Poisson ratio on the fatigue life, and the model showed in Equation (6) is revised as follows:
where is the elastic Poisson ratio, is the plastic Poisson ratio, and , for GH4169 [22].
2.2.3. Maximum Shear Stress/Strain Criterion
The maximum shear stress/strain criterion has a viewpoint that the damage process is mainly controlled by maximum shear strain as shown below:
where and are maximum shear stress and strain, respectively.
The fatigue model that is based on the maximum shear stress/strain criterion is expressed as:
2.3. The Proposed Low Cycle Fatigue Model
For threaded connections, the average stress in the thread portion is much higher than that distributed in other areas of the bolt because of the stress concentration at the root of the threads [23]. The emphasis of current research should be put on the stress and strain analysis of the thread portion. The stress of the thread portion is in a multi-axial stress state and the stress distribution is very complicated, therefore, multi-axial fatigue models should be considered to predict the low fatigue life of threaded connections.
Morrow proposed a strain-life equation considering the effect of mean stress σm to investigate the fatigue life of friction stir spot welds [24], and the equation was expressed in Equation (10). Socie proposed the following Equation (11) to predict the fatigue life of materials, which is used for the tensile cracking mode [25].
where is mean stress, is the maximum principal stress, and is the maximum principal strain range, respectively.
In this work, we proposed a new low cycle fatigue life model based on Von Mises equivalent stress/strain criterion, which combines Equations (10) and (11) to modify the Socie model (Equation (11)), considering the influence of mean stress. The proposed model is expressed as follow:
where is the maximum Von Mises equivalent stress, is the maximum principal strain range.
3. Fatigue Test
A novel test fixture is designed for fatigue test (patent: CN grant no. ZL2016101529187), and low cycle fatigue tests (Northwestern Polytechnical University, Xi’an, China) of pre-tightened bolt are conducted under the temperature of 550 °C and 650 °C, respectively. The thread specification of all the bolts and nuts used in this paper is M8 × 1 (The nominal diameter is 8 mm and the pitch is 1 mm).
3.1. Test Fixture
The fixture device consists of inner parts and outer parts, connected by threads, and its specification is M48 × 5 (The nominal diameter is 48 mm and the pitch is 5 mm). The material of all of the parts in the test fixture device is GH4169, which is the same material as the bolt. The inner parts are clamped by the test bolt and nut, and the outer parts are connected to the fatigue machine by cylindrical pins. The assembly diagram of the fixture device is shown in Figure 1, and two bolt holes with a diameter of 8.5 mm are opened in each inner part, respectively. On the other hand, in order to ensure the efficient heat diffusion between the high-temperature furnace of fatigue machine and interior space of the fixture device, two small holes were made in each inner part, which can be seen in Figure 1.
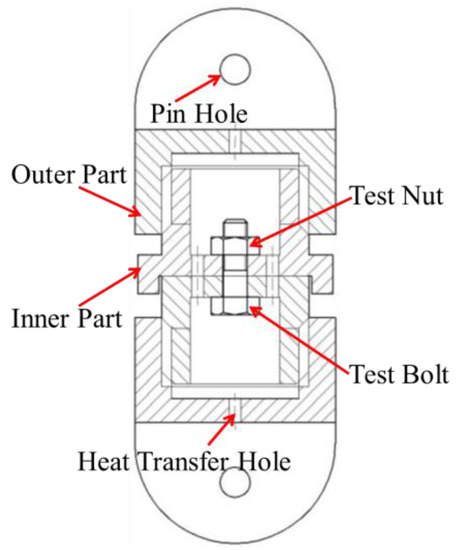
Figure 1.
Schematic diagram of the installation of the fixture device.
3.2. Preload
In engineering applications, the torque-only control method is usually used to control the preload during the tightening process of threaded connections. Furthermore, the bolt is usually pre-tightened to 70% of the tensile strength, which can be calculated by a simple equation , where is the ultimate strength of the bolt material and is the cross-sectional area of the bolt body.
The material of the test bolt that is used in this paper is nickel-based superalloys GH4169, which has excellent comprehensive performance, such as good radiation resistance, oxidation resistance, corrosion resistance, and admirable processing performance. The primary mechanical properties of GH4169 at different temperatures are listed in Table 1 [26]. In Table 1, T represents temperature, E is Young’s modulus, σp0.2 is yield strength, σb is ultimate strength, δs is percent elongation, and Ψ is the percent reduction in area.

Table 1.
Mechanical property of GH4169 alloy at different temperatures.
In the process of pre-tightening, the relationship between torque and preload is expressed by , where is input torque, is achieved preload, is the nominal diameter of the thread, and is the torque coefficient [27]. The torque coefficient is dependent on the friction coefficients and thread geometry parameters including the nominal diameter of the bolt, friction angle, helix angle, etc. As the thread geometric parameters have been determined for the test bolts, the friction coefficient becomes the dominant factor affecting the nut factor. In order to obtain the value of , a new measuring device is designed to measure the initial preload that is achieved in the bolt during the pre-tightening process as shown in Figure 2 [28]. The measuring device consists of the electric torque wrench, tightening sleeve, outer frame, measuring screw, connecting sleeve, strain gauges, large hexagonal nut, lock screw, test bolt, and nut. Except for the wrench, tightening sleeve, and lock screw, the other parts are made of nickel-based superalloys GH4169. In this device, four strain gauges are pasted evenly on the circular surface at the middle of the measuring sleeve. The stress distribution in the middle cross-sectional area of the measuring sleeve is uniform, and the tension (it is equal to the initial preload that is achieved in the bolt) can be calculated through axial strain that is measured by strain gauges. That is , where is young’s modulus, is the average value of four strains that are measured at the middle of the measuring sleeve, and is the cross-section area.
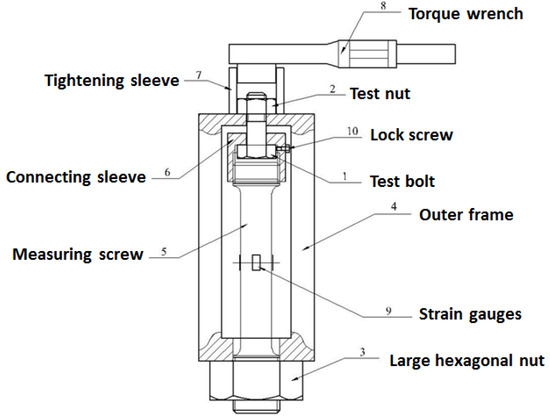
Figure 2.
Schematic diagram of the measuring device.
Three test bolts are used to conduct the pre-tightening experiments (Shaanxi Dongfang Aviation Instrument Co., Ltd., Hanzhong, China) in this paper. In the pre-tightening process, the bolt is stretched and the axial preload of the bolt is equal to the tension of the measuring screw (), and the torque that is applied can be obtained directly by the electric torque wrench. As a result, the relationship curves of torque versus initial preload achieved are plotted in Figure 3.
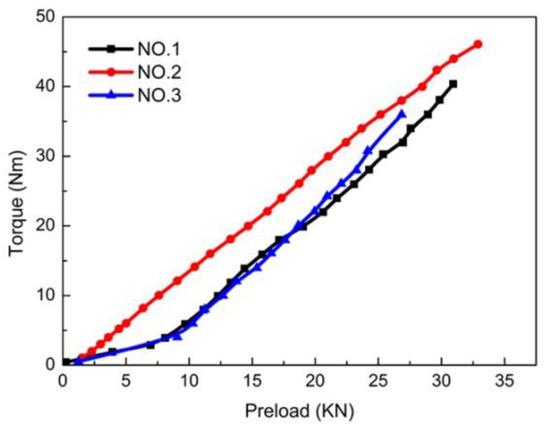
Figure 3.
Experimental torque-preload curves of three bolts (M8 × 1, GH4169).
The nuts used in this paper are lock nut, and there is a prevailing torque existing in the lock nut. Further, the value of the prevailing torque is 12.5 Nm, which is measured by the digital wrench. The value of the torque coefficient of the bolts that were used in the fatigue test was 0.183, which was obtained by fitting relation curves between the torque and preload. The bolt should be pre-tightened before the fatigue test. The torque-only control method was used to apply preload to the test bolt through torque wrench, and the target value of preload was 30 kN according to the above analysis. The pre-tightening process is shown in Figure 4, and corresponding parameters are listed in Table 2.
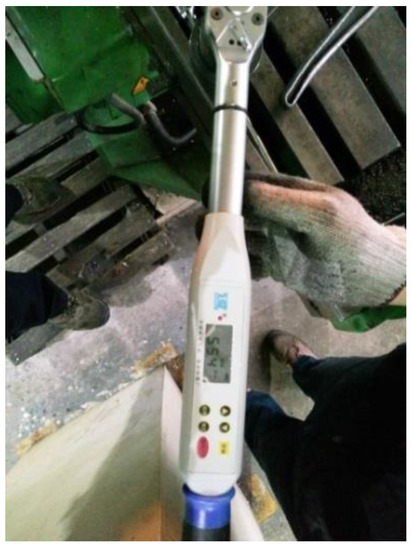
Figure 4.
The pre-tightening process of the bolted connections.
Table 2.
Several parameters related to the pre-tightening process.
3.3. Fatigue Load
After the installation of the test fixture with the test bolt and nut, the whole device was connected to the fatigue machine (Shimadzu Corporation, Kyoto, Japan) by cylindrical pins, as shown in Figure 5.
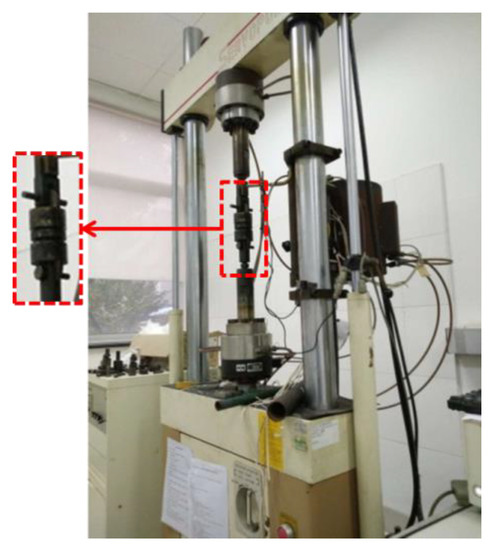
Figure 5.
The installation of the fixture device for the fatigue test.
Fatigue tests of the pre-tightened bolt were conducted under the temperatures of 550 °C and 650 °C. In order to monitor the temperature during the test, three thermocouples were tied at the upper, middle, and lower location of the fixture device. The tests were conducted under the action of uniaxial tension-tension loads in triangular wave form with the frequency of 1 Hz. The maximum tensile load was 30 kN and the minimum tension was 0.5 kN. The specific parameters of the cyclic loads are listed in Table 3.
Table 3.
Loading parameters of the fatigue test.
3.4. Test Results
The fatigue life of the pre-tightened bolt (M8 × 1) was obtained by fatigue tests, and the experimental results of each condition are shown in Table 4. The test data show a certain degree of dispersion for each condition.
Table 4.
Experimental results of the fatigue life of the pre-tightened bolt (M8 × 1).
From the fractography evidences of the fatigue test result analysis, it is clear that the failure mode of the pre-tightened bolt is fatigue fracture. Among the broken bolts, all of the fractures occured at the first engaged thread of the bolt-nut interface. The failure specimens are shown in Figure 6.
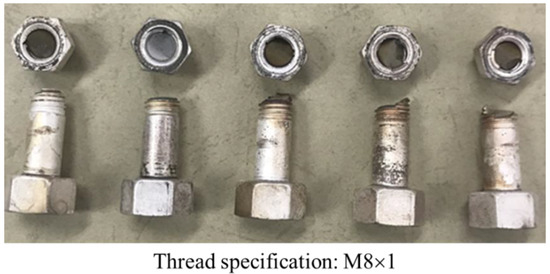
Figure 6.
Failure specimens after the fatigue test.
4. Fatigue Life Prediction
In this section, the stress and strain state of the threaded connections under the action of cyclic load, which is consistent with experimental conditions, are analyzed by the finite element method. The proposed model was applied to predict the fatigue life of the pre-tightened bolt at the temperatures of 550 °C and 650 °C, and the predicted results were compared with the test results.
4.1. Finite Element Model
The finite element model of the threaded connections consists of test bolt, nut, and the inner parts of the fixture. The structure has axisymmetric features when the helix angle of the thread is not considered. Therefore, only half of the model is established as shown in Figure 7 in order to save computing time. On the other hand, the outer parts and the threads of the inner parts are ignored, which will improve the computational efficiency and will have no effect on calculation results.
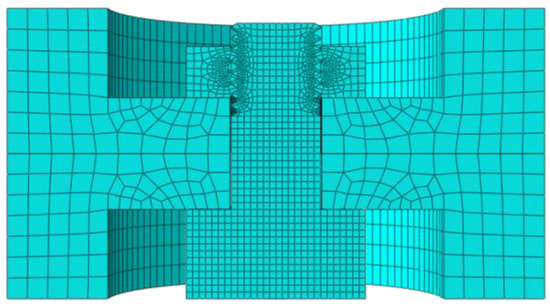
Figure 7.
Finite element model of threaded connections and mesh.
Finite element models for all of the parts are meshed using 8-node linear brick, reduced integration with hourglass control elements (C3D8R). In order to improve the accuracy of the calculation, the threads are meshed with finer elements, especially in the portion of the thread’s root, whereas other regions and joints are meshed with coarse elements as shown in Figure 7. There are 25,670 elements and 21,376 nodes in the whole finite element model.
4.2. Material Properties
The stress at the root of the threads (especially at the first engaged thread root) will exceed the yield limit of the material because of the serious stress concentration. Therefore, elastic-plastic behavior should be considered when analyzing the stress and strain distributions of the structure. The stress-strain curves of GH4169 at the temperature of 550 °C, 650 °C, and room temperature are shown in Figure 8.
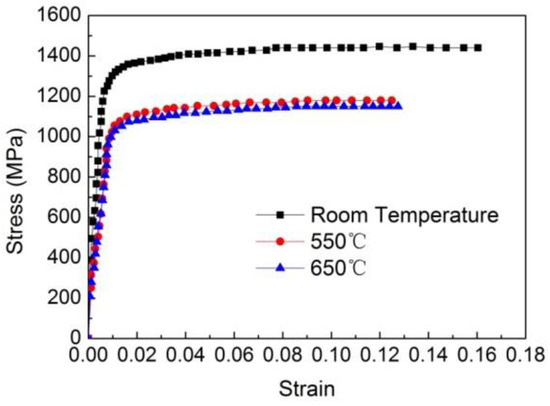
Figure 8.
Stress-strain curves of GH4169 at different temperatures.
In this paper, the thermal expansion property of GH4169 under high temperature is considered when analyzing the thermal stress that is caused by temperature variation. The thermal expansion coefficients of GH4169 at different temperature ranges are shown in Table 5. On the other hand, the uniaxial fatigue constants of the GH4169 material at the temperature of 550 °C and 650 °C are shown in Table 6.
Table 5.
Thermal expansion coefficients of GH4169 at different temperatures.
Table 6.
Uniaxial fatigue property of GH4169 at different temperatures.
4.3. Results and Discussion
According to the fatigue test conditions described above, the target preload of 30KN is applied at the first step to pre-tighten the threaded connections. The distributions of the stress and strain of the structure after being pre-tightened are obtained through finite element analysis, and the stress and strain distribution contours are shown in Figure 9 and Figure 10, respectively.
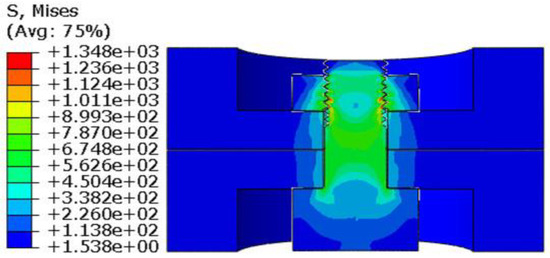
Figure 9.
Stress contours of the threaded connections after being pre-tightened.
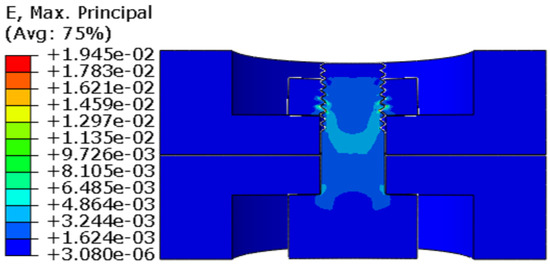
Figure 10.
Strain contours of the threaded connections after being pre-tightened.
It can be seen from Figure 9 and Figure 10 that both the maximum Von Mises stress and the maximum principal strain are located at the root of the first engaged thread between the bolt and nut. The maximum Von Mises stress is 1348 MPa, and the maximum principal strain is 1.945 × 10⁻². Therefore, the emphasis should be placed on the analysis of the stress and strain state of the thread portion.
The whole test fixture will deform because of thermal expansion as the temperature increases. When the temperature rose to 550 °C or 650 °C, the maximum Von Mises stress and maximum principal strain distribution contours are shown in Figure 11 and Figure 12. As shown in Figure 11 and Figure 12, both the maximum Von Mises stress and maximum principal strain are also at the root of the first engaged thread. The maximum Von Mises stress and maximum principal strain is 1034 MPa and 2.961 × 10⁻² at 550 °C, and the maximum Von Mises stress and maximum principal strain is 1031 MPa and 2.944 × 10⁻², respectively, when the temperature increases to 650 °C. The values of maximum Von Mises stress and maximum principal strain are almost equal at 550 °C and 650 °C, respectively. The reason is that the thermal expansion and temperature dependence of elastic coefficients are small, even though the ductility parameters (Table 6) are very different.
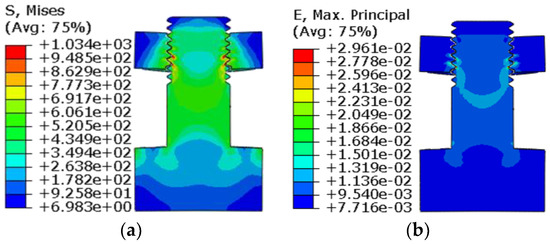
Figure 11.
Von Mises equivalent stress and maximum principal strain contours of the bolt and nut at 550 °C: (a) Von Mises equivalent stress; (b) maximum principal strain.
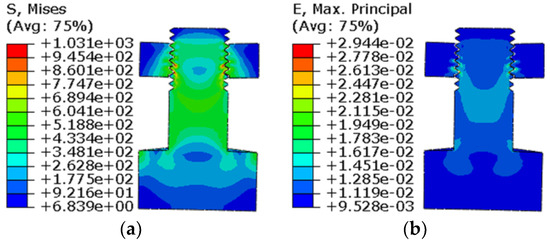
Figure 12.
Von Mises equivalent stress and maximum principal strain contours of the bolt and nut at 650 °C: (a) Von Mises equivalent stress; (b) maximum principal strain.
According to the fatigue test conditions shown in Table 4, the stress and strain states of the pre-tightened bolt under the action of cyclic load for four conditions (shown in Table 7) are analyzed by the finite element method.
Table 7.
Cyclic load conditions for the fatigue tests of the pre-tightened bolt.
For condition 1, the maximum Von Mises stress and the maximum principal strain distribution contours of the pre-tightened bolt under the action of peak tension of 30 kN are shown in Figure 13. The maximum Von Mises stress and maximum principal strain is 1038 MPa and 3.372 × 10⁻², respectively. On the other hand, the most dangerous point is also located at the root of the first engaged thread.
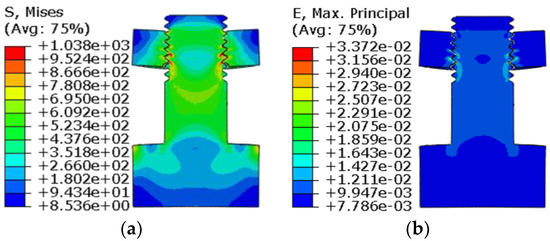
Figure 13.
Von Mises equivalent stress and the maximum principal strain contours of the bolt and nut under the action of the maximum tension for condition 1: (a) Von Mises equivalent stress; (b) maximum principal strain.
During a cycle of the tension increases from 0.5 kN to its maximum for all conditions, the maximum values of Von Mises stress and maximum principal strain of the most dangerous point are obtained by finite element analysis and are shown in Table 8.
Table 8.
Stress and strain results of the dangerous point for all conditions.
Results of the fatigue life of the pre-tightened bolt for each condition are calculated using the proposed fatigue life model, Morrow model (Equation (10)) and Socie model (Equation (11)) according to stress and strain results that were obtained by finite element analysis. The comparison of fatigue life between the predicted results that were calculated by three models and test results is shown in Table 9 and Figure 14.
Table 9.
Comparison of predicted life and experimental life for all conditions.
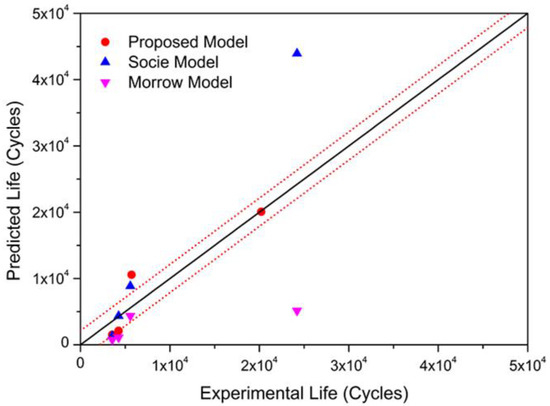
Figure 14.
Comparison of predicted life and experimental life.
It can be seen from Figure 14 that life prediction with the proposed fatigue model agrees better with the experimental results for all of the conditions, and the prediction errors are basically within a factor of 2.5. On the other hand, the fatigue life predicted through the Morrow model and Socie model is far away from the test data for condition 1, although it can get relatively accurate results for other conditions.
5. Conclusions
In this paper, a new fatigue model is proposed to predict the high temperature low cycle fatigue life of pre-tightened bolt and the accuracy of the proposed model is validated by fatigue tests. From the research results discussed above, the following conclusions can be derived:
(1) The fatigue failure mode of the threaded connections is the fatigue fracture of the bolt, and all fractures occur at the first engaged thread of the bolt-nut interface.
(2) The maximum stress and strain are located at the root of the first engaged thread and therefore, the portion of the first engaged thread is the most dangerous part to damage.
(3) The results of the analysis show that the proposed model can be used to predict the fatigue life of pre-tightened bolts with high precision. The predicted life is in good agreement with the experimental results.
Author Contributions
Q.Y. and H.Z. prepared the manuscript. H.Z. and X.Y. (Xiangjin Yang) collected the data. Q.Y., H.Z., and X.Y. (Xudong Yu) designed the scope of the paper. All of the authors discussed the conclusions and reviewed the manuscript.
Funding
This research was founded by the National Natural Science Foundation of China (Grant No.11872308) and the Fundamental Research Funds for the Central Universities (Grant No. 3102017JC01003, 3102017JC11001).
Acknowledgments
The work was supported by a grant from the National Natural Science Foundation of China under the research project No. 11872308.
Conflicts of Interest
The authors declare no conflict of interest. The funders had no role in the design of the study; in the collection, analyses, or interpretation of the data; in the writing of the manuscript, or in the decision to publish the results.
References
- Yu, Q.M.; Zhou, H.L. Finite element study on pre-tightening process of threaded connection and failure analysis for pressure vessel. Procedia Eng. 2015, 130, 1385–1396. [Google Scholar] [CrossRef]
- Yu, Q.M.; Zhou, H.L. Study on creep damage and life prediction of threaded connections at high temperature. Adv. Mech. Eng. 2016, 8. [Google Scholar] [CrossRef]
- Zhao, H. Stress concentration factors within bolt-nut connectors under elasto-plastic deformation. Int. J. Fatigue 1998, 20, 651–659. [Google Scholar] [CrossRef]
- Honarmandi, P.; Zu, J.W.; Behdinan, K. Elasto-plastic fatigue life improvement of bolted joints and introducing FBI method. Mech. Based Des. Struct. 2005, 33, 311–330. [Google Scholar] [CrossRef]
- Chen, J.J.; Shih, Y.S. A study of the helical effect on the thread connection by three dimensional finite element analysis. Nucl. Eng. Des. 1999, 191, 109–116. [Google Scholar] [CrossRef]
- Chen, S.; Li, Q.; Zhang, Y.; An, Q. Finite element analysis of tooth load distribution on p-110s conic threaded connections. Int. J. Press. Vessels Pip. 2011, 88, 88–93. [Google Scholar] [CrossRef]
- Schneider, R.; Wuttke, U.; Berger, C. Fatigue analysis of threaded connections using the local strain approach. Procedia Eng. 2010, 2, 2357–2366. [Google Scholar] [CrossRef]
- Fares, Y.; Chaussumier, M.; Daidie, A.; Guillot, J. Determining the life cycle of bolts using a local approach and the dang van criterion. Fatigue Fract. Eng. Mater. 2006, 29, 588–596. [Google Scholar] [CrossRef]
- Kai, B.; Haydn, W.; Bacher-Hoechst, M.; Wuttke, U.; Berger, C. Finite-element-based methods for the fatigue design of bolts and bolted joints. Sae Int. J. Mater. Manuf. 2009, 2, 75–84. [Google Scholar]
- Ifergane, S.; Eliaz, N.; Stern, N.; Kogan, E.; Shemesh, G.; Sheinkopf, H.; Eliezer, D. The effect of manufacturing processes on the fatigue lifetime of aeronautical bolts. Eng. Failure Anal. 2001, 8, 227–235. [Google Scholar] [CrossRef]
- Dragoni, E. Effect of thread pitch on the fatigue strength of steel bolts. Proc. Inst. Mech. Eng. Part C 1997, 211, 591–600. [Google Scholar] [CrossRef]
- Majzoobi, G.H.; Farrahi, G.H.; Habibi, N. Experimental evaluation of the effect of thread pitch on fatigue life of bolts. Int. J. Fatigue 2005, 27, 189–196. [Google Scholar] [CrossRef]
- Fukuoka, T.; Nomura, M.; Fuchikami, T. Finite element analysis of the fatigue strength of threaded fasteners using helical thread models. In Proceedings of the ASME 2009 Pressure Vessels and Piping Conference, Prague, Czech Republic, 26–30 July 2009; Volume 3: Design and Analysis, pp. 909–915. [Google Scholar]
- Akyildiz, H.K.; Livatyali, H. Effects of machining parameters on fatigue behavior of machined threaded test specimens. Mater. Des. 2010, 31, 1015–1022. [Google Scholar] [CrossRef]
- Korin, I.; Ipiña, J.P. Experimental evaluation of fatigue life and fatigue crack growth in a tension bolt–nut threaded connection. Int. J. Fatigue 2011, 33, 166–175. [Google Scholar] [CrossRef]
- Ferjani, M.; Averbuch, D.; Constantinescu, A. A computational approach for the fatigue design of threaded connections. Int. J. Fatigue 2011, 33, 610–623. [Google Scholar] [CrossRef]
- Furukawa, A.; Kamiya, K.; Hagiwara, M. Effect of the residual stress on the fatigue strength of a bolt in bolt/nut assemblies. J. Adv. Mech. Syst. Manuf. 2012, 6, 189–197. [Google Scholar] [CrossRef]
- İnce, U.; Güler, B.; Kılınçdemir, E.; Guden, M. The Effect of Coating Type on Bolt Fatigue Life. In Proceedings of the International Iron & Steel Symposium, Karabük, Turkey, 1–3 April 2015. [Google Scholar]
- Manson, S.S. Fatigue: A complex subject—Some simple approximations. Exp. Mech. 1965, 5, 193–226. [Google Scholar] [CrossRef]
- Zhong, B.; Wang, Y.R.; Wei, D.S.; Wang, J.L. A new life prediction model for multiaxial fatigue under proportional and non-proportional loading paths. Int. J. Fatigue 2017. [Google Scholar] [CrossRef]
- Zhao, S. Strain-life curves in multiaxial fatigue. J. Mech. Strength 1999, 305–306. (In Chinese) [Google Scholar] [CrossRef]
- Wang, J.; Wang, H.; Wang, L.; Kang, Y.; Shang, D. Fatigue life prediction for gh4169 superalloy under multi-axial cyclic loading at 650 °C. J. Mech. Strength 2008, 324–328. (In Chinese) [Google Scholar] [CrossRef]
- Bickford, J.H. Introduction to the Design and Behavior of Bolted Joints: Non-Gasketed Joints; CRC Press: Boca Raton, FL, USA, 2007. [Google Scholar]
- Ahmadi, S.R.; Hassanifard, S.; Pour, M.M. Fatigue life prediction of friction stir spot welds based on cyclic strain range with hardness distribution and finite element analysis. Acta Mech. 2012, 223, 829–839. [Google Scholar] [CrossRef]
- You, B.R.; Lee, S.B. A critical review on multiaxial fatigue assessments of metals. Int. J. Fatigue 1996, 18, 235–244. [Google Scholar] [CrossRef]
- Chinese Aeronautic Material Handbook; Standards Press of China: Beijing, China, 2002; Volume 2. (In Chinese)
- Yu, Q.; Zhou, H.; Wang, L. Finite element analysis of relationship between tightening torque and initial load of bolted connections. Adv. Mech. Eng. 2015, 7. [Google Scholar] [CrossRef]
- Yu, Q.M.; Yang, X.J.; Zhou, H.L. An experimental study on the relationship between torque and preload of threaded connections. Adv. Mech. Eng. 2018, 10. [Google Scholar] [CrossRef]


© 2018 by the authors. Licensee MDPI, Basel, Switzerland. This article is an open access article distributed under the terms and conditions of the Creative Commons Attribution (CC BY) license (http://creativecommons.org/licenses/by/4.0/).