Abstract
In-situ metallic glass matrix composites (MGMCs) are a new kind of promising structural engineering material. In this study, a comprehensive study about the corrosion behavior of in-situ Ti46Zr20V12Cu5Be17 MGMCs versus their size was conducted. It is interesting to find that the large sample exhibits a more excellent corrosion resistance than the small sample in the 10% H2SO4 solution both in chemical and electrochemical tests at room temperature. Furthermore, the results obtained from X-ray photoelectron spectra (XPS) demonstrate that the quality of the passive film formed on the large-sized sample is indeed superior to the small-sized sample. Based on (scanning electron microscope) SEM observation, the possible mechanisms of the observed phenomenon have been discussed in the present study.
1. Introduction
Bulk metallic glasses (BMGs) have generated tremendous interest in scientific communities since their birth in 1977, mainly due to their superior mechanical and physical properties, such as good soft magnetization susceptibility, high strength, large elastic strain limit, and excellent corrosion resistance [1,2]. However, BMGs’ structural engineering application is impeded by their brittle fracture behavior at room temperature. It is found that almost all BMGs exhibit a fast propagation of localized shear bands, causing an inhomogeneous plastic deformation and hereafter a disastrous structural failure [3]. Some efforts, such as the introduction of secondary phases into the matrix of BMGs, have been made to improve the tensile ductility and toughness of BMGs [4]. Recently, an attractive scheme called dendrite-reinforced metallic glass matrix composites (MGMCs) has been developed, involving a series of materials known as in-situ MGMCs [5,6]. This scheme is considered a breakthrough because remarkable tensile plastic deformation at room-temperature has been observed in these MGMCs materials. Qiao et al. [7,8] have demonstrated that the enhancement of tensile ductility of MGMCs can be realized through the in-situ introduction of secondary crystalline phases, which can effectively hinder the devastating fracture spread in the amorphous matrix. Moreover, as a new material preparation scheme, in-situ MGMCs is distinguished with its simple casting and high glass-forming ability of matrices.
The superior corrosion resistance of BMGs in comparison to their crystalline counterparts can be attributed to the uniform structure down to the nanometer scale, i.e., the absence of segregation and grain boundaries [9]. Due to the presence of intermetallic compounds and grain boundaries, the crystalline materials, such as Al alloys, Mg alloys, rare-earth alloys and composites, etc., exhibit diverse corrosion resistance [10,11,12,13]. However, as potential structural engineering materials, the corrosion resistance of this kind of in-situ MGMCs has not been investigated to a reasonable extent. Only a few such studies have been reported for in-situ MGMCs so far. Debnath et al. [14,15] investigated the effect of the introduction of crystalline phases into the amorphous matrix on the corrosion behavior by comparing a Ti-based MGMCs to its crystalline counterpart. They found a moderately detrimental effect of the introduction of secondary phases, which was ascribed to the preferential dissolution by a galvanic effect between the matrix and the crystalline phases [14]. In another recent work, Debnath et al. further studied the formation of icosahedral quasicrystalline (QC) phases on the corrosion resistance of Ti-based MGMCs [15].
Lately, our group reported the fabrication of in-situ Ti-based MGMCs with a composition of Ti46Zr20V12Cu5Be17 containing a body-centered cubic (bcc) β-phase, exhibiting a tensile strength of 1510 MPa and a considerable large fracture strain of about 7.6% [16]. For the rod-shaped samples made by the suction-casting process, cooling rates could vary drastically along the radial direction, resulting in the different microstructure of the crystalline and amorphous phases. And our previous work suggests that certain elements dissolution preference is bound to occur owing to the phase inhomogeneous nature of these composites [17]. Therefore, it is of considerable interests to study how the corrosion behavior of these composites varying with their sizes. In this study, we choose the Ti46Zr20V12Cu5Be17 MGMCs with different diameters from Φ2 to Φ6 mm and conducted both the electrochemical and chemical corrosion tests on these samples. The electrochemical corrosion properties have been investigated by means of potentiodynamic, potentiostatic, and electrochemical impedance spectroscopy (EIS).
2. Materials and Methods
The samples of Ti-based MGMCs ingots with a nominal composition of Ti46Zr20V12Cu5Be17 were prepared by arc melting of high-purity metals in an argon atmosphere and cast into Φ2, Φ3, and Φ6 mm rods by copper-mold suction casting, respectively. The structure of these rods was examined by X-ray diffractometry (XRD) with monochromated Cu-Kα radiation (λ = 0.1542 nm). Further information about surface morphology and elements distribution of these materials were obtained by a Tescan LYRA 3 XMH scanning electron microscope (SEM; Tescan, Brno, Czech Republic) coupled with energy dispersive X-ray spectrometry (EDS). Before the measurement, the surface of the samples was polished with grit SiC paper up to 2500 grade and ultrasonically cleaned.
For electrochemical tests, the samples were electrically connected to an isolated copper wire and embedded in epoxy resin ensuring only the polished end surface was exposed. All electrochemical tests were carried out in the 10% H2SO4 solution using a three-electrode cell setup with a Hg/HgSO4 (K2SO4) reference electrode and platinum as the counter electrode. A CHI660E electrochemical measurement system (CH Instruments Inc., Shanghai, China) was employed to conduct all electrochemical measurements. Potentiodynamic polarization curves were attained with a potential sweep rate of 1 mV/s in the range of −1.0~1.5 V in the 10% H2SO4 aqueous solution. Before tests, the samples were immersed in the solution for about 1 h in order for the open-circuit potential to reach a steady state. The corrosion-current-density (icorr) values were acquired from the intersection of corresponding anodic and cathodic polarization curves (Tafel slope method). The electrochemical impedance spectroscopy (EIS) measurements were conducted in the frequency range from 10 kHz to 10 MHz. EIS results were calculated by the Z-view software (3.1, Scribner Associates Inc., Southern Pines, NC, USA). All the potential values mentioned in this study were all referred to Hg/HgSO4 (K2SO4), and each electrochemical measurement was tested at least four times for repeatability. Curves are presented by average of all measurement data. The chemical tests were conducted by seven days of immerse corrosion. The weight loss method was used to calculate the corrosion rate. Surface films of samples after the electrochemical test were analyzed by X-ray photoelectron spectroscopy (XPS) using an AXIS ULTRA DLD photoelectron spectrometer (Kratos Analytical Ltd., Manchester, UK) with Al-Ka (hѵ = 1486.6 eV) radiation. Binding energies were calibrated using carbon contamination with C 1s peak value of 284.6 eV. The core level spectra of Cu, Zr, Ti, V, O, and Be were determined. Deconvolution of the peaks was carried out using XPS peak 4.1 software (4.1, Raymund W.M. Kwok, Hong Kong, China) based on Newton’s iteration method. Quantitative information was calculated from the survey spectra using standard Scofield sensitivity factors [18]. The depth profile information of metal elements on the sample surface was tested by in-situ argon ions beam sputtering with an ion energy of 2 kV, at a sputtering rate of about 0.1 nm/s by adjusting the spot area. Overall sputtering time was 100 s.
3. Results
3.1. Structure Characterization
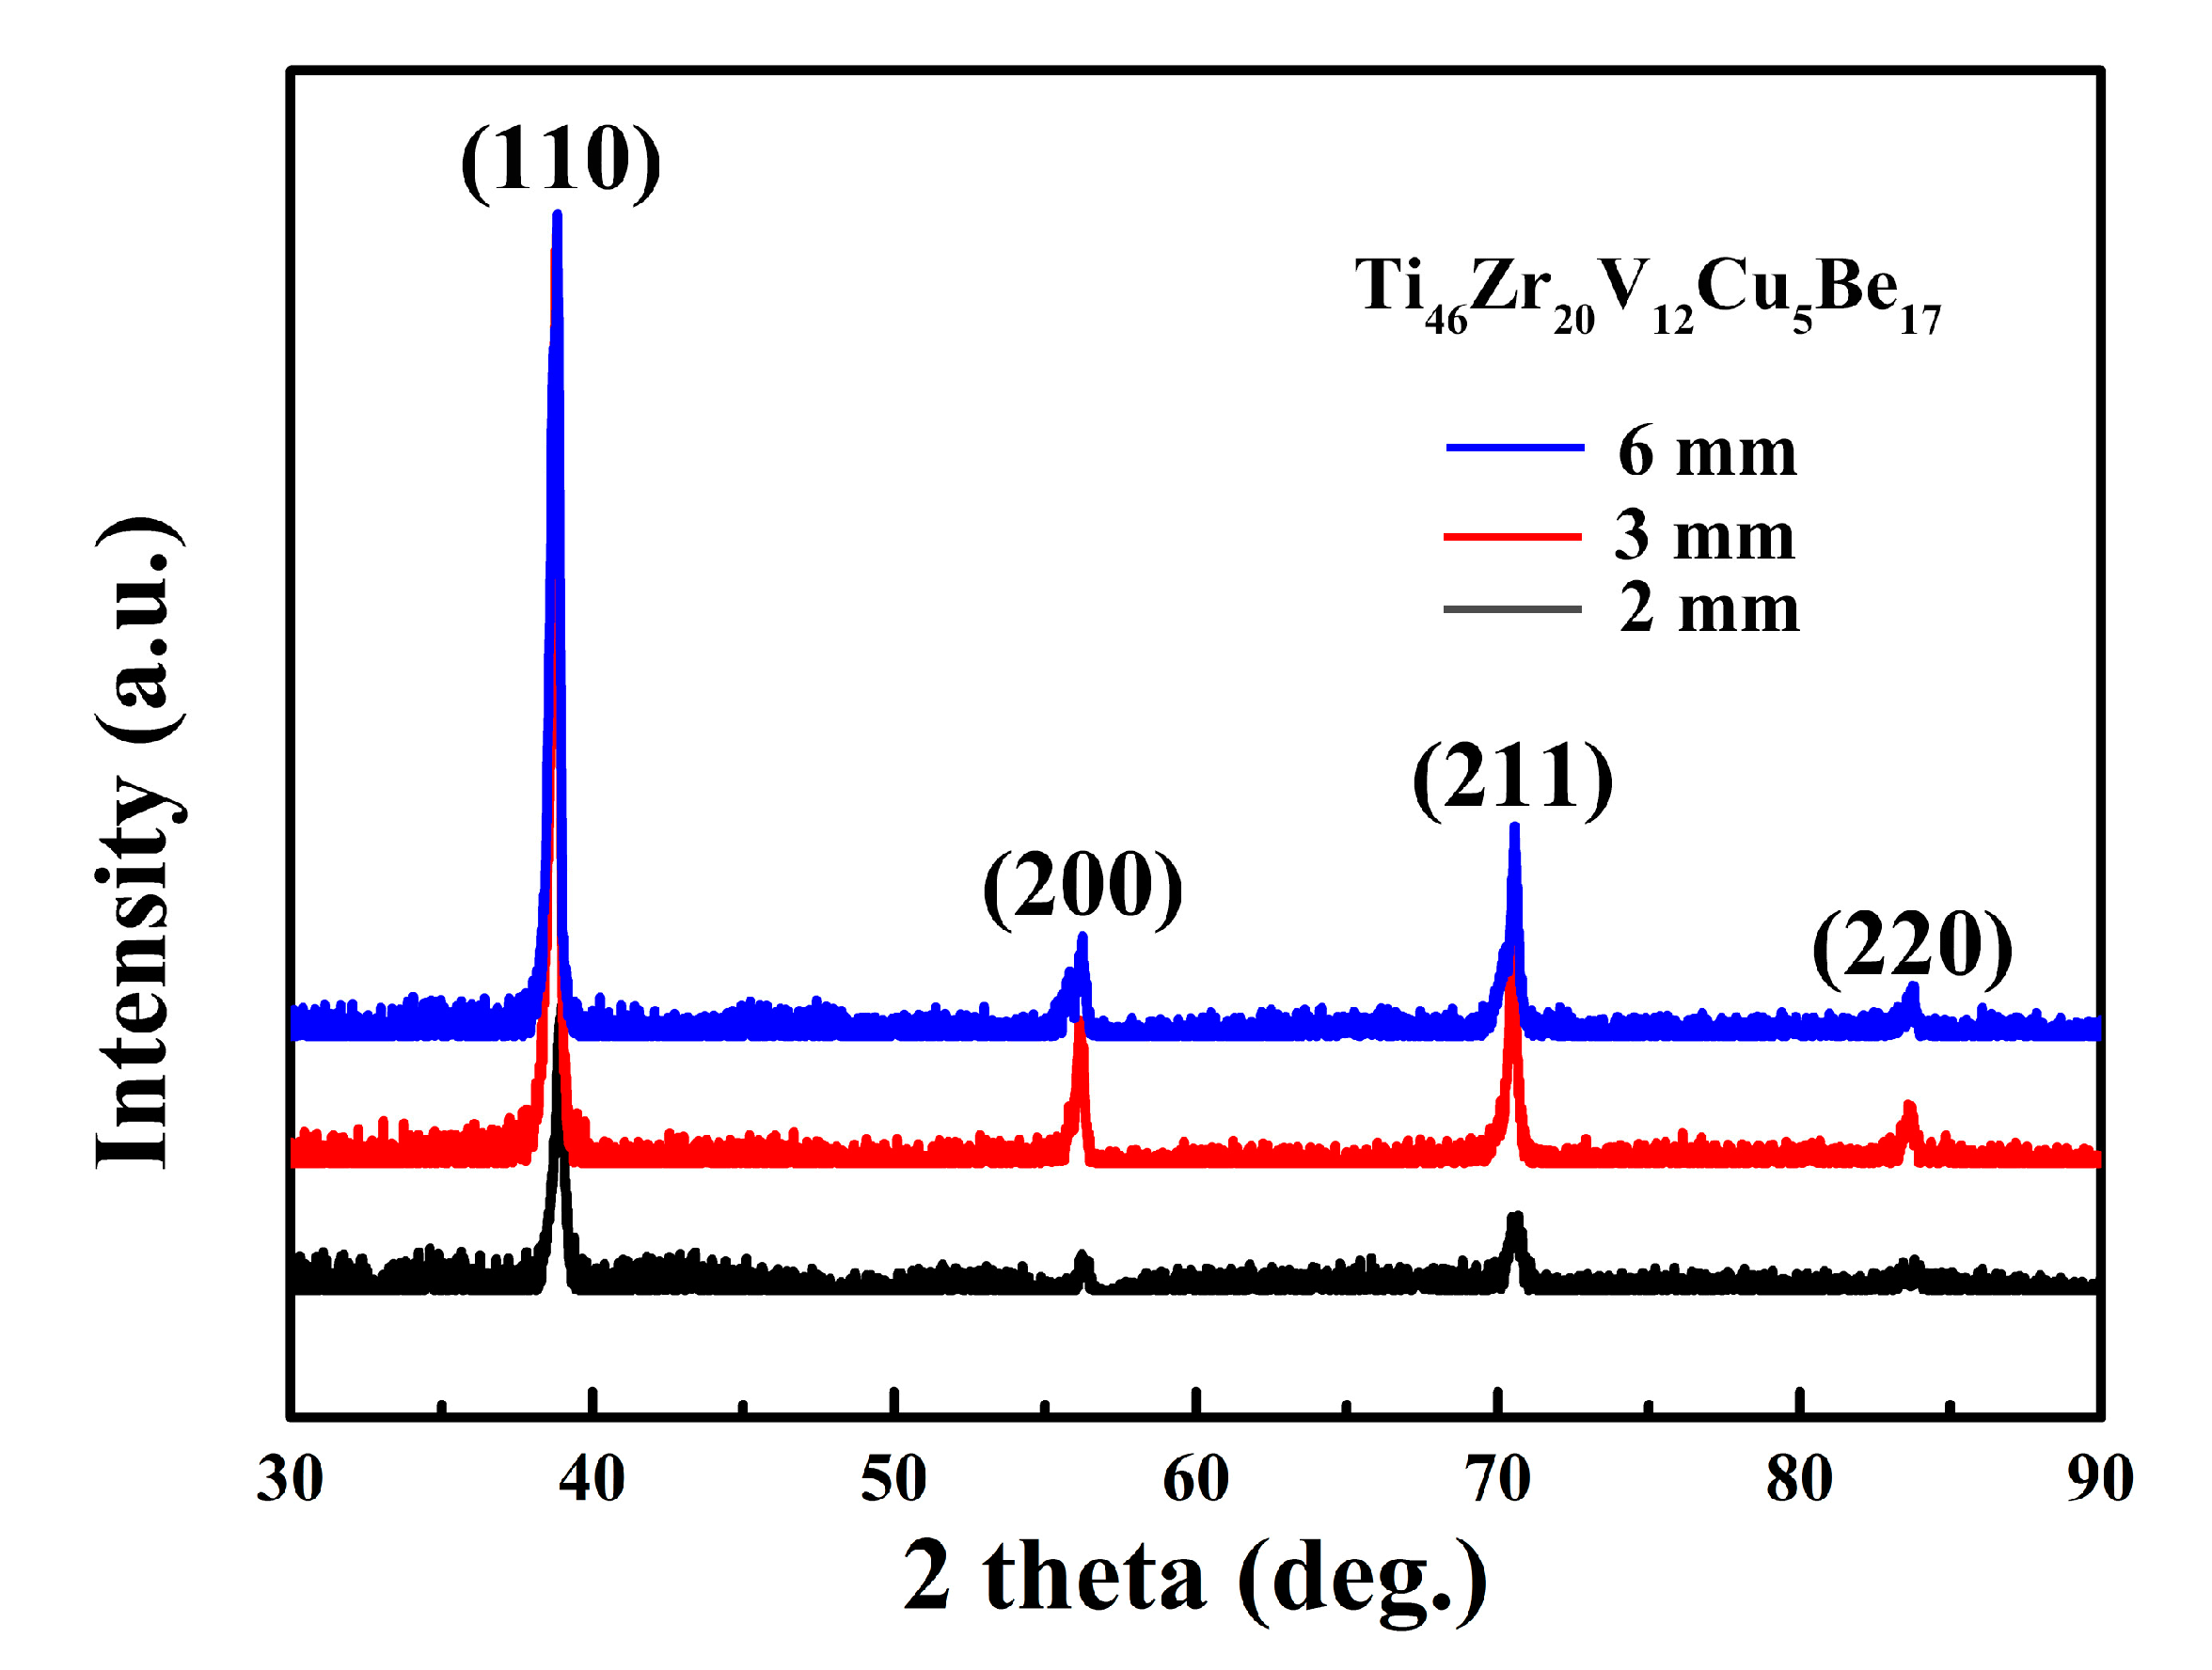
The structures of as-cast Ti46Zr20V12Cu5Be17 in-situ MGMCs rods were examined by XRD analysis. Figure 1 presents a typical XRD pattern obtained from these MGMCs. The sharp diffraction peaks of crystalline phases in XRD patterns clearly indicate the presence of the body-centered cubic (bcc) β-Ti solid solution. It is noted that there is the same structure in three samples, the glass matrix, and phase of bcc β-Ti. The amorphous matrix of these composites can be identified by the broad and diffuse patterns obtained by the synchrotron high-energy XRD studies, which was published elsewhere [16].

Figure 1.
X-ray diffractometry (XRD) patterns of as-cast Ti46Zr20V12Cu5Be17 composites with different diameters.
3.2. Electrochemical Corrosion Measurements
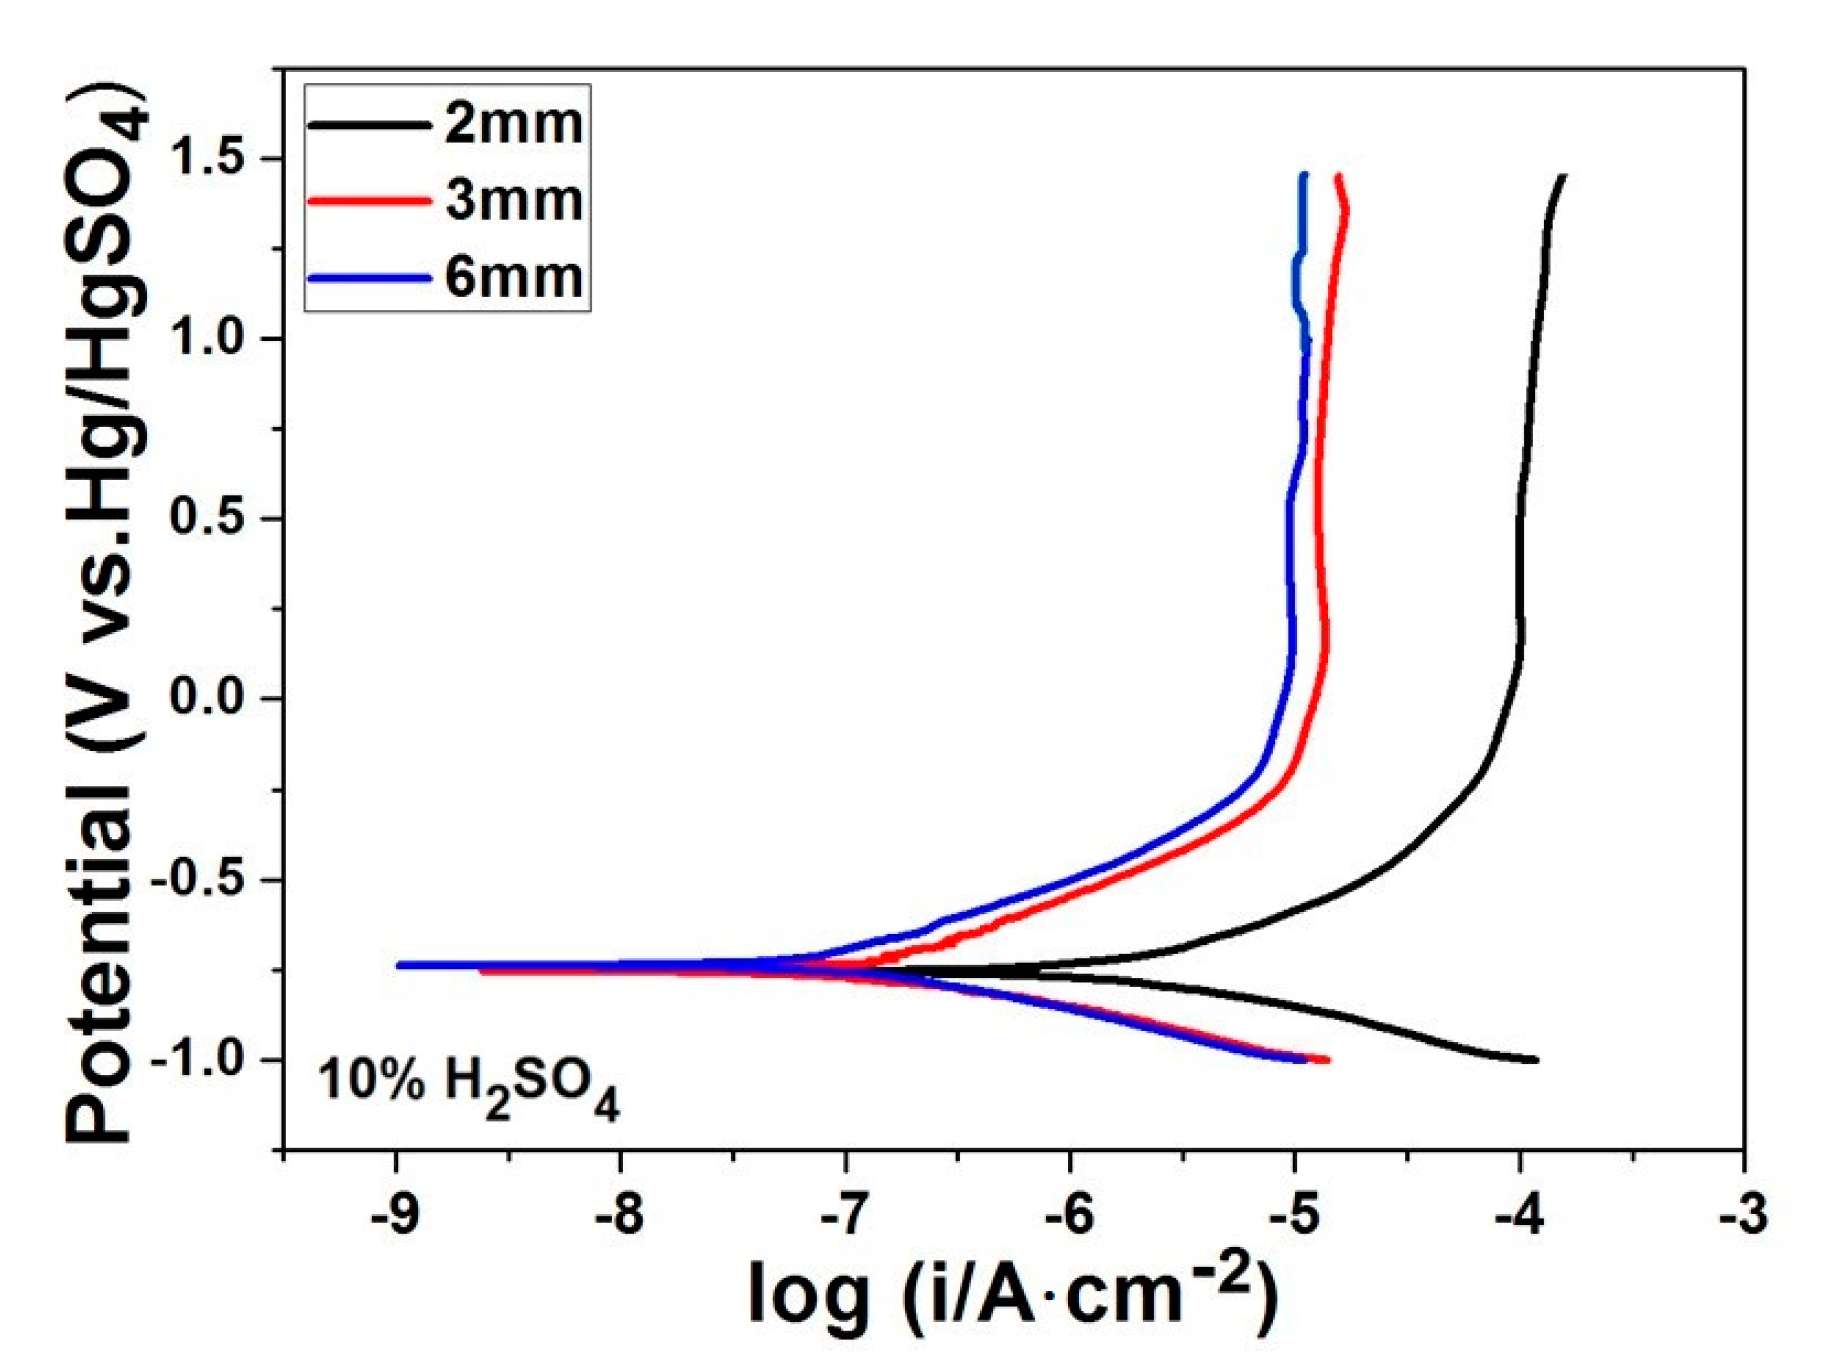
Figure 2 shows the potentiodynamic polarisation curves for in-situ Ti46Zr20V12Cu5Be17 MGMCs rods with diameters of Φ2, Φ3, and Φ6 mm attained in the 10% H2SO4 solution at room temperature. As can be seen from Figure 2, the corrosion behaviors of these Ti-based MGMCs with different sizes are similar to each other. The corresponding polarization curves are characterized with a low corrosion current density, icorr, low corrosion potential, Ecorr, and low passivation current density, ipass. In addition, it has a wide passivation region up to ~1.5 V. However, the difference of size does lead to the variation of the values of icorr, Ecorr, and ipass. Note that in the potential range of 0.25–1.5 V, the anodic current density is almost stable as the potential increase, indicating the formation of a highly protective passive film on the alloy surfaces.
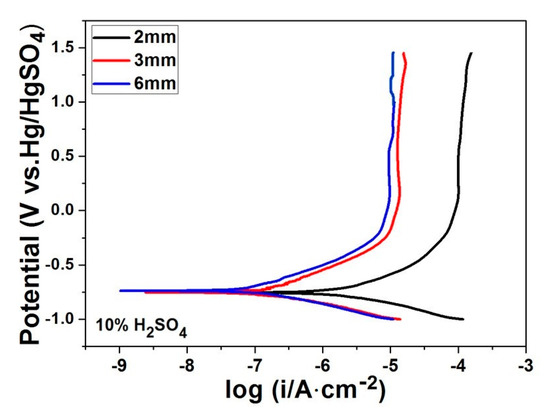
Figure 2.
The potentiodynamic polarisation curves for in-situ Ti46Zr20V12Cu5Be17 metallic glass matrix composites (MGMCs) with diameters of Φ2, Φ3, and Φ6 mm in the 10% H2SO4 solution at room temperature.
The corrosion current densities of all the samples are calculated by the Tafel extrapolation method, and the results are listed in Table 1. The values of icorr for Φ6 mm rod are the lowest with an order of magnitude at about 10−7 A/cm2, and the lowest passive current density in the order of 10−6 A/cm2, while Φ2 mm rod possess the highest correspond values, with icorr at about 10−6 A/cm2 and ipass at about 10−4 A/cm2. In addition, for Φ6 mm rod, the value of Ecorr is highest among all the samples, suggesting that Φ2 mm rod exhibits the highest dissolution trend and hence the lowest corrosion resistance.

Table 1.
Calculated corrosion parameters of all Ti46Zr20V12Cu5Be17 composites rods using the Tafel extrapolation method.
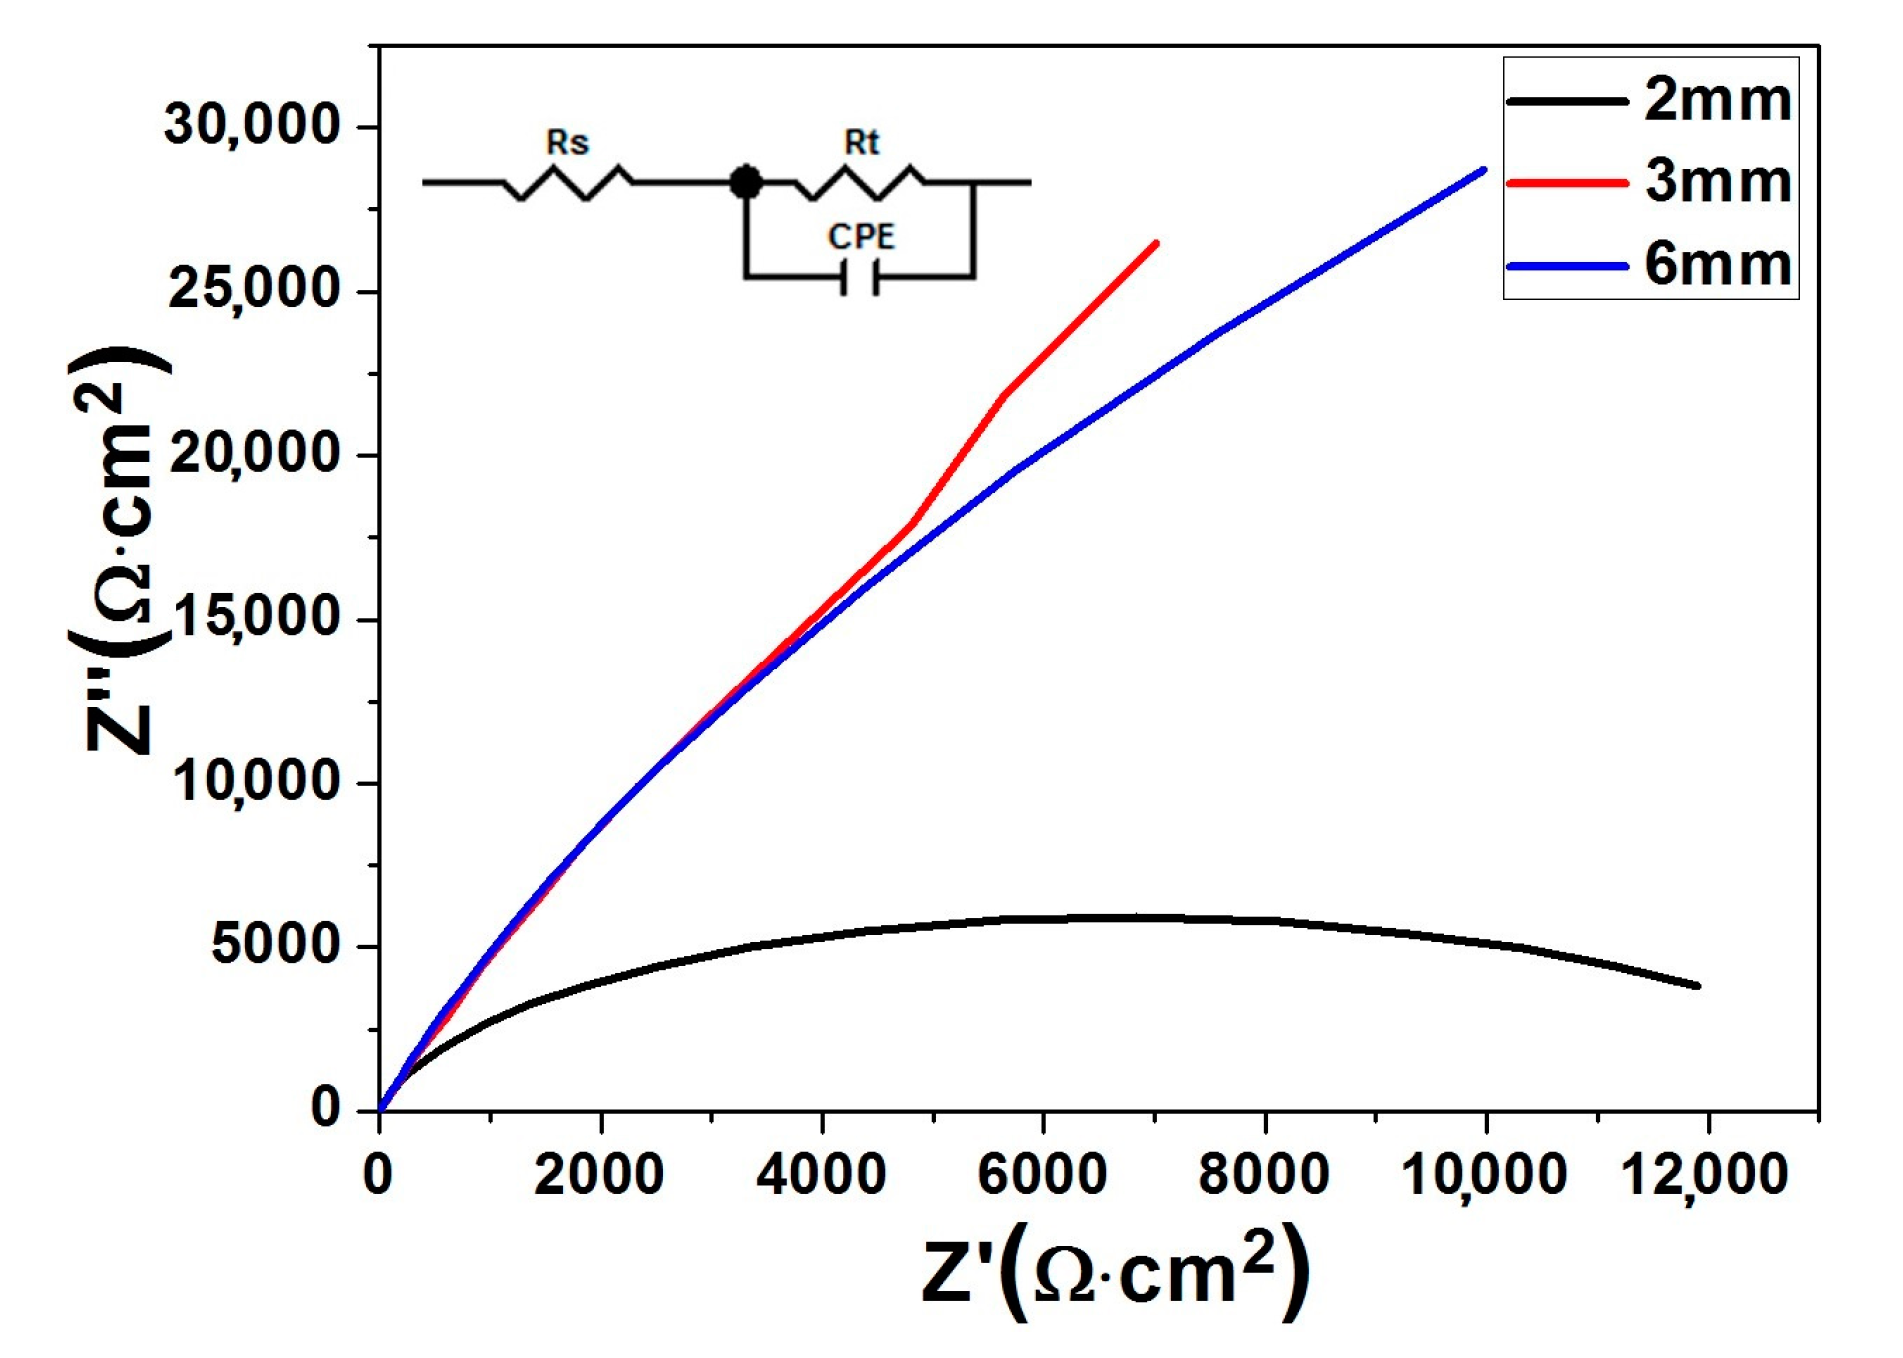
The electrochemical impedance spectroscopy (EIS) technique is a good tool to analyze the kinetics of electrode reactions. Figure 3 shows the results of EIS tests on the three differently sized MGMCs. Distinctively different features can be seen from Nyquist plots obtained from the three composites. The suitable fitting analysis based on the Z-view software has been conducted to attain EIS results, which are listed in Table 2. The equivalent circuit is illustrated in the inset of Figure 3. Table 2 lists the solution resistance (Rs), the charge-transfer resistance (Rp), and the capacitance of a constant phase element (CPE). Usually, Rp value serves as a good indicator of the overall corrosion resistance. A careful inspection of Table 2 shows that Φ6 mm rod possesses the highest Rp value among the three samples, implying a much more stable passive film formed on the surface. It is also noteworthy that the ranking order of Rp values of the three different sized composites is consistent with that of the passivation currents observed from the potentiodynamic polarization curves.

Figure 3.
Nyquist plots of Ti46Zr20V12Cu5Be17 composites with diameters of Φ2, Φ3, and Φ6 mm in the 10% H2SO4 solution at room temperature. The inset illustrating the corresponding equivalent circuit.
Table 2.
Equivalent circuit parameters of electrochemical impedance spectroscopy (EIS) results including the root-mean-square deviation of the values.
3.3. Chemical Corrosion Measurements
In order to better understand the corrosion behavior of the present in-situ MGMCs, immersion tests were conducted in the 10% H2SO4 solution open to air at room temperature for one week. The chemical corrosion rate of these Ti-based composites with different sizes can be calculated from the weight loss, according to the following equation [19]:
where Rcorr refers to corrosion rate, mm/year, w2 (g) is the weight after immersion corrosion test, w1 (g) is the weight before immersion corrosion test, t (h) is the immersion time of seven days, and A (cm2) and D (g/cm3) are the total surface area exposed and the density of alloy, respectively. The corrosion rates of all samples are fairly low, and the Φ6 mm rod has the minimum value at about 1 × 10⁻³ mm/year. The data of the Φ2 mm rod alloy is almost one order of magnitude higher at about 2.5 × 10⁻³ mm/year. Again, the chemical corrosion tests indicate that the Φ6 mm rod has best corrosion resistance among the three samples.
The SEM micrographs of the surfaces of in-situ MGMCs after chemical tests are shown in Figure 4. The SEM images of the original samples are shown in Figure 4a–c for the Φ2, Φ3, and Φ6 mm rods, respectively. Figure 4d–f represent the situation after immersion corrosion tests with the Φ2, Φ3, and Φ6 mm rods, respectively. One can clearly see from Figure 4a–c that the sizes of dendrites in these differently sized composites are evidently different. Note that the size of dendrites actually increases with the rod size, even though the dendrites’ volume fraction in all these samples is almost the same, with a value around 57% [20]. The similar situation has been verified in other MGMCs [20,21]. The dendrite sizes, measured by Image-Pro software (6.0, Media Cybernetics Inc., Rockville, MD, USA), are around 0.7, 0.9, and 1.2 μm for Φ2, Φ3, and Φ6 mm rods, respectively. Examination of Figure 4d–f reveal that the surfaces underwent change during the immerse-corrosion tests. As can be seen from Figure 4d, on the surface of the Φ2 mm rod, the crystalline dendrites are barely visible, indicating serious corrosion taking place. As for the Φ3 and Φ6 mm rods, as shown in Figure 4e,f, respectively, the existence of the dendrites is still manifest, suggesting much less severe corrosion.
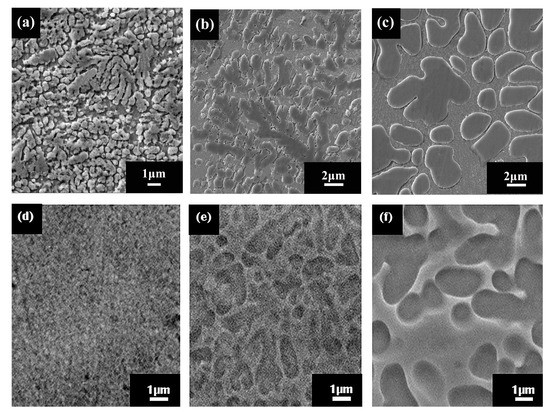
Figure 4.
The SEM micrographs of the surfaces of in-situ MGMCs after chemical tests in the 10% H2SO4 solution for 1 week shown. The images of as-cast ingots, with (a) Φ2 mm, (b) Φ3 mm and (c) Φ6 mm, respectively. The images after the chemical tests, with (d) Φ2 mm, (e) Φ3 mm and (f) Φ6 mm, respectively.
3.4. XPS Results
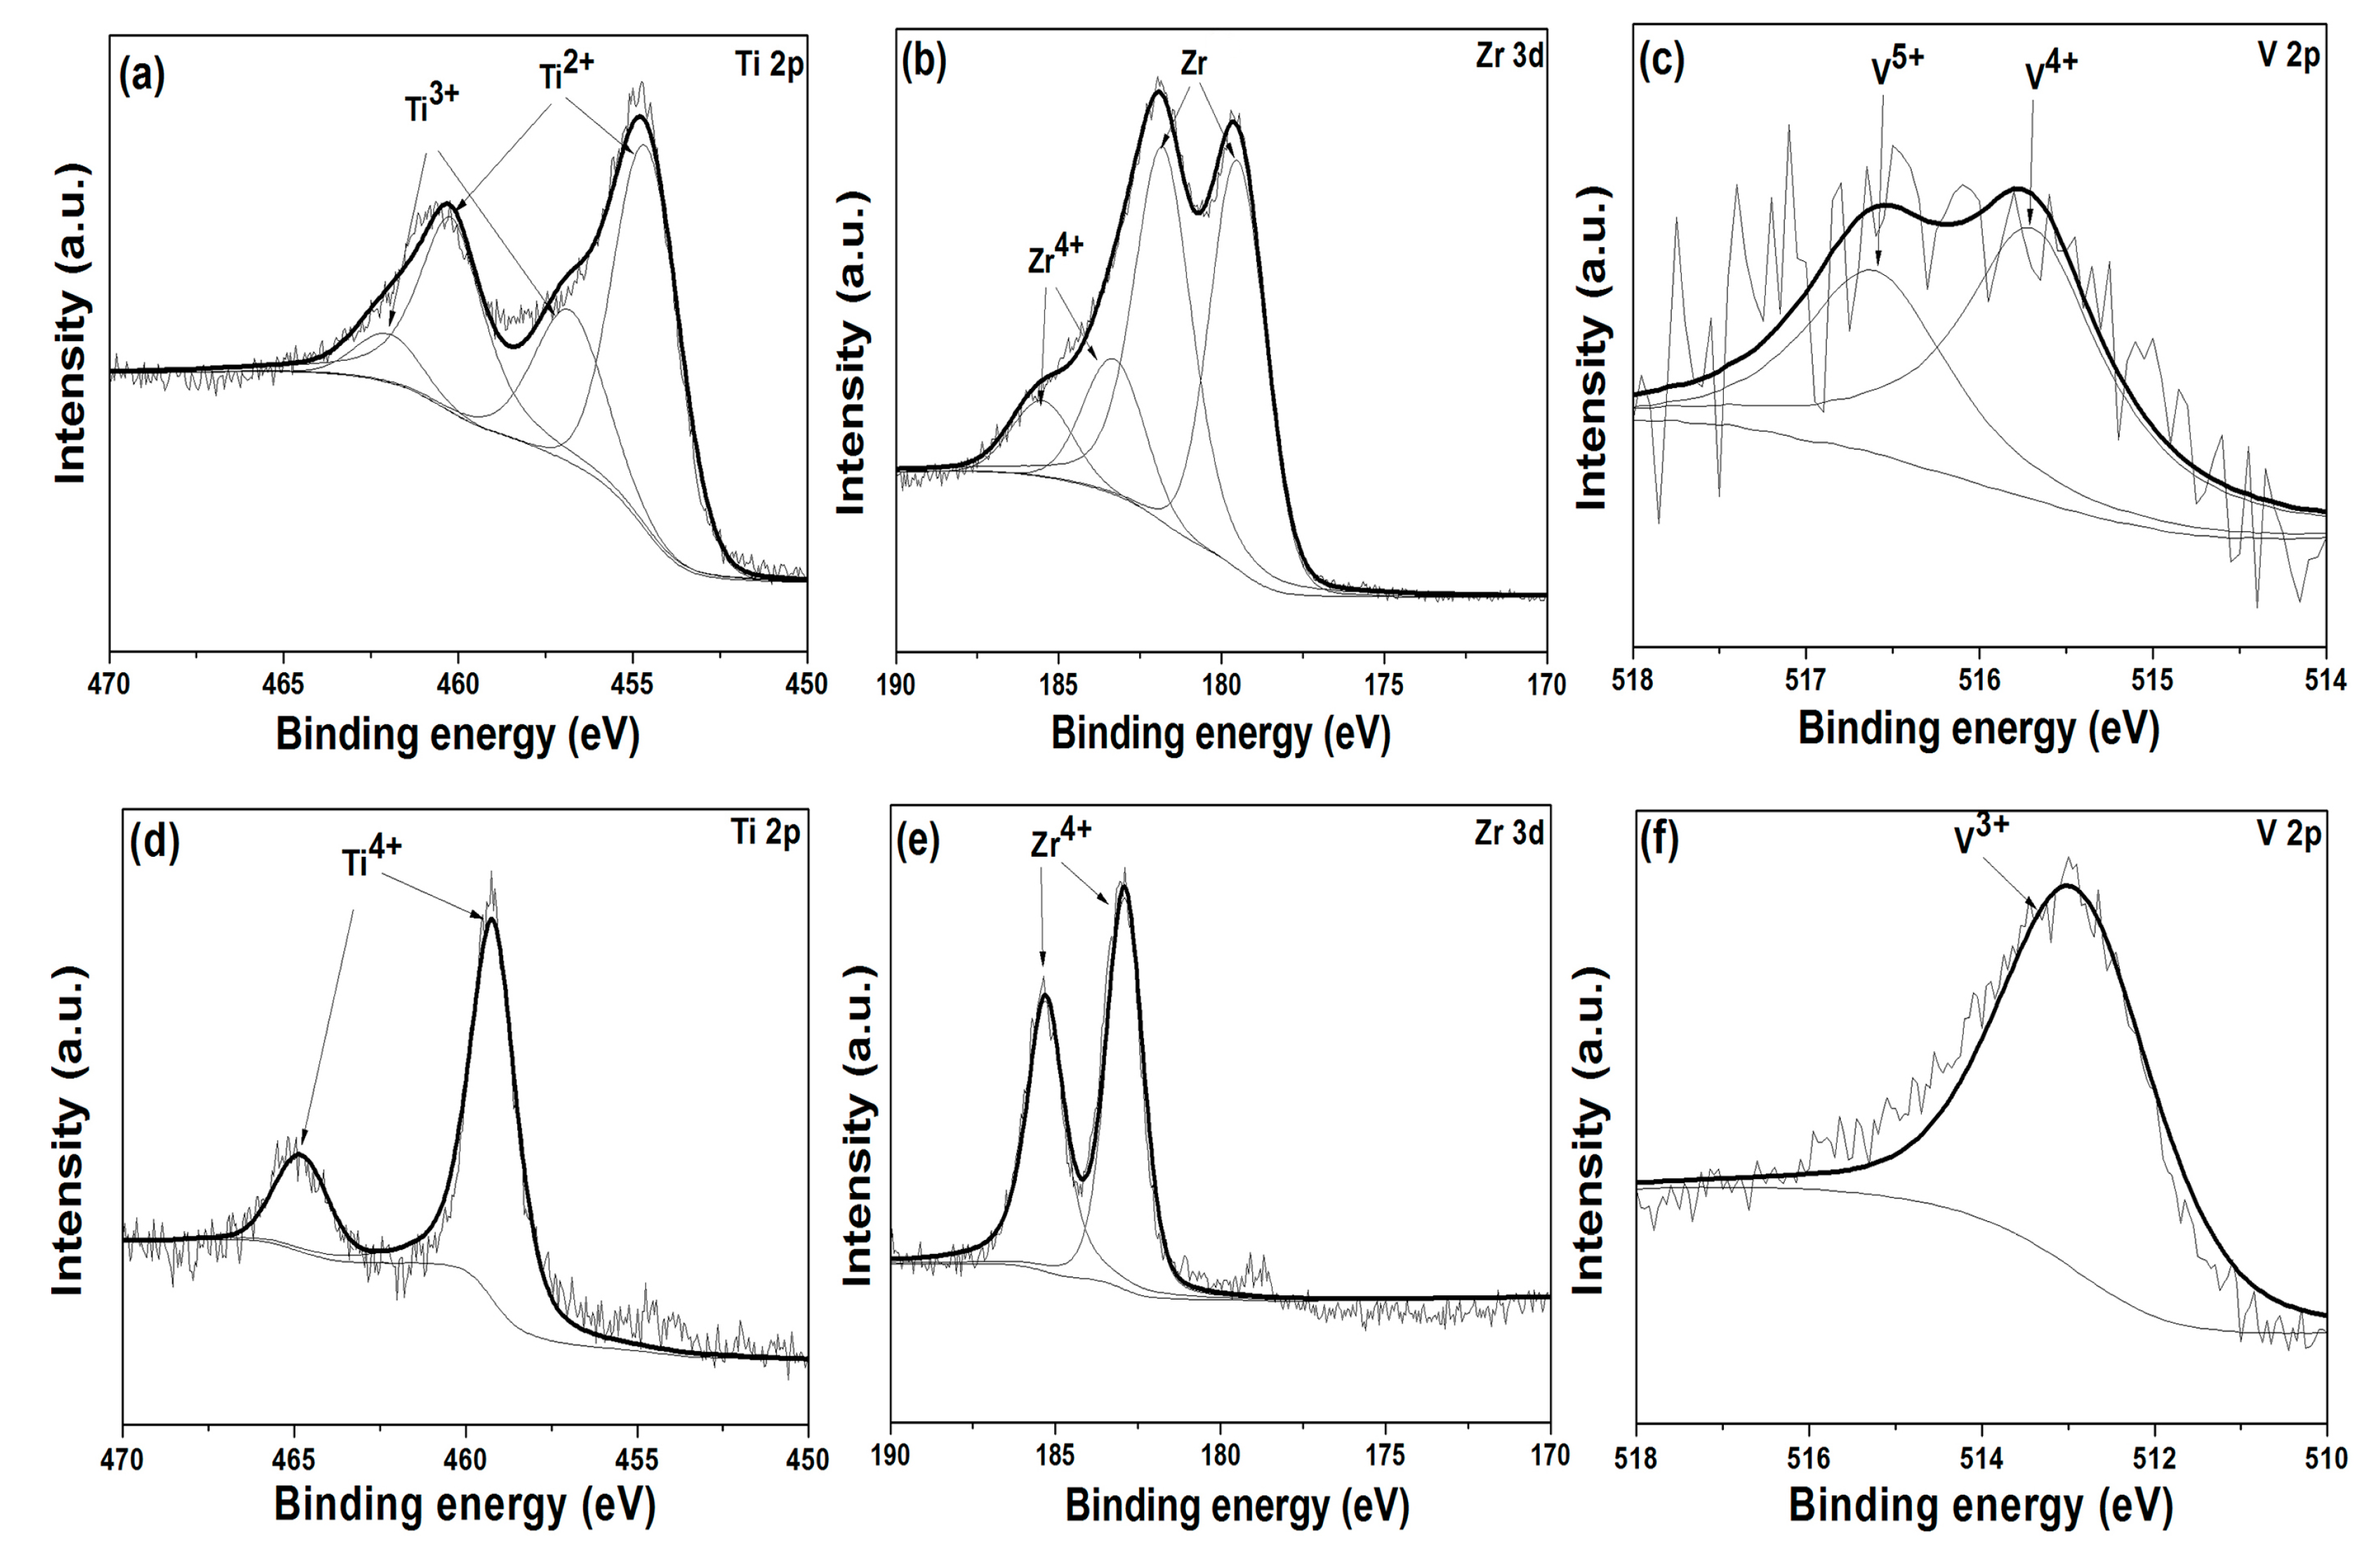
X-ray photoelectron spectroscopy (XPS) is a powerful tool to elucidate the compositional evolution in the surface layer. XPS measurements with an in-situ Ar-ion sputtering were performed on Ti46Zr20V12Cu5Be17 samples with different diameters immediately after the potentiodynamic polarization tests finished. The survey XPS spectra clearly display the peaks corresponding to Ti 2p, Zr 3d, V 2p, Cu 2p, Be 1s, O 1s and C 1s. The C 1s peak at 284.60 eV corresponds to the contaminated carbon layer on the samples is employed to calibrate the binding energies of other elements. Figure 5 representatively illustrates the core level spectra of Ti, Zr, and V species obtained from Φ2 mm (Figure 5a–c) and Φ6 mm rods (Figure 5d–f). Note that there are spin-orbit splitting induced doublet separation for Ti 2p and Zr 3d spectra, with 5.70 eV splitting between the Ti 2p1/2 and Ti 2p3/2, and 2.40 eV splitting between the Zr 3d3/2 and Zr 3d5/2. These facts are taken into consideration during the fitting process.
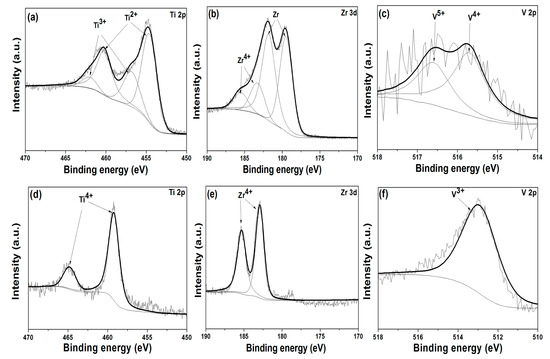
Figure 5.
The X-ray photoelectron spectroscopy (XPS) spectra of Ti 2p, Zr 3d, and V 2p species obtained from Φ2 and Φ6 mm Ti46Zr20V12Cu5Be17 rods. (a–c) for the Φ2 mm rod and (d–f) for the Φ6 mm rod (the black lines are fitted lines and the gray lines are raw data).
Two broad peaks located around 455 and 460 eV are visible in the Ti 2p spectra of Φ2 mm rod, as shown in Figure 5a. With careful analytical deconvolution fitting, these two peaks can be considered as overlapping of Ti 2p3/2 (454.60 eV) and Ti 2p1/2 (460.20 eV) photoelectron doublet for Ti2+ and Ti 2p3/2 (456.80 eV) and Ti 2p1/2 (462.00 eV) photoelectron doublet for Ti3+. For Φ6 mm rod, as shown in Figure 5d, only Ti4+ related peaks (Ti 2p3/2 at 459.20 eV and Ti 2p1/2 at 464.70 eV) can be observed, indicating the dominance of Ti4+ in the passive film on the surface. By careful examination of Zr 3d high-resolution spectra, a similar trend is found for the chemical evolution of Zr element in Φ2 mm and Φ6 mm rods. To brief, for Φ2 mm rod, as shown in Figure 5b, two observed peaks in Zr 3d spectra are ascribed to overlapping of the photoelectron doublets of Zr4+ and Zr0 (metal state), which are located at 183.40 eV and 185.80 eV for Zr4+ and at 179.35 eV and 181.74 eV for Zr0, respectively. Note that the Zr2+ content is of majority in the spectra for Φ2 mm rod. As for Φ6 mm rod, it is found that the content of Zr4+ (the 3d3/2 component with a binding energy about 185.30 eV and the 3d5/2 component with a binding energy about 182.90 eV) is predominant, as shown in Figure 5e. As for element of V, which constitutes minor part of the samples, the observed peak of photoelectron in V 2p spectra for Φ6 mm rod can be easily assigned to V3+, while the deconvolution fitting analysis of the diffuse peaks in V 2p spectra for Φ2 mm rod strongly suggests the existence of two oxidized states of V5+ and V4+, as shown in Figure 5c,f, respectively.
The Cu elements in the surface layer are mostly in state Cu0 for both Φ2 and Φ6 mm rods, as indicated from the Cu 2p spectra (not shown here). The inertness of Cu element can be easily understood in view of the most positive standard electrode potential (SEP) of +0.342 V vs. standard hydrogen electrode (SHE) for Cu/Cu2+, comparing to −1.628 V for Ti/Ti2+, −1.529 V for Zr/Zr4+, −1.186 V for V/V2+. The photoelectron peaks for Be 1s are very low, probably due to the poor spectrum response for this element.
Furthermore, the compositional depth profiles of oxidized states of Ti and Zr in passive films for Φ6 mm rod are illustrated in Figure 6. The atom content of each component with different depths on the surface can be clearly observed in the marked areas. The elemental distribution evolution of Ti and Zr can be easily seen. It is notable that the concentration of highly oxidized states like Ti4+ and Zr4+ are predominant on the surface. As the depth increases, Ti and Zr, the substrate elements, appear, and their composition amount increases gradually.
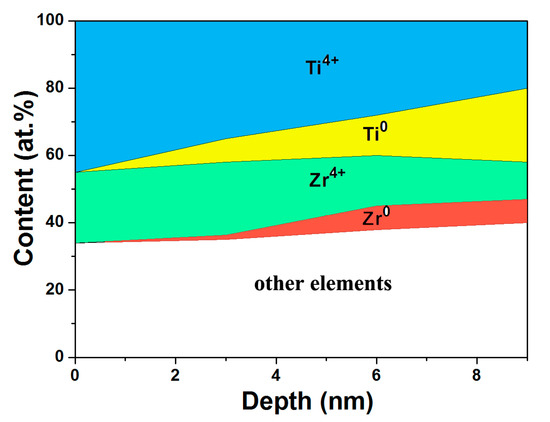
Figure 6.
Schematic illustration of the compositional depth profiles of Ti and Zr oxidized states in passive films for Φ6 mm Ti46Zr20V12Cu5Be17 rod.
4. Discussion
4.1. The Effect of the Composition of the Passive Film on Corrosion Properties
Upon the review of the corrosion properties of samples with different diameters, it becomes apparent that there is a distinctive discrepancy for the Φ2 and Φ6 mm rods. In addition, the corresponding XPS analysis on the surface of these samples reveals that the chemical states of the concerned elements in passive films are quite different for the Φ2 and Φ6 mm rods. Thus, the chemical state difference can actually be ascribed to the origin of the observed corrosion-property discrepancy for the Φ2 and Φ6 mm rods.
Based on the ranking order of their corresponding SEP, Ti and Zr are generally considered as the more active among the all five elements in the composites. As can be seen from XPS results, shown in Figure 5, Ti cations and Zr cations are the dominant presence on the surface film, which normally would combine with O preferentially to form protective oxide films. In fact, Qin et al. [22] have accredited the good corrosion resistance of TiZrPdCuSn metallic glasses to the formation of Ti- and Zr-riched passive films.
Since the formation of high-quality passive films on the surface is generally responsible to the corrosion resistance of metallic materials, it is interesting to compare the oxide states of the major elements for the two samples in this study. For the Φ2 mm rod, XPS results, as shown in Figure 5, indicate that the oxidized states of the main element Ti are Ti2+ and Ti3+, which probably form TiO and Ti2O3, while the other main element Zr is in the two states of Zr4+ and Zr0. Notably, the Zr0 state in this study more likely indicates that most of the Zr elements are not oxidized, and only small parts of Zr oxidize to form ZrO4. In contrast, for the Φ6 mm rod, Ti and Zr are in the highest oxidized states of Ti4+ and Zr4+ only. The corresponding oxides, TiO2 and ZrO2, are well-known to have high stability in an acidic environment [14,23]. The combination of these two oxides is believed to provide a higher corrosion resistance to the Φ6 mm rod than the Φ2 mm one. In fact, Debnath et al. [14] proposed that the TiO2 and ZrO2 provided very good protection for in-situ Ti45(Zr-Be-Cu-Ni)55−xNbx MGMCs. As a further proof, it is noteworthy that V in passive films is composed of three kinds of states: V3+, V4+, and V5+. The cation of V3+ is believed to have the most stable oxide among the three [24]. The fact that only the V3+ state presents in a Φ6 mm rod suggest the better passive film formed on the surface of Φ6 mm rod, which further supports its superior corrosion properties to the Φ2 mm rod.
4.2. Possible Corrosion Mechanisms
Various electrochemical tests illustrated in the experimental section have established the fact that large-sized composites (Φ6 mm) possess considerably better corrosion resistance than its small-sized counterpart. Further, XPS measurements demonstrate that the quality of passive film formed on the large-sized sample is rather superior to the small-size sample. Hereafter, the structure and composition of the Ti46Zr20V12Cu5Be17, the two aspects generally regarded as the accounting factors for the corrosion properties of these MGMCs [25], are discussed as follows.
As can be clearly seen from Figure 4, dendrites’ dimension on the surface of the small-sized sample (Φ2 mm) varied noticeably from the large-sized sample (Φ6 mm), indicating the observed corrosion-property discrepancy might root in the structural difference between the crystalline dendrites and the amorphous matrix. To clarify this matter, energy-dispersive spectrometer (EDS) analysis was conducted on the as-prepared composites. The obtained compositional information is listed in Table 3. Inspection of Table 3 shows that despite the apparent element-distribution difference between the crystalline dendrite and amorphous matrix, the compositional distribution contrast among different-sized samples is actually fairly small. In other words, the compositional distribution of different sized samples is essentially identical. Therefore, when accounting for the remarkable corrosion-property difference between small-sized and large-sized samples, the virtually identical composition distribution between these samples is not appropriate to be considered as a significant factor. Yet, it is proposed the evident size difference of dendrites on the surface of these samples might be attributed to the different dynamic corrosion processes, although detailed mechanisms are still unclear to this point.
Table 3.
The compositional information of the as-prepared composites samples obtained from energy-dispersive spectrometer (EDS) analysis.
Nevertheless, it can be seen from the SEM morphology that the crystalline dendrites have been preferentially dissolved in the acidic solutions, regardless of the sample size, which is particularly obvious for Φ2 mm rod. Examination of Table 3 clearly shows that the main components of Zr and Ti exhibit a considerable variation between the matrix and dendrites. For instance, the atomic percentage of Zr is higher in the matrix than in dendrites with a factor of 1.2. As a passive film forming agent, Zr seems more efficient than Ti in terms of metal activity and capacity to the capture of O [26]. Thus, it is inferred that higher Zr content in the matrix is responsible for the observed preferred dissolution of the crystalline dendrites.
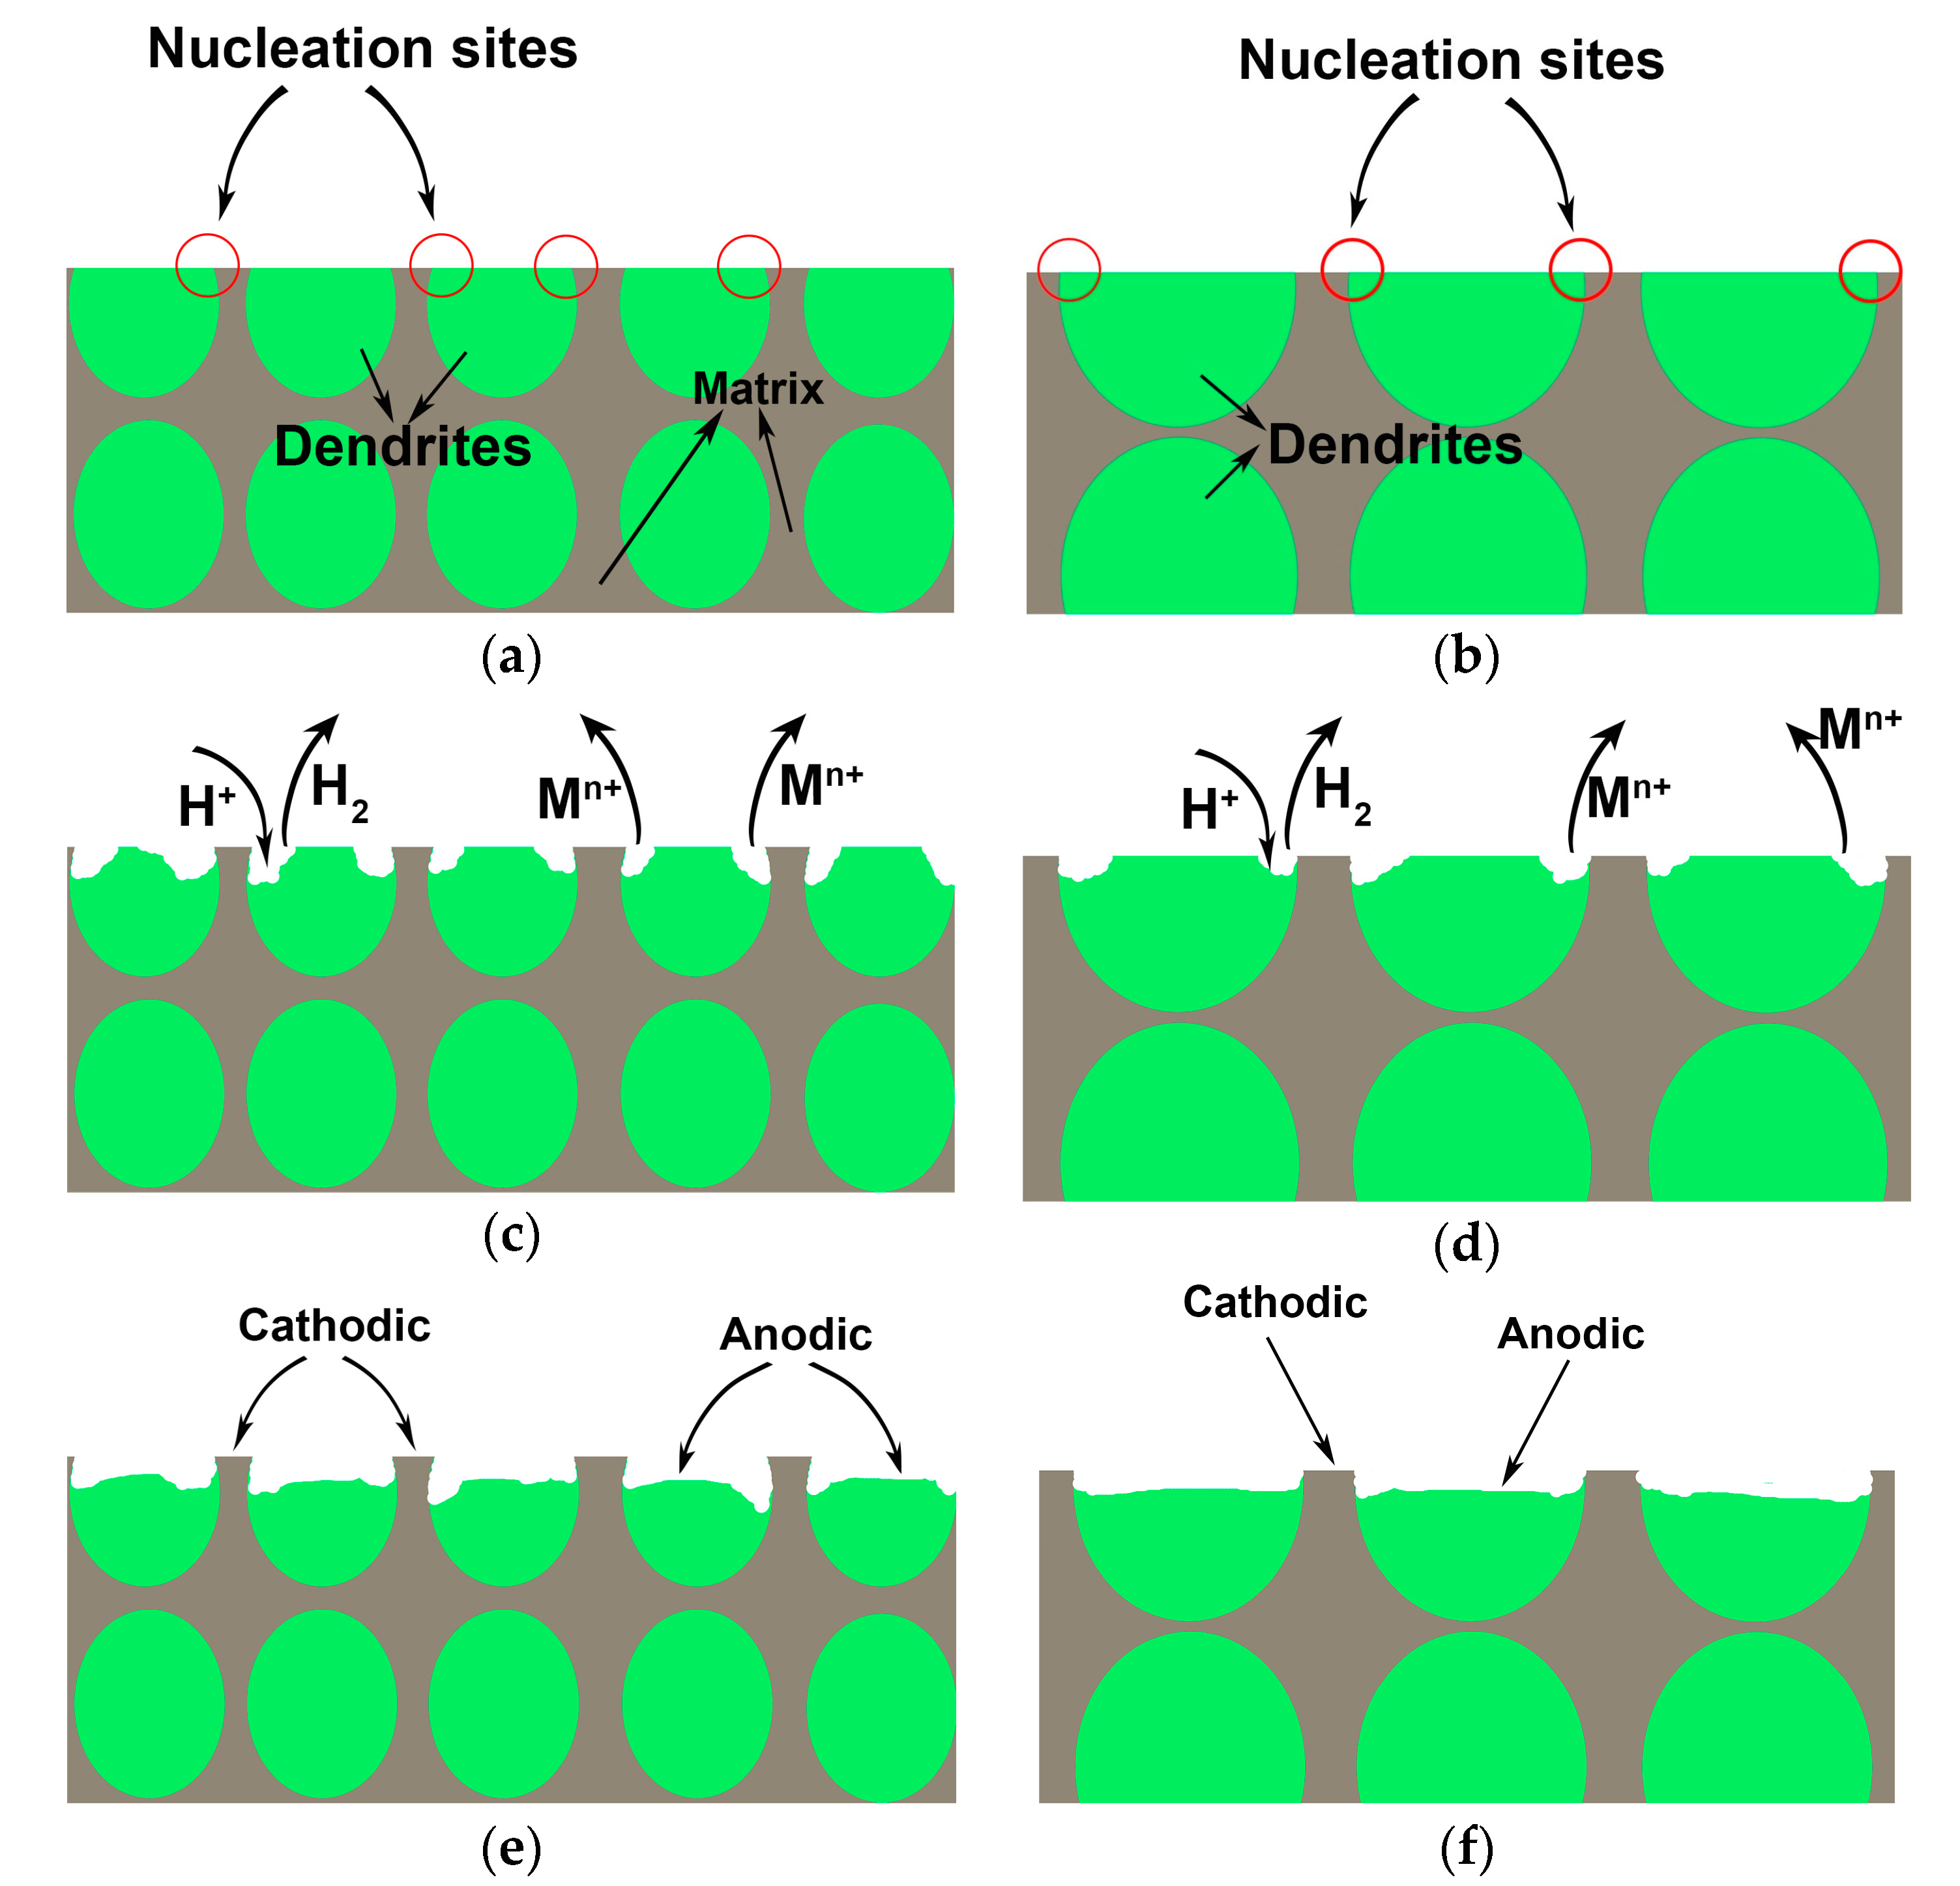
In order to elucidate the corrosion process during the immersion test, a schematic illustration comparing the corrosion process in small and large diameter rods is displayed in Figure 7. With increased diameter, the increased size of Cu-depleted dendrites has a lower probability of experiencing corrosion. As mentioned above, the elemental distribution between the dendrites and amorphous matrix and the volume fraction of dendrites do not change very much with the increased diameter. However, the size of dendrites is increased obviously. That is to say, the volume fractions of interfaces between dendrites and amorphous matrix increase, which means more defects exist in small diameter rods. Therefore, the small diameter rods are more vulnerable to corrosion due to the presence of more nucleation sites in comparison to large diameter rods. As shown in Table 3, the Ti and V element contents are noticeably enriched in dendrites.
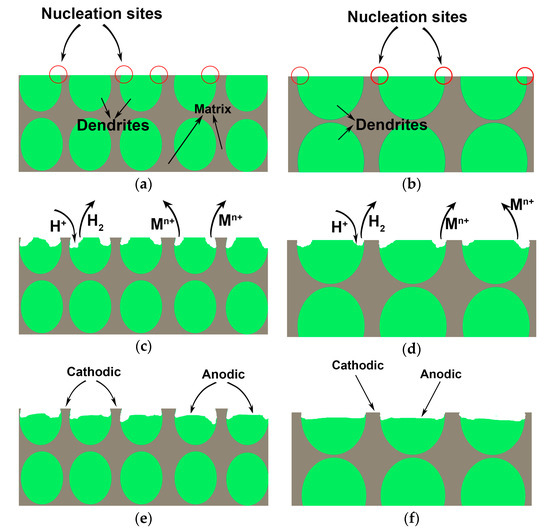
Figure 7.
Schematic illustration for comparing the different corrosion processes in small and large diameter rods: (a,b) are schematic diagrams before corrosion, (c,d) are corrosion process, (e,f) are schematic diagrams after corrosion.
On the other hand, for the amorphous matrix, it is the Zr and Cu elements that are enriched in this phase. Comparing the standard electrode potential (SEP) of all the metallic elements involved, Cu has relatively higher SEP values (VSHE) of 0.337 (where VSHE represents the potential that is referred to the hydrogen electrode potential). Ti is the base element, with standard equilibrium electrode potential values of −1.210 (VSHE). The different potential between the amorphous matrix and dendrites results in the galvanic corrosion. Therefore, the amorphous matrix acts as cathode due to its relatively high potential, while the dendrites act as the anode to be dissolved.
5. Conclusions
In this study, a comprehensive corrosion behavior of in-situ Ti46Zr20V12Cu5Be17 MGMCs versus their size was conducted. Potentiodynamic polarization, potentiostatic polarization, and EIS measurements consensually show that the Φ6 mm rod has a much better corrosion resistance than the Φ2 and Φ3 mm counterparts. Additional XPS analysis demonstrates more presence of TiO2 and ZrO2 on the passive film on the surface of the Φ6 mm rod, which guarantees its superior corrosion resistance. SEM observation strongly implies that the size difference of dendrites on the surface of these samples might result in the different dynamic corrosion path, which can be attributed to two aspects, i.e., the different corrosion potential between the amorphous matrix and dendrites and the different numbers of nucleation sites in differently sized dendrites.
Acknowledgments
Junwei Qiao would like to acknowledge the Youth Natural Science Foundation of Shanxi Province, China (No. 2015021005). Aidong Lan would like to acknowledge the financial support of the Science Foundation of Shanxi Province (No. 2013011010-1). Huijun Yang would like to acknowledge the financial support from the National Natural Science Foundation of China (No. 51401141).
Author Contributions
Junwei Qiao and Aidong Lan conceived and designed the experiments; Junwei Qiao, Fan Yang and Jing Fan performed the experiments; Junwei Qiao, Fan Yang, Xiaohui Shi, Huijun Yang, Aidong Lan, and Jing Fan analyzed the data; Junwei Qiao wrote the paper.
Conflicts of Interest
The authors declare no conflict of interest.
References
- Inoue, A. Stabilization of metallic supercooled liquid and bulk amorphous alloys. Acta Mater. 2000, 48, 279–306. [Google Scholar] [CrossRef]
- Hays, C.C.; Kim, C.P.; Johnson, W.L. Microstructure controlled shear band pattern formation and enhanced plasticity of bulk metallic glasses containing in-situ formed ductile phase dendrite dispersions. Phys. Rev. Lett. 2000, 84, 2901–2904. [Google Scholar] [CrossRef] [PubMed]
- Peker, A.; Johnson, W.L. A highly processable metallic glass: Zr41.2Ti13.8Cu12.5Ni10.0Be22.5. Appl. Phys. Lett. 1993, 63, 2342–2344. [Google Scholar] [CrossRef]
- Fan, C.; Louzguine, D.V.; Li, C.; Inoue, A. Nanocrystalline composites with high strength obtained in Zr–Ti–Ni–Cu–Al bulk amorphous alloys. Appl. Phys. Lett. 1999, 75, 340–342. [Google Scholar] [CrossRef]
- Hofmann, D.C.; Suh, J.Y.; Wiest, A.; Duan, G.; Lind, M.L.; Demetriou, M.D.; Johnson, W.L. Development of tough, lowdensity titanium-based bulk metallic glass matrix composites with tensile ductility. Proc. Natl. Acad. Sci. USA 2008, 105, 20136–20140. [Google Scholar] [CrossRef] [PubMed]
- Hofmann, D.C.; Suh, J.Y.; Wiest, A.; Duan, G.; Lind, M.L.; Demetriou, M.D.; Johnson, W.L. Designing metallic glass matrix composites with high toughness and tensile ductility. Nature 2008, 451, 1085–1089. [Google Scholar] [CrossRef] [PubMed]
- Qiao, J.W.; Wang, S.; Zhang, Y.; Liaw, P.K.; Chen, G.L. Large plasticity and tensile necking of Zr-based bulk-metallic-glass-matrix composites synthesized by the bridgman solidification. Appl. Phys. Lett. 2009, 94, 151905. [Google Scholar] [CrossRef]
- Qiao, J.W.; Sun, A.C.; Huang, E.W.; Zhang, Y.; Liaw, P.K.; Chuang, C.P. Tensile deformation micromechanisms for bulk metallic glass matrix composites: From work-hardening to softening. Acta Mater. 2011, 59, 4126–4137. [Google Scholar] [CrossRef]
- Wang, Z.M.; Ma, Y.T.; Zhang, J.; Hou, W.L.; Chang, X.C.; Wang, J.Q. Influence of yttrium as a minority alloying element on the corrosion behavior in fe-based bulk metallic glasses. Electrochim. Acta 2008, 54, 261–269. [Google Scholar] [CrossRef]
- Wang, Z.; Scudino, S.; Prashanth, K.G.; Eckert, J. Corrosion properties of high-strength nanocrystalline Al84Ni7Gd6Co3 alloy produced by hot pressing of metallic glass. J. Alloys Compd. 2017, 707, 63–67. [Google Scholar] [CrossRef]
- Zhang, H.J.; Zhang, D.F.; Ma, C.H.; Guo, S.F. Improving mechanical properties and corrosion resistance of Mg6ZnMn magnesium alloy by rapid solidification. Mater. Lett. 2013, 92, 45–48. [Google Scholar] [CrossRef]
- Zhang, Y.; Xu, W.; Tan, H.; Li, Y. Microstructure control and ductility improvement of La–Al–(Cu,Ni) composites by bridgman solidification. Acta Mater. 2005, 53, 2607–2616. [Google Scholar] [CrossRef]
- Zhao, Y.J.; Qiao, J.W.; Ma, S.G.; Gao, M.C.; Yang, H.J.; Chen, M.W.; Zhang, Y. A hexagonal close-packed high-entropy alloy: The effect of entropy. Mater. Des. 2016, 96, 10–15. [Google Scholar] [CrossRef]
- Debnath, M.R.; Kim, D.-H.; Fleury, E. Dependency of the corrosion properties of in-situ Ti-based BMG matrix composites with the volume fraction of crystalline phase. Intermetallics 2012, 22, 255–259. [Google Scholar] [CrossRef]
- Debnath, M.R.; Chang, H.-J.; Fleury, E. Effect of group 5 elements on the formation and corrosion behavior of Ti-based BMG matrix composites reinforced by icosahedral quasicrystalline phase. J. Alloys Compd. 2014, 612, 134–142. [Google Scholar] [CrossRef]
- Qiao, J.W.; Zhang, T.; Yang, F.Q.; Liaw, P.K.; Pauly, S.; Xu, B.S. A tensile deformation model for in-situ dendrite/metallic glass matrix composites. Sci. Rep. 2013, 3, 2816. [Google Scholar] [CrossRef] [PubMed]
- Yang, F.; Tian, H.F.; Lan, A.D.; Zhou, H.F.; Wang, B.C.; Yang, H.J.; Qiao, J.W. Corrosion behavior of Ti-based in situ dendrite-reinforced metallic glass matrix composites in various solutions. Metall. Mater. Trans. A 2015, 46, 2399–2403. [Google Scholar] [CrossRef]
- Wang, Z.M.; Chang, X.C.; Hou, W.L.; Wang, J.Q. Selective dissolution sensitive to minor alloying in CuZr-based metallic glasses. Corros. Sci. 2013, 76, 465–473. [Google Scholar] [CrossRef]
- Hourani, M.; Wedian, F. The effect of adatoms on the corrosion rate of copper. Corros. Sci. 2000, 42, 2131–2144. [Google Scholar] [CrossRef]
- Jeon, C.; Lee, H.; Kim, C.P.; Joo, S.-H.; Kim, H.S.; Lee, S. Effects of effective dendrite size on tensile deformation behavior in ti-based dendrite-containing amorphous matrix composites modified from Ti-6Al-4V alloy. Metall. Mater. Trans. A 2014, 46, 235–250. [Google Scholar] [CrossRef]
- Sun, X.H.; Wang, Y.S.; Fan, J.; Yang, H.J.; Ma, S.G.; Wang, Z.H.; Qiao, J.W. Plasticity improvement for dendrite/metallic glass matrix composites by pre-deformation. Mater. Des. 2015, 86, 266–271. [Google Scholar] [CrossRef]
- Qin, C.L.; Oak, J.J.; Ohtsu, N.; Asami, K.; Inoue, A. XPS study on the surface films of a newly designed Ni-free Ti-based bulk metallic glass. Acta Mater. 2007, 55, 2057–2063. [Google Scholar] [CrossRef]
- Wang, D.P.; Wang, S.L.; Wang, J.Q. Relationship between amorphous structure and corrosion behaviour in a Zr–Ni metallic glass. Corros. Sci. 2012, 59, 88–95. [Google Scholar] [CrossRef]
- Sobolev, V.I.; Koltunov, K.Y. MoVNbTe mixed oxides as efficient catalyst for selective oxidation of ethanol to acetic acid. ChemCatChem 2011, 3, 1143–1145. [Google Scholar] [CrossRef]
- Szewieczek, D.; Held, J.T.; Paszenda, Z. Corrosion investigations of nanocrystalline iron based alloy. J. Mater. Process. Technol. 1998, 78, 171–176. [Google Scholar] [CrossRef]
- Jayaraj, J.; Sordelet, D.J.; Kim, D.H.; Kim, Y.C.; Fleury, E. Corrosion behaviour of Ni–Zr–Ti–Si–Sn amorphous plasma spray coating. Corros. Sci. 2006, 48, 950–964. [Google Scholar] [CrossRef]


© 2018 by the authors. Licensee MDPI, Basel, Switzerland. This article is an open access article distributed under the terms and conditions of the Creative Commons Attribution (CC BY) license (http://creativecommons.org/licenses/by/4.0/).