
Effect of Polymer Addition on the Structure and Hydrogen Evolution Reaction Property of Nanoflower-Like Molybdenum Disulfide


Abstract
:
1. Introduction
2. Material and Methods
2.1. Material
2.2. Synthesis of Nanoflower-Like MoS2

| Sample | PVA (g/g MoS2) | PVP (g/g MoS2) | PEI (g/g MoS2) | Thiourea (g) | AHM (g) | H2O (mL) |
|---|---|---|---|---|---|---|
| Pure MoS2 | – | – | – | 0.26 | 1.41 | 20 |
| MoS2/PVA–0.04 | 0.04 | – | – | 0.26 | 1.41 | 20 |
| MoS2/PVA–0.2 | 0.2 | – | – | 0.26 | 1.41 | 20 |
| MoS2/PVA–0.4 | 0.4 | – | – | 0.26 | 1.41 | 20 |
| MoS2/PVP–0.08 | – | 0.08 | – | 0.26 | 1.41 | 20 |
| MoS2/PVP–0.4 | – | 0.4 | – | 0.26 | 1.41 | 20 |
| MoS2/PVP–2.0 | – | 2.0 | – | 0.26 | 1.41 | 20 |
| MoS2/PEI–0.04 | – | – | 0.04 | 0.26 | 1.41 | 20 |
| MoS2/PEI–0.2 | – | – | 0.2 | 0.26 | 1.41 | 20 |
| MoS2/PEI–0.4 | – | – | 0.4 | 0.26 | 1.41 | 20 |
2.3. Characterization
2.4. Fabrication of the Electrodes
2.5. Electrochemical Measurements
3. Results and Discussions
3.1. Characterization of Nanoflower-Like MoS2
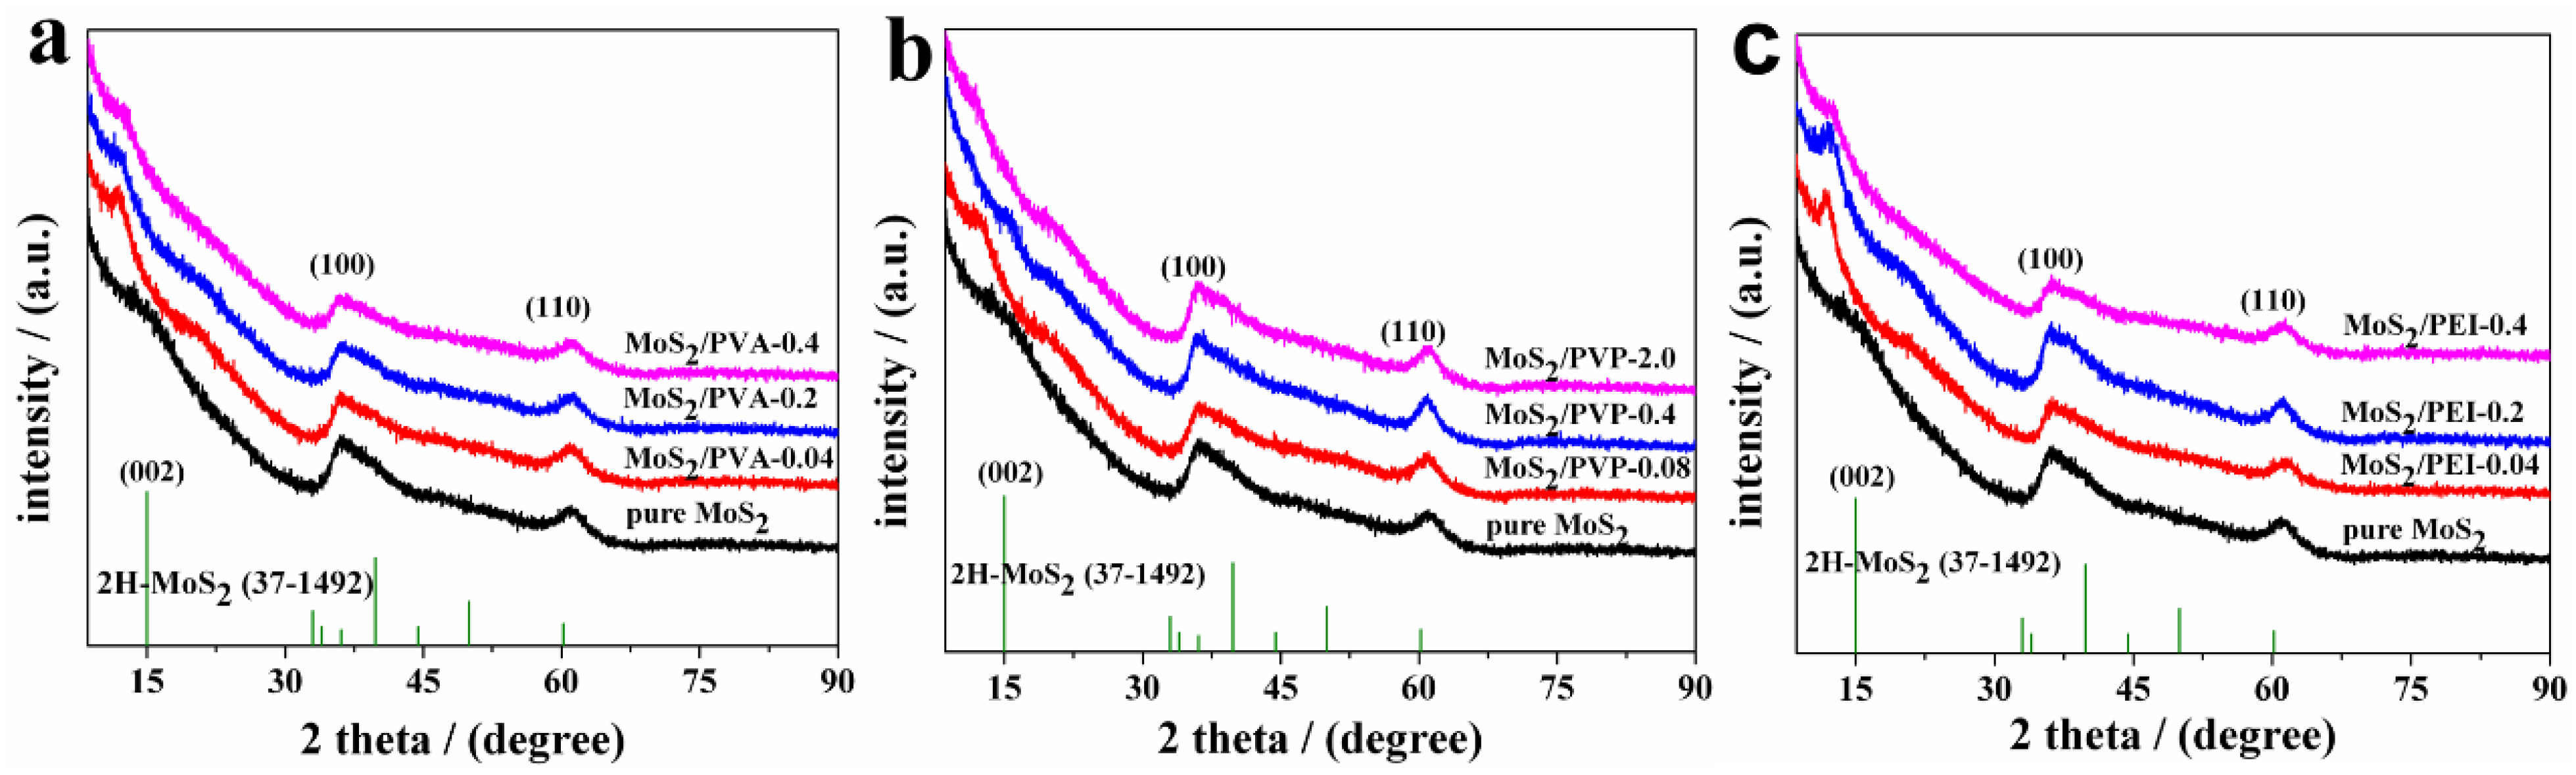
3.1.1. X-Ray Diffraction (XRD) Spectra
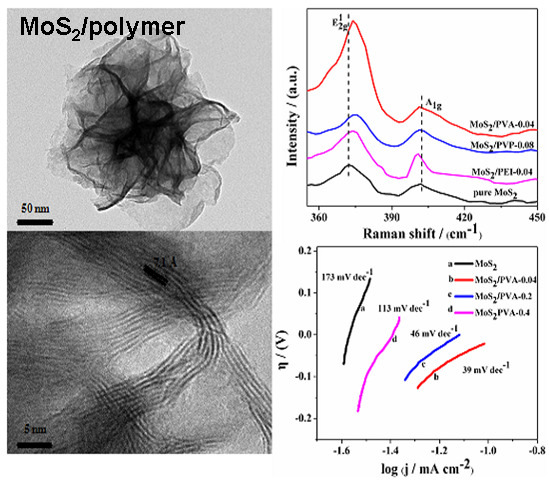
3.1.2. Raman Spectra

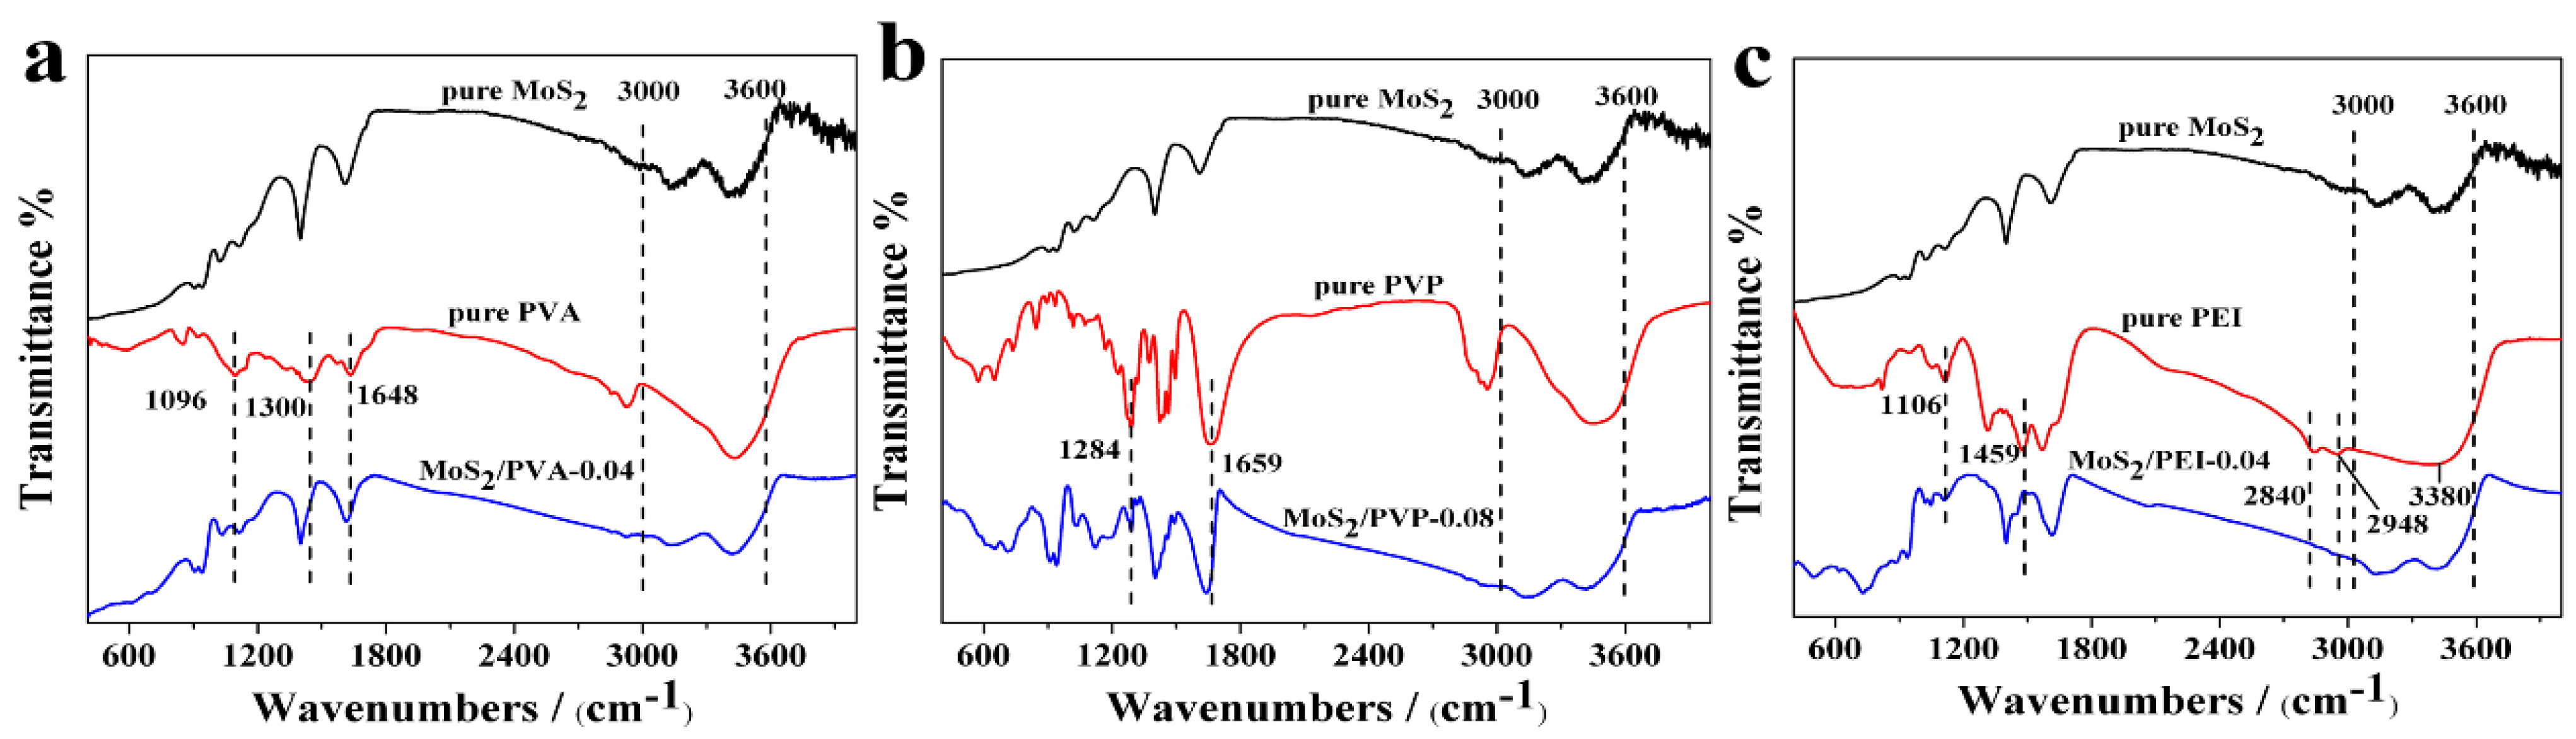
3.1.3. FTIR Spectra
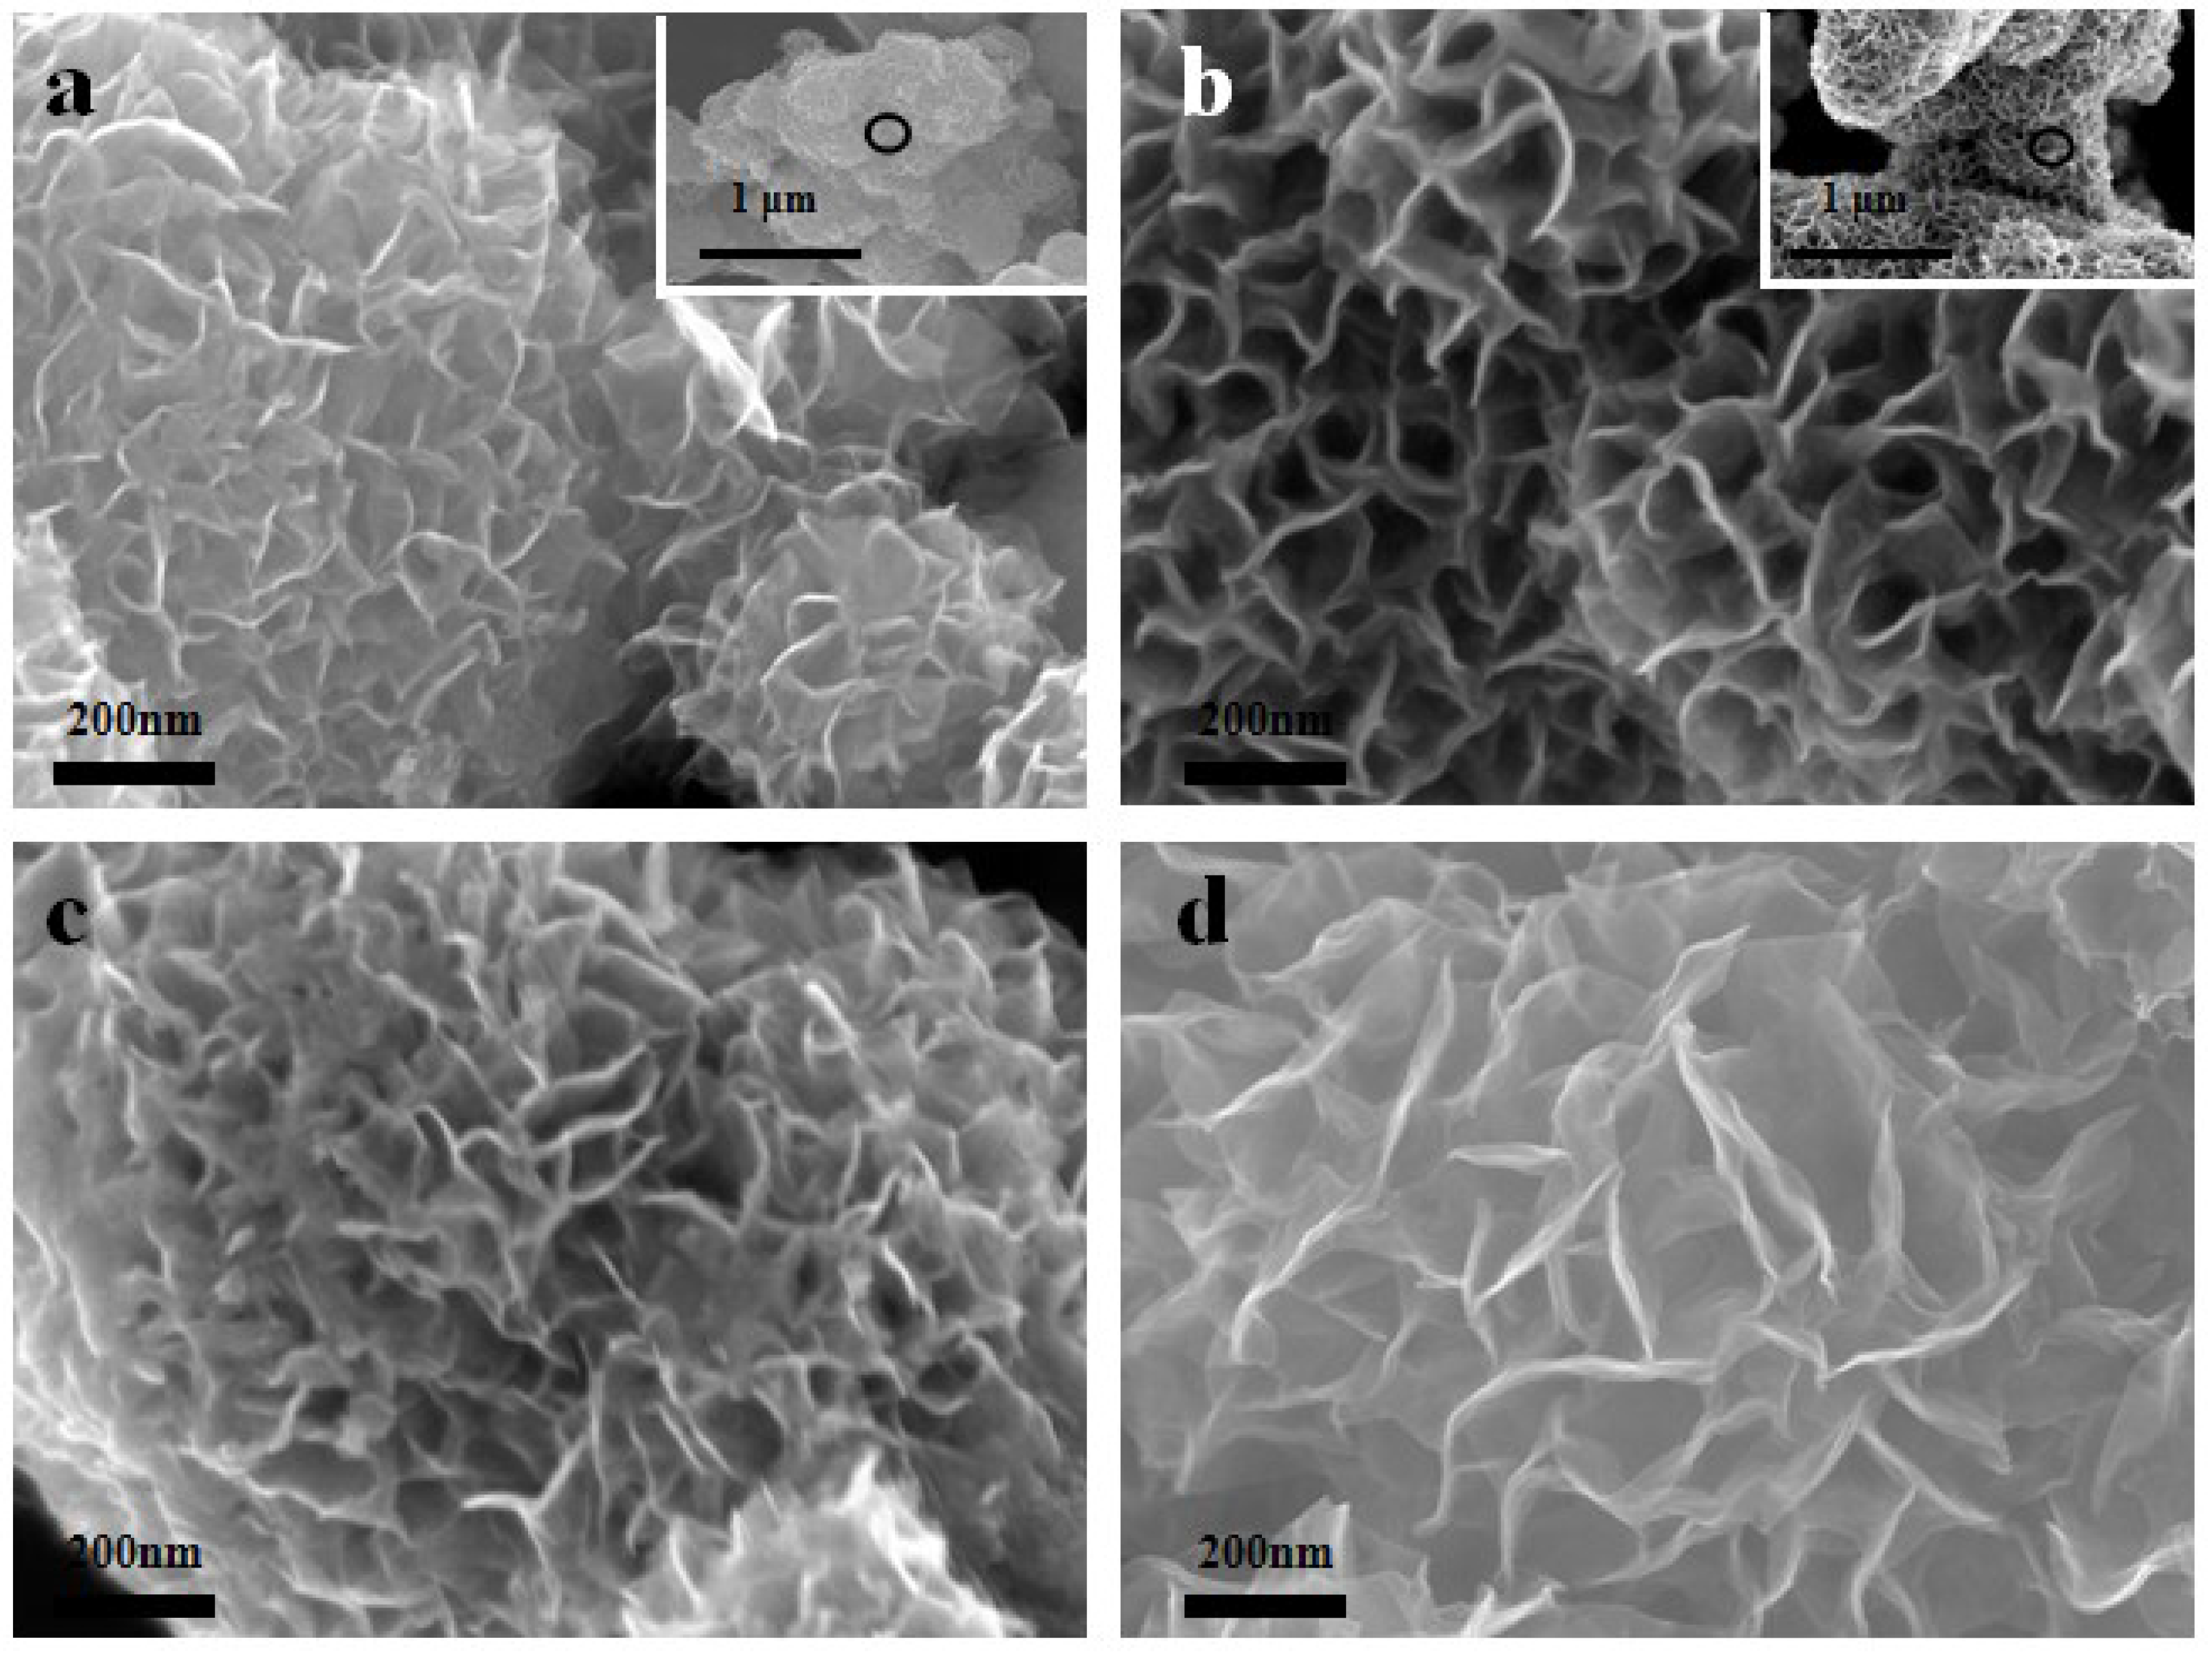
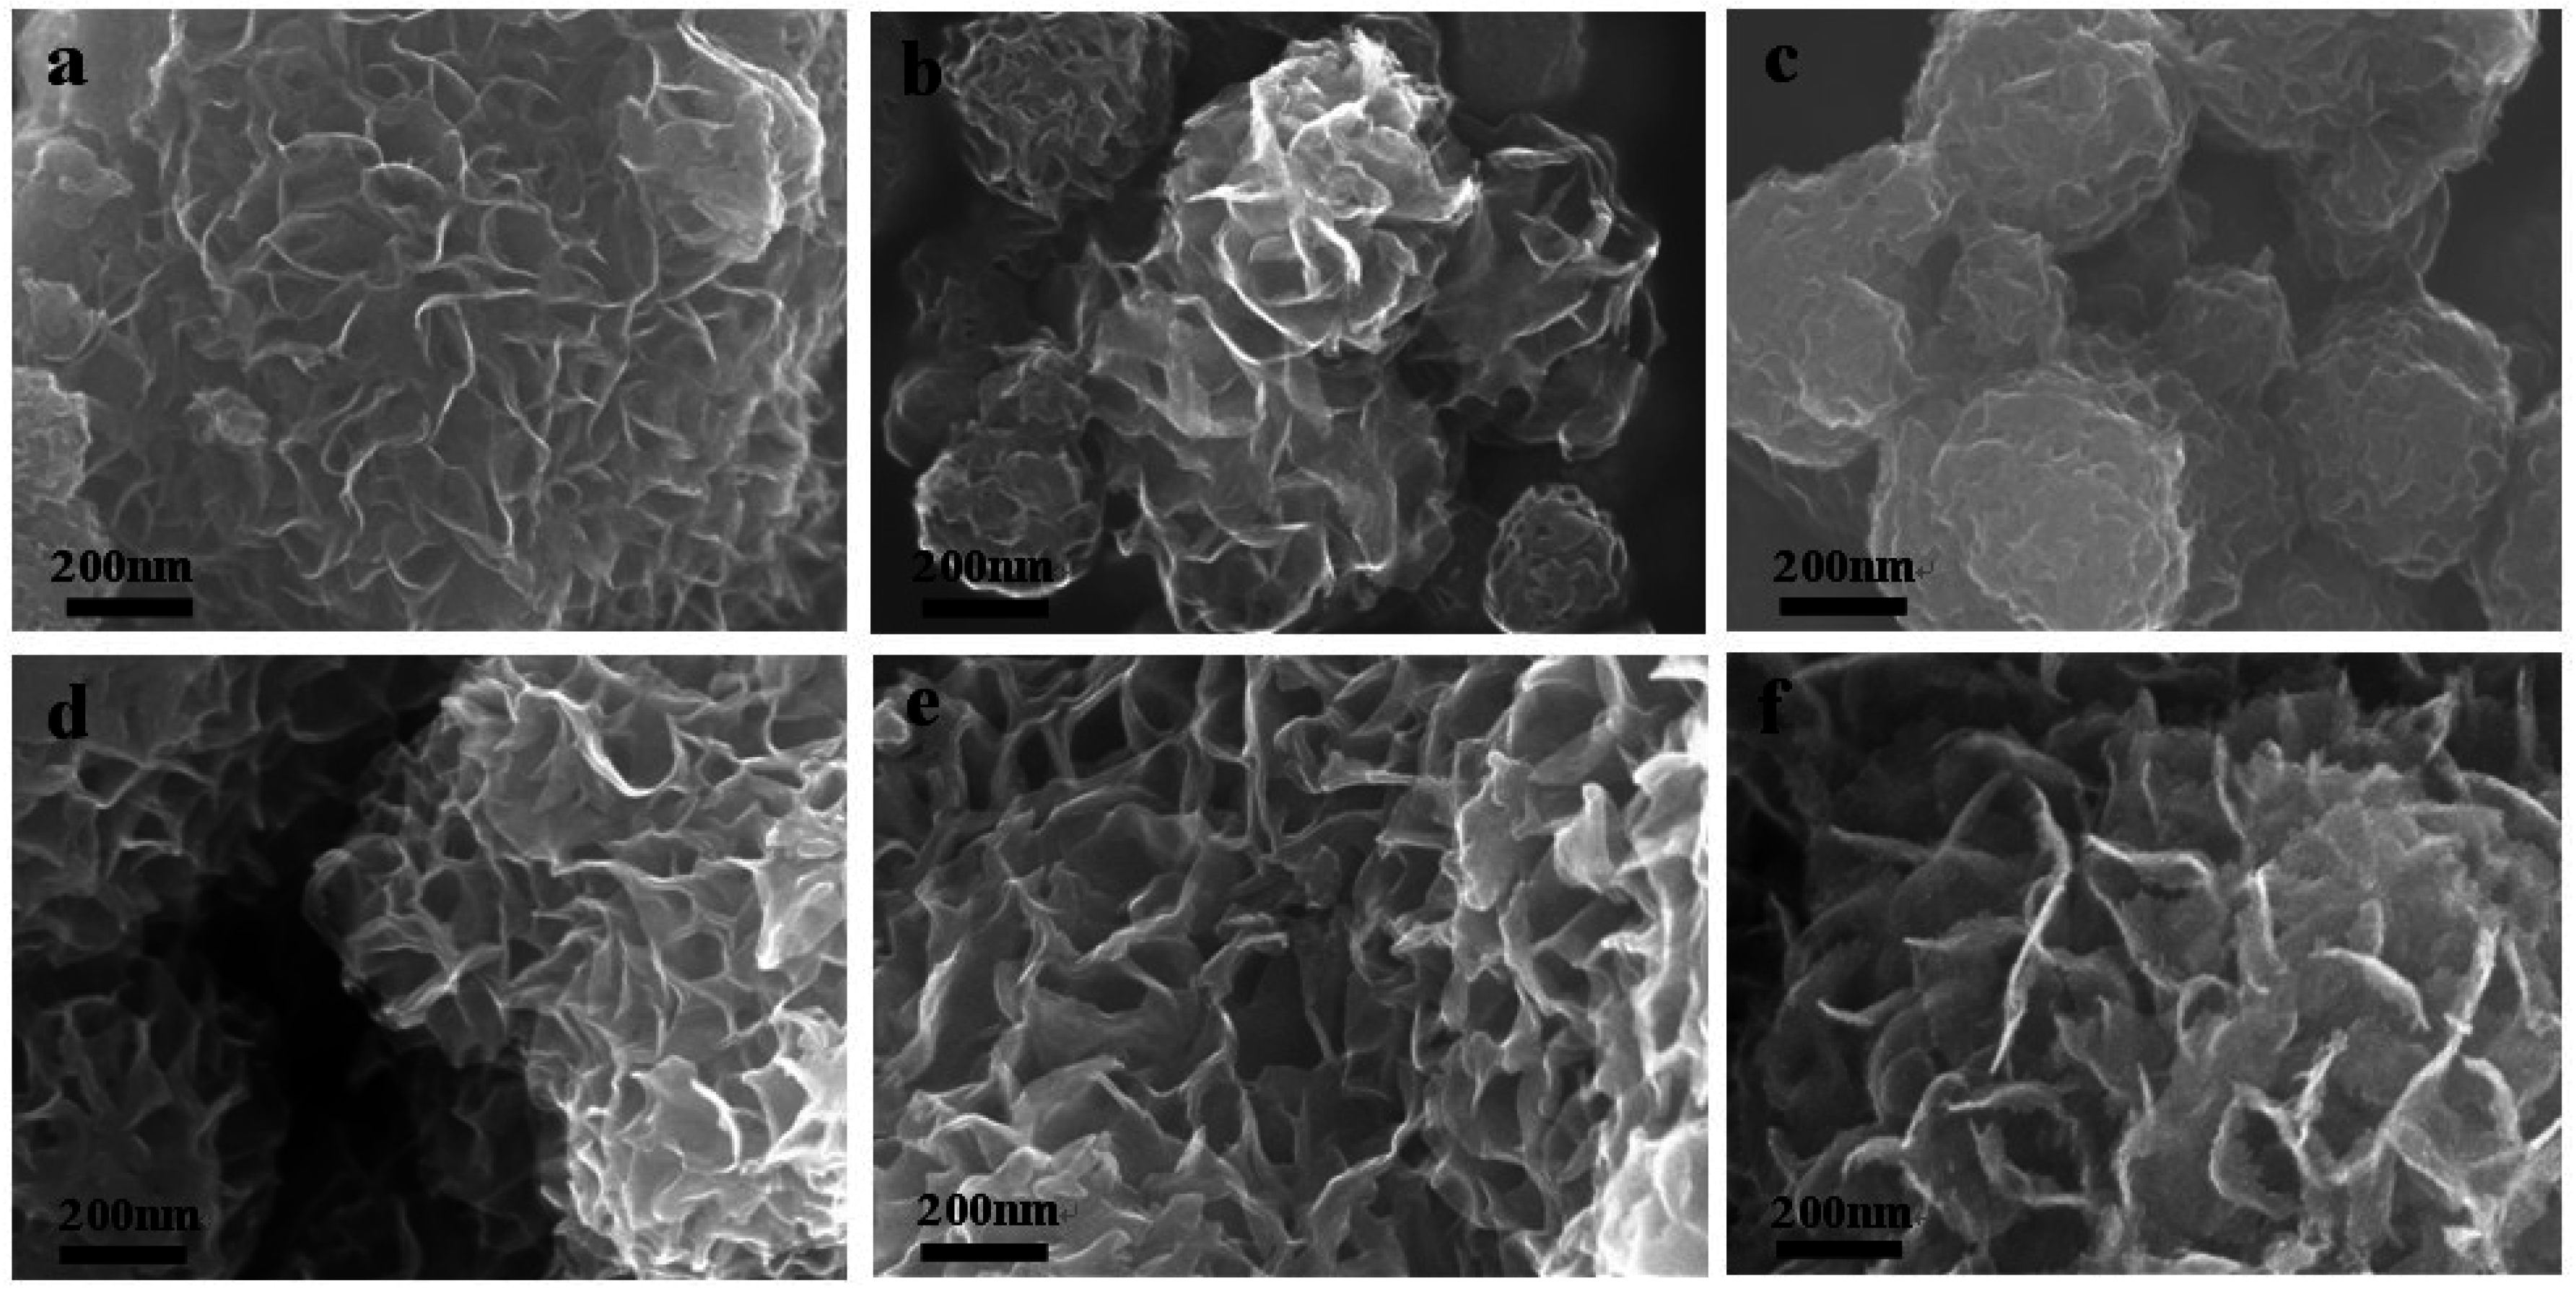
3.1.4. SEM Morphologies
3.1.5. TEM

3.2. HER Activity of the Nanoflower-Like MoS2/Polymer
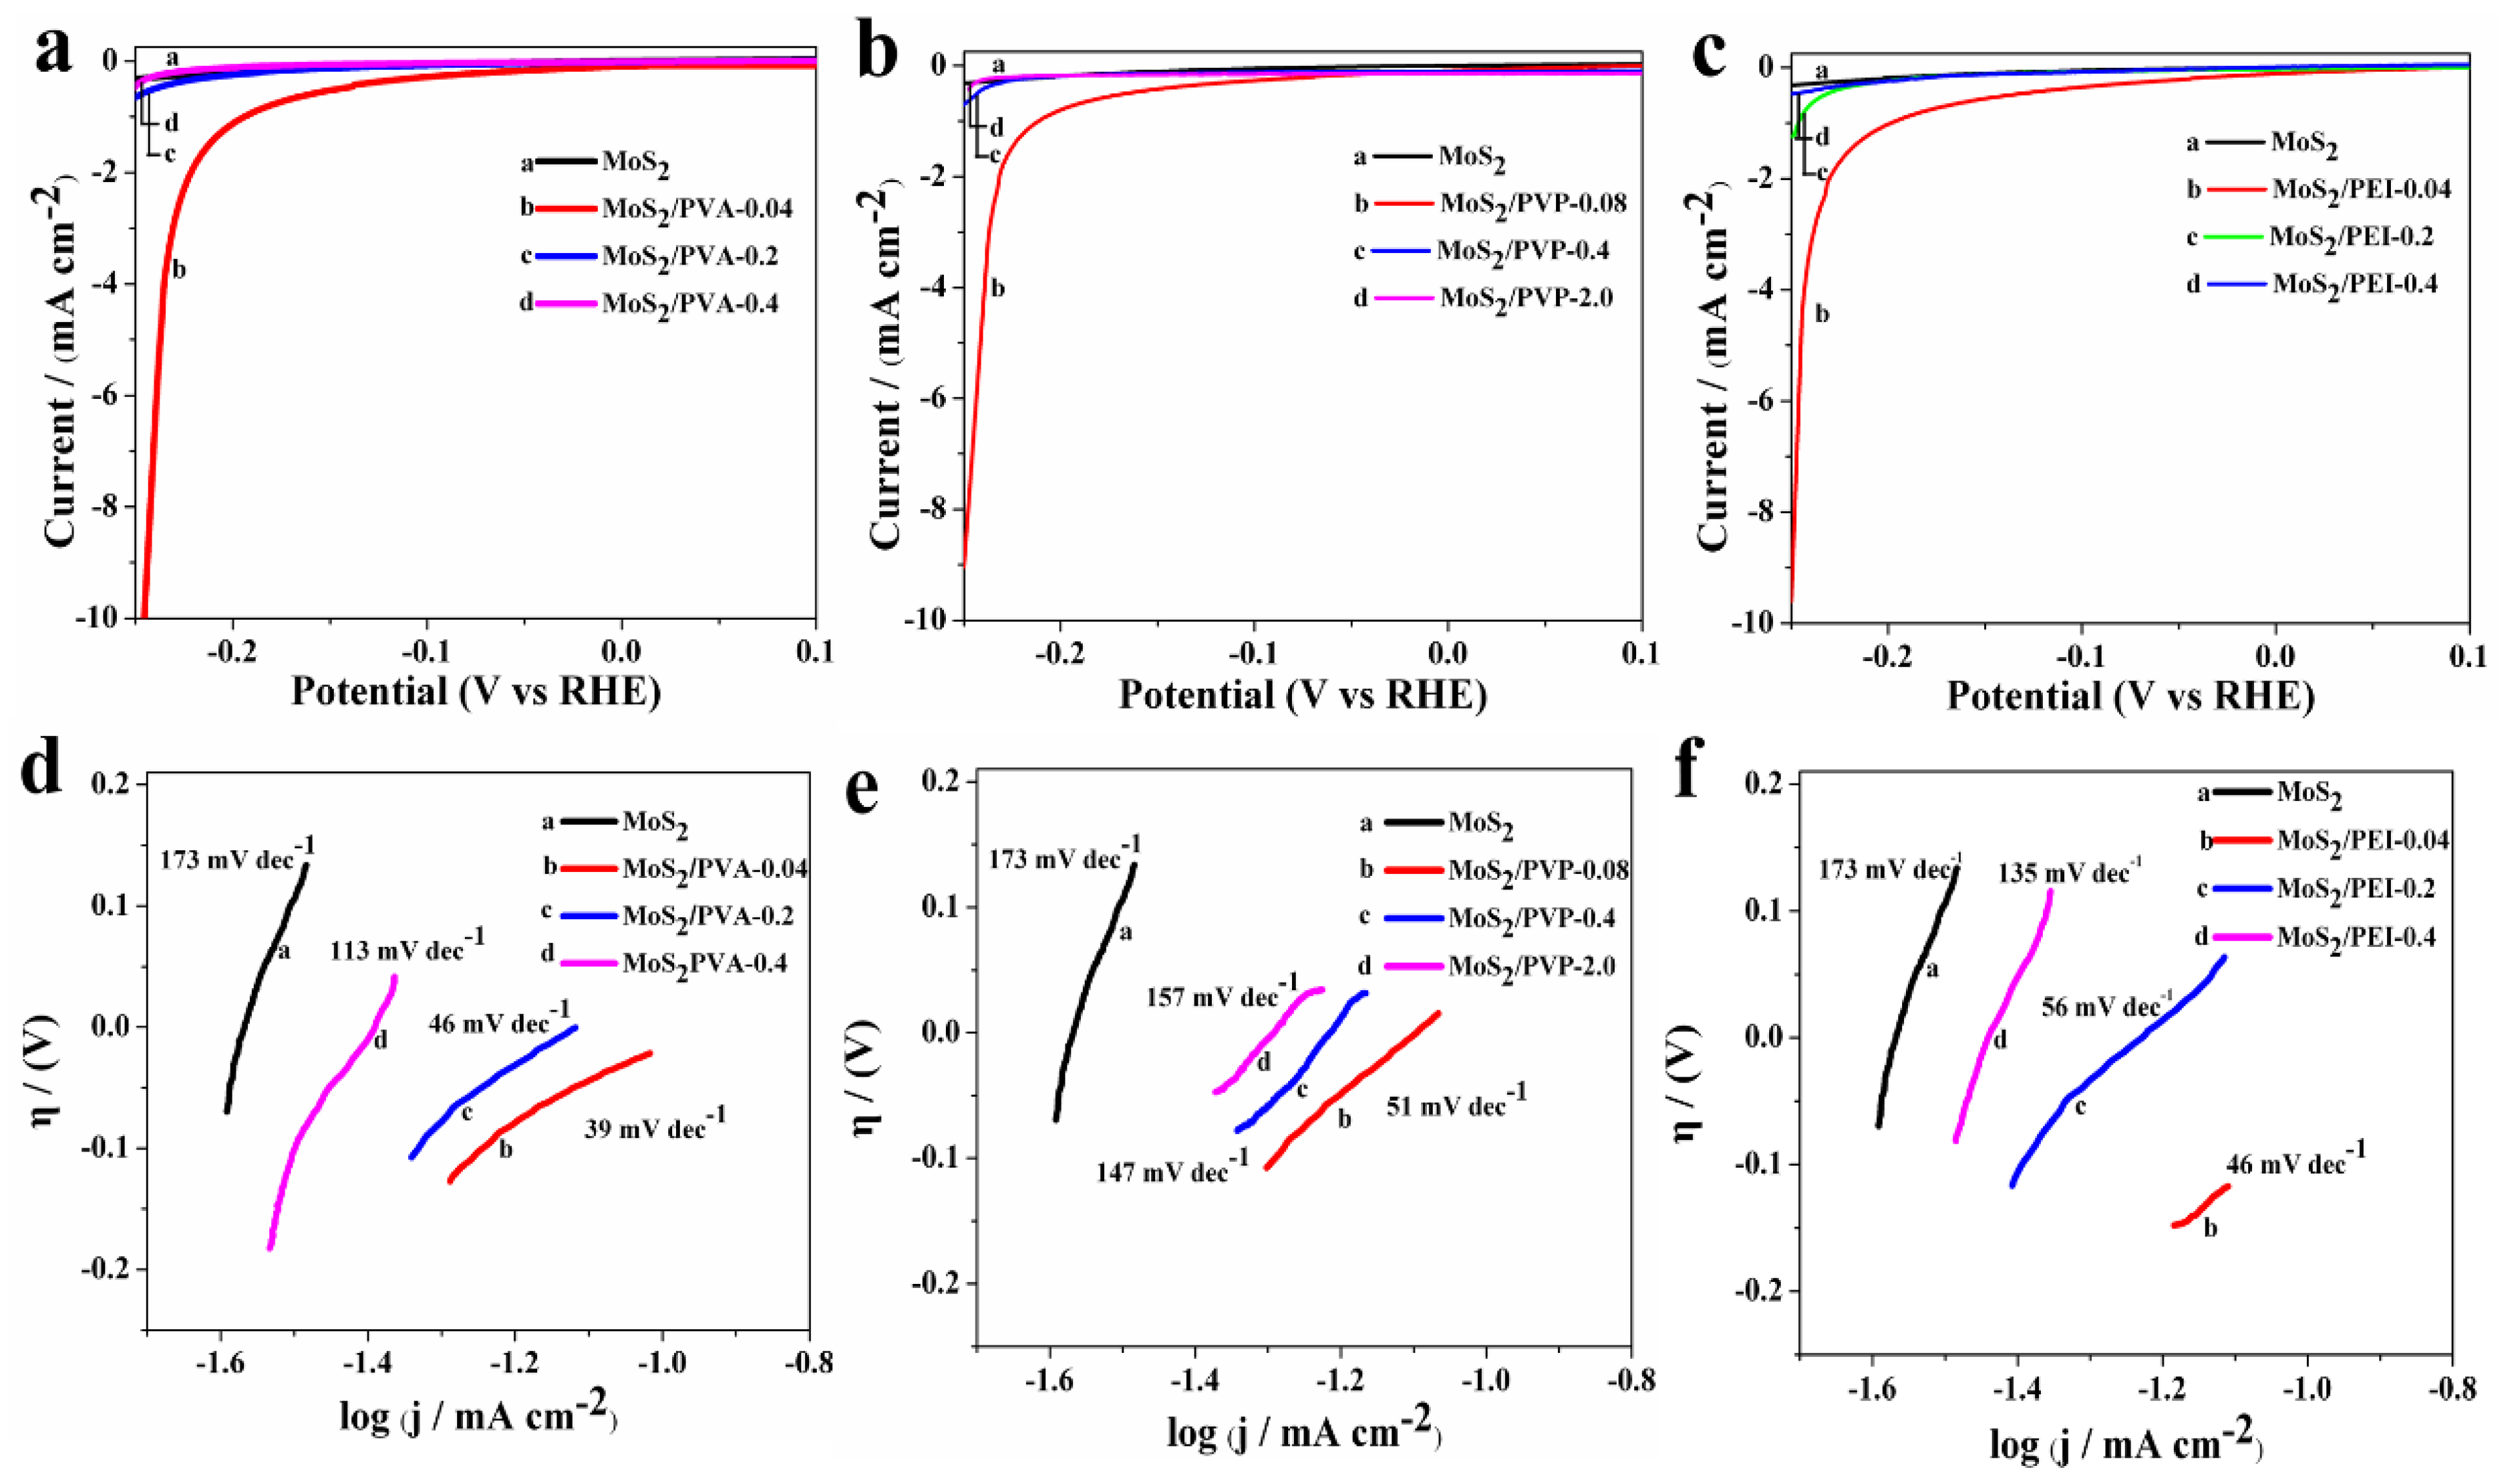
3.2.1. Linear Sweep Voltammetry (LSV)
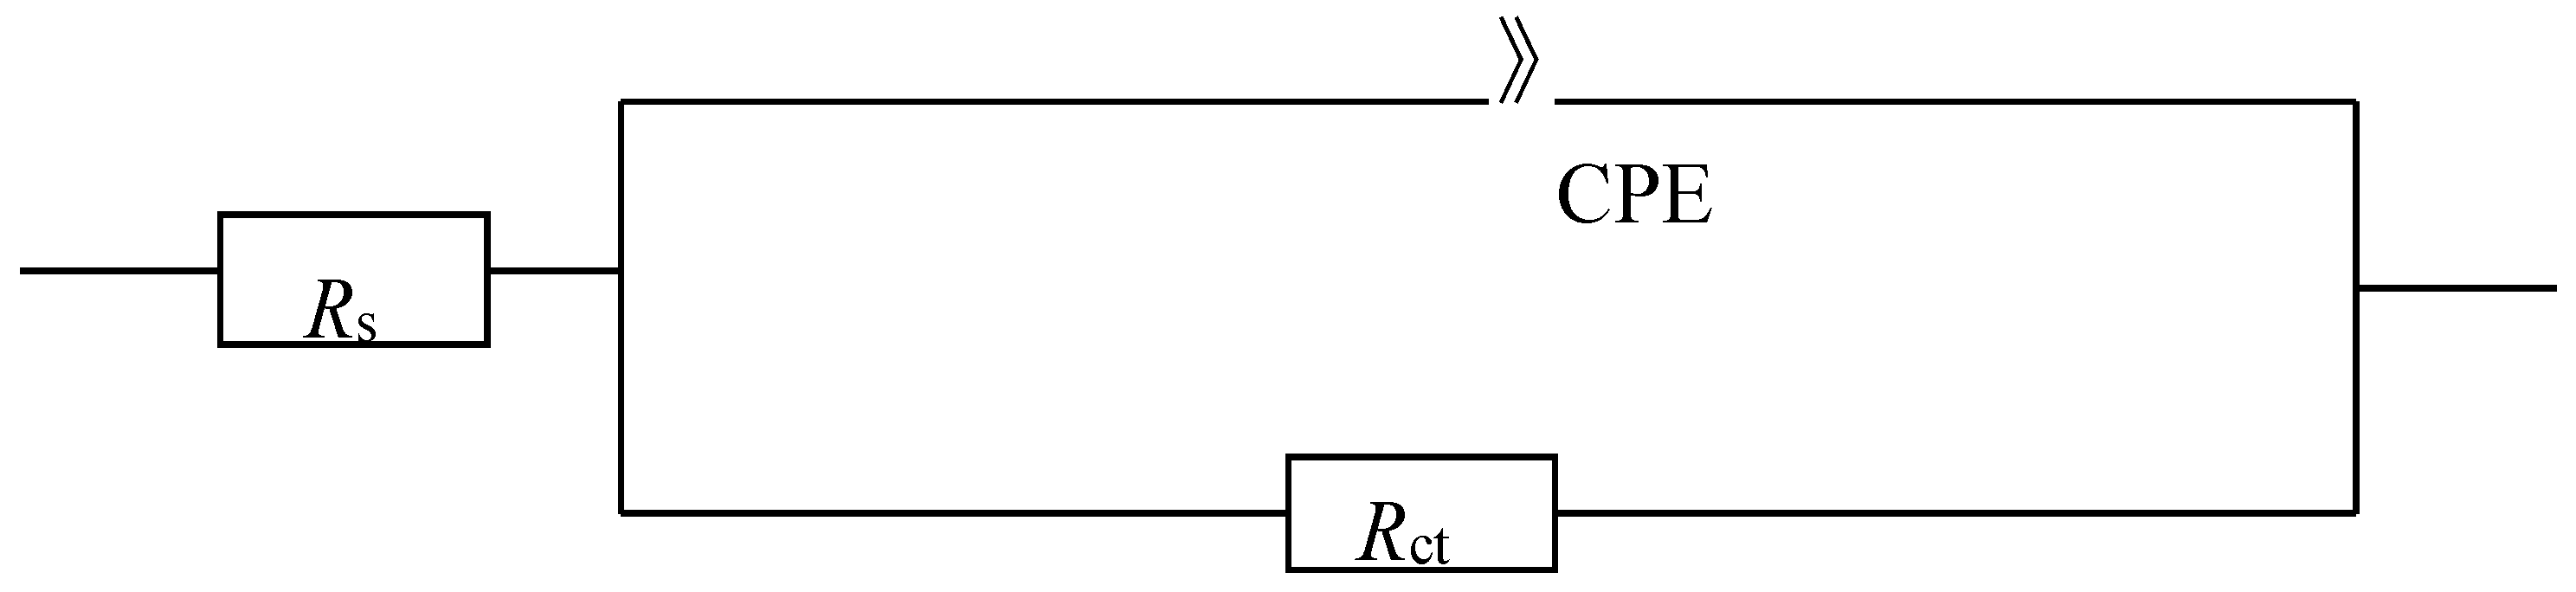
3.2.2. Electrochemical Impedance Spectroscopy (EIS)
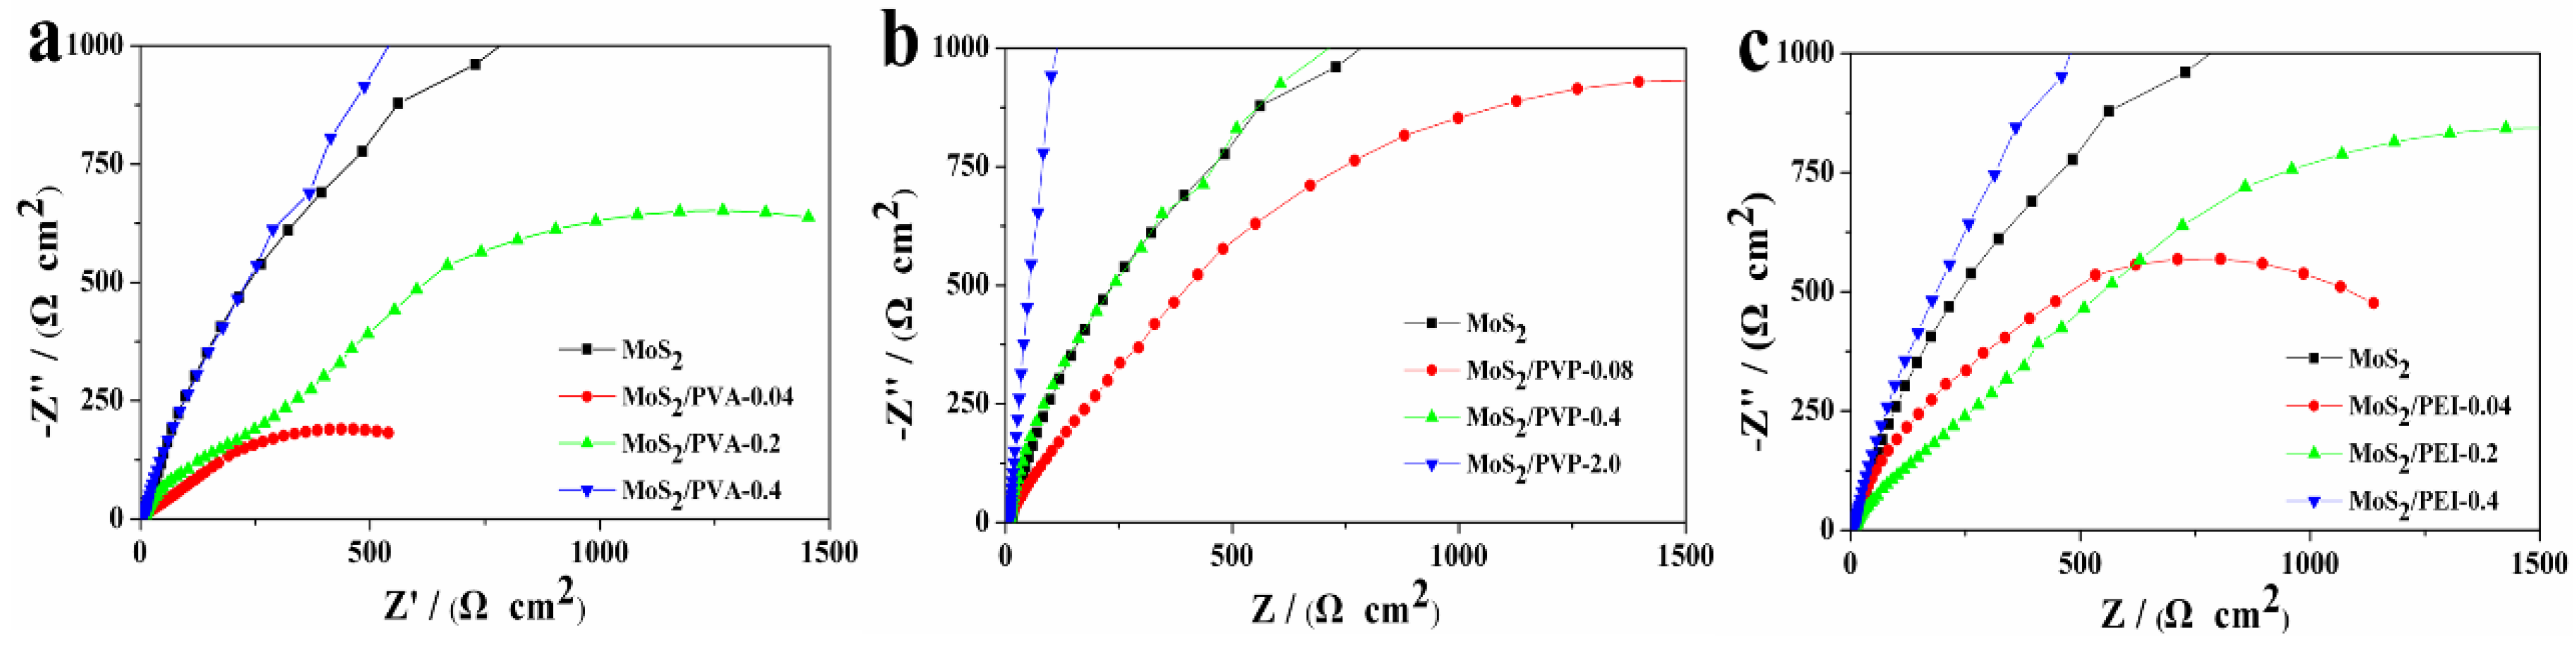
| Sample | Rs/(Ω·cm2) | Rct/(kΩ·cm2) | Y0/(mS·s·cm−2) | n | Cdl/(mF·cm−2) | i0/(×10−5mA·cm−2) |
|---|---|---|---|---|---|---|
| MoS2 | 6.13 | 7.55 | 0.16 | 0.67 | 0.29 | 0.50 |
| MoS2/PVA–0.04 | 4.87 | 0.84 | 1.00 | 0.52 | 2.13 | 5.89 |
| MoS2/PVA–0.2 | 5.24 | 1.96 | 0.25 | 0.72 | 0.64 | 1.82 |
| MoS2/PVA–0.4 | 5.86 | 6.05 | 0.19 | 0.79 | 0.39 | 0.54 |
| MoS2/PVP–0.08 | 5.72 | 2.62 | 0.27 | 0.71 | 0.85 | 1.38 |
| MoS2/PVP–0.4 | 6.54 | 3.04 | 0.20 | 0.87 | 0.40 | 0.97 |
| MoS2/PVP–2.0 | 7.58 | 6.23 | 0.02 | 0.81 | 0.34 | 0.51 |
| MoS2/PEI–0.04 | 6.22 | 1.45 | 0.30 | 0.83 | 0.87 | 2.14 |
| MoS2/PEI–0.2 | 6.45 | 2.47 | 0.21 | 0.66 | 0.62 | 1.58 |
| MoS2/PEI–0.4 | 5.71 | 6.18 | 0.20 | 0.80 | 0.37 | 0.52 |
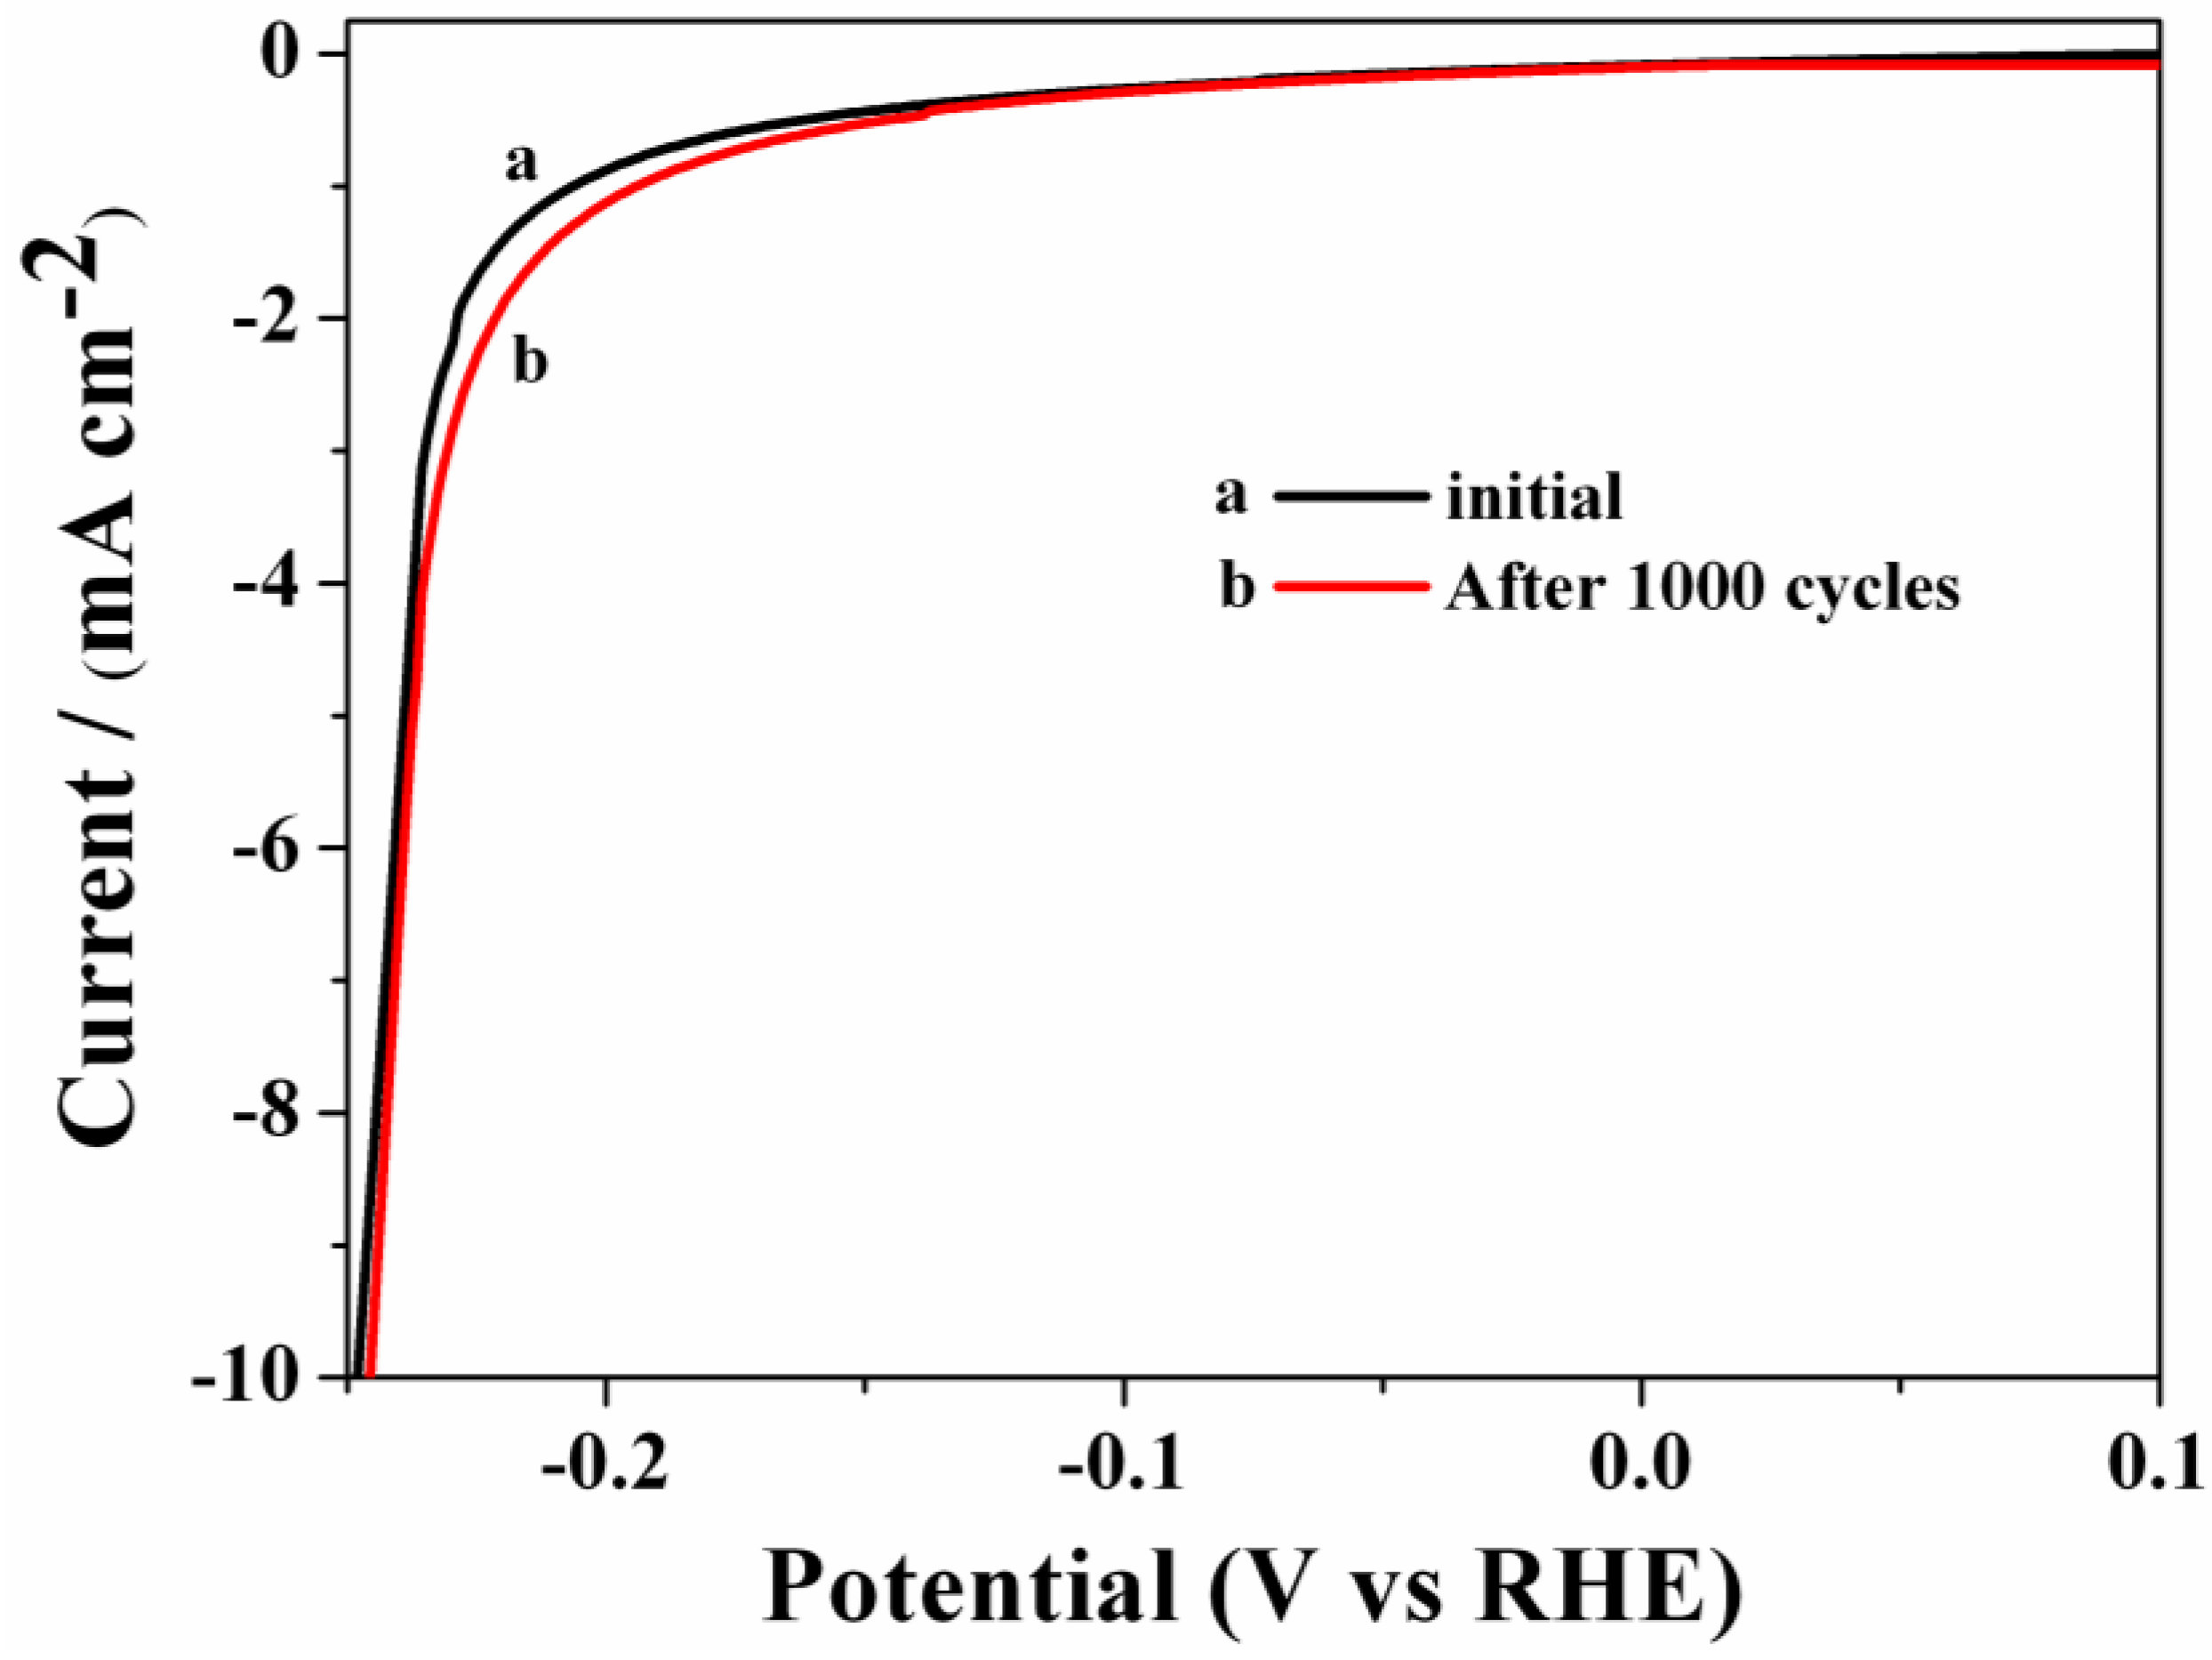
3.3. Stability
4. Conclusions
Acknowledgements
Author Contributions
Conflicts of Interest
References
- Mallouk, T.E. Water electrolysis: Divide and conquer. Nat. Chem. 2013, 5, 362–363. [Google Scholar] [CrossRef] [PubMed]
- Raimondi, F.; Scherer, G.G.; Kötz, R.; Wokaun, A. Nanoparticles in energy technology: Examples from electrochemistry and catalysis. Angew. Chem. Int. Ed. 2005, 44, 2190–2209. [Google Scholar] [CrossRef] [PubMed]
- Liu, Y.; Kelly, T.G.; Chen, J.G.G.; Mustain, W.E. Metal carbides as alternative electrocatalyst supports. ACS Catal. 2013, 3, 1184–1194. [Google Scholar] [CrossRef] [PubMed]
- Hinnemann, B.; Moses, P.G.; Bonde, J.; Jørgensen, K.P.; Nielsen, J.H.; Honch, S.; Chorkendorff, I.; Nørskov, J.K. Biornimetic hydrogen evolution: MoS2 nanoparticles as catalyst for hydrogen evolution. J. Am. Chem. Soc. 2005, 127, 5308–5309. [Google Scholar] [CrossRef] [PubMed]
- Dresselhaus, M.S.; Thomas, I.L. Alternative energy technologies. Nature 2001, 414, 332–337. [Google Scholar] [CrossRef] [PubMed]
- Antolini, E. Palladium in fuel cell catalysis. Energy Environ. Sci. 2009, 2, 915–931. [Google Scholar] [CrossRef]
- Tang, H.; Dou, K.P.; Kaun, C.-C.; Kuang, Q.; Yang, S.H. MoSe2 nanosheets and their graphene hybrids: Synthesis, characterization and hydrogen evolution reaction studies. J. Mater. Chem. A 2014, 2, 360–364. [Google Scholar] [CrossRef]
- Chen, Z.B.; Cummins, D.; Reinecke, B.N.; Clark, E.; Sunkara, M.K.; Jaramillo, T.F. Core-shell MoO3–MoS2 nanowires for hydrogen evolution: A functional design for electrocatalytic materials. Nano Lett. 2011, 11, 4168–4175. [Google Scholar] [CrossRef] [PubMed]
- Cheng, L.; Huang, W.J.; Gong, Q.F.; Liu, C.H.; Liu, Z.; Li, Y.G.; Dai, H.J. Ultrathin WS2 nanoflakes as a high-performance electrocatalyst for the hydrogen evolution reaction. Angew. Chem. Int. Ed. 2014, 53, 7860–7863. [Google Scholar] [CrossRef] [PubMed]
- Vrubel, H.; Merki, D.; Hu, X. Hydrogen evolution catalyzed by MoS3 and MoS2 particles. Energy Environ. Sci. 2012, 5, 6136–6144. [Google Scholar] [CrossRef]
- Karunadasa, H.I.; Montalvo, E.; Sun, Y.; Majda, M.; Long, J.R.; Chang, C.J. A molecular MoS2 edge site mimic for catalytic hydrogen generation. Science 2012, 335, 698–702. [Google Scholar] [CrossRef] [PubMed]
- Jaramillo, T.F.; Jørgensen, K.P.; Bonde, J.; Nielsen, J.H.; Horch, S.; Chorkendorff, I. Identification of active edge sites for electrochemical H2 evolution from MoS2 nanocatalysts. Science 2007, 317, 100–102. [Google Scholar] [CrossRef] [PubMed]
- Bonde, J.; Moses, P.G.; Jaramillo, T.F.; Nørskov, J.K.; Chorkendorff, I. Hydrogen evolution on nano-particulate transition metal sulfides. Faraday Discuss. 2009, 140, 219–231. [Google Scholar] [CrossRef]
- Liu, N.; Yang, L.C.; Wang, S.N.; Zhong, Z.W.; He, S.N.; Yang, X.Y.; Gao, Q.S.; Tang, Y. Ultrathin MoS2 nanosheets growing within an in-situ-formed template as efficient electrocatalysts for hydrogen evolution. J. Power Sources 2015, 275, 588–594. [Google Scholar] [CrossRef]
- Zhou, T.; Yin, H.; Liu, Y.; Chai, Y.; Zhang, J.; Liu, C. Synthesis, characterization and HDS activity of carbon-containing Ni–Mo sulfide nano-spheres. Catal. Lett. 2010, 134, 343–350. [Google Scholar] [CrossRef]
- Merki, D.; Vrubel, H.; Rovelli, L.; Fierro, S.; Hu, X. Fe, Co, and Ni ions promote the catalytic activity of amorphous molybdenum sulfide films for hydrogen evolution. Chem. Sci. 2012, 3, 2515–2525. [Google Scholar] [CrossRef]
- Jaramillo, T.F.; Bonde, J.; Zhang, J.; Ooi, B.-L.; Andersson, K.; Ulstrup, J.; Chorkendorff, I. Hydrogen evolution on supported incomplete cubane-type [Mo3S4]4+ electrocatalysts. J. Phys. Chem. C 2008, 112, 17492–17498. [Google Scholar] [CrossRef]
- Bian, X.J.; Zhu, J.; Liao, L.; Scanlon, M.D.; Ge, P.Y.; Ji, C.; Girault, H.H.; Liu, B.H. Nanocomposite of MoS2 on ordered mesoporous carbon nanospheres: A highly active catalyst for electrochemical hydrogen evolution. Electrochem. Commun. 2012, 22, 128–132. [Google Scholar] [CrossRef]
- Zheng, X.L.; Xu, J.B.; Yan, K.Y.; Wang, H.; Wang, Z.L.; Yang, S.H. Space-confined growth of MoS2 nanosheets within graphite: The layered hybrid of MoS2 and graphene as an active catalyst for hydrogen evolution reaction. Chem. Mater. 2014, 26, 2344–2353. [Google Scholar] [CrossRef]
- Li, Y.G.; Wang, H.L.; Xie, L.M.; Liang, Y.Y.; Hong, G.S.; Dai, H.J. MoS2 nanoparticles grown on graphene: An advanced catalyst for the hydrogen evolution reaction. J. Am. Chem. Soc. 2011, 133, 7296–7299. [Google Scholar] [CrossRef] [PubMed]
- Wang, D.Z.; Pan, Z.; Wu, Z.Z.; Wang, Z.P.; Liu, Z.H. Hydrothermal synthesis of MoS2 nanoflowers as highly efficient hydrogen evolution reaction catalysts. J. Power Sources 2014, 264, 229–234. [Google Scholar] [CrossRef]
- Kong, D.S.; Wang, H.T.; Cha, J.J.; Pasta, M.; Koski, K.J.; Yao, J.; Cui, Y. Synthesis of MoS2 and MoSe2 films with vertically aligned layers. Nano Lett. 2013, 13, 1341–1347. [Google Scholar] [CrossRef] [PubMed]
- Tsai, C.; Pedersen, F.A.; Nørskov, J.K. Tuning the MoS2 edge-site activity for hydrogen evolution via support interactions. Nano Lett. 2014, 14, 1381–1387. [Google Scholar] [CrossRef] [PubMed]
- Lukowski, M.A.; Daniel, A.S.; Meng, F.; Forticaux, A.; Li, L.S.; Jin, S. Enhanced hydrogen evolution catalysis from chemically exfoliated metallic MoS2 nanosheets. J. Am. Chem. Soc. 2013, 135, 10274–10277. [Google Scholar] [CrossRef] [PubMed]
- Shi, J.P.; Ma, D.L.; Han, G.-F.; Zhang, Y.; Ji, Q.Q.; Gao, T.; Sun, J.Y.; Song, X.J.; Li, C.; Zhang, Y.S.; et al. Controllable growth and transfer of monolayer MoS2 on Au foils and its potential application in hydrogen evolution reaction. ACS Nano 2014, 8, 10196–10204. [Google Scholar] [CrossRef] [PubMed]
- Bissessur, R.; Gallant, D.; Brüning, R. Novel nanocomposite material consisting of poly[oxymethylene-(oxyethylene)] and molybdenum disulfide. Mater. Chem. Phys. 2003, 82, 316–320. [Google Scholar] [CrossRef]
- Lin, B.-Z.; Ding, C.; Xu, B.-H.; Chen, Z.-J.; Chen, Y.-L. Preparation and characterization of polythiophene/molybdenum disulfide intercalation material. Mater. Res. Bull. 2009, 44, 719–723. [Google Scholar] [CrossRef]
- Wu, Z.Z.; Fang, B.Z.; Wang, Z.P.; Wang, C.L.; Liu, Z.H.; Liu, F.Y.; Wang, W.; Alfantazi, A.; Wang, D.Z.; Wilkinson, D.P. MoS2 nanosheets: A designed structure with high active site density for the hydrogen evolution reaction. ACS Catal. 2013, 3, 2101–2107. [Google Scholar] [CrossRef]
- Wang, H.T.; Lu, Z.Y.; Xu, S.C.; Kong, D.S.; Cha, J.J.; Zheng, G.Y.; Hsu, P.-C.; Yan, K.; Bradshaw, D.; Prinz, F.B.; et al. Electrochemical tuning of vertically aligned MoS2 nanofilms and its application in improving hydrogen evolution reaction. Proc. Natl. Acad. Sci. USA 2013, 110, 19701–19706. [Google Scholar] [CrossRef] [PubMed]
- Lee, C.G.; Yan, H.G.; Brus, L.E.; Heinz, T.F.; Hone, J.; Ryu, S. Anomalous lattice vibrations of single and few-layer MoS2. ACS Nano 2010, 4, 2695–2700. [Google Scholar] [CrossRef] [PubMed]
- Yu, Y.F.; Huang, S.Y.; Li, Y.P.; Steinmann, S.N.; Yang, W.T.; Cao, L.Y. Layer-dependent electrocatalysis of MoS2 for hydrogen evolution. Nano Lett. 2014, 14, 553–558. [Google Scholar] [CrossRef] [PubMed]
- Peresin, M.S.; Vesterinen, A.-H.; Habibi, Y.; Johansson, L.-S.; Pawlak, J.J.; Nevzorov, A.A.; Rojas, O.J. Crosslinked PVA nanofibers reinforced with cellulose nanocrystals: Water interactions and thermomechanical properties. J. Appl. Polym. Sci. 2014. [Google Scholar] [CrossRef]
- Prasanth, S.; Irshad, P.; Raj, D.R.; Vineeshkumar, T.V.; Philip, R.; Sudarsanakumar, C. Nonlinear optical property and fluorescence quenching behavior of PVP capped ZnS nanoparticles co-doped with Mn2+ and Sm3+. J. Lumin. 2015, 166, 167–175. [Google Scholar] [CrossRef]
- Popescu, L.M.; Piticescu, R.M.; Petriceanu, M.; Ottaviani, M.F.; Cangiotti, M.; Vasile, E.; Dîrtu, M.M.; Wolff, M.; Garcia, Y.; Schinteie, G.; et al. Hydrothermal synthesis of nanostructured hybrids based on iron oxide and branched PEI polymers. Influence of high pressure on structure and morphology. Mater. Chem. Phys. 2015, 161, 84–95. [Google Scholar] [CrossRef]
- Merki, D.; Hu, X. Recent developments of molybdenum and tungsten sulfides as hydrogen evolution catalysts. Energy Environ. Sci. 2011, 4, 3878–3888. [Google Scholar] [CrossRef]
- Chang, Y.-H.; Nikam, R.D.; Lin, C.-T.; Huang, J.-K.; Tseng, C.-C.; Hsu, C.-L.; Cheng, C.-C.; Su, C.-Y.; Li, L.-J.; Chua, D.H.C. Enhanced electrocatalytic activity of MoSx on TCNQ-treated electrode for hydrogen evolution reaction. ACS Appl. Mater. Interfaces 2014, 6, 17679–17685. [Google Scholar] [CrossRef] [PubMed]
- Xie, J.F.; Zhang, J.J.; Li, S.; Grote, F.; Zhang, X.D.; Zhang, H.; Wang, R.X.; Lei, Y.; Pan, B.C.; Xie, Y. Controllable disorder engineering in oxygen-incorporated MoS2 ultrathin nanosheets for efficient hydrogen evolution. J. Am. Chem. Soc. 2013, 135, 17881–17888. [Google Scholar] [CrossRef] [PubMed]
- Voiry, D.; Salehi, M.; Silva, R.; Fujita, T.; Chen, M.W.; Asefa, T.; Shenoy, V.B.; Eda, G.; Chhowalla, M. Conducting MoS2 nanosheets as catalysts for hydrogen evolution reaction. Nano Lett. 2013, 13, 6222–6227. [Google Scholar] [CrossRef] [PubMed]
- Youssef, L.; Alain, D.; Jean-Claude, M. Electrocatalytic hydrogen evolution from molybdenum sulfide-polymer composite films on carbon electrodes. ACS Appl. Mater. Interfaces 2015, 7, 15866–15875. [Google Scholar]
- Heli, H.; Sattarahmady, N.; Jabbari, A.; Moosavi-Movahedi, A.A.; Hakimelahi, G.H.; Tsai, F.-Y. Adsorption of human serum albumin onto glassy carbon surface—Applied to albumin-modified electrode: Mode of protein-ligand interactions. J. Electroanal. Chem. 2007, 610, 67–74. [Google Scholar] [CrossRef]
- Alcaide, F.; Brillas, E.; Cabot, P.-L. EIS analysis of hydroperoxide ion generation in an uncatalyzed oxygen-diffusion cathode. J. Electroanal. Chem. 2003, 547, 61–73. [Google Scholar] [CrossRef]
© 2015 by the authors; licensee MDPI, Basel, Switzerland. This article is an open access article distributed under the terms and conditions of the Creative Commons Attribution license (http://creativecommons.org/licenses/by/4.0/).
Share and Cite
Zeng, X.; Niu, L.; Song, L.; Wang, X.; Shi, X.; Yan, J. Effect of Polymer Addition on the Structure and Hydrogen Evolution Reaction Property of Nanoflower-Like Molybdenum Disulfide. Metals 2015, 5, 1829-1844. https://doi.org/10.3390/met5041829
Zeng X, Niu L, Song L, Wang X, Shi X, Yan J. Effect of Polymer Addition on the Structure and Hydrogen Evolution Reaction Property of Nanoflower-Like Molybdenum Disulfide. Metals. 2015; 5(4):1829-1844. https://doi.org/10.3390/met5041829
Chicago/Turabian StyleZeng, Xianwen, Lijing Niu, Laizhou Song, Xiuli Wang, Xuanming Shi, and Jiayun Yan. 2015. "Effect of Polymer Addition on the Structure and Hydrogen Evolution Reaction Property of Nanoflower-Like Molybdenum Disulfide" Metals 5, no. 4: 1829-1844. https://doi.org/10.3390/met5041829
APA StyleZeng, X., Niu, L., Song, L., Wang, X., Shi, X., & Yan, J. (2015). Effect of Polymer Addition on the Structure and Hydrogen Evolution Reaction Property of Nanoflower-Like Molybdenum Disulfide. Metals, 5(4), 1829-1844. https://doi.org/10.3390/met5041829