Article

Optimizing Boron Content for Controlled Boride Formation in Fe–Ni–Cr–Cu–Si–B–C Alloy: A CALPHAD-Guided Experimental Study


by
Farida Kapsalamova
1,2,
Aliya Alimzhanova
1,*,
Akmaral Rakhym
1,3,*,
Gulnur Kanzhigit
1,2 and
Renat Beissenov
2
1
RSE “National Center on Complex Processing of Mineral Raw Materials of the Republic of Kazakhstan”, Almaty 050036, Kazakhstan
2
School of Materials Science and Green Technologies, Kazakh-British Technical University, Almaty 050000, Kazakhstan
3
Center of Physical Chemical Methods of Research and Analysis, Faculty of Chemistry and Chemical Technology, Al-Farabi Kazakh National University, Almaty 050012, Kazakhstan
*
Authors to whom correspondence should be addressed.
Metals 2026, 16(8), 889; https://doi.org/10.3390/met16080889
Submission received: 4 June 2026 / Revised: 2 July 2026 / Accepted: 7 July 2026 / Published: 10 August 2026

Abstract

A combined CALPHAD-guided thermodynamic and experimental approach was employed to investigate the influence of boron on phase evolution and microstructural development in the Fe–Ni–Cr–Cu–Si–B–C alloy system. Thermodynamic calculations were performed using Thermo-Calc (FE13-2025b) and the TTFe thermodynamic database. Vertical phase-diagram sections and response surface analysis were used to evaluate phase stability over the temperature range of 400–1500 °C and to identify temperature–composition domains favorable for the formation of strengthening phases. The calculations predicted complex multiphase equilibrium behavior involving boride-, carbide-, and silicide-containing phases. Within the investigated composition range, approximately 4 wt.% B provided a favorable balance between the metallic matrix and strengthening phases, while 638 °C corresponded to a thermodynamically favorable equilibrium phase constitution. Response surface analysis further demonstrated that temperature governs phase evolution, whereas boron primarily controls phase redistribution. The optimized alloy composition was characterized experimentally using scanning electron microscopy (SEM), wavelength dispersion spectroscopy (WDS), elemental mapping, and X-ray diffraction (XRD). The experimentally observed heterogeneous multiphase microstructure showed good agreement with the CALPHAD-predicted phase evolution at a qualitative level, demonstrating the usefulness of thermodynamic modeling for guiding alloy design. The proposed CALPHAD-guided workflow integrates thermodynamic modeling with targeted experimental characterization and provides a transferable framework for the accelerated design and optimization of complex Fe-based multicomponent alloys.

1. Introduction

Complex Fe-based multicomponent alloys have attracted considerable attention owing to their ability to combine multiple alloying elements, enabling the formation of diverse strengthening phases and providing attractive mechanical and tribological properties. Although high-entropy alloys (HEAs) represent an important subgroup of multicomponent alloys, many engineering Fe-based systems are intentionally designed with non-equiatomic compositions to achieve specific phase constitutions and tailored properties [1,2].
Among Fe-based multicomponent alloy systems, alloys containing Ni, Cr, Cu, Si, B, and C are of particular technological interest because of their relatively low cost, broad industrial applicability, and excellent potential for wear-resistant coatings [3,4,5,6,7,8]. In addition to metallic alloying elements such as Ni, Cr, and Cu, the incorporation of metalloids, including B, Si, and C, provides an effective route for strengthening through the formation of borides, silicides, and carbides [5,6,7,9]. These secondary phases can significantly enhance hardness, wear resistance, and thermal stability, making them particularly important in self-fluxing surfacing alloys and thermal spray materials [4,5,6,8]. However, the same multiphase reactions that improve these properties also increase the thermodynamic and kinetic complexity of the alloy system [5,7,9].
The Fe–Ni–Cr–Cu–Si–B–C alloy system is a representative example of this complexity. Depending on its composition and thermal history, it may consist of Fe-rich solid solutions together with various borides, carbides, silicides, and metastable intermediate phases [5,6,9]. The balance among these constituents strongly influences the resulting microstructure and, consequently, the service performance of the alloy [4,7,8]. Therefore, the rational design of such materials requires a thorough understanding of phase equilibria, phase transformations, and composition–temperature relationships [7,9].
Experimental investigation alone is often insufficient for this purpose, as the direct determination of phase diagrams and thermodynamic properties in multicomponent systems is time-consuming, expensive, and frequently incomplete [7,9]. Therefore, computational thermodynamics has become an indispensable tool in modern alloy design and development [7,9,10,11]. In particular, the CALPHAD (CALculation of PHAse Diagrams) approach enables the prediction of equilibrium and metastable phase formation by minimizing the Gibbs free energy using assessed thermodynamic databases [9,10,11]. This methodology is widely employed to construct phase diagrams, estimate phase fractions, and optimize alloy compositions prior to experimental investigation [9,10,11].
Nevertheless, reliable prediction of Fe-based multicomponent alloys enriched with B, Si, and C remains challenging. Strong chemical interactions, possible short-range ordering, non-ideal solution behavior, and the simultaneous formation of multiple competing hard phases may reduce the predictive accuracy of conventional thermodynamic models and available databases [5,7,9]. In addition, the relationship between thermodynamically predicted phase equilibria and the experimentally observed phase constitutions remains insufficiently understood for many practical alloy systems [4,5,6].
For coating and surfacing applications, this issue is particularly important because the distribution of hard boride- and carbide-containing phases within a metallic matrix directly governs hardness, adhesion, crack resistance, and wear performance [8]. Therefore, a combined computational–experimental approach is required to establish reliable composition–microstructure relationships and identify optimal processing conditions [5,9].
Although numerous studies have investigated boron-containing Fe-based alloys, the combined influence of boron content and processing temperature on phase evolution and microstructure development in the Fe–Ni–Cr–Cu–Si–B–C system has not been systematically established. In particular, quantitative composition–temperature relationships governing phase redistribution between the metallic matrix and strengthening phases remain largely unexplored, while experimental assessment of CALPHAD predictions for such multicomponent alloys is still limited.
To address this gap, the present study investigates the influence of boron content on phase evolution in the Fe–Ni–Cr–Cu–Si–B–C alloy system using a combined CALPHAD–experimental approach. Thermodynamic calculations performed in Thermo-Calc were used to evaluate phase stability over a wide temperature range and varying boron concentrations, identify favorable composition–temperature domains, and guide the selection of alloy composition for subsequent experimental characterization by XRD, SEM, WDS, and elemental mapping [9,10,11,12,13].
Unlike previous studies that primarily report either thermodynamic simulations or experimental observations, the present work integrates CALPHAD modeling, response surface methodology, and complementary experimental characterization to establish quantitative composition–temperature relationships and provide a transferable workflow for the rational design of multicomponent Fe-based alloys.

2. Materials and Methods

2.1. Thermodynamic Modeling

Thermodynamic calculations of the Fe–Ni–Cr–Cu–Si–B–C system were performed using Thermo-Calc software (FE-13 2025b) based on the CALPHAD approach with the TTFe database, which was selected because it provides thermodynamic descriptions for all principal elements of the investigated alloy system (Fe, Ni, Cr, Cu, Si, B, and C). Despite its broad applicability, uncertainties may remain for highly alloyed boron-containing systems owing to the limited description of higher-order interactions involving boride phases. Therefore, the CALPHAD predictions were interpreted in conjunction with the experimental characterization.
Phase equilibria, phase fractions, and elemental distributions were calculated as functions of temperature. All thermodynamic calculations were performed under equilibrium conditions using Gibbs free-energy minimization. Accordingly, the predicted phase equilibria represent equilibrium reference states for the investigated alloy system.
Boron was selected as the only variable compositional parameter because it is the principal boride-forming element in the Fe–Ni–Cr–Cu–Si–B–C alloy system and plays a dominant role in the formation of strengthening phases. To isolate its specific effect on phase evolution and microstructure development, the concentrations of all other alloying elements were kept constant throughout the study. This approach enabled a systematic evaluation of the influence of boron while minimizing the effects of compositional interactions.
Vertical phase-diagram sections were constructed to analyze phase evolution over the temperature range of 638–1646 °C. Complete melting of the alloy was predicted at approximately 1640 °C. According to the equilibrium calculations, cooling below approximately 1100 °C resulted in the formation of multiphase structures containing Me2B, carbides, and silicides.

2.2. Powder Preparation, Processing, and Coating Deposition

The Fe–Ni–Cr–Cu–Si–B–C alloy with a nominal composition of 20Fe–21Ni–18Cr–22Cu–10Si–4B–5C (wt.%) was prepared by mechanically activating a powder mixture in a planetary mill (MPP-2-1K, TTD, Saint Petersburg, Russia). Boron was introduced as a nickel–boron master alloy (NiB15), whereas Fe, Ni, Cr, Cu, Si, and C were added as elemental powders. Mechanical activation was carried out at a rotation speed of 1500 rpm, a ball-to-powder ratio of 10:1, and a filling degree of 80% for 20 min, producing composite particles with sizes of 10–20 μm.
The mechanically activated powder was subsequently agglomerated using a 5 wt.% aqueous liquid-glass solution as a temporary inorganic binder (1–2 wt.% relative to the powder mass). The resulting mixture was dried at 80–100 °C, granulated into particles of 0.5–2 mm, and sintered at 600 °C for 30 min to improve granule strength. The sintered granules were subsequently crushed, milled, and sieved to obtain a powder fraction of 40–160 μm for gas-flame spraying. Particles smaller than 40 μm tended to agglomerate during feeding, whereas particles larger than 160 μm caused instability of the powder feed. The liquid glass served solely as a temporary technological binder during powder preparation and was not considered part of the nominal alloy composition used for the CALPHAD calculations.
The prepared Fe–Ni–Cr–Cu–Si–B–C alloy powder was deposited onto Steel 45 substrates by gas-flame spraying. Prior to deposition, the substrate surface was grit-blasted and preheated to 100–150 °C. Spraying was performed at an oxygen pressure of 9.0 kg cm−2 and a propane pressure of 1.2 kg cm−2, with oxygen and propane flow rates of 750 and 700 L h−1, respectively, a powder feed rate of 50 g min−1, and a target coating thickness of 2–3 mm. During spraying, the powder particles were heated above 1460 °C, melted, and rapidly solidified upon impact with the substrate to form the coating.

2.3. Characterization of Samples

The morphology of the agglomerated granules, elemental distribution maps, and chemical composition of the powder after mechanical activation and agglomeration, as well as the microstructure of the deposited coatings, were examined using a scanning electron microscope (SEM, JEOL JXA-8230, JEOL LTD., Akishima, Tokyo, Japan) operated at an accelerating voltage of 25 kV and beam current up to 100 nA.
Powder samples were mounted on conductive carbon tape, whereas coating samples were prepared using standard metallographic procedures. Elemental analysis (B–U) was performed using JEOL EPMA software (EpmaWin Ver. 4.20) with standard quantification methods. The beam conditions were optimized to ensure adequate X-ray counting statistics.
Backscattered electron (BSE, COMPO) imaging was employed to enhance phase contrast. In addition, semi-quantitative wavelength-dispersive spectroscopy (WDS) was performed using a beam diameter of 200 μm, with carbon correction applied to account for the conductive tape.
WDS elemental mapping was performed at a magnification of ×350. Characteristic X-ray lines were selected based on the preliminary spectral analysis and measured using appropriate analyzing crystals.
Phase identification was performed using a D8 Advance X-ray diffractometer (Bruker, Ettlingen, Germany) with Cu Kα radiation operated at 40 kV and 40 mA. Diffraction patterns were collected over the 2θ range of 3–90° with a step size of 0.02°. The diffraction data were processed using EVA software (V5.0 (2023)), while phase identification was carried out using the Search/Match module and the PDF-2 database (Release 2020, ICDD).
Vickers microhardness (HV10) was measured on polished cross-sections of the coatings at room temperature using a dwell time of 10–15 s. The load was applied gradually and maintained throughout the measurement. The distance between adjacent indentations, as well as between each indentation and the sample edge, exceeded 2.5 times the indentation diagonal to avoid interaction effects. Microhardness was measured in the coating, diffusion zone, and steel substrate regions using 4 indentations for each region. The average values were reported together with the corresponding standard deviations.
The adhesion strength of the coatings was evaluated by pull-off testing using a custom-designed fixture mounted on a universal testing machine (CDM 10/9). The coated pin assembly was subjected to tensile loading until coating detachment occurred. The tests were performed at a crosshead speed of 15 mm min−1, and the maximum failure load was recorded. The pull-off adhesion strength was calculated from the failure load and pin cross-sectional area. Five independent measurements were performed, and the average adhesion value is reported.
All microstructural characterization was performed on a single coating specimen fabricated under the optimized processing conditions. Hardness and adhesion were evaluated by multiple independent measurements on the same specimen, and the reported values represent the corresponding averages.

3. Results and Discussion

3.1. Response Surface Analysis of Temperature–Boron Interaction

The effect of boron content on the phase constitution of the Fe–Ni–Cr–Cu–Si–B–C alloy system was investigated over the range of 2–5 wt.%. Boron was selected as the key alloying element because of its strong tendency to form borides [12,13], which play a critical role in determining the phase constitution and mechanical properties of the alloy [14].
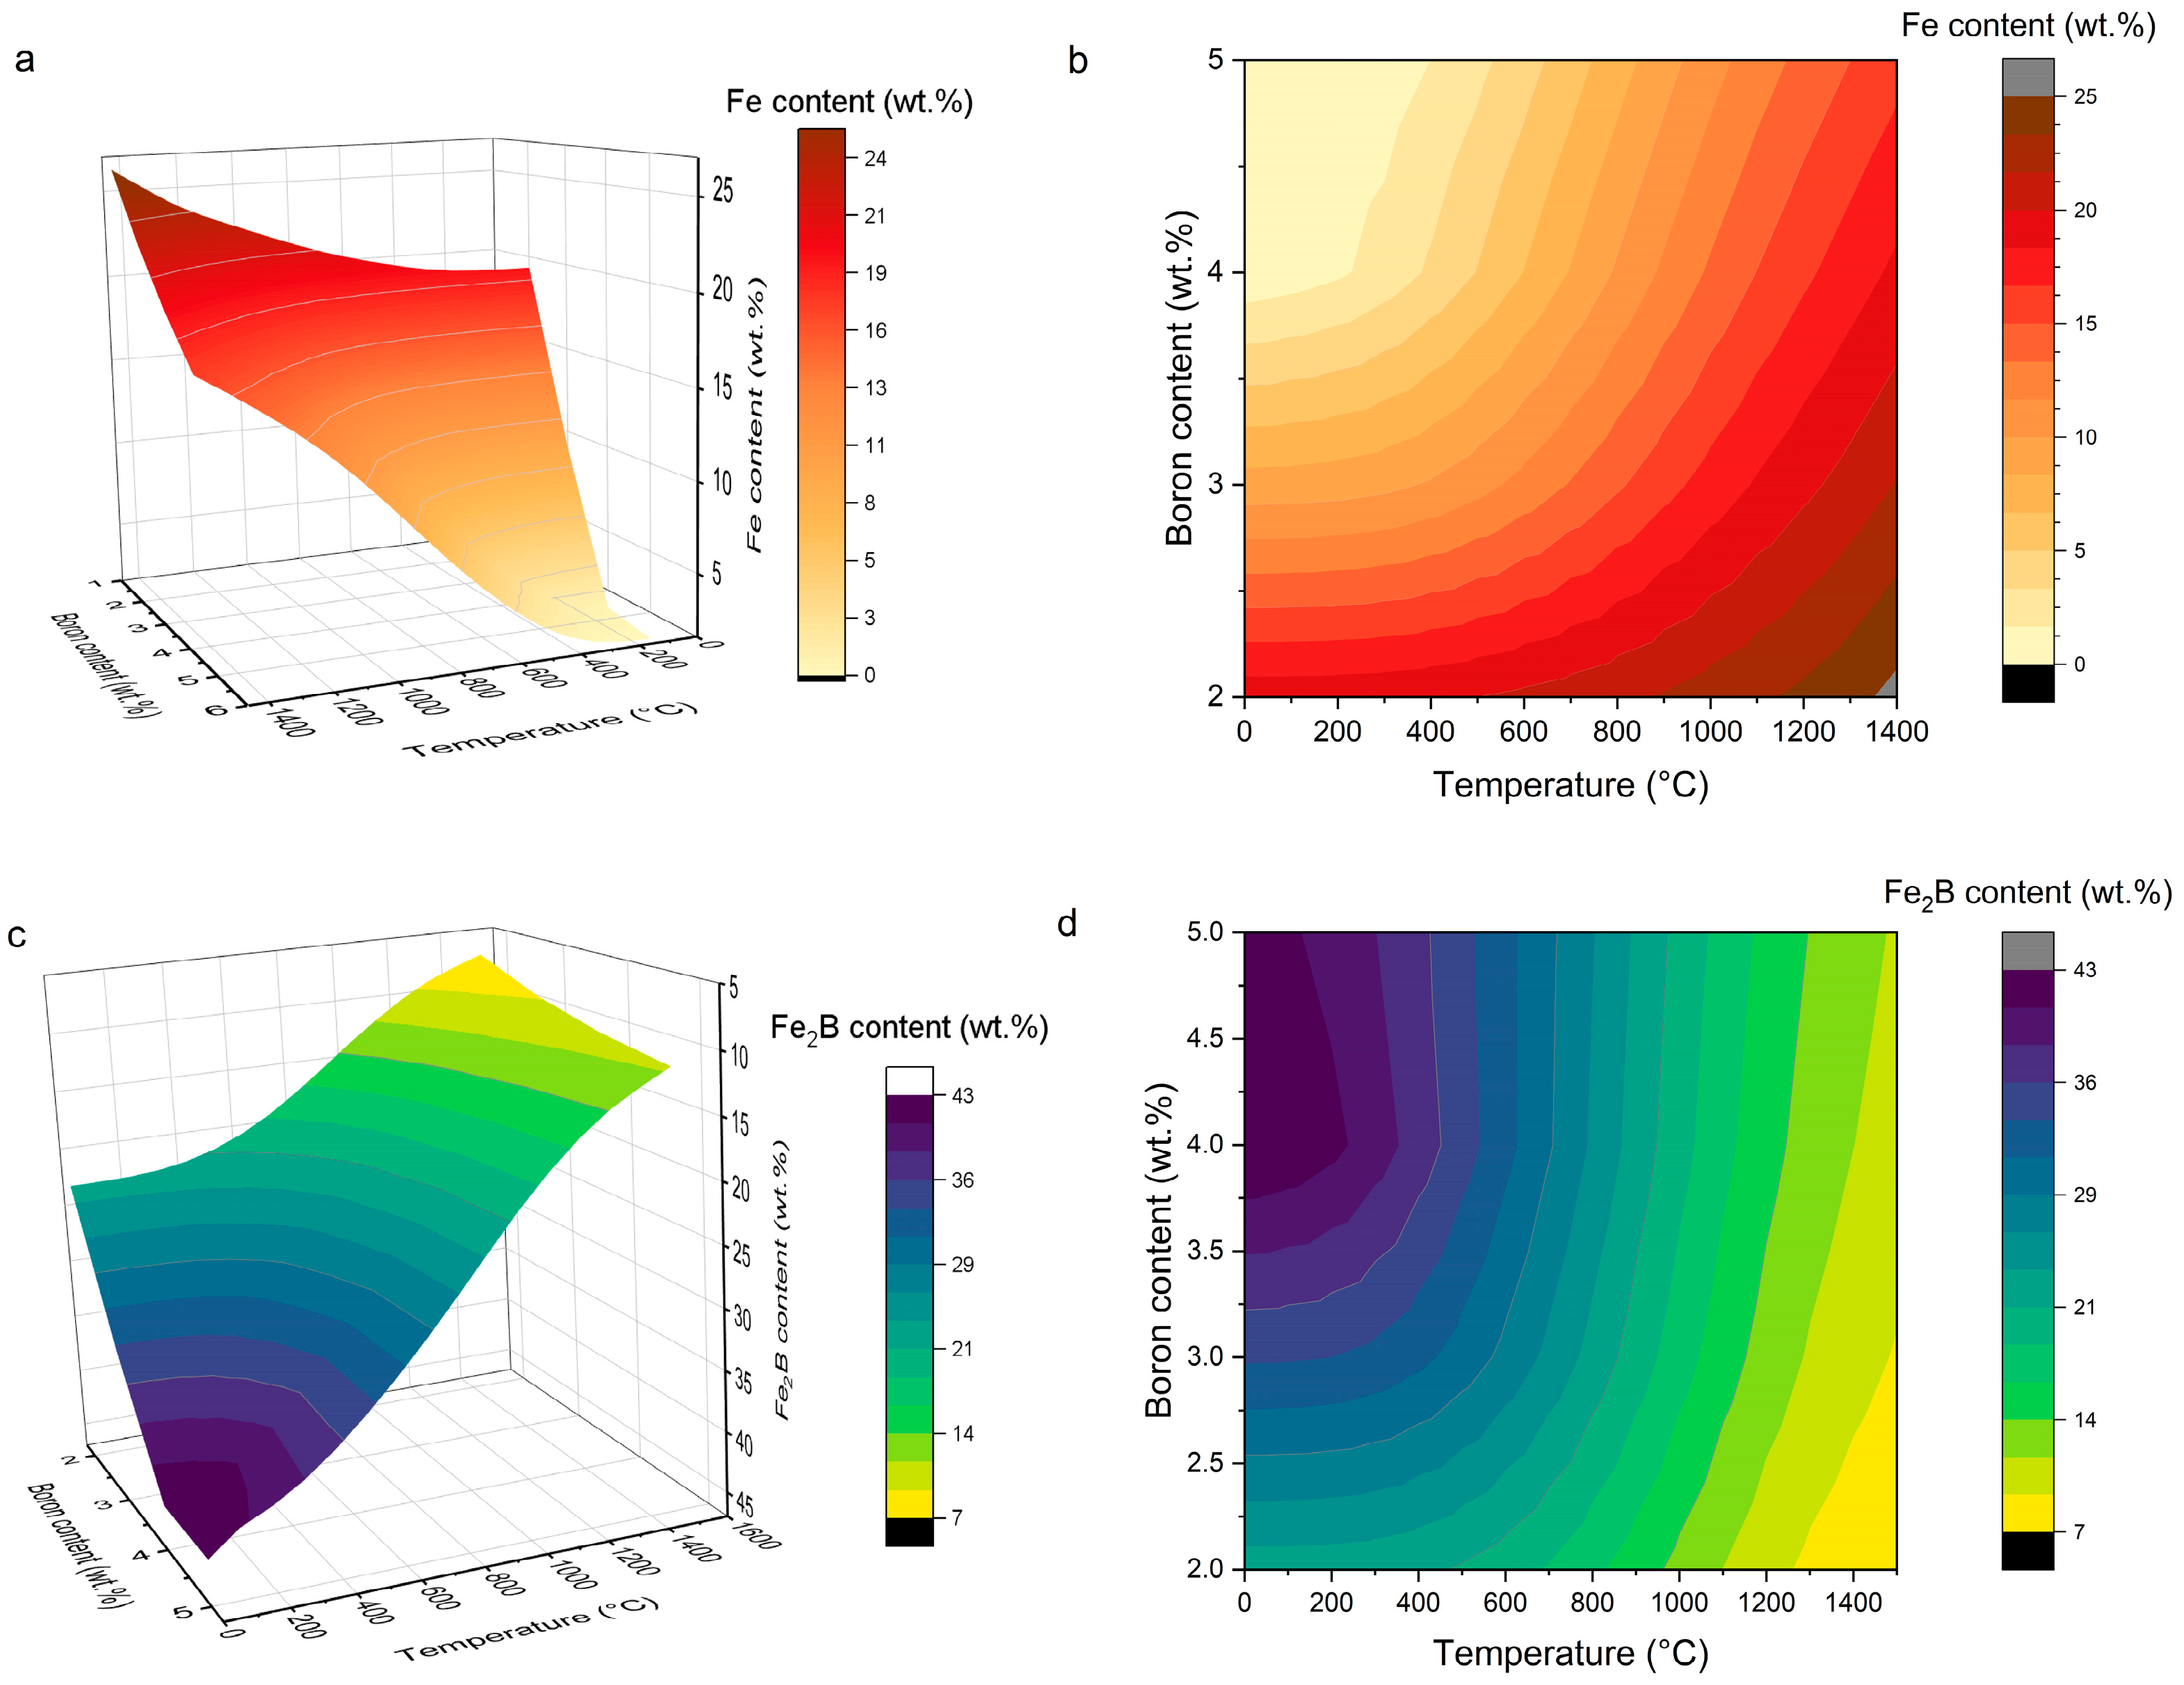
To evaluate the combined influence of boron content and temperature on phase evolution, response surface methodology was employed. The results are presented as three-dimensional response surfaces and corresponding contour plots (Figure 1).
The response surface for the metallic Fe phase (Figure 1a,b) indicates that temperature is the primary factor governing phase evolution and the fraction of metallic Fe, whereas boron content exerts a secondary, yet significant, influence. At lower temperatures and higher boron contents, the fraction of metallic Fe decreases, reflecting its consumption during the formation of secondary phases. In contrast, increasing temperature promotes stabilization of the metallic matrix, resulting in a higher fraction of metallic Fe.
In parallel, the response surface for the Fe2B phase (Figure 1c,d) exhibits the opposite trend. The predicted Fe2B fraction increases markedly with increasing boron content and decreasing temperature. This trend is consistent with the strong boride-forming tendency of boron under thermodynamically favorable conditions. At elevated temperatures, the predicted Fe2B fraction decreases, indicating reduced thermodynamic stability of the boride phases [15].
Comparison of the response surfaces for metallic Fe and Fe2B reveals a clear inverse relationship between the two phases. As the predicted Fe2B fraction increases, the fraction of metallic Fe decreases, consistent with thermodynamic phase redistribution during boride formation. These results further emphasize the key role of boron in controlling phase evolution in the Fe–Ni–Cr–Cu–Si–B–C alloy system.
The contour plots (Figure 1b,d) further illustrate the non-linear combined influence of temperature and boron content on phase stability. The contour patterns identify distinct composition–temperature domains associated with different equilibrium phase constitutions, indicating that a balanced multiphase structure is expected only within a limited range of processing conditions.
Within the investigated composition range, a boron content of approximately 4 wt.% provided the most favorable balance between retention of the metallic matrix and the formation of Fe2B borides according to the equilibrium CALPHAD calculations. This composition was therefore selected for subsequent experimental characterization.
Overall, thermodynamic calculations indicate that temperature is the primary factor governing phase evolution, whereas boron serves as the key compositional parameter controlling phase redistribution between the metallic matrix and boride-containing phases [16]. The identified composition–temperature–domains provide a quantitative thermodynamic framework for tailoring the phase constitution of the Fe–Ni–Cr–Cu–Si–B–C alloy system [17].
The predicted trends in phase evolution are expected to influence the equilibrium phase constitution and, consequently, the experimentally observed microstructure. In particular, the predicted increase in the Fe2B fraction at lower temperatures and higher boron contents is consistent with the formation of a heterogeneous microstructure comprising a Fe-based matrix and dispersed boride-containing phases [15]. Conversely, the decrease in the predicted boride fraction at elevated temperatures (>1000 °C) is associated with a higher fraction of the metallic matrix and a comparatively more homogeneous phase constitution.

3.2. Effect of Boron Content on Phase Composition

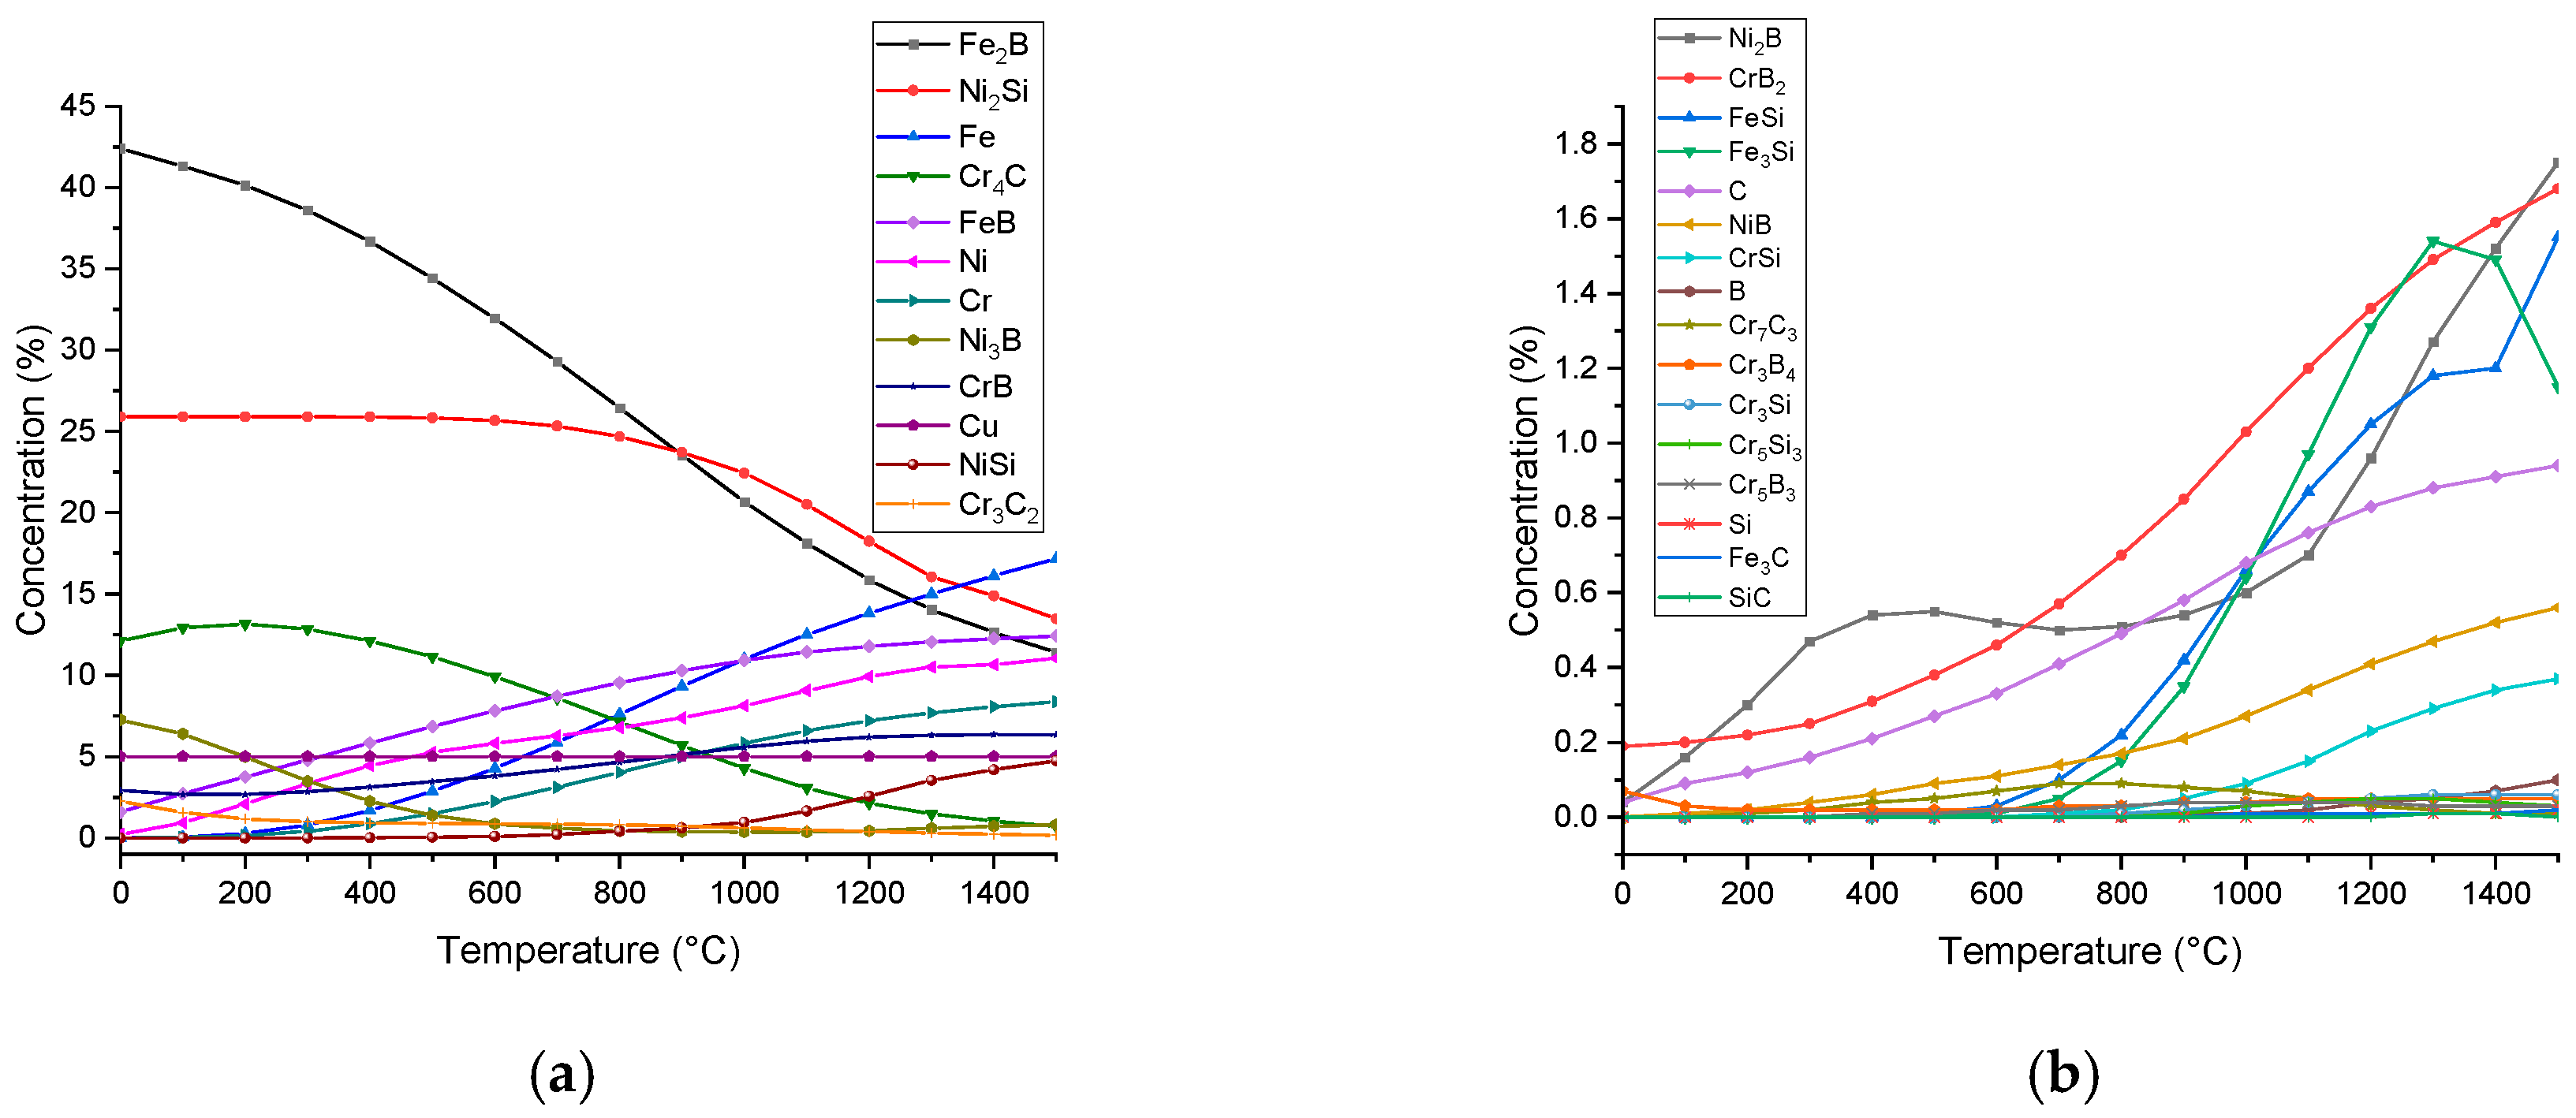
The calculated equilibrium phase constitution of the alloy with 4 wt.% B is presented in Figure 2. The calculations predict the formation of M2B borides, which become the dominant phase at lower temperatures. In addition, boron influences the stability of silicides and carbides, resulting in thermodynamic redistribution of alloying elements among the equilibrium phases [15].
Within the investigated composition range, a boron content of 4 wt.% provided the most favorable thermodynamic balance between retention of the metallic matrix and the formation of strengthening boride phases. This composition was therefore selected for subsequent experimental characterization, including microstructural analysis and measurements of coating microhardness and adhesion strength.
Conclusions regarding boron contents outside the investigated range should be regarded as qualitative thermodynamic predictions and require dedicated computational and experimental investigation.

3.3. Thermodynamic Analysis of the Fe–Ni–Cr–Cu–Si–B–C System

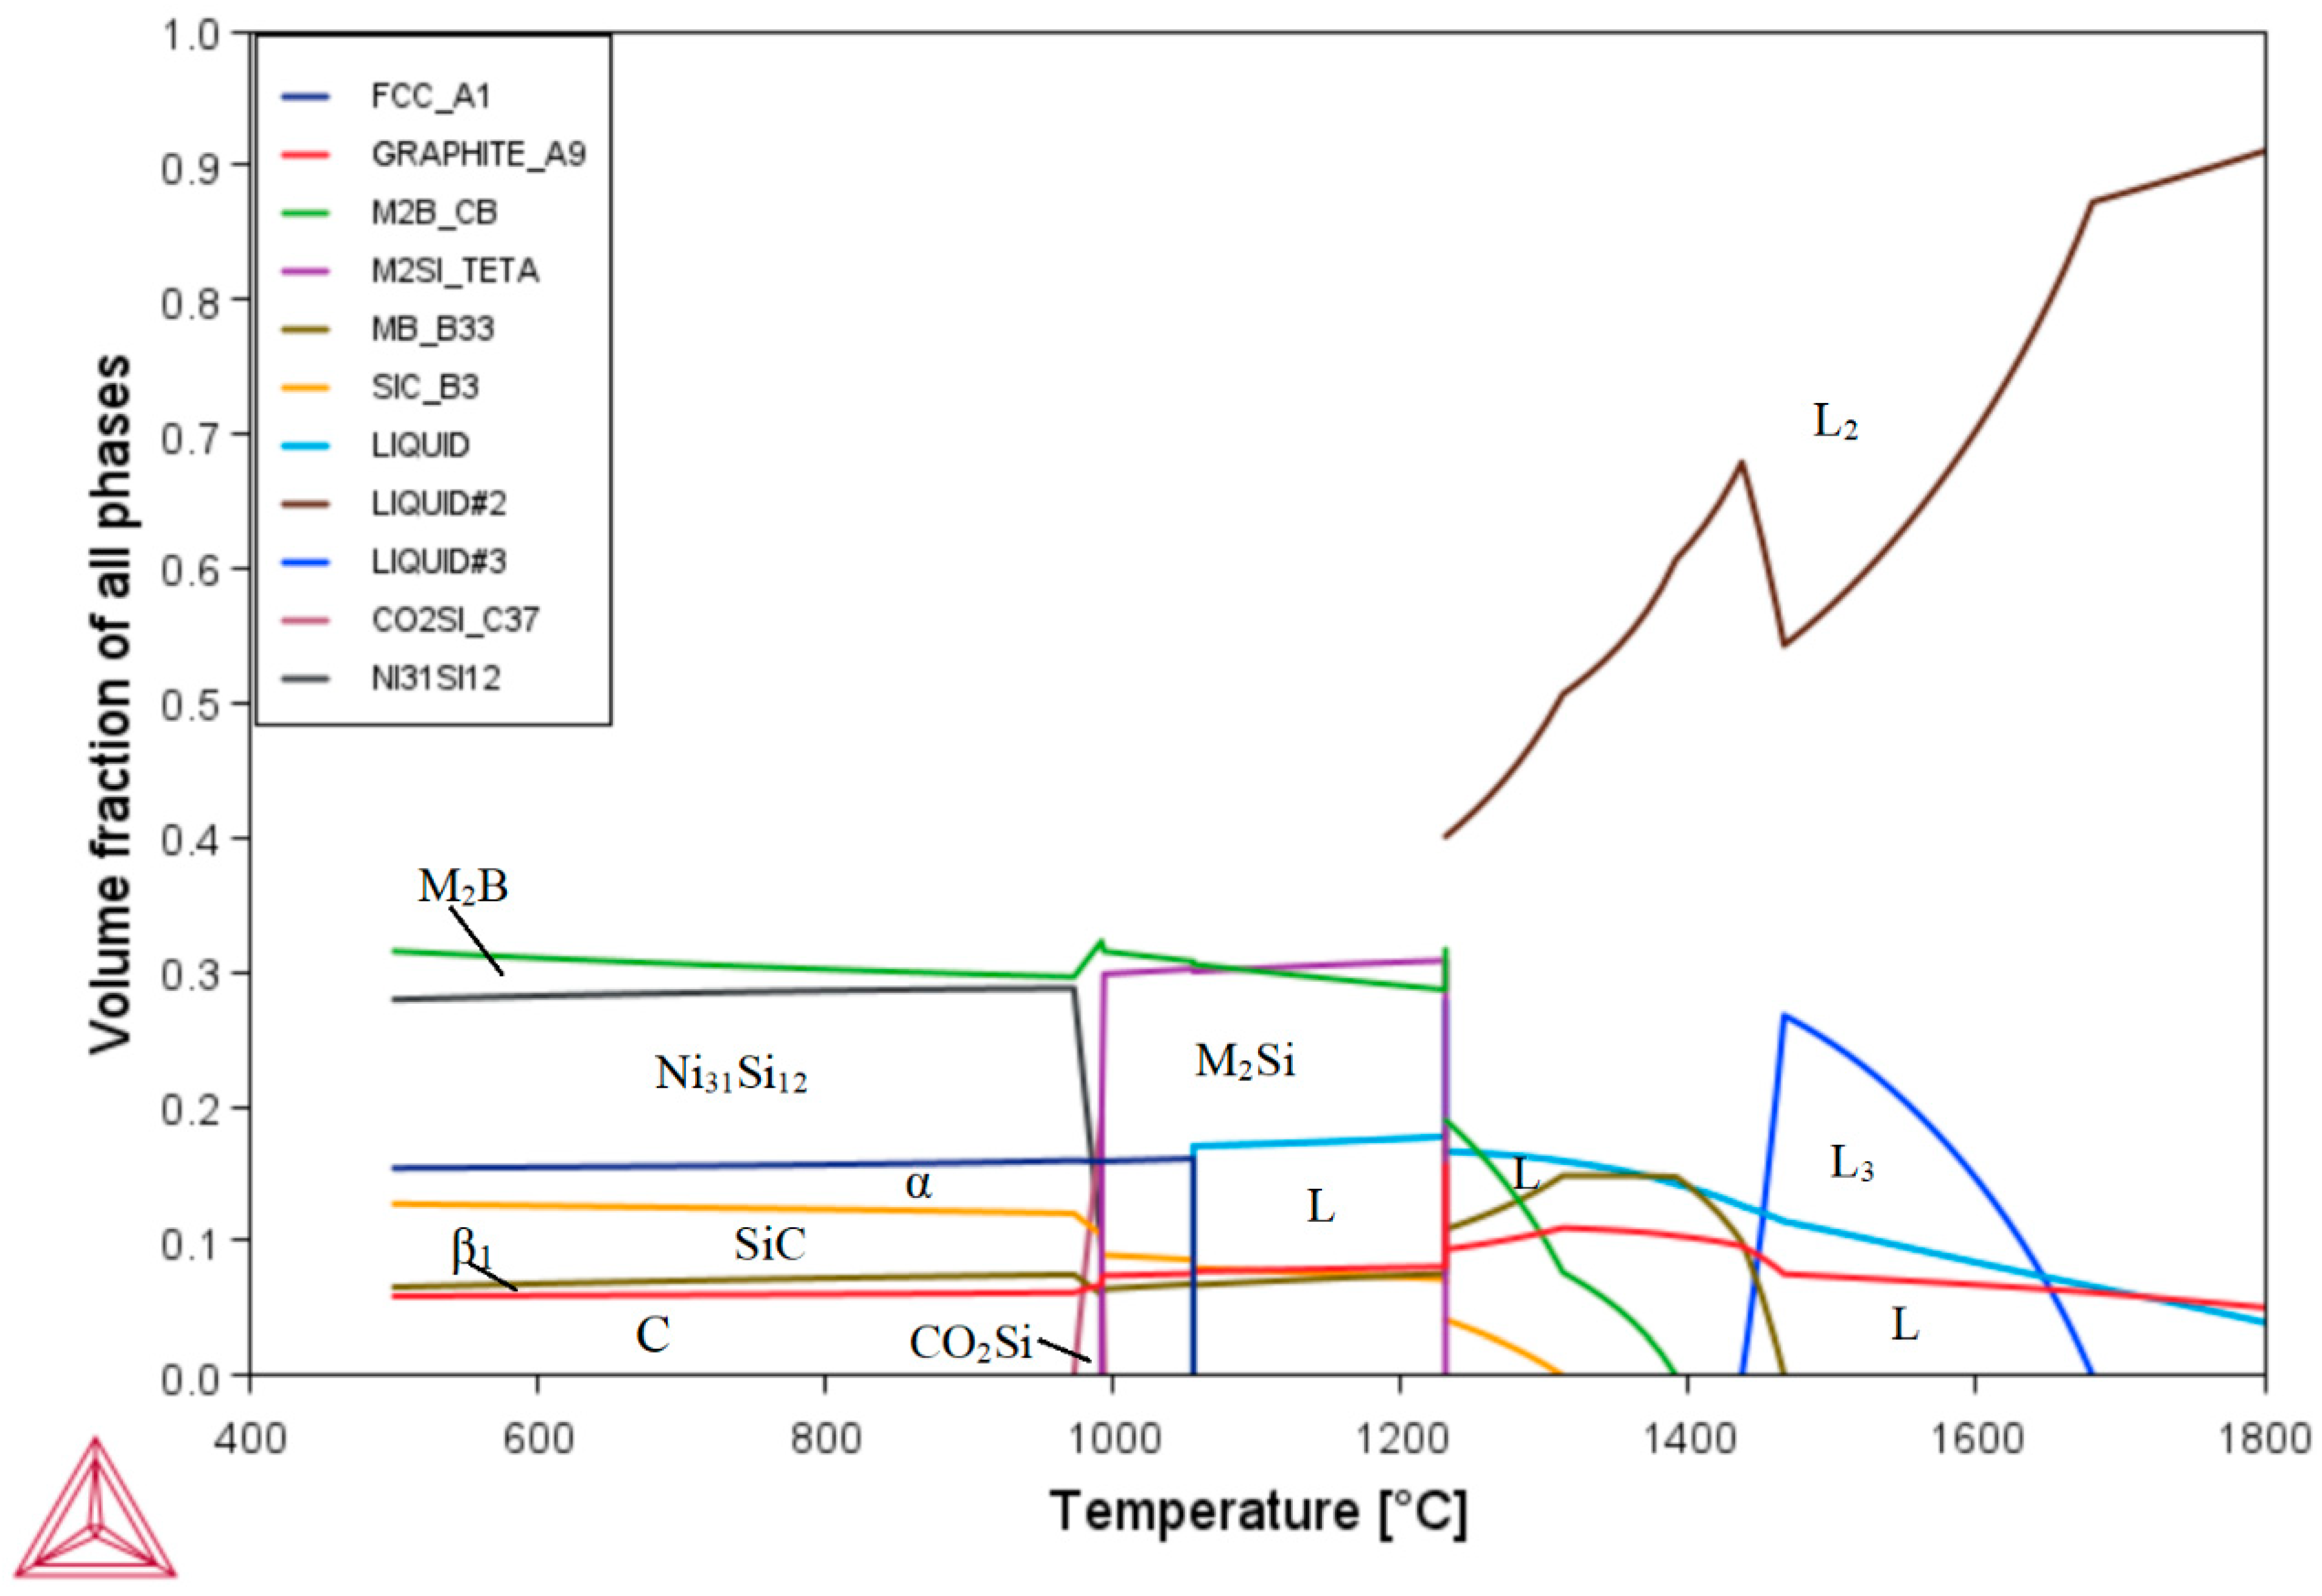
Phase evolution in the Fe–Ni–Cr–Cu–Si–B–C system was first analyzed by equilibrium CALPHAD calculations over a wide temperature range (Figure 3). The calculations predict the formation of a complex multiphase equilibrium phase constitution comprising a metallic matrix together with borides, carbides, silicides, and intermetallic phases.
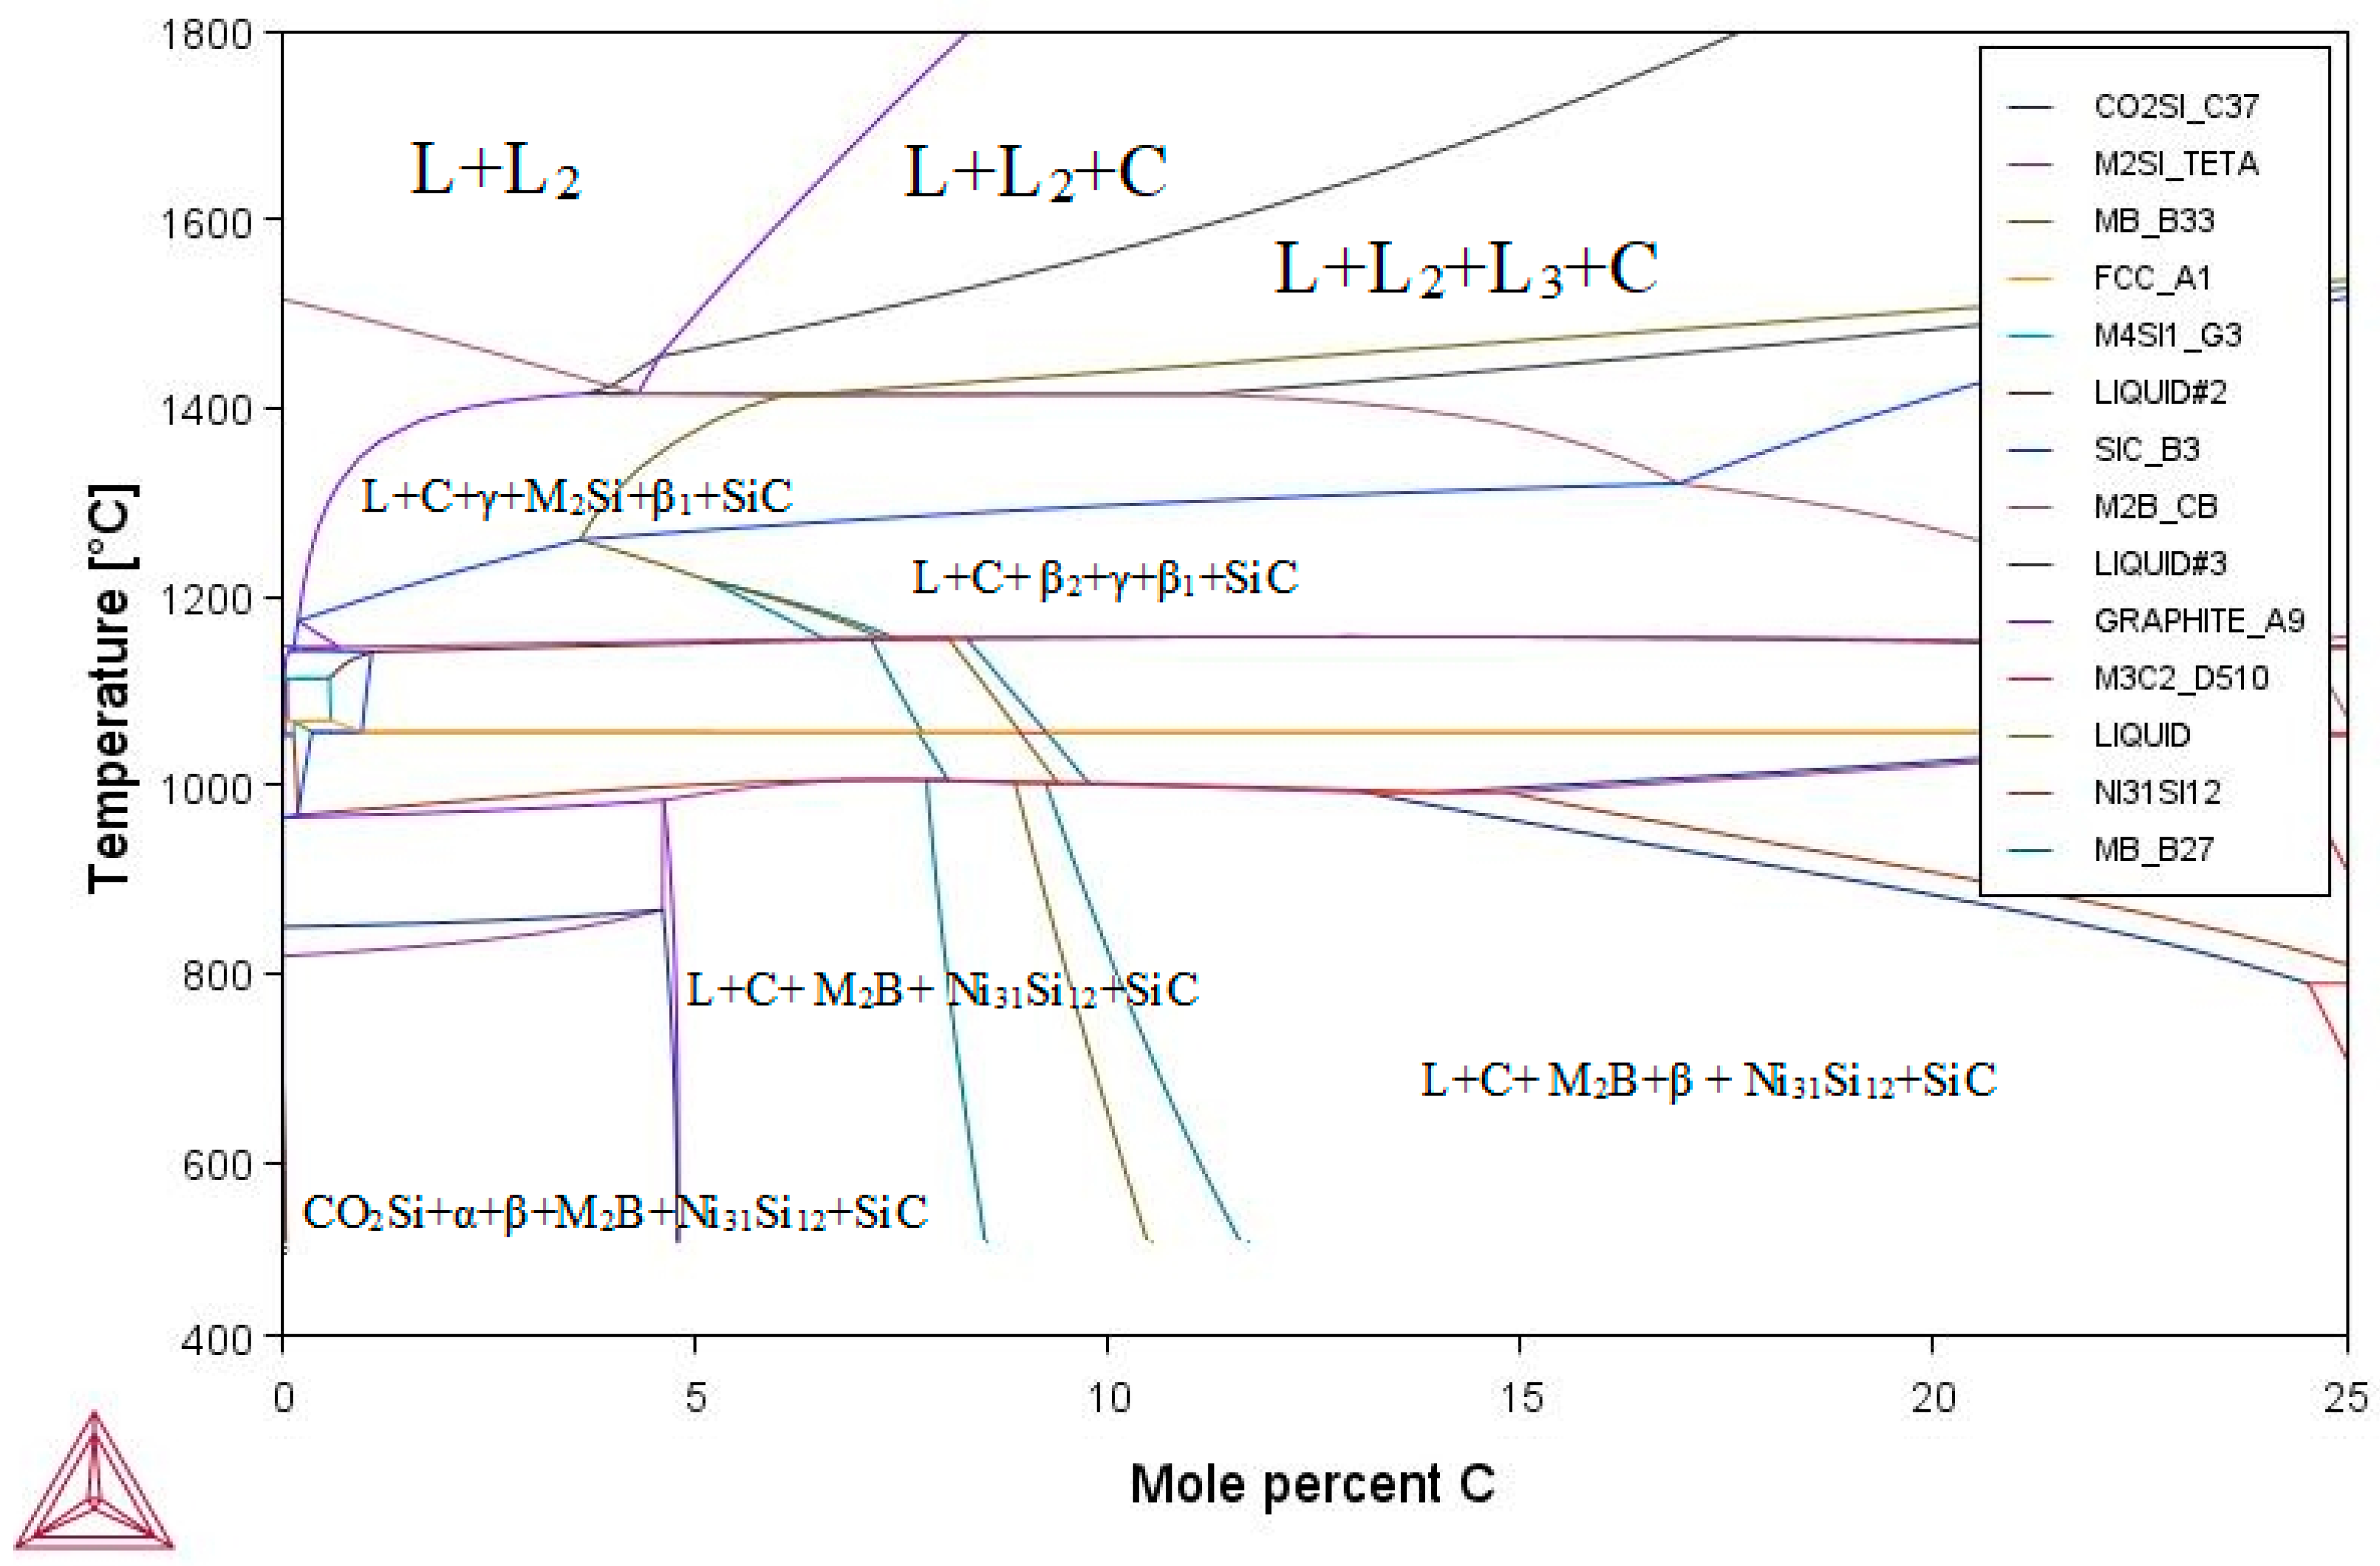
At elevated temperatures, the equilibrium phase constitution is dominated by liquid and solid-solution phases. Upon cooling, the equilibrium calculations predict progressive phase redistribution accompanied by the formation of borides, carbides, and silicides. The calculated phase diagrams (Figure 4) further indicate that carbon contributes to carbide stability and influences the equilibrium distribution of alloying elements among the coexisting phases.
Overall, the thermodynamic calculations indicate that phase evolution in the Fe–Ni–Cr–Cu–Si–B–C system is strongly dependent on both temperature and alloy composition, providing a thermodynamic basis for interpreting the experimentally observed microstructure [18].

3.4. Phase Evolution in the Critical Temperature Range

To identify thermodynamically favorable processing conditions, phase evolution was analyzed over the temperature range where the most significant changes in the equilibrium phase constitution were predicted to occur. The calculated equilibrium phase fractions at selected temperatures are summarized in Table 1.
At approximately 762 °C, the equilibrium phase constitutions are characterized by the coexistence of the α-phase (≈14.3%), M2B borides (≈42.9%), and intermetallic phases including Ni31Si12 (≈31.1%) and SiC (≈10.8%). This temperature corresponds to a region where several equilibrium phases coexist, resulting in a complex multiphase phase constitution. At 680 °C, the calculated M2B fraction decreases to approximately 21.5%, while a transient β-phase appears. According to the equilibrium calculations, this phase is stable only within a limited temperature interval and disappears upon further cooling.
At 638 °C, the calculated M2B fraction increases again to approximately 42.9%, accompanied by the disappearance of the β-phase. The equilibrium calculations therefore predict a stable multiphase constitution consisting of the metallic matrix together with boride-, carbide-, and silicide-containing phases.
Based on the equilibrium CALPHAD calculations, 638 °C was identified as the temperature at which the transient β-phase disappears, and a stable multiphase equilibrium phase constitution is predicted. This temperature was therefore selected as the thermodynamically favorable reference condition for the investigated alloy composition and used to guide the subsequent experimental characterization. It should be emphasized that this temperature represents an equilibrium thermodynamic prediction rather than an experimentally optimized processing condition.
No quantitative sensitivity analysis was performed to evaluate the influence of small temperature variations around 638 °C. Therefore, the calculated phase fractions should be interpreted as equilibrium thermodynamic predictions rather than experimentally validated values.

3.5. Characterization of Experimental Sample

3.5.1. Microstructural Analysis

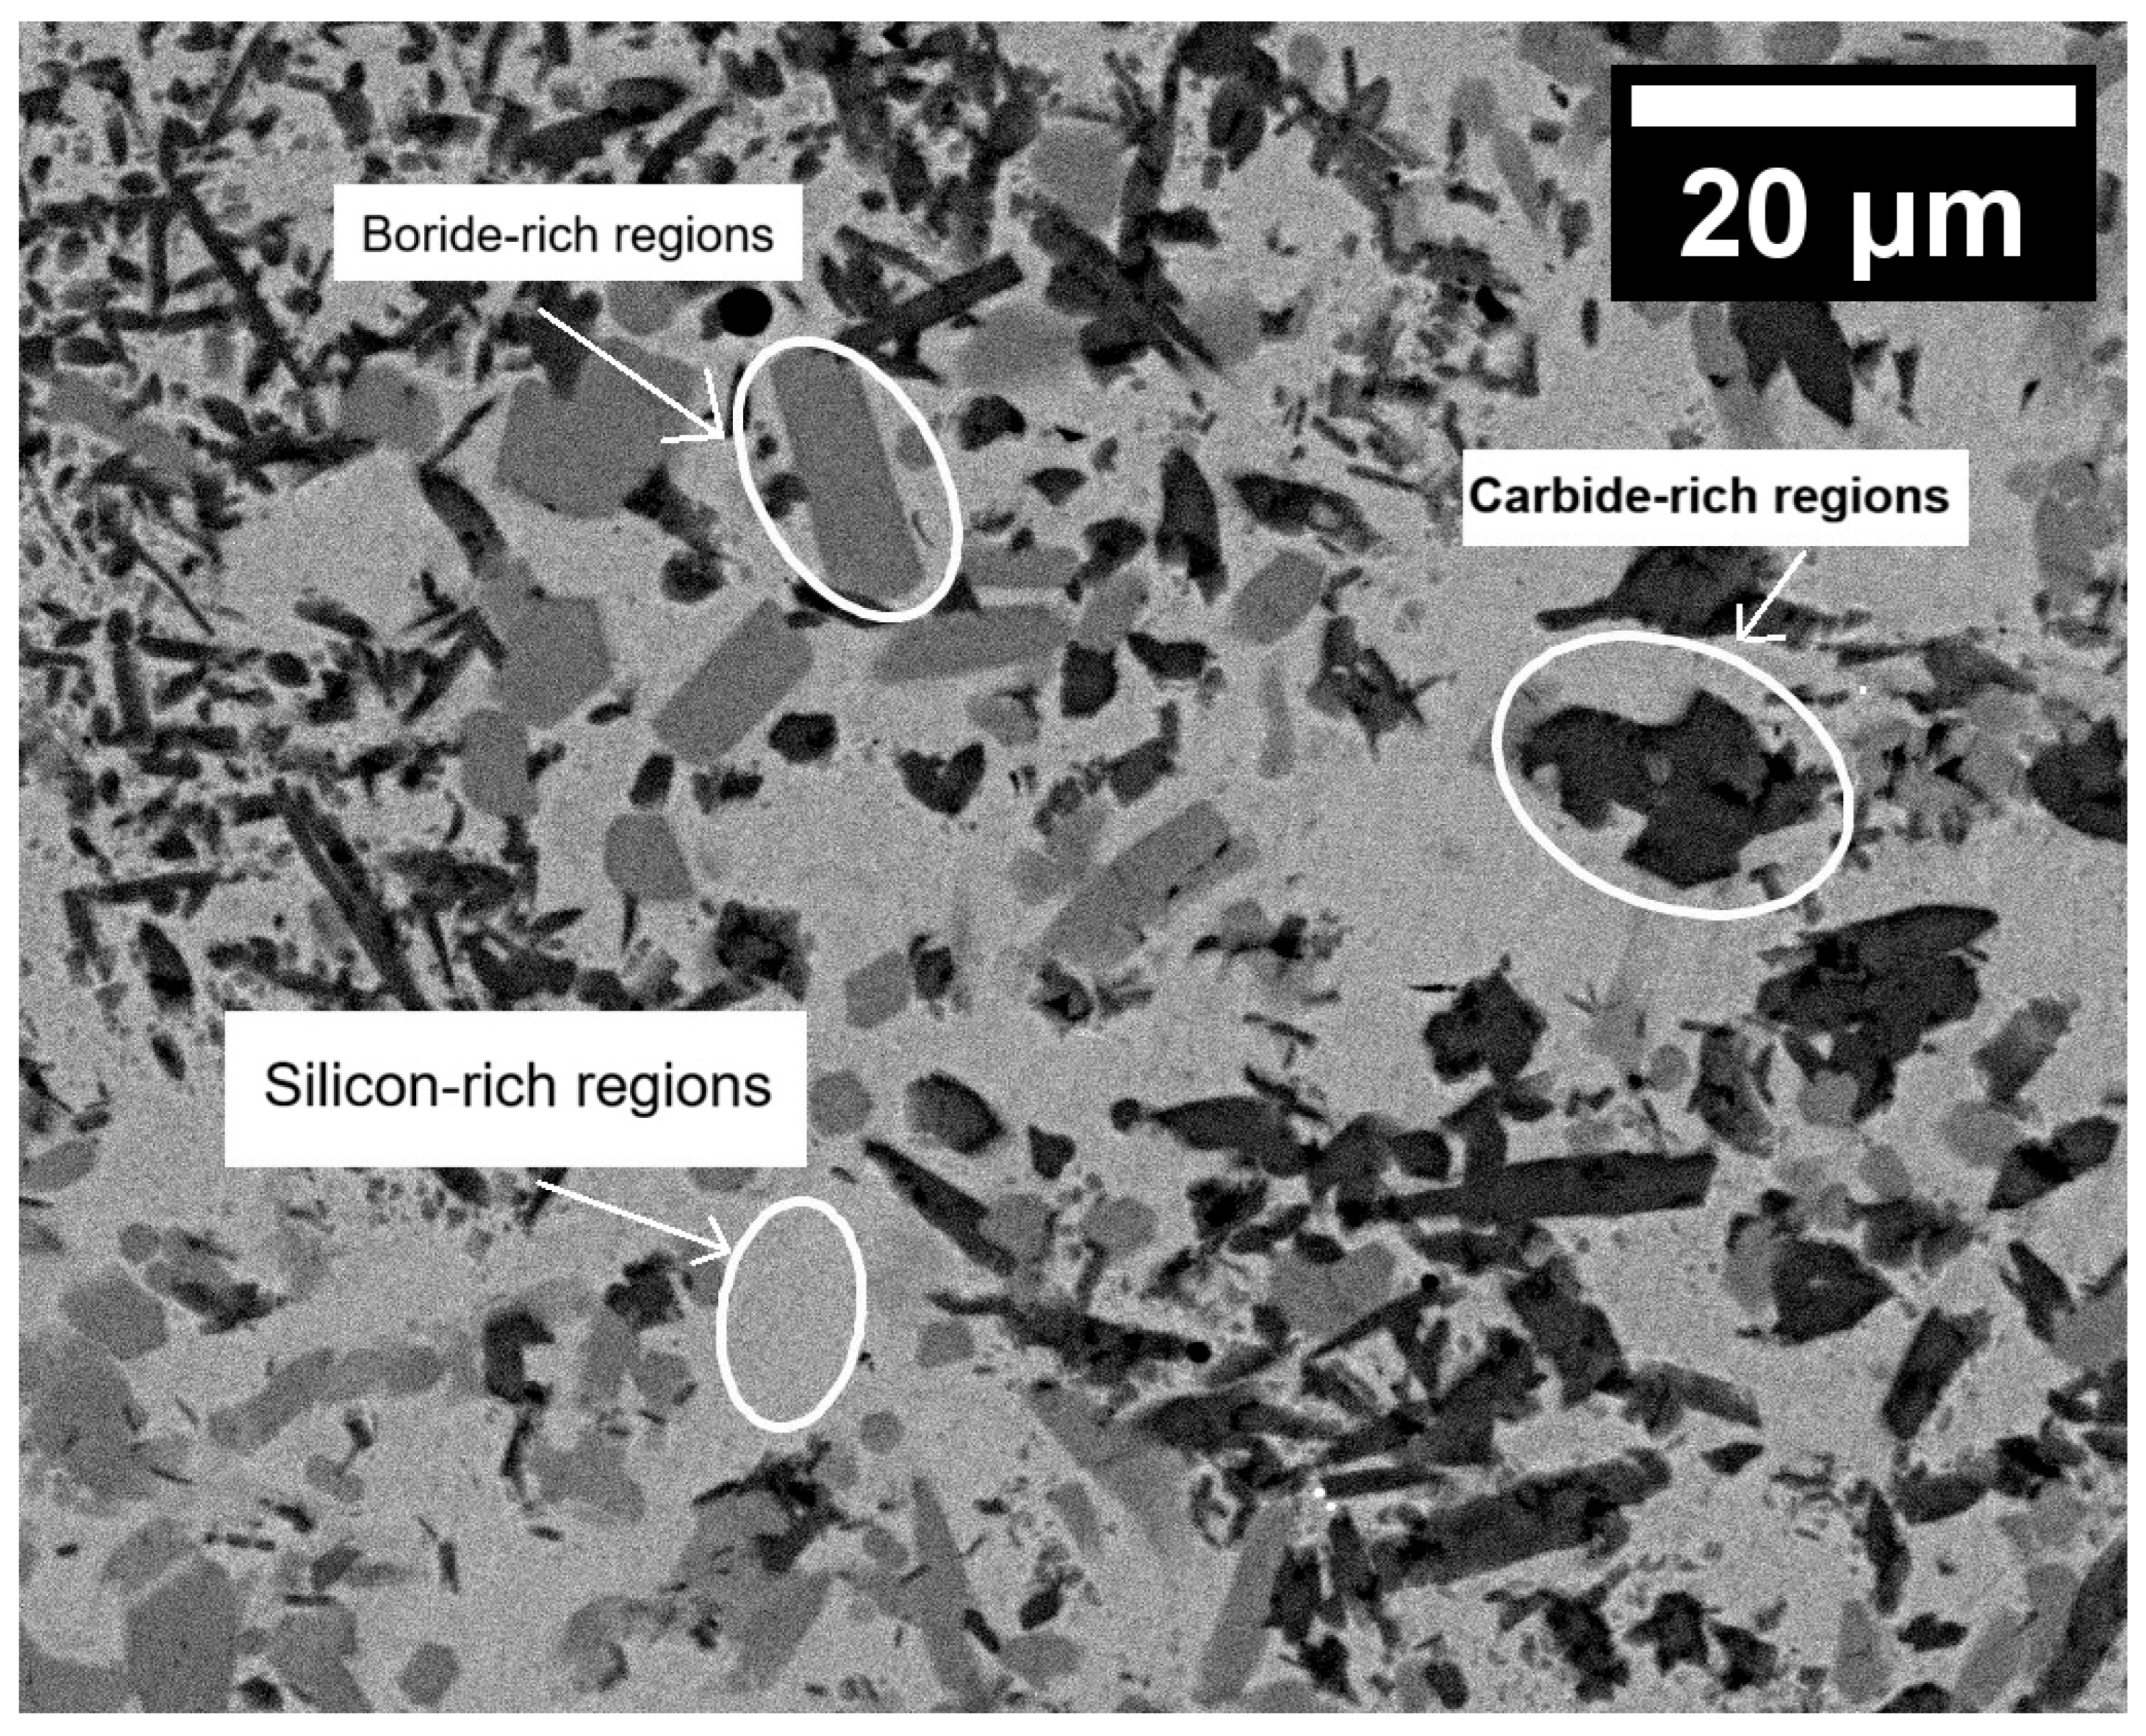
The microstructure of the deposited Fe–Ni–Cr–Cu–Si–B–C alloy coating was examined by SEM (Figure 5). The SEM images reveal a heterogeneous multiphase microstructure consisting of a continuous metallic matrix and dispersed secondary phases.
The SEM micrograph reveals a heterogeneous multiphase microstructure consisting of a continuous metallic matrix and several morphologically distinct secondary constituents. Based on their morphology, these regions can be tentatively associated with boride-rich [19], carbide-rich [8], and Si-rich constituents [20]. These tentative assignments are supported by the elemental distributions obtained from the subsequent WDS analysis and the XRD results and are interpreted in conjunction with the equilibrium CALPHAD predictions.
Although the gas-flame spraying process is an inherently non-equilibrium process, the experimentally observed phase constitution shows good qualitative agreement with the equilibrium phase constitution predicted by the CALPHAD calculations. These results indicate that the thermodynamic calculations provide a useful framework for interpreting the experimentally observed phase constitution of the investigated alloy.

3.5.2. Elemental Composition

The WDS analysis (Table 2) confirmed the presence of the principal alloying elements (Fe, Ni, Cr, Cu, Si, B, and C), consistent with the nominal alloy composition and the phase constitution predicted by the CALPHAD calculations. The measured concentrations of boron (≈3.8 wt.%), carbon (≈4.3 wt.%), and silicon (≈10.0 wt.%) are consistent with the formation of boride-, carbide-, and silicide-containing phases, respectively. Together with the CALPHAD predictions, the WDS data support the proposed interpretation of the experimentally observed phase constitution.

3.5.3. Elemental Distribution

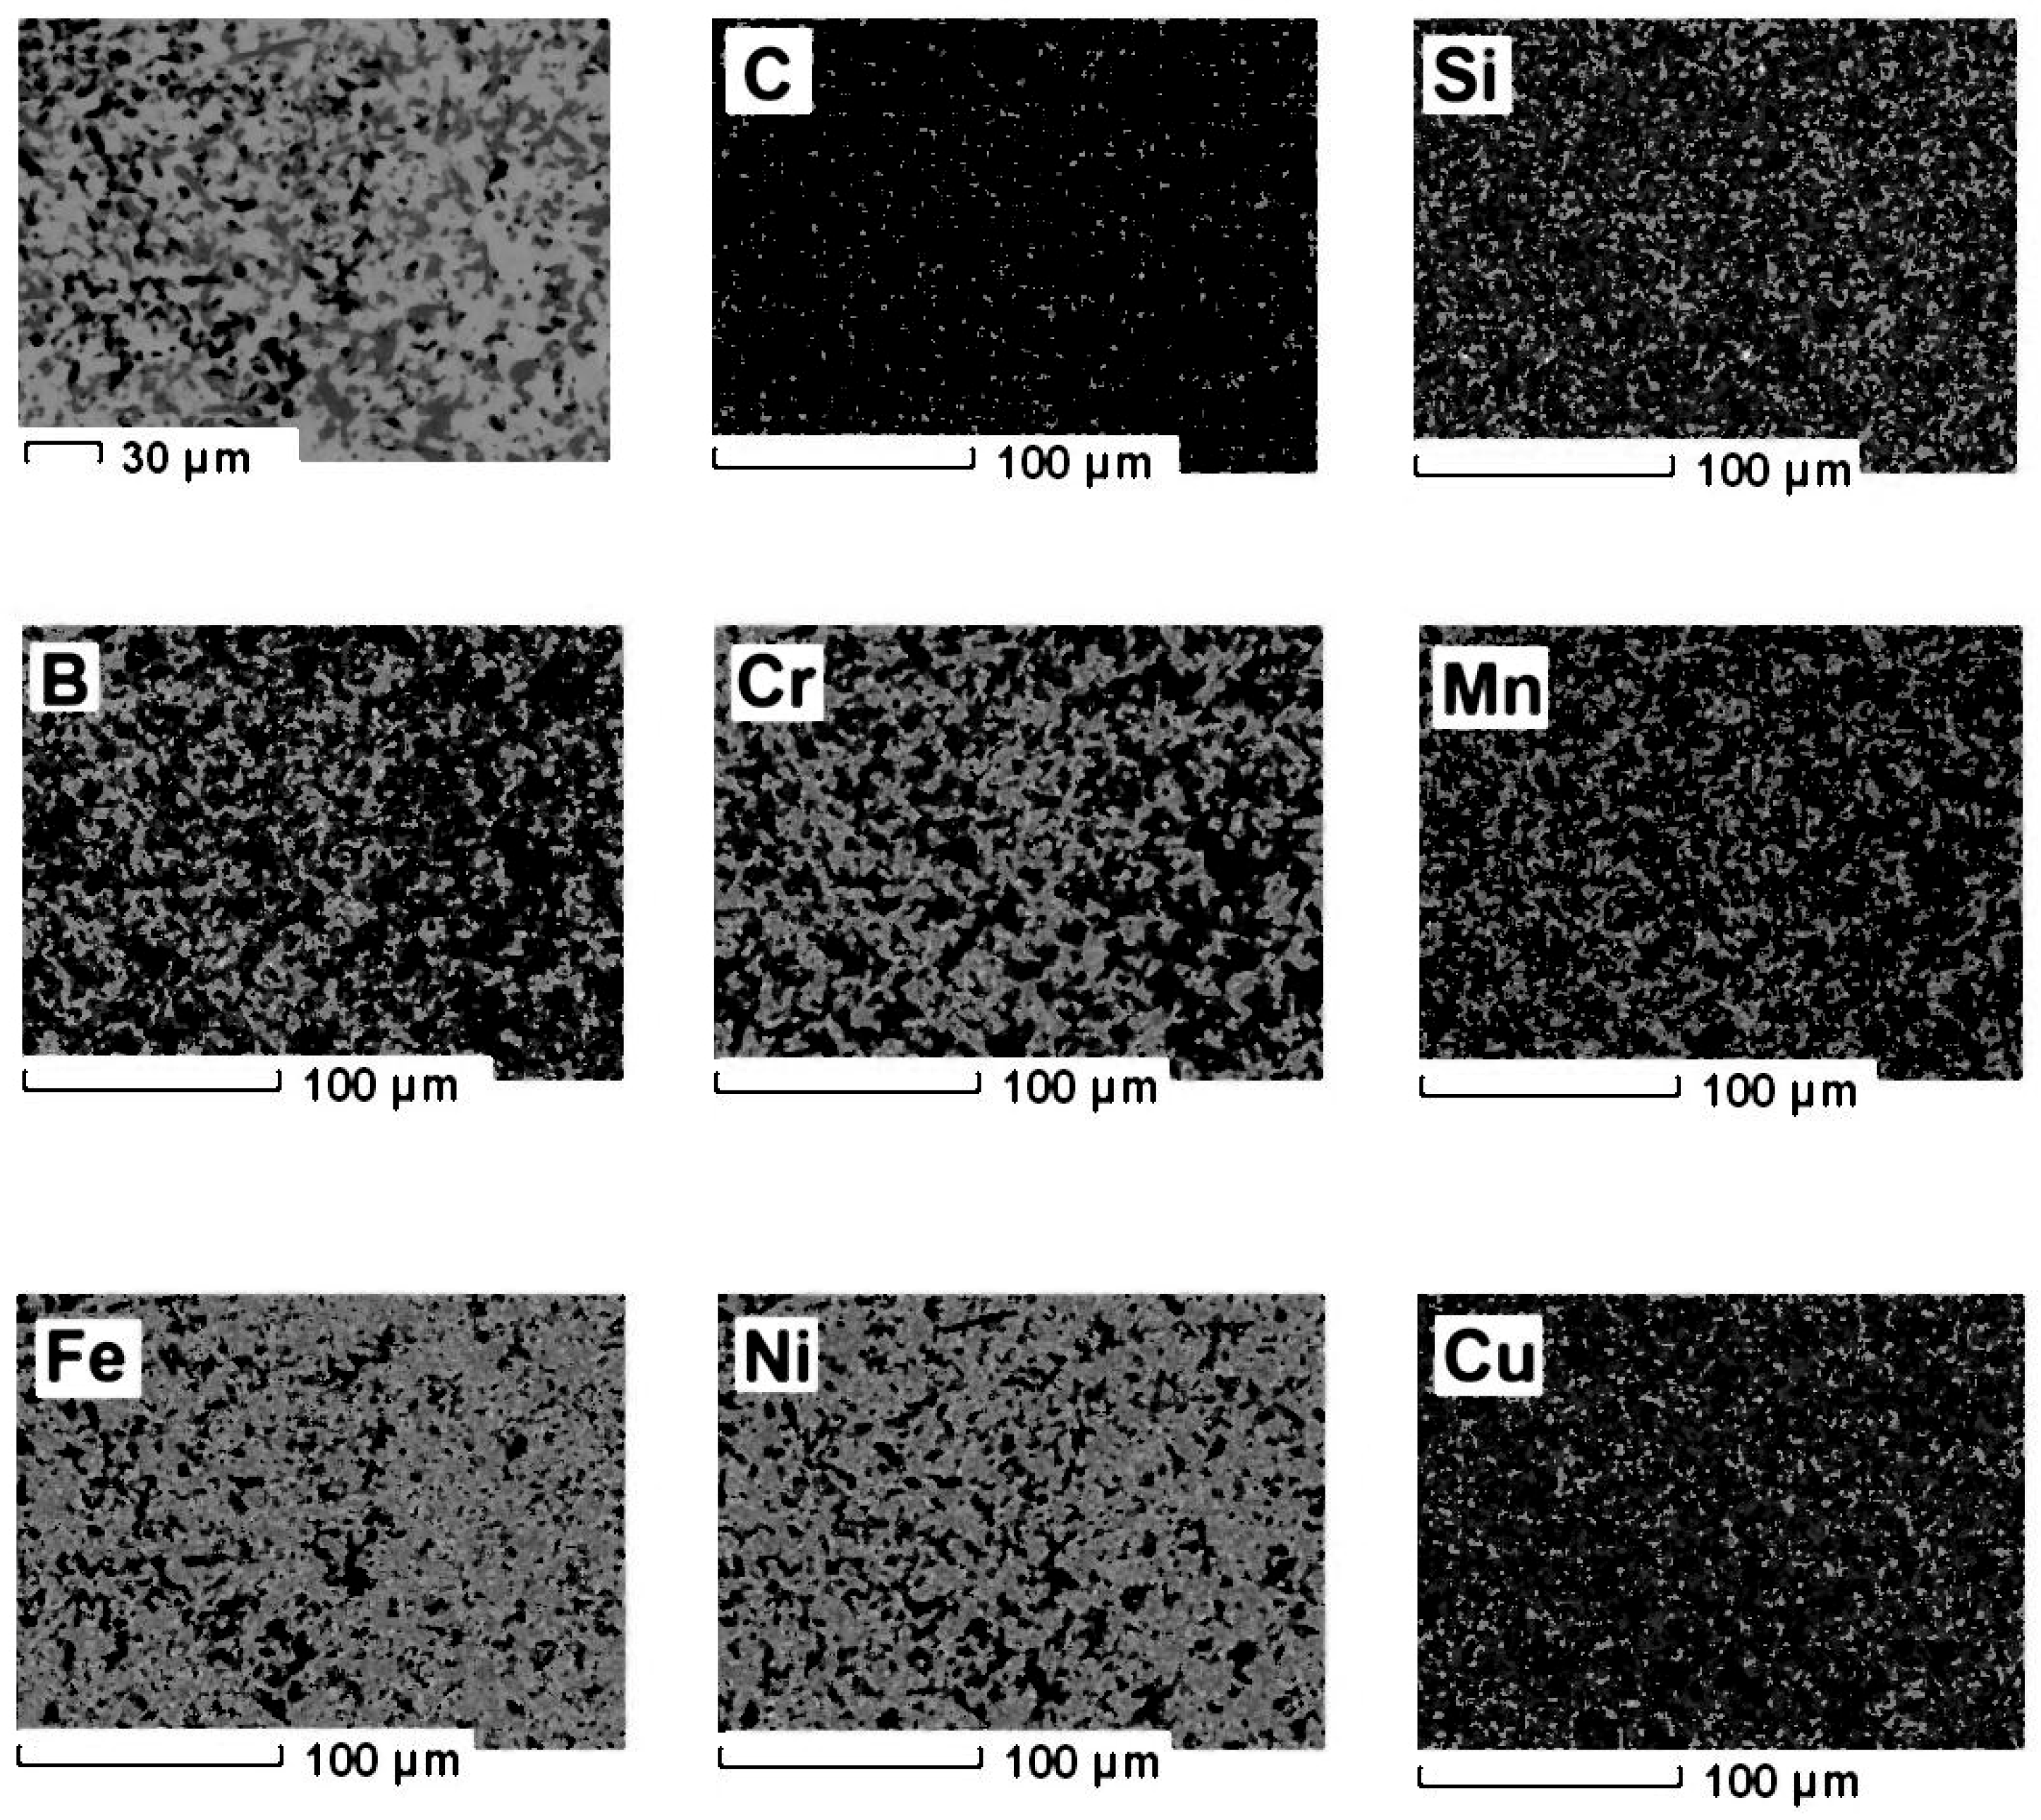
Elemental mapping (Figure 6) was performed to examine the spatial distribution of the principal alloying elements. The maps reveal a relatively uniform distribution of Fe, Ni, and Cr throughout the metallic matrix, whereas carbon and silicon exhibit localized enrichment.
The localized enrichment of carbon corresponds to the dark particles observed in SEM images and is consistent with their tentative assignment to carbide-containing regions [8]. Similarly, the non-uniform distribution of silicon is consistent with the presence of Si-rich or silicide-containing regions [20]. These interpretations are further supported by the XRD results and the equilibrium CALPHAD predictions.
A weak Mn signal was also detected. Its low intensity suggests that it originates from trace impurities in the starting materials or from measurement-related effects and is therefore unlikely to significantly influence the equilibrium phase constitution of the investigated alloy [20].

3.5.4. Phase Analysis by X-Ray Diffraction

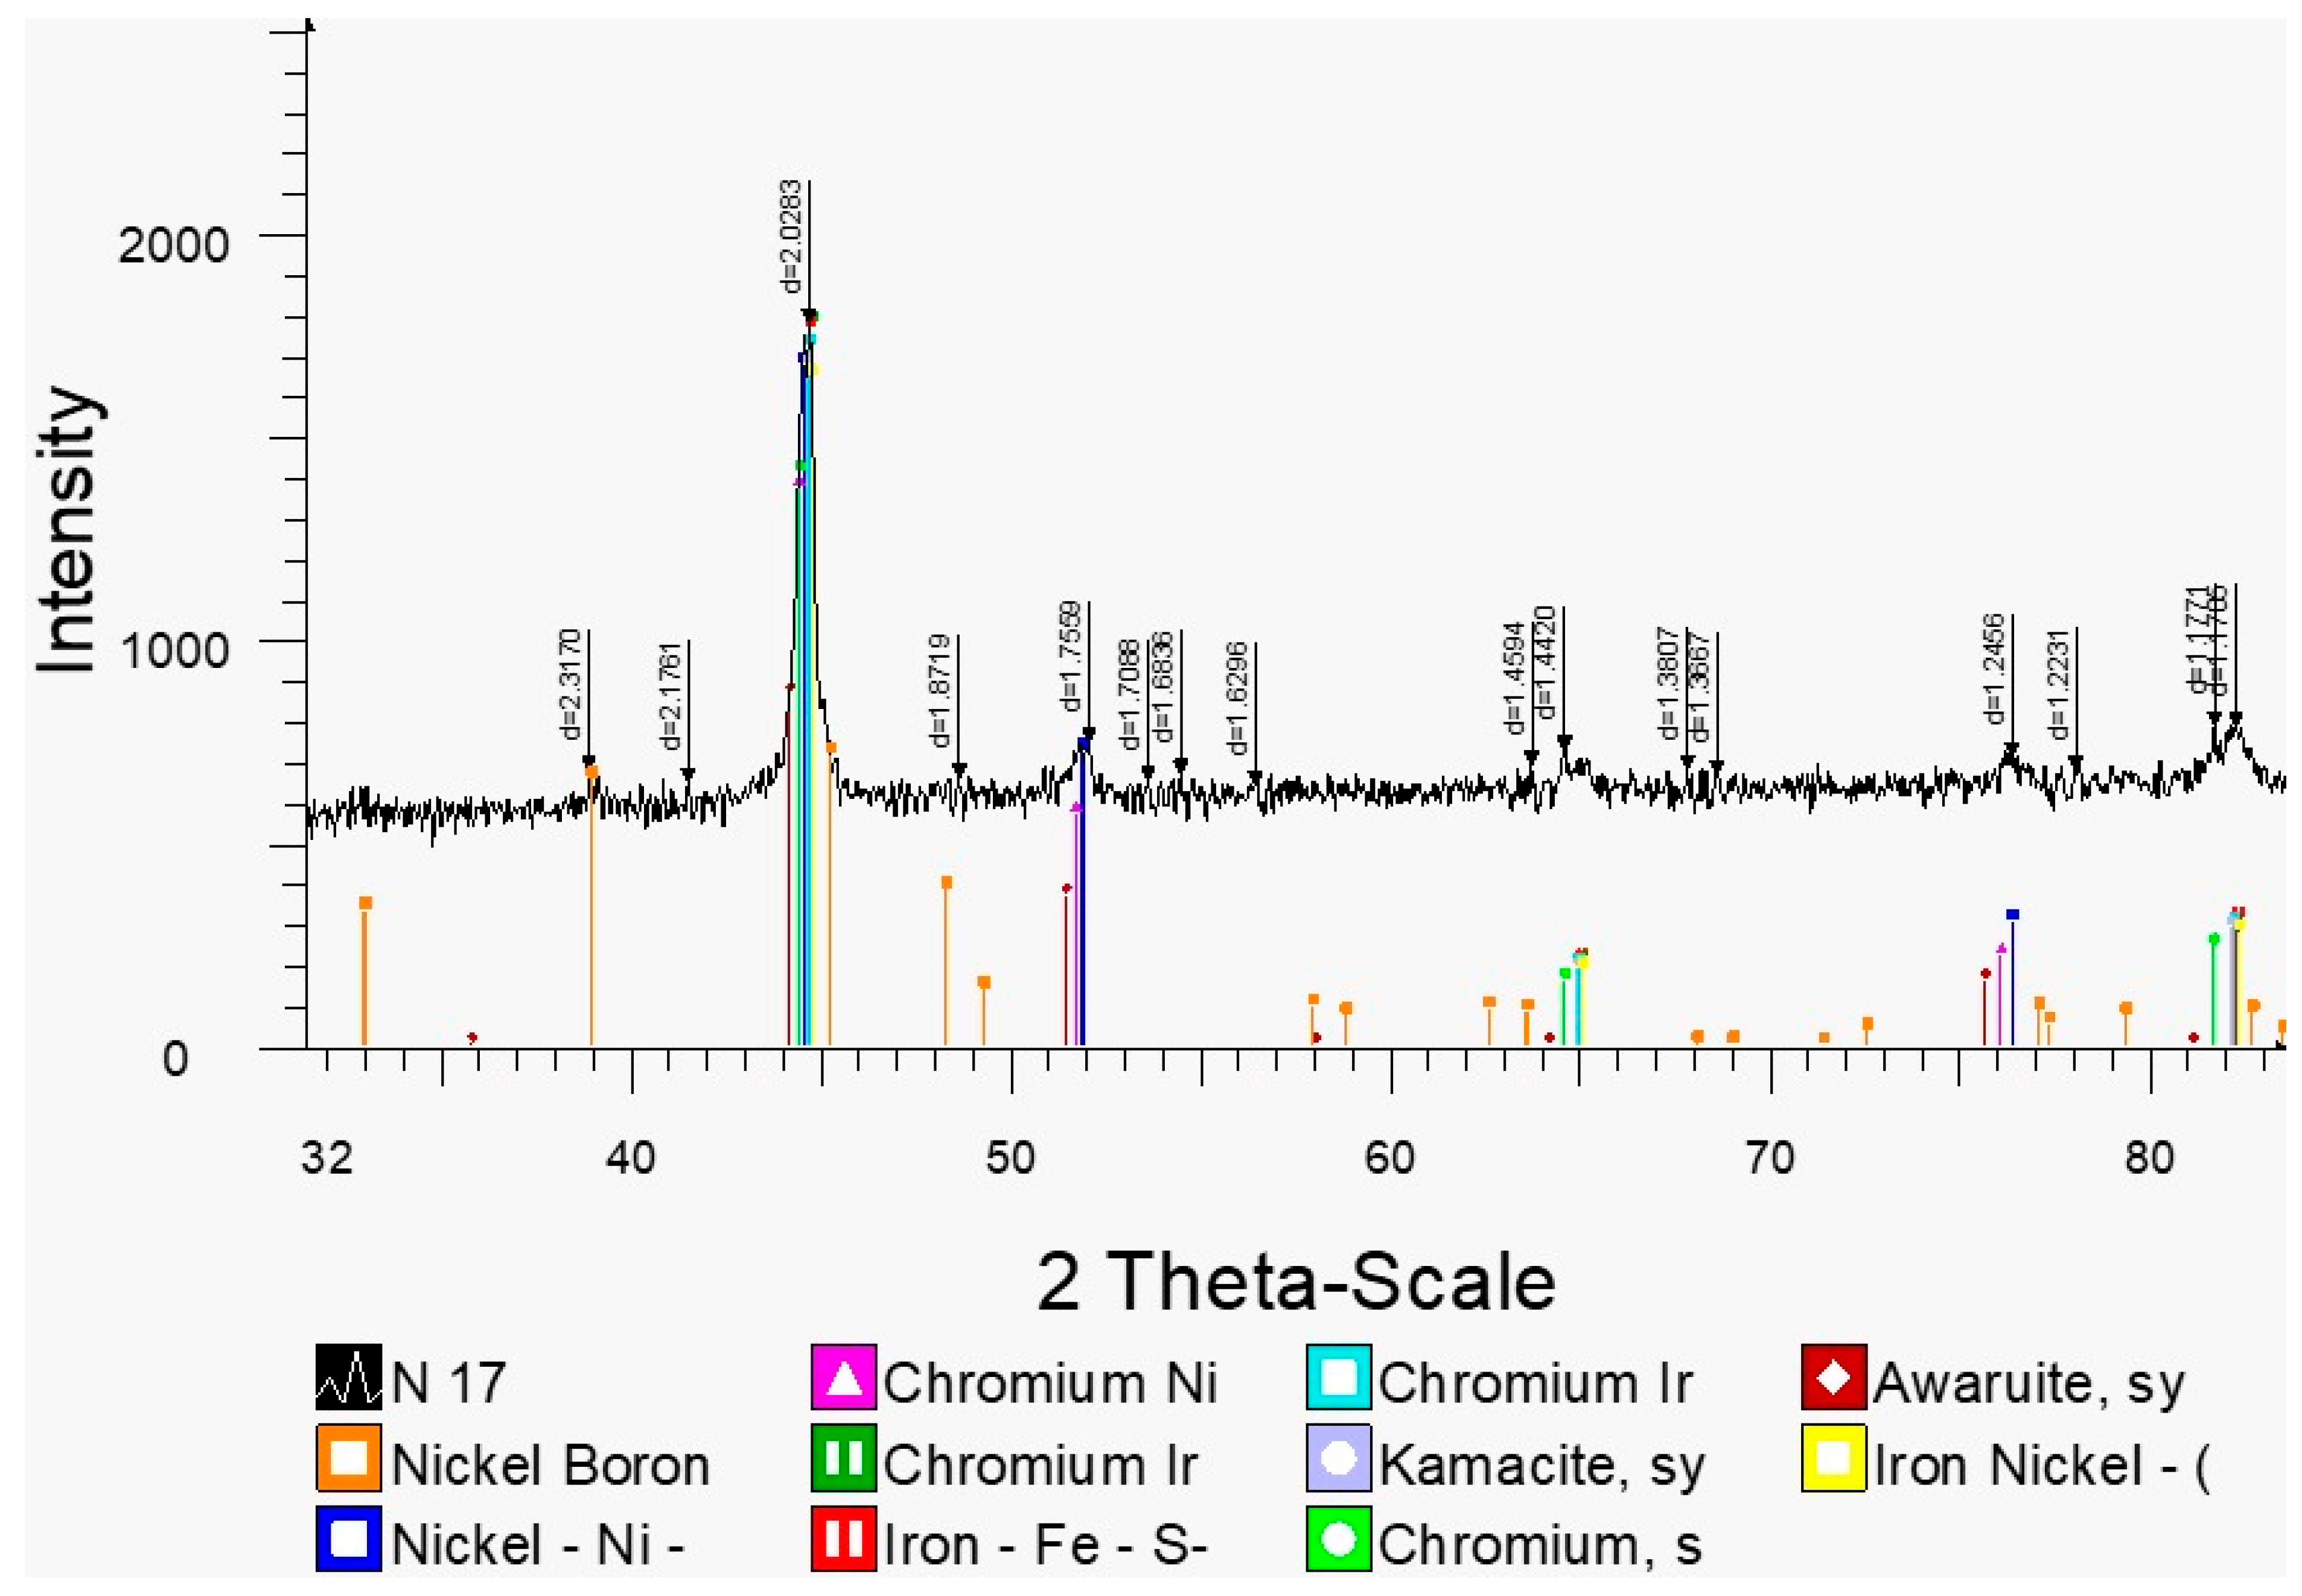
Because point WDS analyses of individual microstructural constituents were not performed, the tentative phase assignments based on the SEM observations were subsequently evaluated by XRD (Figure 7) and interpreted together with the equilibrium CALPHAD predictions. The XRD pattern of the synthesized Fe–Ni–Cr–Cu–Si–B–C alloy exhibits a broad set of overlapping reflections, indicating the presence of a complex multiphase constitution. This observation is consistent with the equilibrium CALPHAD predictions and the experimentally observed microstructure.
The most intense diffraction peak appears at 2θ ≈ 44–45°, corresponding primarily to the (110) reflection of α-Fe (bcc), although contributions from Fe–Ni solid-solution phases cannot be excluded because of peak overlap, lattice substitution, and instrumental broadening [21]. Additional reflections at approximately 2θ ≈ 65° and 82° are consistent with higher-order α-Fe reflections, indicating that the metallic matrix is predominantly Fe-based.
Several weaker reflections in the ranges of 2θ ≈ 43–45°, 51–52°, and 75–77° are consistent with the presence of Ni-containing phases, including Ni-rich solid solution and/or Fe–Ni intermetallic phases [22]. These observations suggest that nickel is distributed between the metallic matrix and secondary phases. Reflections observed at 2θ ≈ 44–46°, 64–66°, and 81–83° may also contain contributions from Cr-bearing phases, including Cr-rich solid solutions, chromium carbides (e.g., Cr7C3, Cr23C6), and mixed metallic compounds commonly reported for Fe–Cr multicomponent alloys [23].
Low-intensity reflections in the ranges of 2θ ≈ 37–39°, 42–43°, and 46–48° are consistent with the possible presence of boride phases, including Fe2B, FeB, Ni2B, and mixed (Fe, Ni)2B compounds. Their unambiguous identification is hindered by peak overlap, the low volume fraction of borides, and the structural complexity of the alloy, which are typical challenges in the XRD analysis of multicomponent boron-containing alloys [24].
Additional weak reflections at 2θ ≈ 35–36°, 60–62°, and 72–74° may also be attributed to silicide- and carbide-containing phases, including FeSi, NiSi2, SiC, and mixed metal carbides. These assignments are consistent with both the elevated Si and C contents determined by WDS and the equilibrium phase constitution predicted by the CALPHAD calculations. Because of substantial peak overlap and the multicomponent nature of the alloy, unambiguous assignment of all reflections is not possible without full-pattern refinement. Nevertheless, the XRD results are consistent with the presence of a heterogeneous multiphase constitution comprising a Fe-based matrix together with boride-, carbide-, silicide-, and intermetallic-containing phases.
Overall, the XRD results show good qualitative agreement with the equilibrium CALPHAD predictions and are supported by SEM and WDS observations. Together, these complementary techniques provide a consistent interpretation of the experimentally observed phase constitution of the investigated alloy. The comparison between the equilibrium CALPHAD predictions and the experimental results is qualitative, as quantitative phase-fraction analysis was beyond the scope of the present study. Accordingly, the XRD results should be regarded as qualitative evidence supporting phase identification rather than as a quantitative determination of phase fractions.
Not all phases predicted by the equilibrium CALPHAD calculations could be experimentally identified. This may be attributed to their low phase fractions, peak overlap in the XRD patterns, the absence of full-pattern refinement, and the inherently non-equilibrium nature of the gas-flame spraying process.

3.5.5. Mechanical Properties

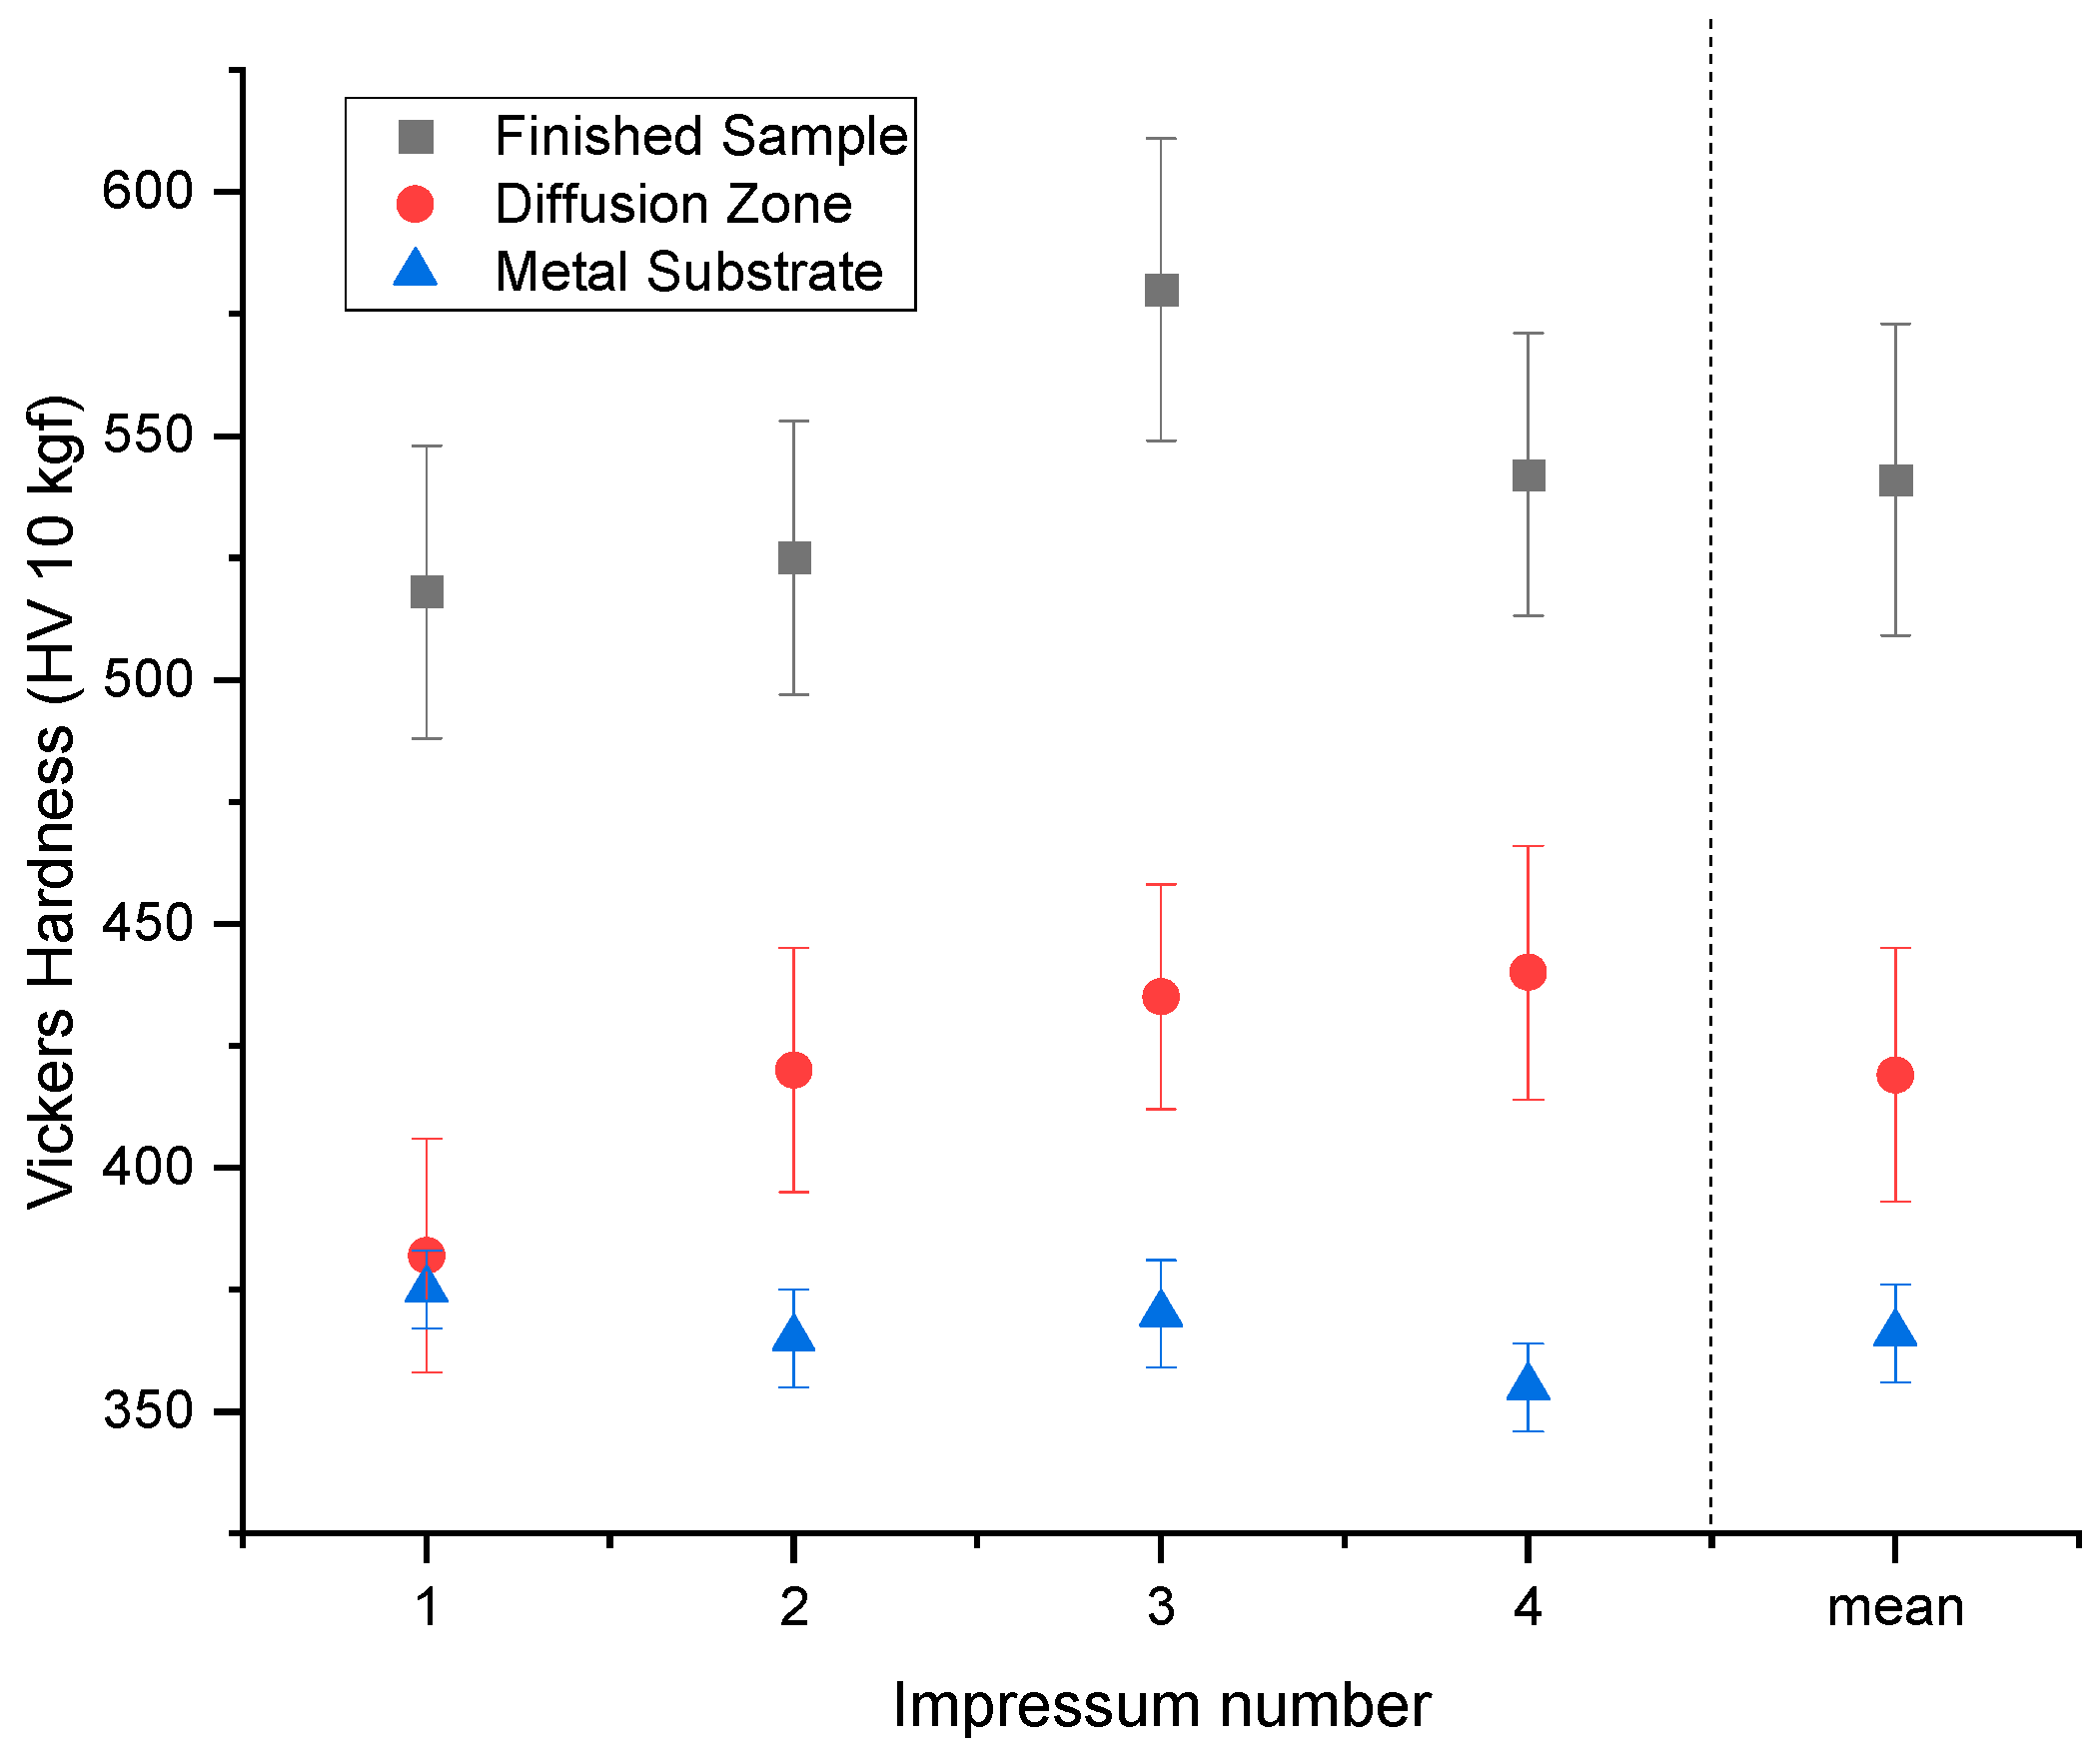
The Vickers microhardness measured in the coating, diffusion zone, and steel substrate is presented in Figure 8.
The deposited coating exhibited the highest hardness, with an average value of 541 ± 32 HV10, whereas the diffusion zone and steel substrate showed average hardness values of 421 ± 26 HV10 and 368 ± 10 HV10, respectively. The coating hardness was approximately 47% higher than that of the substrate, reflecting the strengthening effect associated with the developed heterogeneous multiphase microstructure.
The relatively small variation among individual indentations indicates reasonably uniform hardness over the investigated length scale. Although one indentation exhibited a higher hardness value (≈580 HV10), no quantitative correlation between local hardness and the distribution of individual phase constituents was established. This local variation is therefore interpreted as reflecting normal microstructural heterogeneity rather than the presence of specific boride- or carbide-containing phases.
The enhanced coating hardness is consistent with the formation of a heterogeneous multiphase microstructure containing boride-, carbide-, and silicide-containing phases. According to the equilibrium CALPHAD predictions, boride phases are expected to contribute significantly to strengthening because of their high intrinsic hardness. However, the individual contributions of the different phase constituents to the measured hardness were not quantified within the scope of the present study.
The results of the pull-off adhesion tests are summarized in Table 3. The measured adhesion strength ranged from 46.27 to 61.30 MPa, with an average value of 51.66 ± 6.05 MPa. These values are indicative of strong adhesion between the deposited coating and the steel substrate. The relatively narrow scatter of the measured values suggests good reproducibility of the coating adhesion under the investigated processing conditions.
The pull-off adhesion strength of the developed Fe–Ni–Cr–Cu–Si–B–C coating was 51.66 ± 6.05 MPa. This value falls within the range reported for thermally sprayed Fe- and Ni-based self-fluxing coatings, including NiCrBSi-type systems, although the reported adhesion strength varies considerably depending on the spraying process, substrate preparation, remelting or post-treatment conditions, coating thickness, and test methodology [25,26] Therefore, the measured adhesion strength indicates satisfactory coating adhesion and supports the potential applicability of the developed coating. Nevertheless, because the adhesion performance of commercial coatings is strongly process-dependent, this comparison should be regarded as qualitative rather than as a direct performance ranking.
From an engineering perspective, the principal advantage of the proposed approach lies in the integration of CALPHAD thermodynamic modeling with targeted experimental characterization, enabling more efficient selection of promising alloy compositions before extensive experimental optimization. Such a workflow has the potential to reduce development time and experimental effort while providing a rational framework for the design of advanced Fe-based wear-resistant coating materials.
The combination of high hardness and good adhesion suggests that the developed Fe–Ni–Cr–Cu–Si–B–C coating is a promising candidate for wear-resistant applications involving elevated mechanical and impact loading. However, comprehensive tribological, corrosion, and long-term durability studies are required before its suitability for practical engineering applications can be fully assessed [27,28,29].

4. Limitations of the Present Study

The present study established relationships between boron content, thermodynamically predicted phase evolution, and the resulting microstructure of Fe–Ni–Cr–Cu–Si–B–C coatings using a combined CALPHAD–experimental approach. Nevertheless, several limitations should be considered when interpreting the results.
First, the CALPHAD calculations represent thermodynamic equilibrium conditions, whereas gas-flame spraying is inherently a non-equilibrium process. Therefore, the calculated phase constitution should be regarded as an equilibrium reference for interpreting the experimentally observed microstructure rather than as an exact prediction of the final coating constitution.
Second, the experimental characterization provided qualitative support for the predicted phase constitution. Quantitative phase-fraction analysis, local crystallographic phase identification (e.g., EBSD or TEM), and point compositional analysis of individual microstructural constituents were beyond the scope of the present study. Consequently, the proposed phase assignments are based on the combined interpretation of SEM observations, WDS elemental mapping, XRD analysis, and CALPHAD predictions.
Third, quantitative characterization of coating defects, including porosity, crack density, and oxide inclusions, was not performed. Therefore, their influence on the measured mechanical properties could not be evaluated.
Finally, although the developed coating exhibited high hardness and satisfactory adhesion strength, neither its tribological performance nor the reproducibility of the coating deposition process was systematically evaluated. Accordingly, the developed alloy should be regarded as a promising candidate for wear-resistant coating applications rather than as a coating with experimentally verified wear performance.
Despite these limitations, the combined CALPHAD–experimental methodology provides a rational framework for alloy composition optimization and qualitative assessment of phase evolution in complex Fe-based multicomponent alloys, establishing a solid basis for future studies involving quantitative phase analysis, tribological evaluation, and long-term performance assessment.

5. Conclusions

-
A combined CALPHAD-guided experimental approach was employed to investigate the influence of boron content on phase evolution and microstructural development in the Fe–Ni–Cr–Cu–Si–B–C alloy system. The results identify boron as the principal alloying parameter governing phase redistribution between the Fe-based metallic matrix and boride-containing phases, providing a rational basis for alloy design.
-
Equilibrium CALPHAD calculations predicted complex multiphase behavior involving boride-, carbide-, and silicide-containing phases over a wide temperature range. Response surface analysis showed that temperature is the primary factor controlling phase evolution, whereas boron content predominantly modifies phase stability and phase redistribution. Within the investigated composition range, approximately 4 wt.% B and 638 °C were identified as thermodynamically favorable conditions for achieving a balanced equilibrium phase constitution. These conditions should be regarded as thermodynamic predictions rather than experimentally optimized processing parameters.
-
Experimental characterization by SEM, WDS, elemental mapping, and XRD revealed a heterogeneous multiphase microstructure that shows good qualitative agreement with the equilibrium phase constitution predicted by CALPHAD. The proposed phase assignments are based on the combined interpretation of thermodynamic calculations and complementary experimental observations.
-
The developed coating exhibited a microhardness of 541 ± 32 HV10 together with satisfactory pull-off adhesion strength. The enhanced hardness is consistent with the formation of a heterogeneous multiphase microstructure containing boride-, carbide-, and silicide-containing phases. However, the individual contributions of the different phase constituents to the measured mechanical properties were not quantified within the scope of the present study.
-
The comparison between CALPHAD predictions and experimental observations should be interpreted as qualitative agreement rather than rigorous quantitative validation of equilibrium phase fractions. The equilibrium calculations provide a thermodynamic framework for interpreting the experimentally observed non-equilibrium microstructure produced by gas-flame spraying.
-
Beyond optimization of the investigated alloy composition, the present work demonstrates a transferable CALPHAD-guided workflow integrating thermodynamic modeling, response surface methodology, and targeted experimental characterization. Compared with conventional empirical alloy development, this strategy provides a more efficient framework for identifying promising compositional regions in complex Fe-based multicomponent alloys.
-
The developed coating represents a promising candidate for wear-resistant applications because it combines high hardness with satisfactory adhesion. Nevertheless, further studies involving quantitative phase analysis, local phase identification, tribological and corrosion testing, long-term durability assessment, and systematic evaluation of process reproducibility are required before its suitability for practical engineering applications can be fully established.

Author Contributions

F.K.: Conceptualization, Methodology, Investigation, Data Curation, Formal analysis, Validation, Project administration, Funding acquisition, Writing—Original draft. A.A.: Data Curation, Formal Analysis, Visualization, Writing—Original Draft, Writing—Review and Editing. A.R.: Data Curation, Formal Analysis, Visualization, Writing—Original Draft, Writing—Review and Editing. G.K.: Investigation, Formal analysis, Writing—Original Draft. R.B.: Project administration, Writing—Review & Editing, Supervision, Project Administration, Resources. All authors have read and agreed to the published version of the manuscript.

Funding

This study is funded by the Science Committee of the Ministry of Science and Higher Education of the Republic of Kazakhstan (grant No. AP22685015 “Identification of regularities and investigation of the structural state of high-entropy alloys of the Fe-Ni-Cr-Cu-Si-B-C system based on their state diagrams”).

Data Availability Statement

The datasets presented in this study are not available due to time limitations. Request to access the datasets should be directed to F. Kapsalamova (f.kapsalamova@kbtu.kz).

Acknowledgments

The authors used artificial intelligence tools (ChatGPT, 5.5 OpenAI) to assist in language editing and improving the clarity of the manuscript. The authors take full responsibility for the content of the article.

Conflicts of Interest

The authors declare no competing interests.

References

  1. Yeh, J.; Chen, S.; Lin, S.; Gan, J.; Chin, T.; Shun, T.; Tsau, C.; Chang, S. Nanostructured High-entropy Alloys with Multiple Principal Elements: Novel Alloy Design Concepts and Outcomes. Adv. Eng. Mater. 2004, 6, 299–303. [Google Scholar] [CrossRef]
  2. Cantor, B.; Chang, I.T.H.; Knight, P.; Vincent, A.J.B. Microstructural Development in Equiatomic Multicomponent Alloys. Mater. Sci. Eng. A 2004, 375, 213–218. [Google Scholar] [CrossRef]
  3. Xie, X.; Li, N.; Liu, W.; Huang, S.; He, X.; Yu, Q.; Xiong, H.; Wang, E.; Hou, X. Research Progress of Refractory High Entropy Alloys: A Review. Chin. J. Mech. Eng. 2022, 35, 142. [Google Scholar] [CrossRef]
  4. Shubert, A.V.; Konovlov, S.V.; Panchenko, I.A. A Review of Research on High-Entropy Alloys, Its Properties, Methods of Creation and Application. Obrab. Met./Met. Work. Mater. Sci. 2024, 26, 153–179. [Google Scholar] [CrossRef]
  5. Nene, S.S.; Sinha, S.; Yadav, D.K.; Dutta, A. Metallurgical Aspects of High Entropy Alloys. J. Alloys Compd. 2024, 1005, 175849. [Google Scholar] [CrossRef]
  6. Oketola, A.M.; Adegbola, T.A.; Jamiru, T.; Ogunbiyi, O.; Salifu, S. Advances in High-Entropy Alloy Research: Unraveling Fabrication Techniques, Microstructural Transformations, and Mechanical Properties. J. Bio-Tribo-Corros. 2025, 11, 79. [Google Scholar] [CrossRef]
  7. George, E.P.; Raabe, D.; Ritchie, R.O. High-Entropy Alloys. Nat. Rev. Mater. 2019, 4, 515–534. [Google Scholar] [CrossRef]
  8. Balaji, V.; Xavior, A.M. Development of High Entropy Alloys (HEAs): Current Trends. Heliyon 2024, 10, e26464. [Google Scholar] [CrossRef] [PubMed]
  9. Ye, Y.F.; Wang, Q.; Lu, J.; Liu, C.T.; Yang, Y. High-Entropy Alloy: Challenges and Prospects. Mater. Today 2016, 19, 349–362. [Google Scholar] [CrossRef]
  10. Tolokonnikova, V.V.; Baisanov, S.O.; Saulebek, Z.K.; Orlov, A.S. Mathematical Description of the Lines of Monovariant Phase Equilibria on the MnO-SiO2 phase equilibrium diagram. CIS Iron Steel Rev. 2023, 26, 105–110. [Google Scholar] [CrossRef]
  11. Akberdin, A.A.; Kim, A.S.; Sultangaziev, R.B.; Orlov, A.S. The Method of Mathematical Description of the Phase Composition Diagrams. CIS Iron Steel Rev. 2023, 25, 79–83. [Google Scholar] [CrossRef]
  12. Terlikbaeva, A.Z.; Alimzhanova, A.M.; Maldybayev, G.; Mukhametzhanova, A.; Sakhova, B.; Koishina, G.M.; Zharmenov, A.A. The Influence of Zirconium Addition on the Structure and Properties of Ti-2.5 Al–5V-5mo Alloy Sheets. Case Stud. Chem. Environ. Eng. 2024, 10, 100964. [Google Scholar] [CrossRef]
  13. Alimzhanova, A.M.; Terlikbaeva, A.Z.; Sakhova, B.T.; Shayakhmetova, R.A.; Koishina, G.M.; Mukhametzhanova, A.A.; Maldybaev, G.K. The Role of Zirconium in the Formation of the Microstructure and Properties of Titanium Alloys During Superplastic Deformation. Eng. J. Satbayev Univ. 2025, 147, 1–9. [Google Scholar] [CrossRef]
  14. Jindal, V.; Sarda, A.; Degnah, A.; Ravi Chandran, K.S. Effect of Iron & Boron Content on the Spark Plasma Sintering of Ti-B-Fe Alloys. Adv. Powder Technol. 2019, 30, 423–427. [Google Scholar] [CrossRef]
  15. Sharma, M.; Ortlepp, I.; Bleck, W. Boron in Heat-Treatable Steels: A Review. Steel Res. Int. 2019, 90, 1900133. [Google Scholar] [CrossRef]
  16. Hsu, C.-Y.; Yeh, J.-W.; Chen, S.-K.; Shun, T.-T. Wear Resistance and High-Temperature Compression Strength of Fcc CuCoNiCrAl0. 5Fe Alloy with Boron Addition. Metall. Mater. Trans. A 2004, 35, 1465–1469. [Google Scholar] [CrossRef]
  17. Terzic, A.; Calcagnotto, M.; Guk, S.; Schulz, T.; Kawalla, R. Influence of Boron on Transformation Behavior During Continuous Cooling of Low Alloyed Steels. Mater. Sci. Eng. A 2013, 584, 32–40. [Google Scholar] [CrossRef]
  18. Zhou, X.; Kumar, S.; Zhang, S.; Chen, X.; Gault, B.; Dehm, G.; Hickel, T.; Raabe, D. Boron Triggers Grain Boundary Structural Transformation in Steel. Nat. Commun. 2025, 16, 6927. [Google Scholar] [CrossRef] [PubMed]
  19. Wang, W.; Takata, N.; Suzuki, A.; Kobashi, M.; Kato, M. Design of Al–Fe–Mn Alloy for Both High-Temperature Strength and Sufficient Processability of Laser Powder Bed Fusion. Addit. Manuf. 2023, 68, 103524. [Google Scholar] [CrossRef]
  20. Belov, N.A.; Bel’tyukova, S.O.; Belov, V.D.; Alimzhanova, A.M. Quantitative Analysis of the Phase Composition of the Ti–Al–Mo–V–Zr System as Applied to Castable Titanium Alloy VT20L. Met. Sci. Heat Treat. 2016, 58, 153–158. [Google Scholar] [CrossRef]
  21. Jia, Y.; Wang, Z.; Wu, Q.; Wei, Y.; Bai, X.; Liu, L.; Wang, J.; Liu, X.; Wang, L.; He, F.; et al. Boron Microalloying for High-Temperature Eutectic High-Entropy Alloys. Acta Mater. 2024, 262, 119427. [Google Scholar] [CrossRef]
  22. Yerekeyeva, G.; Kelamanov, B.; Tolokonnikova, V.; Abdirashit, A. Investigation of Al-Si-Mn Alloy Smelting Based on Thermodynamic Analysis of Phase Diagrams. Metals 2026, 16, 437. [Google Scholar] [CrossRef]
  23. Mushnikov, N.V.; Popov, A.G.; Gaviko, V.S.; Protasov, A.V.; Kleinerman, N.M.; Golovnya, O.A.; Naumov, S.P. Peculiarities of Phase Diagram of Fe-Ni System at Ni Concentrations 0–20 at.%. Acta Mater. 2022, 240, 118330. [Google Scholar] [CrossRef]
  24. Wang, Z.; Zhang, X.; Liu, M.; Zhou, Y.; Zha, Z.; Li, C.; Yang, Y.; Wang, J.; Jiang, F. Microstructure Characterization and Mechanical Properties of the 304SS-(NiTif/FeAl) Metal-Intermetallic Laminate Composites. J. Alloys Compd. 2023, 943, 169117. [Google Scholar] [CrossRef]
  25. Niu, Y.; Chen, H.; Zhang, X.; Li, S.; Cong, D.; Ma, T.; Li, S.; Lin, J.; Wang, Y.-D. Achieving Excellent Superelasticity and Extraordinary Elastocaloric Effect in a Directionally Solidified Co-V-Ga Alloy. Scr. Mater. 2021, 204, 114123. [Google Scholar] [CrossRef]
  26. Guan, L.; Zheng, Z.; Guo, Y. Enhanced Hole Transport in Benzoic Acid Doped Spiro-OMeTAD Composite Layer with Intergrowing Benzoate Phase for Perovskite Solar Cells. J. Alloys Compd. 2020, 832, 154991. [Google Scholar] [CrossRef]
  27. Szajna, E.; Moskal, G.; Tupaj, M.; Dresner, J.; Dudek, A.; Szymański, K.; Tomaszewska, A.; Trzcionka-Szajna, A.; Mikuśkiewicz, M.; Łysiak, K. The Influence of Laser Remelting on Microstructural Changes and Hardness Level of Flame-Sprayed NiCrBSi Coatings with Tungsten Carbide Addition. Surf. Coat. Technol. 2024, 478, 130403. [Google Scholar] [CrossRef]
  28. Vidaković, I.; Šimunović, K.; Heffer, G.; Špada, V. Microstructural Analysis of Flame-Sprayed and PTA-Deposited Nickel-Based Self-Fluxing Alloy Coatings. Weld. World 2024, 68, 2819–2836. [Google Scholar] [CrossRef]
  29. Buitkenov, D.; Raisov, N.; Alimbekuly, T.; Alibekova, B. Study of the Tribological Properties of Self-Fluxing Nickel-Based Coatings Obtained by Gas-Flame Spraying. Crystals 2025, 15, 862. [Google Scholar] [CrossRef]
Figure 1. Three-dimensional response surfaces illustrating the combined effect of temperature and boron content on phase composition in the Fe–Ni–Cr–Cu–Si–B–C alloy system: (a) metallic Fe content and (c) Fe2B boride content; (b,d) corresponding contour plots showing iso-concentration lines as a function of temperature and boron concentration.
Metals 16 00889 g001
Figure 2. Temperature dependence of CALPHAD equilibrium-predicted phase composition in the alloy with an initial composition of 20Fe–21Ni–18Cr–22Cu–10Si–4B–5C (wt.%): (a) major phases; (b) minor phases.
Metals 16 00889 g002
Figure 3. CALPHAD-calculated phase evolution as a function of temperature (400–1800 °C) in the Fe–Ni–Cr–Cu–Si–B–C alloy system (Fe–Ni–Cr–Cu–Si–B–C, wt.%), showing the stability ranges of major phases and liquid regions.
Metals 16 00889 g003
Figure 4. CALPHAD-calculated high-temperature phase diagram of the Fe–Ni–Cr–Cu–Si–B–C alloy system as a function of carbon content (0–5 wt.%) and temperature (400–1800 °C), showing phase stability regions and multiphase equilibria in the liquid and solid domains.
Metals 16 00889 g004
Figure 5. SEM micrograph of the Fe–Ni–Cr–Cu–Si–B–C alloy showing representative boride-rich, carbide-rich, and Si-rich regions identified from SEM/WDS observations.
Metals 16 00889 g005
Figure 6. SEM image and corresponding WDS elemental maps of the Fe–Ni–Cr–Cu–Si–B–C alloy.
Metals 16 00889 g006
Figure 7. X-ray diffraction (XRD) pattern of the Fe–Ni–Cr–Cu–Si–B–C alloy.
Metals 16 00889 g007
Figure 8. Vickers microhardness measured across the coating, diffusion zone, and steel substrate for the 19.9Fe–20.9Ni–18.5Cr–22.6Cu–10Si–3.8B–4.3C, wt.% alloy. Four independent indentations were performed in each region. The individual data points represent the measured hardness values, whereas the values labeled “mean” correspond to the average hardness ± standard deviation.
Metals 16 00889 g008
Table 1. Quantitative phase composition of the Fe–Ni–Cr–Cu–Si–B–C alloy (19.9Fe–20.9Ni–18.5Cr–22.6Cu–10Si–3.8B–4.3C, wt.%).
Temperature, °CPhaseQ, wt.%Element Content, wt.%
FeNiCuCrSiBC
1646L191.0528.1021.6114.8319.2610.303.961.94
L26.021.992.2093.010.781.430.560.01
C2.930.000.000.000.000.000.1299.88
1640L98.0933.2618.8818.0416.749.033.470.57
L21.912.602.1092.831.000.900.400.00
1570L157.9418.8429.8314.7918.0213.623.741.16
L28.601.292.0693.000.822.120.720.00
L321.6824.1811.788.5337.256.947.403.90
C11.770.000.000.000.000.000.1799.83
1222L115.310.571.0496.130.172.020.060.00
C11.140.000.000.000.000.000.0399.97
M2B25.7439.600.470.0050.780.009.140.00
M2Si28.3119.6060.700.000.0019.700.000.00
β11.3220.130.080.0062.820.0016.970.00
SiC8.180.000.000.000.0070.040.0029.96
1101L115.010.350.5797.340.050.160.021.50
C7.450.000.000.000.000.000.0299.98
M2B35.5243.770.370.0046.750.009.110.00
M2Si29.3321.4558.910.000.0019.640.000.00
β4.8727.480.070.0055.570.0016.890.00
SiC7.900.000.000.000.0070.040.0029.96
762α14.340.070.1299.730.080.000.000.00
C0.910.000.000.000.000.000.0199.99
M2B42.9047.100.050.0043.760.009.090.00
Ni31Si1231.0929.0454.660.000.0016.300.000.00
SiC10.750.000.000.000.0070.040.0029.96
680α14.310.020.1099.850.010.030.000.00
C10.400.000.000.000.000.000.00100.00
M2B21.4539.620.050.0051.190.009.140.00
β14.2814.420.000.0068.540.0017.040.00
Ni31Si1225.6717.8865.890.000.0016.230.000.00
SiC13.880.000.000.000.0070.040.0029.96
638CO2Si26.3438.0742.250.000.0019.680.000.00
α14.310.020.0399.890.060.000.000.00
M2B42.8947.130.010.0043.760.009.100.00
Ni31Si1212.7734.4149.250.000.0016.340.000.00
SiC3.690.000.000.000.0070.040.0029.96
Table 2. Elemental composition of the sample (wt.%) with estimated confidence intervals.
ElementMass Fraction (wt.%)Confidence Interval (±wt.%)
C4.3±0.13
Si10.0±0.30
B3.8±0.04
Cr18.5±0.60
Fe19.9±0.65
Ni20.9±0.70
Cu22.6±0.75
Table 3. Results of pull-off adhesion tests for the 19.9Fe–20.9Ni–18.5Cr–22.6Cu–10Si–3.8B–4.3C coating.
Pin Diameter, mmCross-Sectional Area, mm2Maximum Load, kgfPull-Off Adhesion Strength, MPa
5.0219.0085046.27
5.2021.5395048.01
5.0220.88110049.03
5.2621.10120053.68
5.4422.66130061.30
Mean ± SD (n = 5)51.66 ± 6.05
Disclaimer/Publisher’s Note: The statements, opinions and data contained in all publications are solely those of the individual author(s) and contributor(s) and not of MDPI and/or the editor(s). MDPI and/or the editor(s) disclaim responsibility for any injury to people or property resulting from any ideas, methods, instructions or products referred to in the content.