Article

A Causal XAI Diagnosis and Optimization Framework for Hot-Rolled Strip Shape Incorporating Hybrid Structure Learning


1
Collaborative Innovation Center of Steel Technology, University of Science and Technology Beijing, Beijing 100083, China
2
Manufacturing Department, Ansteel Co., Ltd., Anshan 114033, China
*
Author to whom correspondence should be addressed.
Metals 2026, 16(4), 401; https://doi.org/10.3390/met16040401
Submission received: 14 March 2026 / Revised: 1 April 2026 / Accepted: 2 April 2026 / Published: 3 April 2026

Abstract

Accurate shape control is paramount for ensuring the quality of hot-rolled strip products, which is significantly challenged by the high dimensionality, inherent nonlinearity, and strong coupling of process parameters. While machine learning (ML) methods have demonstrated superior predictive performance in product quality modeling, the inherent “black-box” nature and lack of transparency severely undermine system reliability and hinder practical deployment. Existing explainable artificial intelligence (XAI) approaches predominantly rely on statistical correlations while overlooking the underlying causal mechanisms among coupled variables, which severely limits the validity of explanations. To address these limitations, a causal XAI diagnosis and optimization framework for hot-rolled strip shape is proposed. Initially, a hybrid causal structure learning module is established, which integrates domain knowledge with the NOTEARS-MLP algorithm to accurately reconstruct the causal topology and decode the complex coupling mechanisms among process parameters. Subsequently, a high-performance quality prediction module utilizing AutoML techniques is constructed to establish a robust predictive baseline. Furthermore, a causal XAI and quality optimization module is introduced, which incorporates causal constraints into standard Shapley additive explanation (SHAP) analysis for transparent diagnosis, and employs piecewise linear analysis (PLR) to generate sample-specific optimization strategies. Comprehensive experimental validation demonstrates that the prediction module significantly outperforms state-of-the-art ML approaches across multiple performance metrics. Additionally, comparative analysis reveals that the optimization strategy based on causal feature attribution exhibits 14.7% defect rate reduction over the associational baseline, which is effective, efficient and establishes a new benchmark for causal explainability in industrial process optimization applications.

1. Introduction

Hot rolling processes play a crucial role in modern steel manufacturing, enabling the production of high-quality strip products that meet specific industrial specifications. With the rapid advancement of manufacturing technologies and increasingly demanding market requirements, the quality standards for strip shape have become progressively more stringent [1]. Shape defects, particularly crown and flatness deviations, pose significant threats to product quality and can lead to substantial economic losses and downstream processing difficulties. In essence, the strip shape is the final physical manifestation of a continuous causal chain, where any slight deviation in mechanical adjustments or thermal conditions can propagate and escalate through the process. The hot rolling process involves complex multi-stand collaborative operations characterized by inheritance effects, nonlinear dynamics, and strong coupling among numerous process parameters, which collectively present formidable challenges for effective strip shape control [2]. This inherent “inheritance effect” dictates that the shape quality is not merely a reflection of seemingly plausible statistical correlations, but a direct consequence of upstream-to-downstream physical causality. Given these inherent complexities and the critical importance of shape quality, the implementation of proactive shape defect diagnosis has emerged as an essential strategy for preventing potential quality issues and production disruptions. By identifying and understanding the root causes underlying shape defects, manufacturers can implement targeted adjustments and process improvements to enhance both product quality and operational efficiency.
Mathematical model-based approaches, including finite difference method (FDM) and finite element method (FEM), have historically served as the foundation for strip shape control [3,4]. However, inherent simplifications of complex operating conditions and excessive computational demands often compromise prediction accuracy and limit real-time applicability in dynamic production environments [5]. Consequently, data-driven ML techniques [6,7,8,9,10,11,12] have gained prominence for capturing complex nonlinear relationships between process parameters and quality outcomes, with emerging AutoML methods further streamlining model development via automated algorithm selection and hyperparameter optimization [13,14,15,16]. However, despite such efficiency, the opaque “black-box” nature of these models remains a critical bottleneck, restricting insights into the underlying physical mechanisms [17]. While XAI tools like SHAP provide insights into model predictions, such methods primarily focus on statistical interpretation of feature importance while neglecting the causal relationships among variables [18,19,20]. In hot rolling scenarios characterized by strong parameter coupling, standard SHAP is governed by the symmetry axiom and treats coupled features equally, leading to an inability to distinguish genuine causal influences from spurious statistical correlations. Considering that metallurgical relationships are inherently asymmetric and follow a strict production sequence, this symmetry axiom often forces the model to generate seemingly plausible but physically inconsistent diagnostic results by confusing downstream symptoms with upstream root causes [21]. This limitation underscores the necessity for causal XAI, where relaxing the symmetry axiom to incorporate causal constraints offers a rigorous pathway for scientifically grounded diagnosis and optimization [22].
The acquisition of causal constraints can be realized through two complementary approaches. On one hand, the extensive domain knowledge accumulated in steel production processes has established numerous temporal causal relationships, such as the deterministic influence of upstream process parameters on downstream product quality. On the other hand, for process parameters without explicit temporal ordering, causal structure learning algorithms can be employed to discover latent causal relationships. Traditional methods include constraint-based algorithms such as the Peter–Clark (PC) algorithm [23] and fast causal inference (FCI) [24], score-based approaches like the greedy equivalence search (GES) algorithm [25], and functional causal methods such as the linear non-gaussian acyclic model (LiNGAM) [26] and additive noise model (ANM) [27]. However, while these algorithms can theoretically uncover dependencies, without the guidance of physical laws, they often generate relationships that are only seemingly plausible but functionally impossible in a real-world finishing mill. These traditional approaches face significant limitations when applied to high-dimensional industrial datasets: constraint-based methods suffer from poor statistical performance with finite samples and high computational complexity, while score-based methods are prone to local optima and combinatorial explosion [28,29]. Recently, the NOTEARS framework [30] has revolutionized causal structure learning by reformulating the combinatorial optimization problem into a continuous optimization framework, eliminating the need for explicit acyclicity constraints through a novel algebraic characterization. This breakthrough enables more efficient and scalable causal discovery. Building upon this foundation, NOTEARS-MLP [31] extends the framework to handle complex nonlinear relationships prevalent in industrial processes by incorporating multilayer perceptron (MLP), making it particularly well-suited for identifying causal structures in the high-dimensional, nonlinear hot rolling datasets. In the high-dimensional and noisy environment of hot rolling, this differentiable approach, when integrated with domain-specific temporal constraints, provides a robust mechanism to decode the complex coupling among process parameters while maintaining physical consistency.
To address the aforementioned challenges in strip shape defect diagnosis, this paper proposes a comprehensive causal XAI diagnosis and optimization framework. By integrating causal logic into the diagnostic process, the framework ensures that the derived insights are not merely seemingly plausible statistical artifacts but are deeply rooted in the physical mechanisms of hot rolling. The proposed framework comprises three interconnected modules: a hybrid causal structure learning module that combines domain knowledge with the NOTEARS-MLP algorithm to discover causal relationships among process parameters and uncover the coupling effects; a high-precision strip shape prediction module based on AutoML, which automatically selects the most efficient model and optimizes hyperparameters with minimal manual intervention; and a causally constrained XAI module that provides transparent and interpretable diagnostic insights while enabling sample-based process parameter optimization strategies through PLR.
The main contributions of this work are summarized as follows:
(1)
A systematic causal diagnostic framework for hot-rolled strip shape analysis is proposed, which bridges the gap between data-driven “black-box” models and underlying physical manufacturing mechanisms by integrating causal discovery, predictive modeling, and causal XAI.
(2)
A hybrid causal structure learning strategy is introduced, combining prior domain knowledge with data-driven approaches. This strategy enhances robustness in noisy industrial environments by filtering out seemingly plausible but physically incorrect correlations found in raw data.
(3)
A sample-specific process parameter optimization strategy is developed by employing PLR to capture nonlinear influence patterns. This approach translates abstract feature attributions into actionable intervention magnitudes, providing precise guidance for process adjustments in abnormal samples.
The remainder of the paper is organized as follows. Section 2 introduces the hot-rolling mechanism and establishes the theoretical foundations of SHAP, causal XAI, and the NOTEARS-MLP algorithm. Section 3 illustrates the details of the proposed causal diagnostic framework. The case study and analysis for hot-rolled strip shape are shown in Section 4. Finally, Section 5 presents the conclusions and future work of this paper.

2. Materials and Methods

2.1. Hot-Rolling Mechanism

Hot strip rolling is a critical steel manufacturing process where final product quality is predominantly determined by finishing mill operations. This study investigates strip shape control in a seven-stand finishing mill line (F1~F7) equipped with four-high HCW (high crown mill with work roll shifting) technology, as illustrated in Figure 1, which is configured as a multi-machine cooperative machining (MCM) cell to achieve the required thickness reduction through sequential rolling passes [32]. Each stand consists of two backup rolls and two work rolls, where hydraulic systems apply controlled forces to reduce strip thickness as material passes between the work rolls. The essence of strip shape control lies in managing the “loaded roll gap profile.” Under the enormous rolling force required for thickness reduction, the rolls inevitably undergo elastic deflection and flattening, which tends to create a non-uniform gap and subsequent quality deviations [33].
Operational complexity in finishing mills stems from intricate parameter coupling. In HCW mills, strip shape control relies on three primary variables: rolling force, which regulates work roll deflection and contact pressure; bending force, which adjusts roll contour to maintain target geometry; and shift amount, which optimizes roll wear and crown distribution. These actuators provide essential degrees of freedom to counteract roll deformation. Specifically, bending force provides high-frequency, real-time adjustments for local flatness, while work roll shifting redistributes contact pressure and manages the uneven wear across the roll barrel. Additionally, transverse temperature variations introduce non-uniform thermal expansion, creating asymmetric deformation patterns [34]. This “thermal crown,” arising from the heat transfer between the strip and rolls, acts as a time-varying disturbance that complicates the causal relationship between mechanical adjustments and shape outcomes. The interaction between these mechanical and thermal effects ultimately determines strip shape quality, with specific equipment parameters detailed in Table 1.
Strip shape quality is primarily characterized by two fundamental geometric indicators: strip crown and flatness [35,36]. Strip crown ( C 40 ) quantifies the cross-sectional thickness profile [12,37], as illustrated in Figure 2a. It is mathematically defined as the difference between the strip centerline thickness ( h c ) and the average thickness at standardized reference points located 40 mm from the edges:
C 40 = h c h i + h i 2
Physically, the crown represents the unevenness of transverse metal distribution. In the upstream stands of the finishing mill, where the strip is relatively thick, the material possesses sufficient “lateral flow” capability to accommodate changes in the roll gap profile.
Complementarily, strip flatness characterizes the longitudinal deformation uniformity. In the downstream stands, the strip becomes significantly thinner, which severely restricts the lateral flow of metal. According to the principle of volume constancy, any uncompensated transverse thickness deviation (crown change) is forced to transform into a difference in longitudinal elongation across the width. Based on the longitudinal fiber model analysis, flatness defects arise when these differential elongation rates create non-uniform residual internal stresses [36]. When the compressive stress exceeds the critical buckling limit of the thin strip, morphological defects manifest as waves. Depending on the specific stress concentration zones, these manifest as characteristic morphological defects—including center waves, edge waves, and quarter waves, as depicted in Figure 2b—which are real-time monitored alongside crown deviations using radiation-based gauges and stress measurement systems to ensure rigorous quality compliance [38,39].

2.2. Theoretical Foundations of Causal XAI and Feature Attribution

In the field of intelligent manufacturing, machine learning models have become indispensable tools for the quality monitoring and anomaly diagnosis of hot-rolled strip shape. However, to transform these high-performance “black-box” models into actionable diagnostic insights, it is essential to employ feature attribution methods. These methods aim to crack the model’s decision-making process by quantifying the specific contribution of each process parameter to a given quality defect such as strip shape deviations, thereby providing a scientific basis for root-cause tracing and process optimization.
SHAP provides a unified interpretability framework rooted in cooperative game theory, guaranteeing unique feature attributions through four fundamental axioms: efficiency, linearity, nullity, and symmetry [40]. At its core, Shapley values (SVs) represent the contribution of each feature to the difference between the actual prediction and the average prediction. The Shapley value Φ i for feature i is formally defined as:
ϕ i ( f , x ) = S N { i } | S | ! ( | N | | S | 1 ) ! | N | ! [ f x ( S { i } ) f x ( S ) ]
where N is the set of all features, S represents subsets excluding feature i , and f x ( S ) denotes the value function, typically evaluated by taking the expectation of f ( x ) conditional on the coalition feature values S :
f x ( S ) = E [ f ( X ) | X s = x s , s S ]
With ϕ 0 = E ( f ( X ) ) , the feature contributions sum up to the prediction value (efficiency axiom):
j = 0 | S | ϕ i ( f , x ) = f ( x )
Despite the theoretical rigor of standard SHAP, the symmetry axiom imposes a fundamental limitation in industrial scenarios characterized by strong causal dependencies. This axiom mandates the uniform distribution of interaction effects among correlated features regardless of their underlying physical mechanisms [41]. In the context of a multi-stand finishing mill, where the physical state is propagated sequentially from upstream to downstream, treating these variables symmetrically leads to a “dilution” of feature importance. Specifically, standard SHAP may erroneously distribute the attribution of a root-cause parameter among its downstream consequences, resulting in diagnostic outcomes that are statistically plausible but physically inconsistent.
To overcome this rigidity, the adopted causal XAI framework extends standard SHAP by relaxing the symmetry axiom to explicitly accommodate causal structures [42,43]. Specifically, the distinction lies in the treatment of variable interactions, defined where combined predictive capability differs from the sum of individual contributions f x ( i ) + f x ( j ) / f x ( i , j ) . Causal XAI formally introduces causal feature attribution using asymmetric interaction allocation:
ϕ i ω ( f , x ) = π Π ω ( π ) [ f x ( P i π { i } ) f x ( P i π ) ]
where Π is the set of all permutations, and P i π denotes the predecessors of feature i in permutation π . In a manufacturing sequence, these predecessors correspond to the process parameters situated upstream of the variable under evaluation. To enforce causal precedence, a distal weighting scheme is adopted to restrict the permutation space:
ω d i s t a l ( π ) 1 [ i , j : i A n c e s t o r s ( j ) π ( i ) < π ( j ) ]
This weighting ensures that causal ancestors (i.e., root-cause parameters) are consistently evaluated before their descendants (i.e., subsequent quality fluctuations). Consequently, whereas standard SHAP symmetrically distributes interaction effects among correlated features, causal XAI attributes these redundant contributions specifically to root causes. This ensures that feature importance aligns with the underlying data-generating mechanism rather than being diluted across downstream variables. This ensures that the diagnostic attribution aligns with the actual physical data-generating mechanism of the hot rolling line, providing engineers with precise and physically grounded targets for process intervention.

2.3. Principles of NOTEARS-MLP for Causal Discovery of Complex Process Parameters

In complex industrial manufacturing systems, particularly hot rolling processes, numerous process parameters exhibit intricate and high-dimensional coupling effects. Causal structure learning serves as a critical methodology to uncover the underlying causal topology among these variables, moving beyond mere statistical correlation to reveal the directional influence mechanisms. The causal topology identified through this process represents an essential structural input for the causal XAI framework discussed in Section 2.2, providing the foundational constraints required to ensure the physical consistency of diagnostic attributions.
NOTEARS-MLP reformulates the combinatorial graph structure learning problem into a continuous optimization framework utilizing neural networks to capture nonlinear causal dependencies [44]. This differentiable approach is particularly advantageous for industrial datasets where physical interactions—such as the nonlinear thermal–mechanical coupling between rolling force and strip temperature—manifest as complex, non-monotonic relationships that traditional linear models fail to characterize. The architecture employs an ensemble of N multilayer perceptrons (MLPs), where each regressor M j models the conditional distribution of variable X j given other variables. To prevent trivial autoregressive solutions, the weight corresponding to X j itself is strictly constrained to zero during the reconstruction. The forward propagation of the j -th MLP is expressed as:
X j = M j ( X ; θ j ) = σ ( σ ( X θ j 1 ) θ j 2 ) θ j H
where θ j l denotes the weight parameters of the l -th layer, and σ ( ) represents the nonlinear activation function.
Unlike linear models where causal strength corresponds directly to coefficients, extracting the causal adjacency matrix W in MLPs requires aggregating the sensitivity of the first-layer weights. By constructing a weight tensor T = [ θ 1 1 , , θ N 1 ] R N × N × D , the adjacency matrix W ( θ ) is derived via the L 2 -norm across the embedding dimension D :
W i j = | T i , j , : | 2
which ensures that W i j > 0 if and only if variable X i functionally depends on X j . From an engineering perspective, W i j serves as a quantitative measure of the functional dependency between coupled manufacturing variables.
To enforce the directed acyclic graph (DAG) property, a continuous acyclicity constraint based on the matrix exponential is applied to the extracted adjacency matrix:
h ( W ) = tr ( e W W ) N = 0
where denotes the Hadamard product. The final optimization objective combines the reconstruction loss, sparsity regularization, and the acyclicity constraint via the Augmented Lagrangian method [45]:
min θ F ( θ ) = 1 N j = 1 N X j M j ( X ) 2 2 + λ θ 1 + α h ( W ) + ρ 2 | h ( W ) | 2
where λ balances sparsity, while α and ρ control the penalty strength for the acyclicity constraint. This differentiable framework allows for the efficient discovery of nonlinear causal structures using standard gradient-based optimization, providing a mathematically rigorous foundation for modeling the interdependencies in noisy industrial environments.

3. Model and Algorithms

3.1. Structure of the Proposed Step-Wise Framework

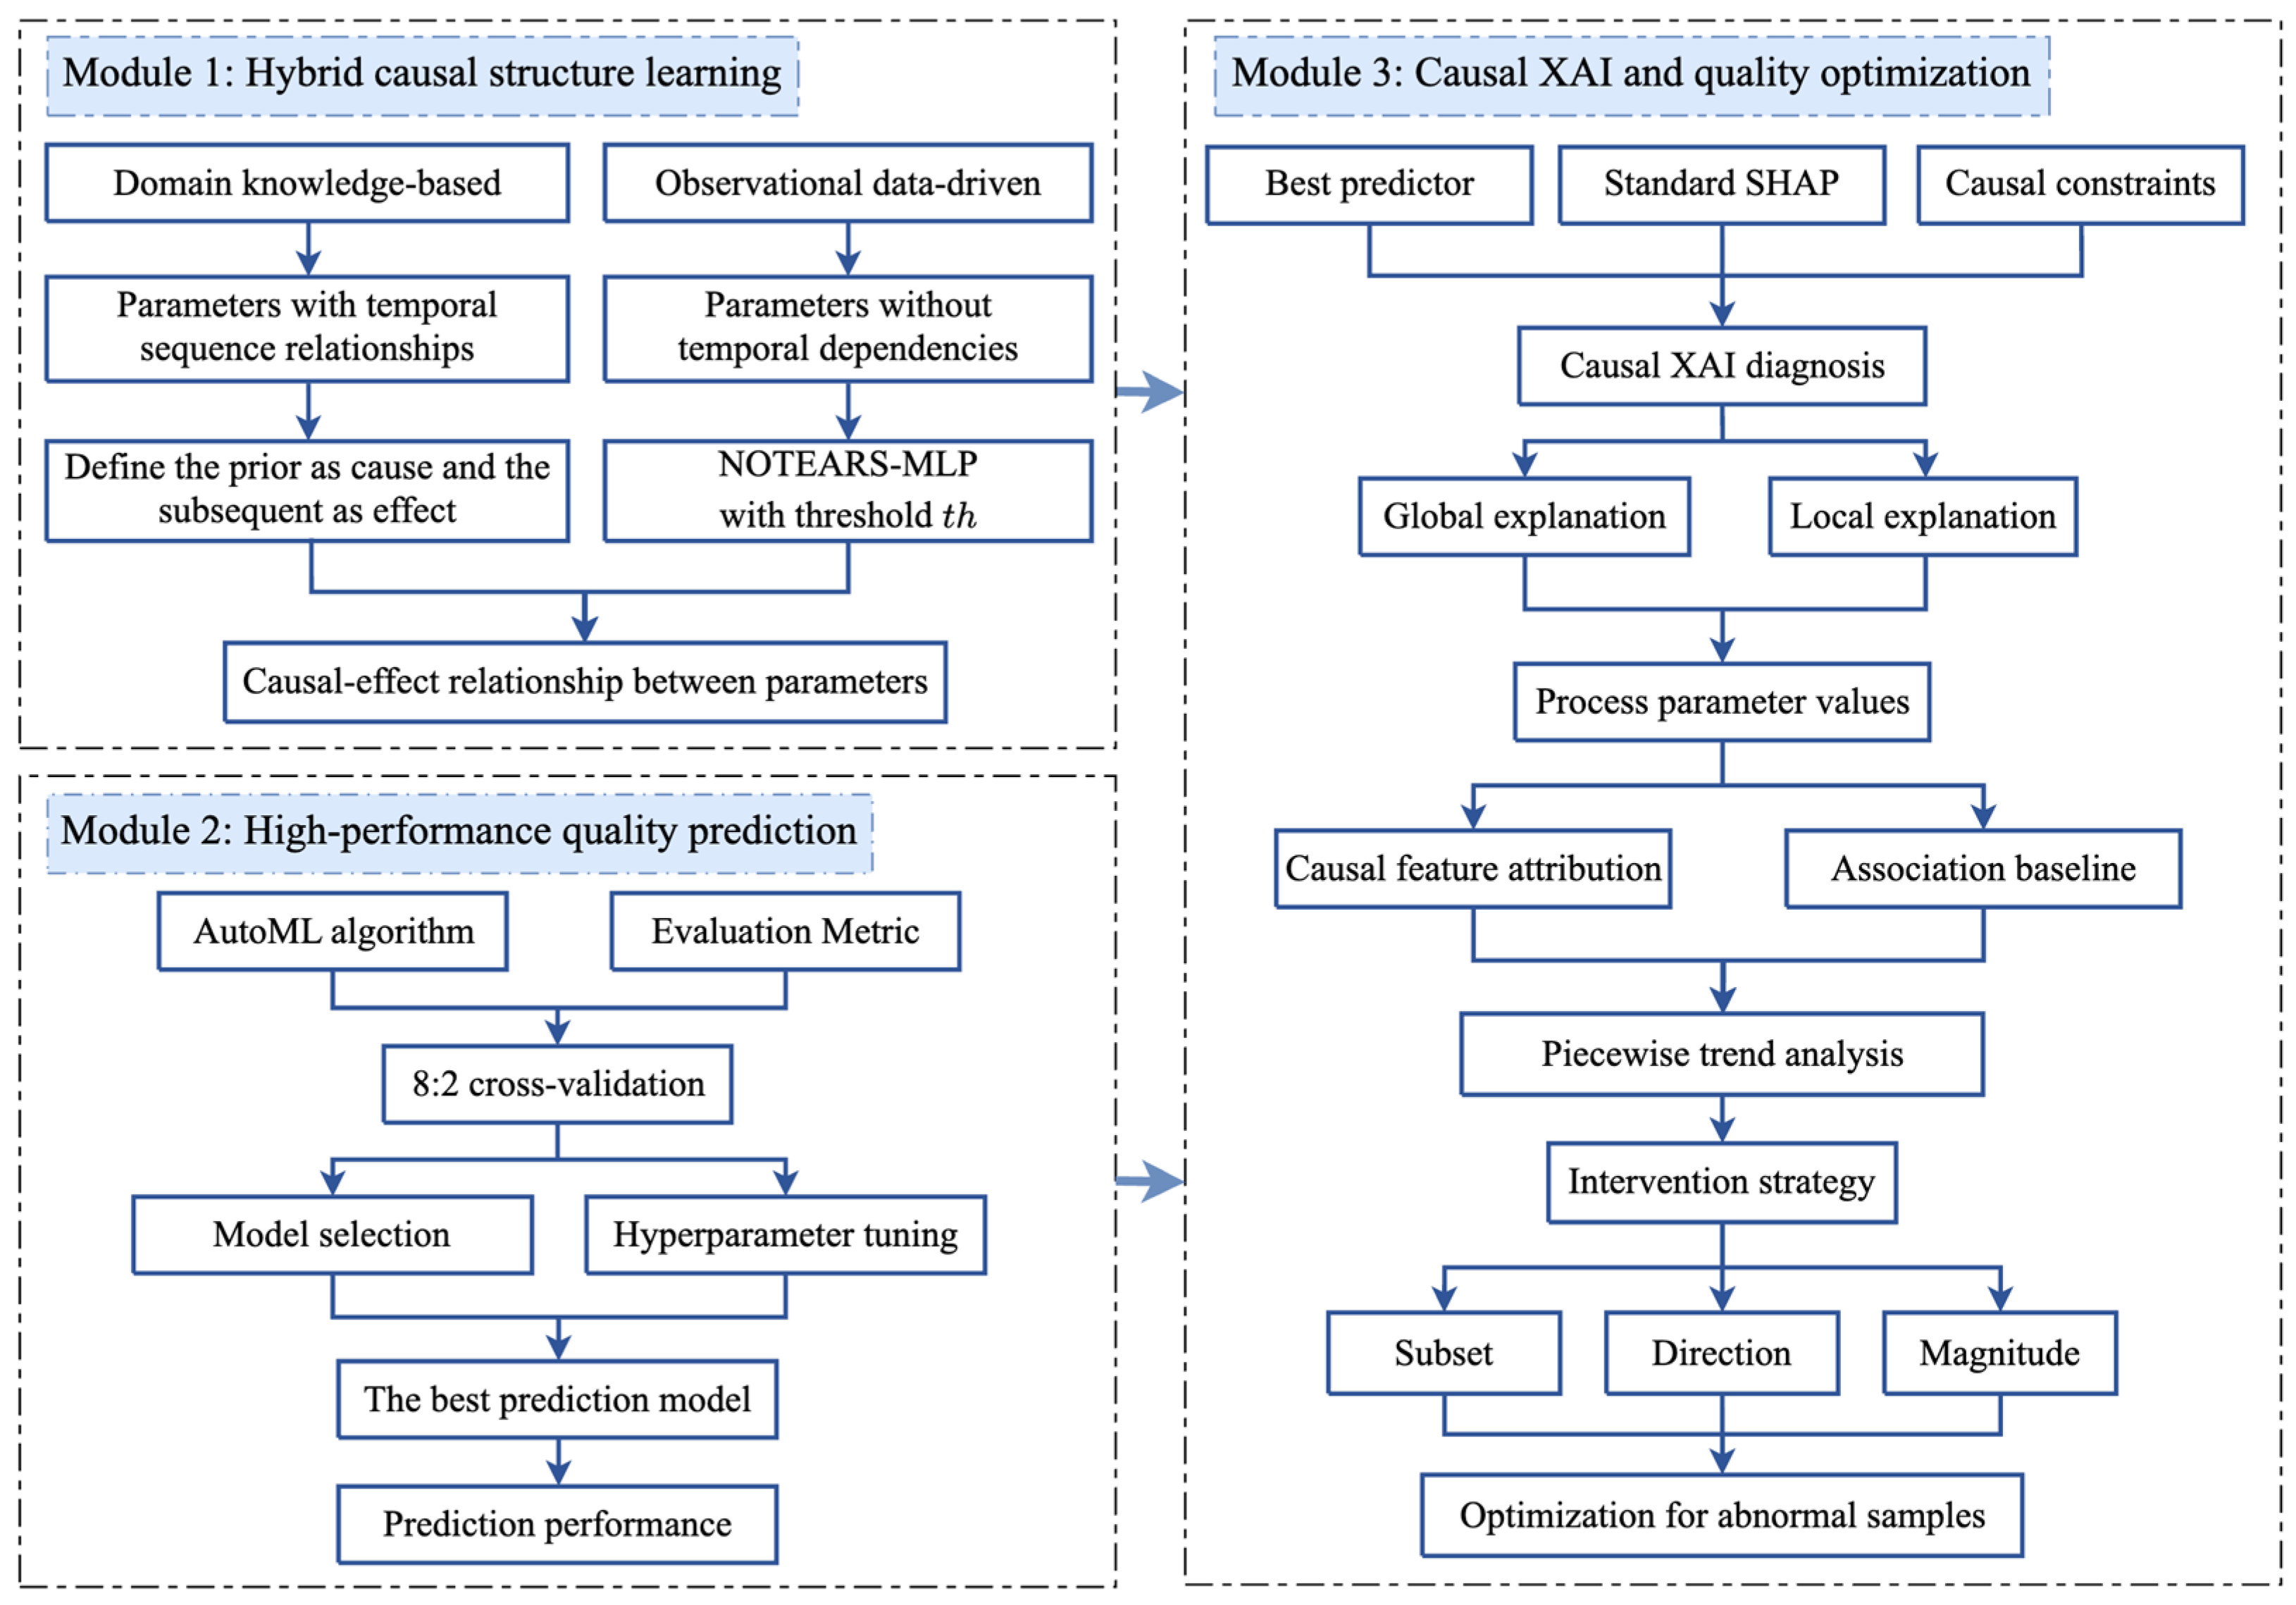
Considering the practical application requirements of hot rolling production lines and the high-dimensional, coupled characteristics of strip shape data, this paper proposes a novel causal XAI diagnosis and optimization framework. By integrating causal discovery with XAI, the framework overcomes the limitations of traditional “black-box” models, which frequently generate statistically sound but mechanistically invalid diagnostic conclusions. The framework architecture, illustrated in Figure 3, comprises three interconnected modules designed to address the complexities of industrial strip shape diagnosis while maintaining computational efficiency and interpretability. Beyond mere feature importance evaluation, this approach enables researchers and engineers to decipher the underlying decision-making mechanism for each individual strip and develop customized optimization strategies for samples exhibiting shape defects.
The framework operates through the following three sequential phases:
  • Hybrid causal structure learning module: The framework initiates by applying a hybrid strategy that integrates domain knowledge with the NOTEARS-MLP algorithm. This module is specifically engineered to account for the “physical asymmetry” of the rolling process; while global temporal sequences are established by the finishing mill layout, the latent causal topology among intra-stand parameters is identified via nonlinear causal discovery. By eliminating spurious dependencies that fail to align with established metallurgical principles, this module reconstructs a rigorous causal topology from process data, uncovering the profound coupling effects among parameters. The learned causal graph serves as the structural constraint for subsequent interpretability analysis.
  • High-performance quality prediction module: Parallelly or subsequently, an AutoML-based prediction module is employed to model the complex mapping between process parameters and shape quality. By performing autonomous model selection and hyperparameter optimization, this module establishes a robust predictive mapping with high precision, serving as the functional baseline for the diagnostic system. The high precision achieved here ensures that the causal attributions derived in the later stage are grounded in a high-fidelity representation of the manufacturing process.
  • Causal XAI and quality optimization module: The final module integrates the learned causal structure with the predictive model to initiate a causally constrained XAI interpretation process. The causal topology from Module 1 is vital here, as it provides the necessary DAG constraints to transform superficial statistical associations into directional physical attributions. By employing causal feature attribution, this module explains the decision-making process while respecting underlying physical mechanisms. Furthermore, it performs PLR to quantify the nonlinear relationship between parameter values and their causal contributions. Through comparative analysis against the associational baseline, targeted optimization strategies are generated for abnormal samples.
This causally informed approach ensures that diagnostic insights align with the physical principles governing strip shape formation, transforming the process from reactive defect detection to proactive quality management. The synergistic integration of structure learning, predictive modeling, and causal analysis establishes a comprehensive framework that advances both the theoretical understanding and practical implementation of intelligent strip shape quality control.

3.2. Causal Structure Learning Through Domain Knowledge and Data Fusion

To decipher the complex mechanisms governing strip shape formation, this study employs a hybrid discovery strategy that fuses deterministic domain knowledge with the NOTEARS-MLP algorithm. This approach ensures that the reconstructed causal topology respects both the macro-scale manufacturing sequence and the micro-scale parameter interactions through two complementary pathways.
(1) Domain-driven global temporal constraints are first established based on the unidirectional and irreversible physical flow of the manufacturing line: P r e - f i n i s h i n g F i n i s h i n g ( F 1 F 7 ) P o s t - f i n i s h i n g . This deterministic order imposes a rigorous temporal restriction on the causal discovery process. By leveraging this production-line precedence, the framework pre-defines the causal directions between inter-stage parameters, thereby eliminating mechanistically inconsistent “reverse-causality” errors—such as a downstream stand being erroneously identified as a cause for upstream conditions. This ensures that the global topological backbone remains inherently consistent with the physical reality of the rolling process.
(2) Data-driven intra-stand structure learning is simultaneously utilized to uncover latent coupling effects within individual stands, where parameter interactions occur within a shared mechanical environment and temporal dependencies are often implicit. To mitigate confounding bias and ensure a high-fidelity causal map, a specialized feature engineering strategy is implemented for each stand. This incorporates nine critical variables: two invariant features, namely carbon equivalent and exit width, are introduced to characterize the material’s inherent deformation resistance and geometric constraints; these are supplemented by seven stand-specific control parameters, including rolling gap, shift amount, bending force, rolling speed, rolling force, rolling reduction, and rolling temperature.
By analyzing these variables, the NOTEARS-MLP algorithm minimizes the continuous optimization objective to compute a weighted adjacency matrix that captures complex nonlinear dependencies. To further refine the model and prune spurious statistical artifacts arising from industrial sensor noise, a significance threshold t h is applied to the adjacency matrix, retaining only the most robust causal connections.
The resulting hybrid causal topology serves as an essential structural input for the Causal XAI module discussed in Section 2.2. By transforming raw industrial data into a mechanistically grounded DAG, this stage provides the necessary logical foundation to distinguish true process drivers from mere symptomatic fluctuations.

3.3. AutoML-Based High-Performance Shape Prediction

To establish a robust connection between complex manufacturing parameters and final quality outcomes, this module utilizes an automated machine learning approach to construct a high-precision predictive model. This model serves as the essential functional baseline that the subsequent causal XAI module will interpret to derive diagnostic insights. The prediction task is formulated as a binary classification problem where critical process parameters are extracted as input features X R n × p and the target variable y is defined as the binary strip shape defect status. The development of this high-performance predictive architecture involves three core technical phases:
(1) Feature formulation and data representation are first executed to capture the intricate physical characteristics and heredity inherent in the hot rolling process. Since the strip shape at the final stand is the cumulative result of deformations across the entire finishing line, the input space incorporates a comprehensive set of variables from all stands. This includes parameters such as rolling gap, shift amount, bending force, rolling speed, rolling force, rolling reduction, and rolling temperature. To address the challenge of class imbalance—a common characteristic of industrial quality data where defective samples are significantly outnumbered by qualified ones—the data pre-processing stage employs strategic sampling and normalization. This ensures the predictive model achieves sufficient sensitivity to identify the rare but critical patterns associated with shape deviations, thereby providing a reliable representation of the manufacturing state.
(2) The AutoML optimization pipeline is subsequently initiated to identify the most effective predictive architecture through autonomous model selection and intensive hyperparameter tuning. Rather than relying on manual trial-and-error, the framework utilizes an automated search strategy, such as Bayesian optimization, to systematically explore a vast hypothesis space of candidate algorithms. This candidate pool comprises high-performance learners including Random Forest, LightGBM, and CatBoost, which are implemented via AutoGluon (v1.0.0, Amazon Web Services, Seattle, WA, USA) in a Python (v3.8, Python Software Foundation, Wilmington, DE, USA) environment. These learners are specifically chosen for their superior ability to handle the tabular, nonlinear, and heterogeneous data patterns typical of mechanical rolling processes. The framework autonomously identifies the specific algorithm that best minimizes the objective function for the given dataset, ensuring the selection of a model that can accurately characterize the complex interdependencies within the manufacturing data.
(3) Hyperparameter optimization and generalization verification constitute the final stage to ensure the selected model achieves peak performance and remains resilient against industrial noise. Concurrent with model selection, the framework performs a fine-grained search to calibrate critical internal settings, such as learning rates, tree depth, and regularization coefficients, thereby maximizing the model’s capacity to capture nonlinear coupling effects. To prevent overfitting and ensure the model can effectively generalize to new production batches, a rigorous cross-validation strategy is adopted, utilizing an 80:20 training-to-validation split. The resulting high-precision predictive model establishes a mathematically rigorous mapping of the manufacturing process, providing the necessary accuracy to ensure that the causal attributions derived in the subsequent diagnostic stage are grounded in physical reality.

3.4. Causal XAI-Based Interpretation and Optimization Strategy

Following the structure learning and predictive modeling phases, this module implements a causally constrained interpretation and optimization approach to enhance diagnostic transparency and traceability. The primary objective is to transform abstract model outputs into actionable industrial intelligence by distinguishing between superficial statistical correlations and true physical drivers. The execution of this strategy is divided into three functional layers:
(1) Comparative analysis of attribution mechanisms is first conducted to rigorously evaluate the impact of causal constraints. The framework establishes an associational baseline, which operates independently of causal knowledge and distributes feature importance based on statistical dependencies. This serves as a control group to highlight the limitations of standard “black-box” interpretations. In contrast, the causal feature attribution explicitly incorporates the identified causal topology to re-allocate interaction effects from downstream symptoms to their respective causal ancestors (root causes). This mechanism ensures that the diagnostic insights remain consistent with the sequential physical generation mechanisms of the finishing mill, effectively preventing the “smearing” of importance across highly correlated but non-causal parameters.
(2) The transformation from interpretation to actionable prescription is achieved through a sample-specific optimization strategy. Since the calculated attribution values quantify the explicit contribution of each process parameter to the formation of a defect, they provide a direct compass for process adjustment. To capture the nonlinear influence patterns between parameter values and their corresponding contributions, a PLR approach is employed. This method segments the continuous parameter space into three distinct behavioral intervals based on the local slope k and a predefined sensitivity threshold T (e.g., 10 5 ):
  • Plain Influence: Defined as S I p l a i n = { x | k | < T } , indicating that variations in this parameter range have a negligible impact on the strip shape defect.
  • Positive Influence: Defined as S I p o s i t i v e = { x k > T } , implying that higher parameter values exacerbate the defect; consequently, the optimization logic dictates a reduction in the parameter value.
  • Negative Influence: Defined as S I n e g a t i v e = { x k < T } , suggesting that higher values mitigate the defect, thus necessitating an increase in the parameter value within its operationally feasible bounds.
(3) Algorithmic execution and validation constitute the final step of the optimization framework, as formally outlined in Algorithm 1. For a given set of abnormal samples, the algorithm identifies the top n intervention features based on their attribution magnitudes. It then iteratively adjusts these parameters according to the identified influence intervals and an intervention amplitude coefficient α , ensuring that all adjustments remain within the equipment’s physical limits. Finally, the optimized samples are re-evaluated using the high-precision predictive model to quantify the reduction in defect probability. This closed-loop validation demonstrates the comparative advantage of the causal approach, proving its superior ability to identify precise intervention targets compared to the associational baseline, which often suggests “seemingly plausible” but ineffective adjustments.
Algorithm 1 Process parameter optimization
Input: Attribution sets Φ s e t (containing causal feature attribution and associational baseline), Process parameters X , Number of optimized parameters n , Number of samples n u m , Sampling times l , Intervention amplitude α , Slope threshold T , Abnormal samples X a b n o r m a l
Output: Optimization results of abnormal samples
1: for each attribution type Φ { causal   feature   attribution ,   associational   baseline }  do
2:   for  i [ 1 , 2 , , l ]  do
3:     Randomly select n u m samples from X abnormal to form X treatment
4:     Select n process parameters { x 1 t , x 2 t , , x n t } with the highest contributions
5:     Perform PLR with attribution values and X and yield segmented intervals and slopes
6:     if  | slope | < T  then
7:       the corresponding interval is denoted as S I plain
8:     end if
9:     if slope > 0  and  | slope | > T  then
10:       the corresponding interval is denoted as S I positive
11:     end if
12:     if slope < 0  and  | slope | > T  then
13:       the corresponding interval is denoted as S I negative
14:     end if
15:     for  a [ 1 , 2 , , n u m ]  do
16:       for  b [ x 1 t , x 2 t , , x n t ]  do
17:         if  X treatment [ a , b ] S I positive  then
18:           X treatment [ a , b ] m i n ( X treatment [ a , b ] × ( 1 α ) ,   S I p o s i t i v e l o w e r )
19:         end if
20:         if  X treatment [ a , b ] S I negative  then
21:           X treatment [ a , b ] m a x ( X treatment [ a , b ] × ( 1 + α ) ,   S I n e g a t i v e u p p e r )
22:         end if
23:       end for
24:     end for
25:   end for
26: end for
27: return The optimized sample after intervention under both attribution types

4. Case Study and Discussion

4.1. Data Description and Preprocessing

To validate the proposed framework, experimental data were acquired from a 2150 mm hot rolling production line in Northeast China. Guided by the mechanistic analysis in Section 2, 54 input features were extracted to capture the hereditary and coupled characteristics of the manufacturing process. The data acquisition system synchronized high-frequency signals from hydraulic, mechanical, and thermal sensors across the entire finishing mill. The diagnostic target is formulated as a binary classification task to evaluate the overall stability of the strip shape. Rather than treating different morphological anomalies as independent categories, this study adopts a unified defect indicator (Label = 1) that encompasses five common types of shape deviations: crown deviation, center wave, edge wave, quarter wave, and coupled wave. This unified approach accounts for the fact that these defects often share overlapping physical root causes within the highly coupled environment of the finishing mill. (1) To ensure the objectivity of the binary labeling, a sample is designated as defective if it violates any of the metallurgical tolerances defined by the plant’s quality standards. Specifically, crown deviation is triggered when the absolute difference between the center and edge thickness exceeds 20 μm. (2) Wave-type defects, including center, edge, quarter, and coupled waves, are identified using the I-unit metric, which quantifies longitudinal elongation differences across the strip width; any segment exhibiting a flatness value greater than 10 I-units is labeled as 1. (3) By integrating these specific physical criteria into a single response variable, the framework focuses on identifying the deep-seated process fluctuations that compromise general shape quality.
The refinement and balancing of the raw industrial data followed a multi-stage preprocessing pipeline to ensure the robustness of the training phase. (1) First, a data alignment procedure was implemented to compensate for the transport delay between stands based on the instantaneous rolling speed, ensuring that all 54 features represent the same longitudinal segment of the strip. (2) Second, unsteady rolling phases—specifically the head and tail segments where the rolling force and temperature fluctuate violently due to the loss of tension—were excluded. (3) Finally, from an initial repository of 22,368 raw data points, a strategic sampling approach was applied to mitigate the class imbalance typical of industrial defect detection. This resulted in a refined and balanced dataset of 3843 samples, characterized by a near-equidistant class distribution with 52.04% qualified samples (Label = 0) and 47.96% defective samples (Label = 1). This balanced distribution ensures that the predictive model remains equally sensitive to both normal operational patterns and critical quality deviations.
The input feature space is composed of five global parameters characterizing the incoming material properties and exit requirements, alongside 49 stand-specific variables recorded across the seven-stand finishing mill (F1–F7). These features collectively provide a high-dimensional representation of the thermal, mechanical, and geometric states of the rolling process. The specific process parameters included in the analysis, along with their respective operational ranges and measurement units, are detailed in Table 2.

4.2. Hybrid Causal Structure Learning Among Process Parameters

By applying the hybrid structure learning strategy to the experimental dataset, a comprehensive causal topology governing the 54 process parameters was successfully reconstructed. The domain-driven analysis first categorized the parameters into a strict temporal hierarchy based on the production sequence. Specifically, the P r e - f i n i s h i n g stage comprises carbon equivalent and entrance thickness; the F i n i s h i n g stage spans seven stands, incorporating 49 stand-specific parameters; and the P o s t - f i n i s h i n g stage concludes with exit thickness and exit width. By enforcing the sequential constraint that upstream variables causally influence downstream ones, the framework immediately established 322 temporal causal relationships, forming the deterministic backbone of the global causal graph. This hierarchical constraint effectively prunes the search space by eliminating over 1500 physically impossible reverse-causal edges, thereby ensuring the structural integrity of the subsequently learned interactions.
Complementing this temporal backbone, the data-driven discovery via NOTEARS-MLP focused on the intra-stand parameters for each of the seven rolling stands. This computational process initially extracted 252 potential connections, with learned causal weights exhibiting a wide distribution reflecting varying degrees of coupling strength. To distinguish physically significant mechanisms from statistical artifacts arising from industrial sensor noise, a rigorous thresholding strategy was implemented based on the cumulative distribution of weight magnitudes. Statistical analysis indicated that the 75th percentile, corresponding to a threshold t h = 1.1861 , served as the optimal cutoff point. This threshold effectively filters out weak, unstable associations while retaining the top quartile of interaction strengths, ensuring a balance between sensitivity to genuine coupling effects and robustness against spurious correlations. Consequently, 37 significant intra-stand causal relationships were retained. These identified connections, combined with the temporal backbone, yielded a final causal framework comprising 359 edges, providing a dense yet interpretable structure for subsequent analysis.
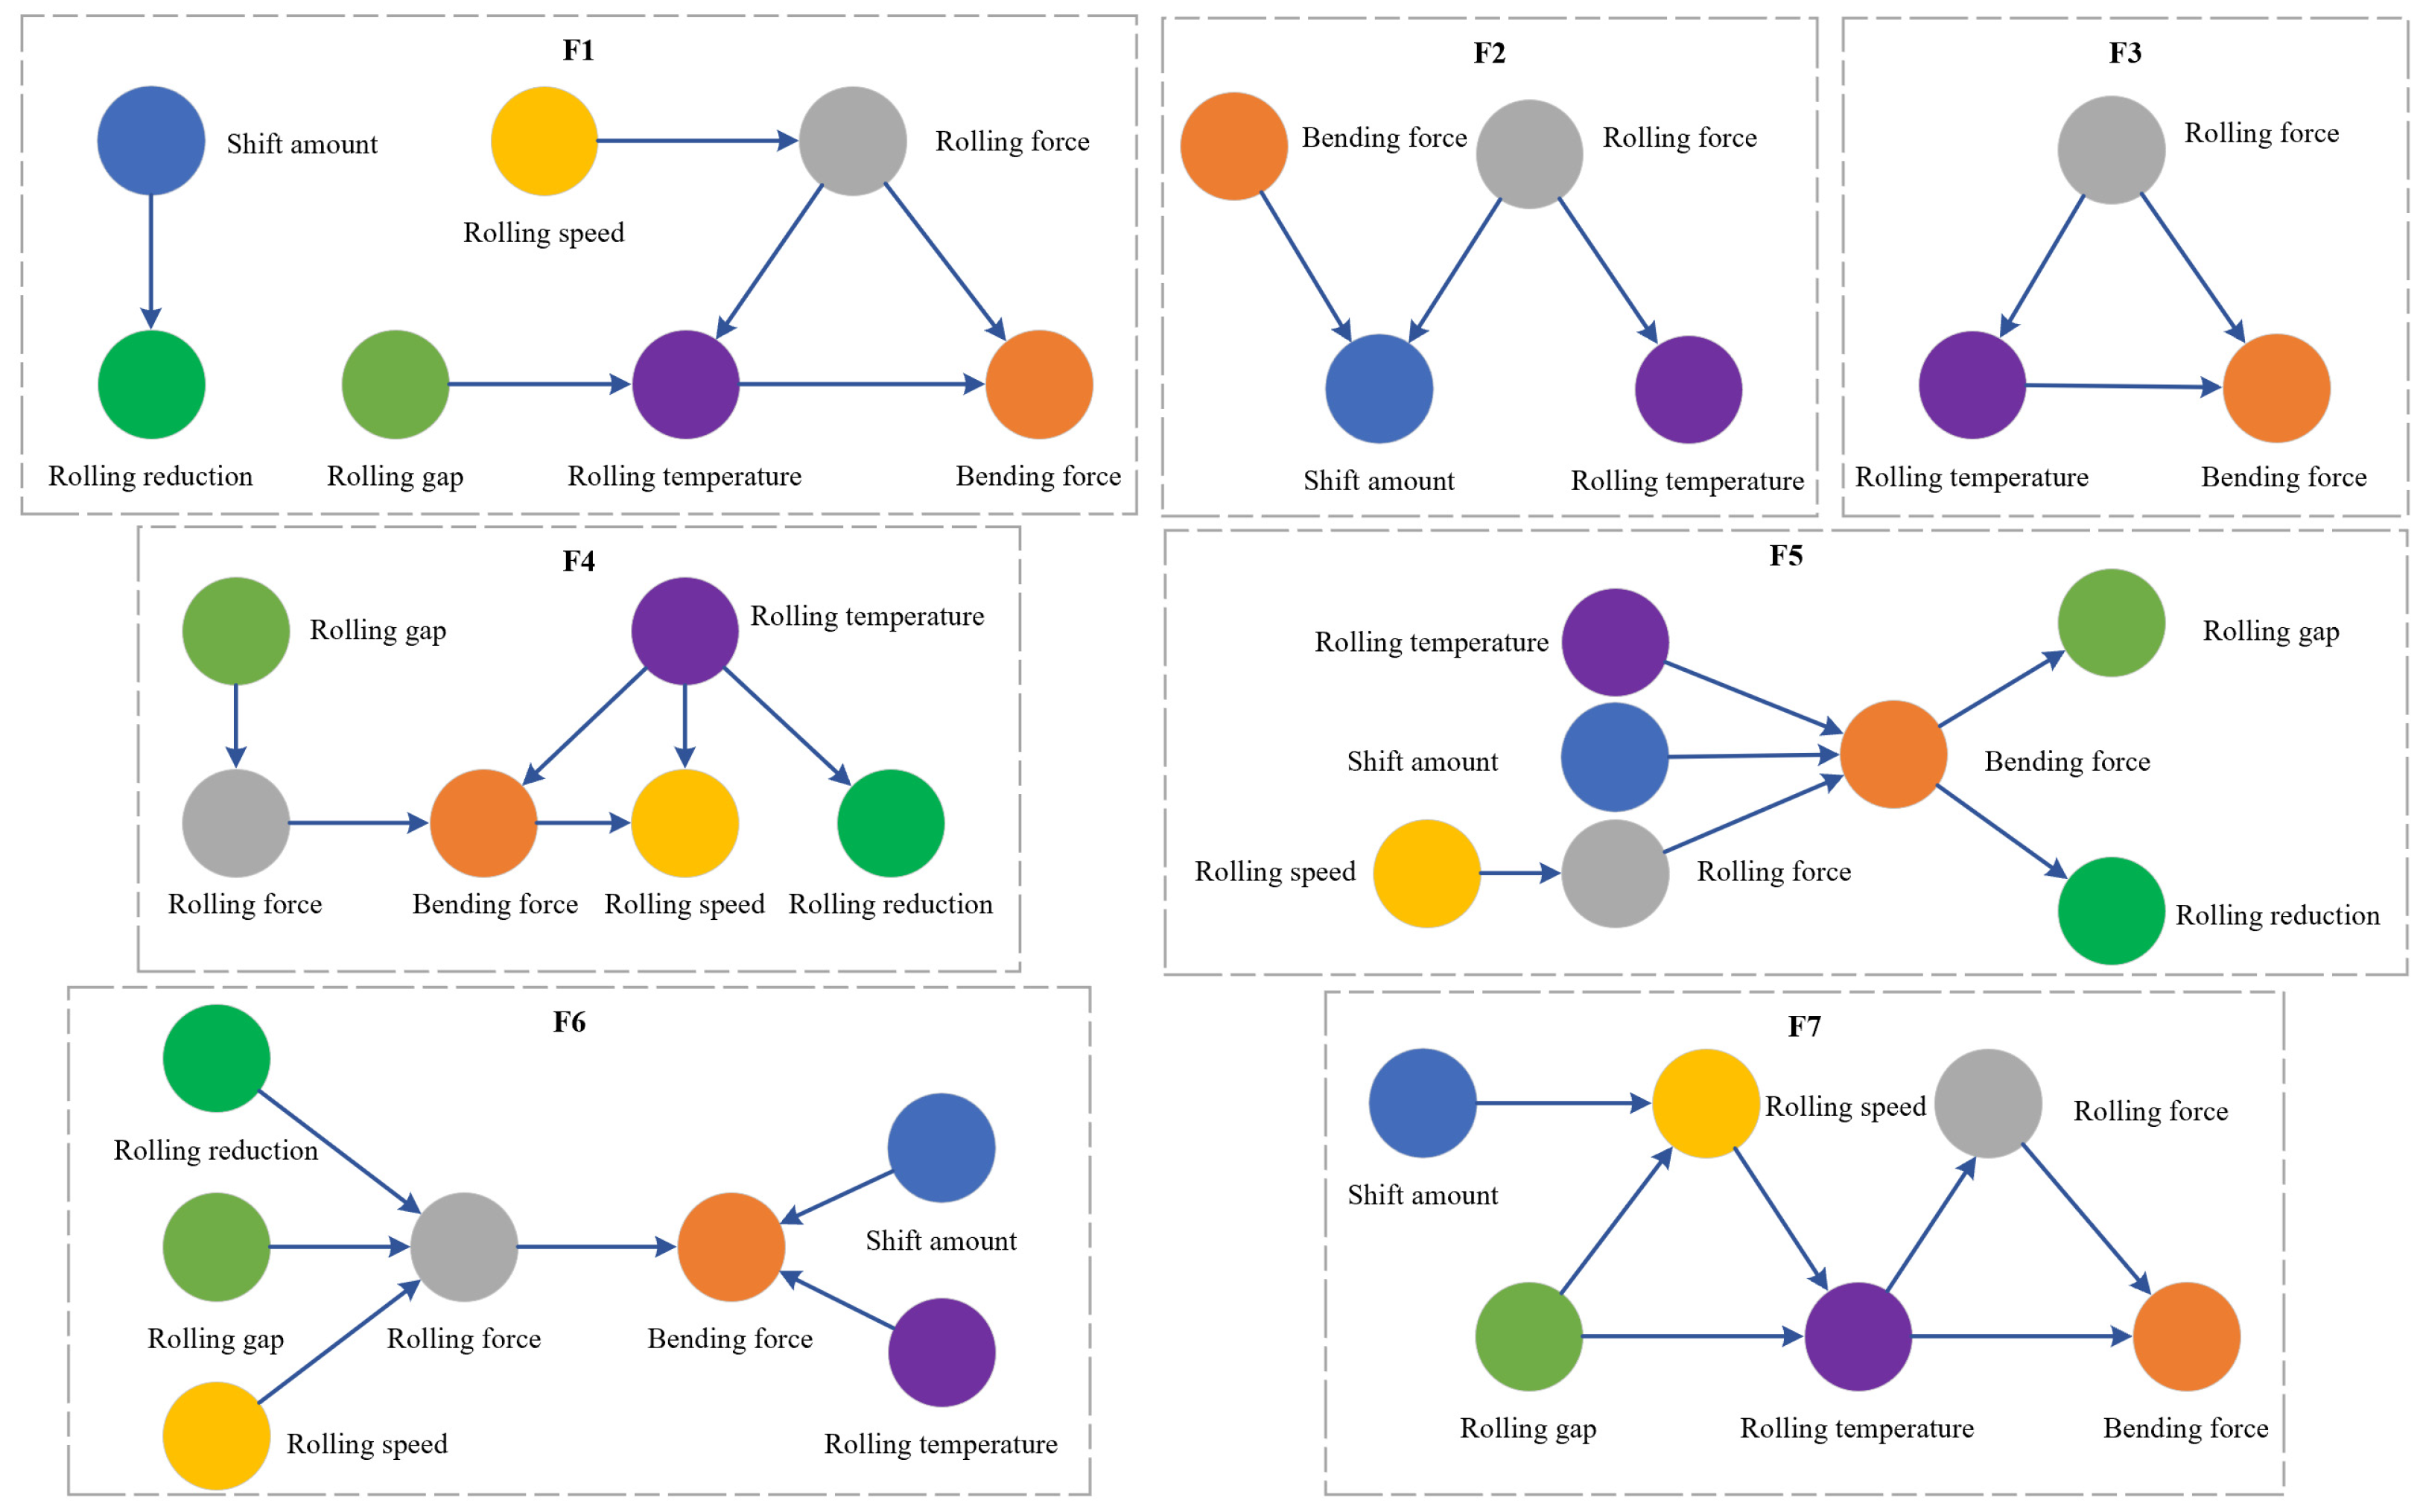
The discovered intra-stand topologies, visualized in Figure 4, demonstrate a clear evolution of coupling mechanisms along the production line that aligns with established rolling theory. (1) In the upstream stands (F1–F3), the causal patterns largely recapitulate fundamental mechanical principles; for instance, rolling speed drives rolling force, which subsequently influences bending force and rolling temperature via deformation heating. A distinctive feature identified in F3 is an adaptive thermal feedback loop where rolling temperature actively modulates bending force, a relationship that reflects the temperature-dependent yield stress of the material. From a metallurgical perspective, this causal linkage reflects the fundamental temperature-dependent yield stress of the material. As the rolling temperature fluctuates, the metal’s deformation resistance is directly altered, necessitating dynamic compensatory adjustments in the bending force to maintain the target roll gap profile and prevent non-uniform elongation. (2) Transitioning to the intermediate stands (F4–F5), parameter interactions become increasingly complex and intertwined. In F5, a distinctive pattern is revealed where shift amount drives bending force to regulate the rolling gap, indicating the model’s ability to capture active strip-profile control mechanisms. (3) In the downstream stands (F6–F7), intensive mechanical coupling prevails, characterized by multiple parameters—including rolling reduction, rolling speed, and rolling gap—collectively contributing to the generation of rolling force. A critical insight from these results is the successful identification of bidirectional-like coupling—such as the mutual influence between rolling temperature and rolling force—which captures the inherent physical feedback loops that are often oversimplified in traditional unidirectional control models.

4.3. High-Precision Prediction Model

To ensure robust evaluation, the dataset was partitioned into training and testing sets using an 80:20 split. The prediction model was constructed using AutoGluon-Tabular (v1.0.0), an advanced open-source AutoML framework designed to automate the end-to-end machine learning pipeline from raw data to model deployment [13]. The primary advantage of this approach lies in its ability to perform autonomous model selection and hyperparameter optimization across a diverse pool of candidate algorithms. By systematically evaluating 13 distinct architectures—including gradient-boosted decision trees, deep neural networks, and k-nearest neighbors—the framework iteratively identifies the optimal mapping that minimizes the classification error for the complex strip shape data. This automated exploration ensures that the resulting model effectively characterizes the heterogeneous and nonlinear interactions between process parameters, such as rolling force and bending force, which are often oversimplified by single-algorithm approaches.
Through this systematic optimization process, the WeightedEnsemble_L2 architecture emerged as the top-performing configuration. As summarized in Table 3, the optimal model achieved state-of-the-art performance on the test set, with an Accuracy of 0.954, a Matthews Correlation Coefficient (MCC) of 0.908, and an area under the receiver operating characteristic curve (ROC-AUC) of 0.991. These metrics signify a high-fidelity representation of the manufacturing process, providing a mathematically sound foundation for the subsequent causal diagnosis. To further validate the superiority of this ensemble strategy, a comprehensive comparative assessment was conducted against other high-performance learners within the candidate pool. The results indicate that while individual algorithms such as LightGBMLarge and XGBoost demonstrate competitive performance, the weighted ensemble approach consistently provides the highest stability and predictive precision across all evaluation dimensions, particularly in terms of its F1-score (0.952) and balanced Precision-Recall trade-off.
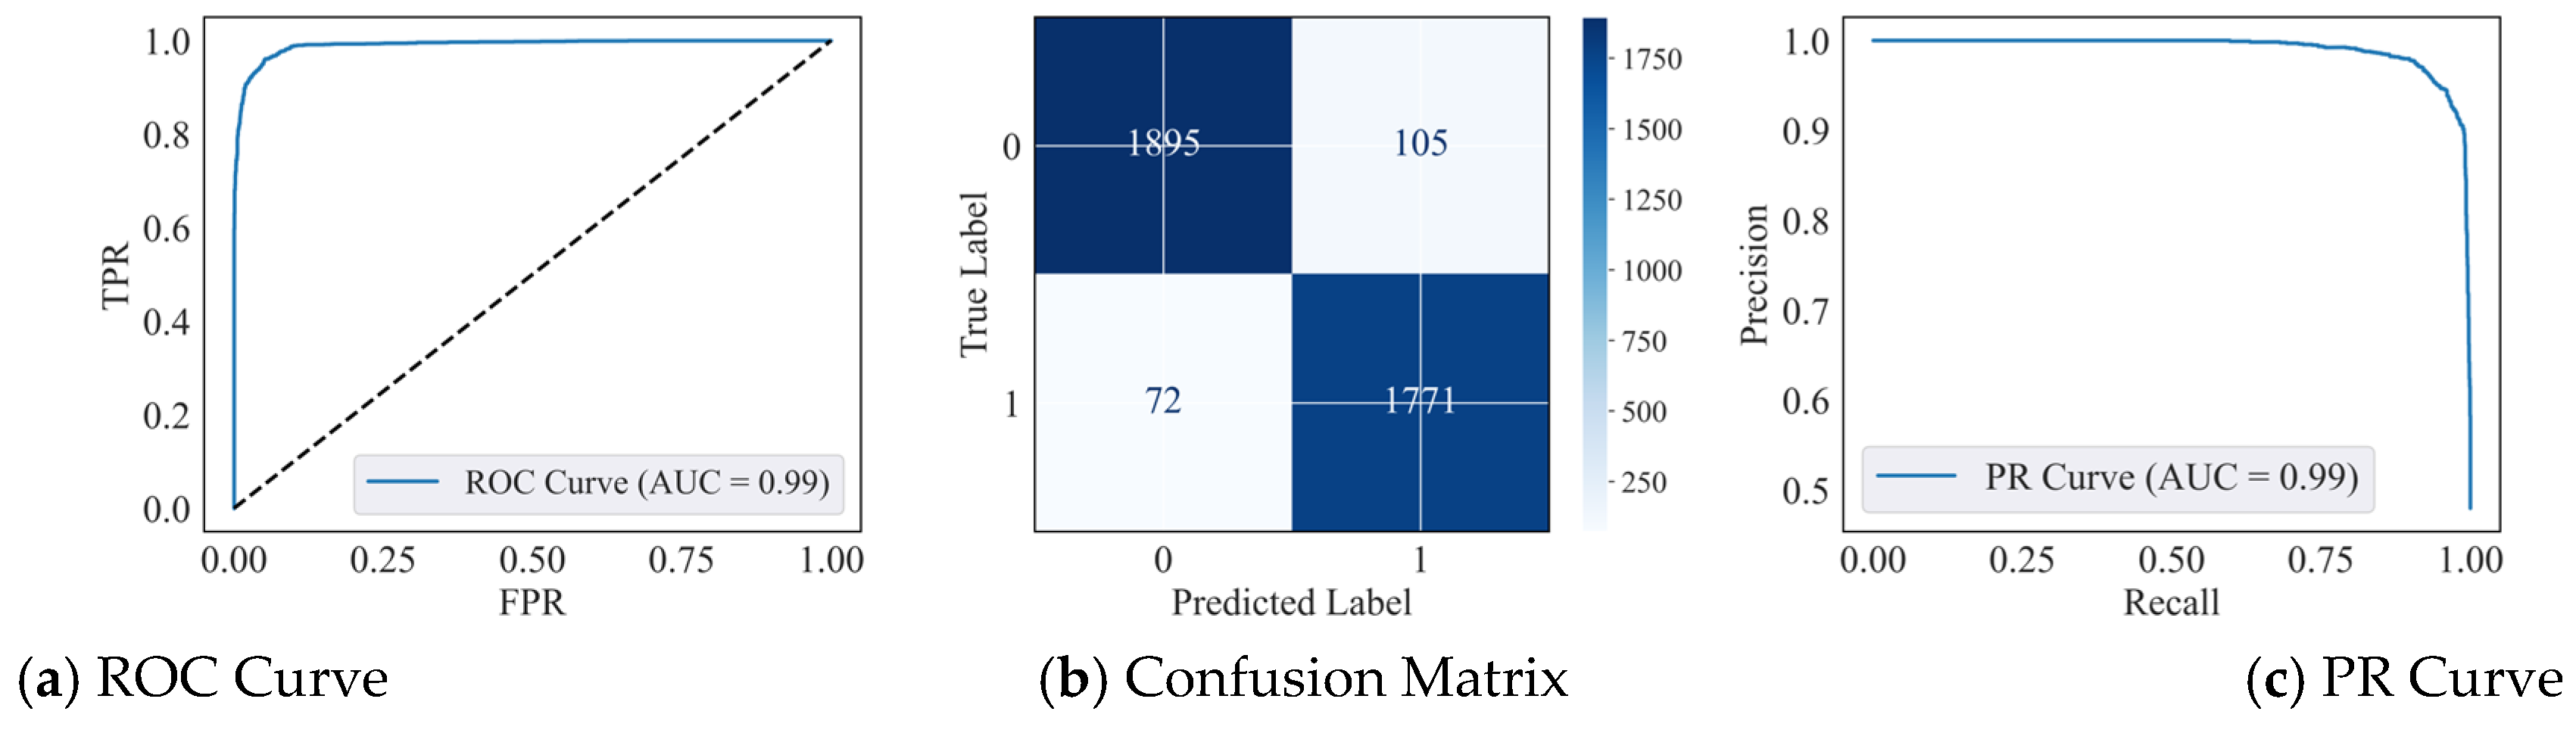
The comprehensive performance of this optimal model is further visualized in Figure 5, providing clear graphical evidence of its discriminative power across varying decision thresholds. Both the receiver operating characteristic (ROC) and precision-recall (PR) curves exhibit exceptional ability with AUC values of approximately 0.99, indicating near-perfect classification capability. Furthermore, the confusion matrix reveals a highly favorable error distribution for industrial quality control: the model correctly identified 1771 defective strips with a recall of 0.961, resulting in a notably low false negative count of only 72. This high sensitivity is critical for hot rolling operations, as it ensures that actual shape defects are reliably detected, thereby preventing defective products from reaching downstream processes while maintaining a manageable false alarm rate.

4.4. Causal XAI Diagnosis and Optimization

4.4.1. Comparative Analysis of Causal and Associational Feature Attributions

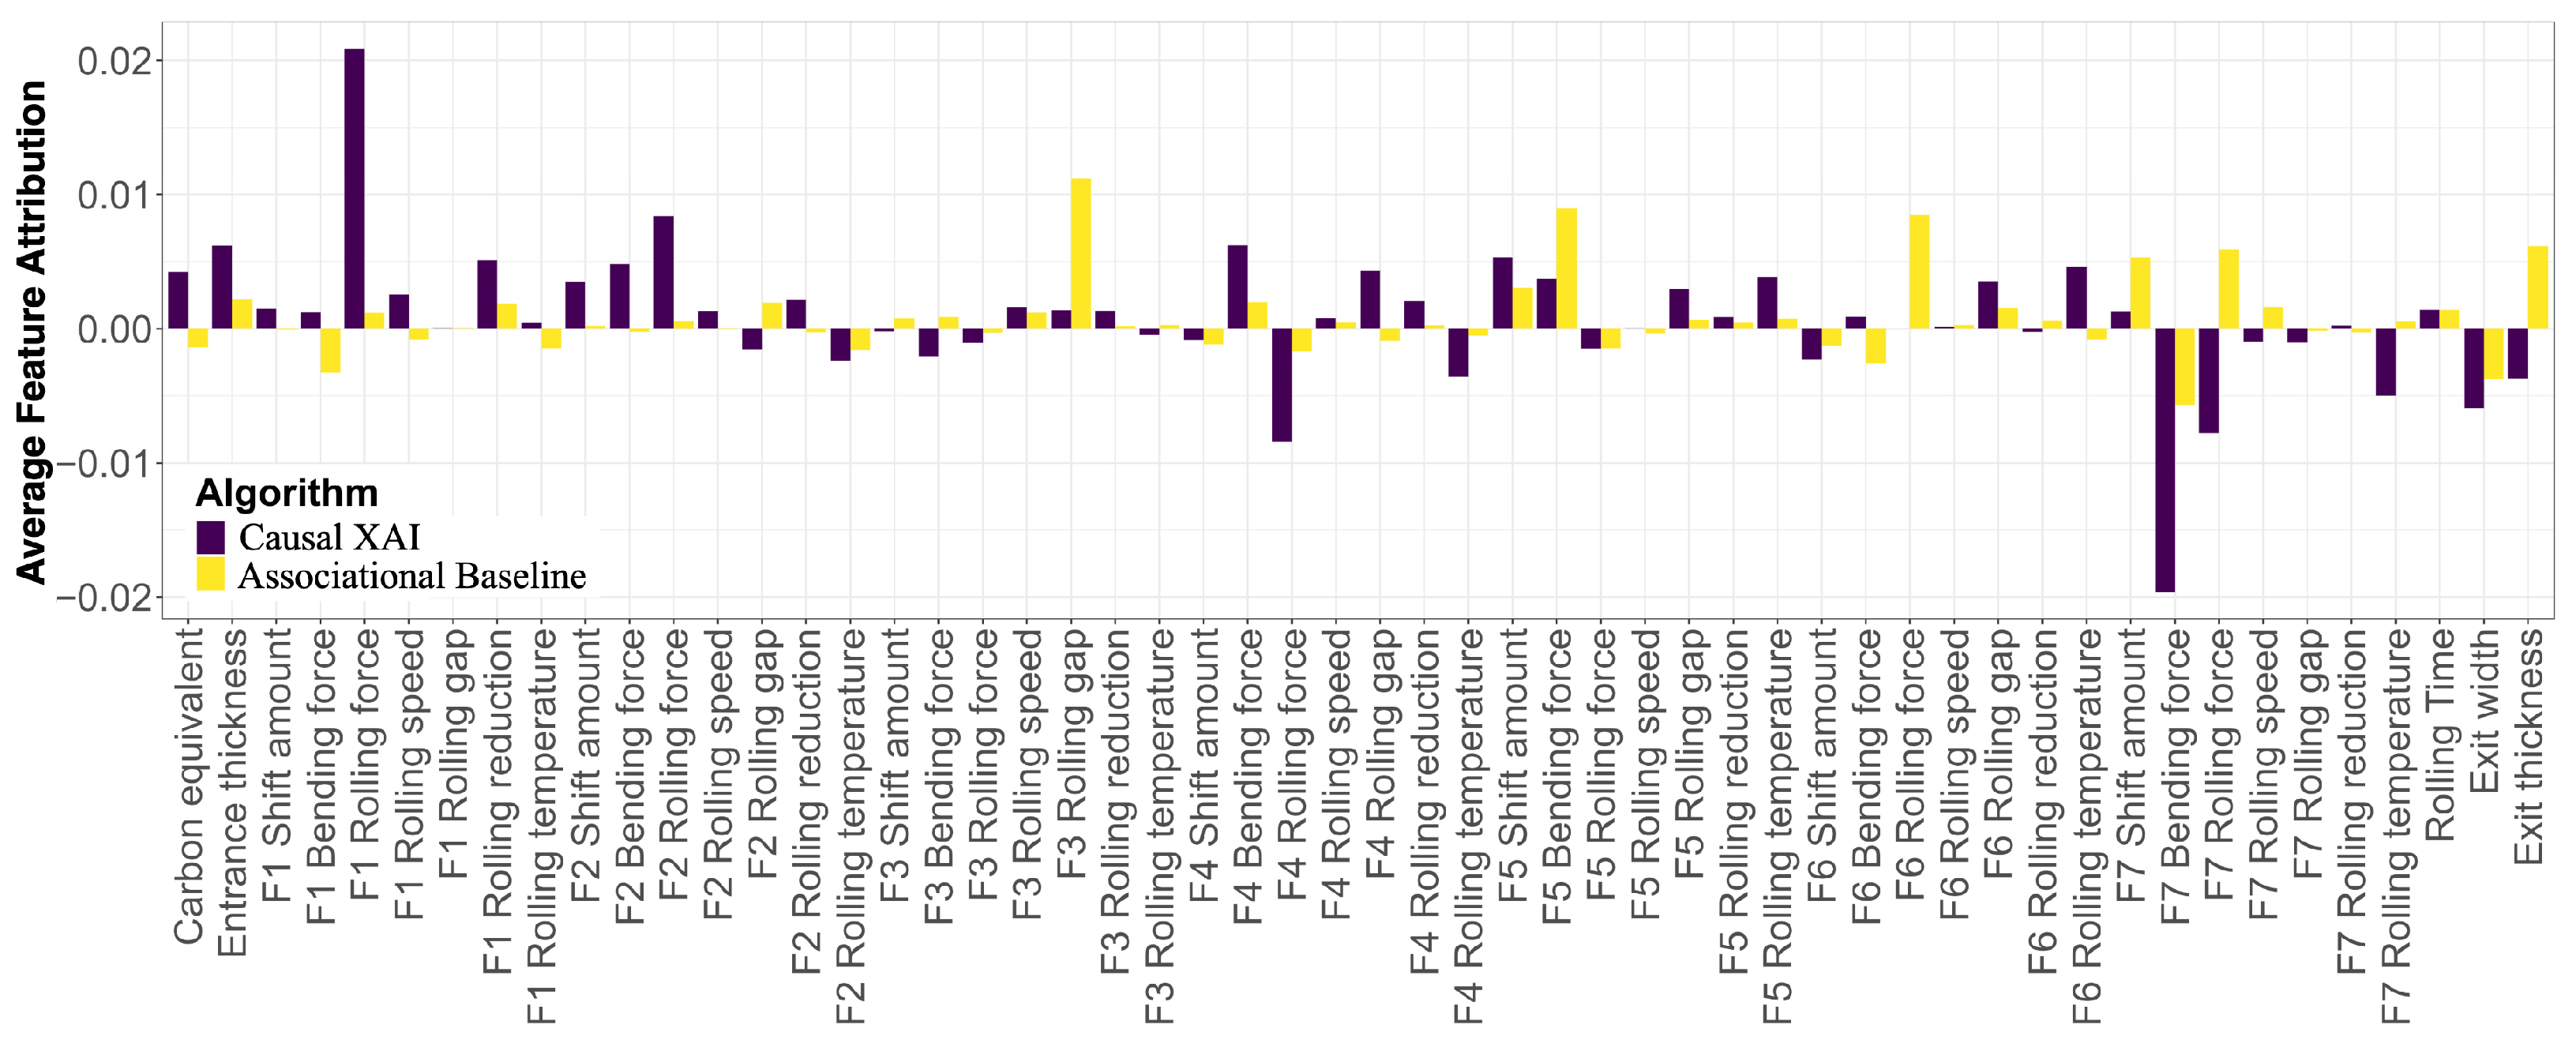
To validate the efficacy of the proposed causal knowledge incorporation, a comparative evaluation was conducted across the 3843 industrial samples. This analysis contrasts the causal feature attribution, which integrates structural constraints from the learned causal topology, against an associational baseline derived from standard SHAP values. As visualized in Figure 6, the results reveal a distinct redistribution of importance, where the introduction of causal constraints significantly re-aligns the model’s focus toward parameters with established metallurgical significance.
The comparative results demonstrate that causal feature attribution exhibits superior alignment with established strip shape control mechanisms. Following the introduction of causal constraints, F1 rolling force and F7 bending force emerge as the paramount determinants of strip shape quality. This distribution rigorously corresponds to fundamental rolling theory: the F1 rolling force, acting at the entry of the finishing line, serves as the primary control parameter for establishing the initial strip crown profile (the root cause of the deformation hierarchy), while the F7 bending force, situated at the exit, functions as the critical actuator for final flatness correction. By emphasizing these entry and exit parameters, the causal-constrained approach effectively captures the essential “cascade effect” of the manufacturing process, ensuring that the diagnostic insights prioritize the primary drivers of quality rather than mere symptomatic fluctuations. Scientifically, this specific causal attribution strictly obeys the principle of volume constancy in hot rolling. In the upstream F1 stand, the thicker strip possesses sufficient ‘lateral flow’ capability; therefore, the F1 rolling force physically dominates the baseline transverse thickness profile (crown). Conversely, in the downstream F7 stand where the strip is extremely thin, lateral flow is restricted. Uncompensated transverse deviations manifest as differential longitudinal elongation; thus, the F7 bending force correctly emerges as the decisive causal actuator for localized residual stress redistribution (flatness).
In contrast, the associational baseline fails to maintain this mechanistic coherence. The importance of rankings derived from standard statistical dependencies assigns high weights to intermediate variables, such as F3 rolling gap, F5 bending force, and F6 rolling force, presenting a scattered distribution that lacks a clear physical narrative. While these intermediate parameters may exhibit strong statistical correlations with the target variable due to the high coupling of industrial sensor data, they often represent redundant or spurious associations rather than fundamental process drivers. Conversely, the top-ranked parameters identified by the causal framework—specifically F1 rolling force, F7 bending force, F4 rolling force, and F2 rolling force—demonstrate a consistent mechanistic logic: prioritizing rolling forces in the upstream stands to establish initial deformation conditions and bending forces in the downstream stands for precision shape refinement. This causal-informed pattern filters out the statistical noise favored by the baseline and pinpoints the most significant intervention points, providing a reliable and traceable foundation for the subsequent process optimization strategy.

4.4.2. Global and Local Explanation for the Shape Prediction

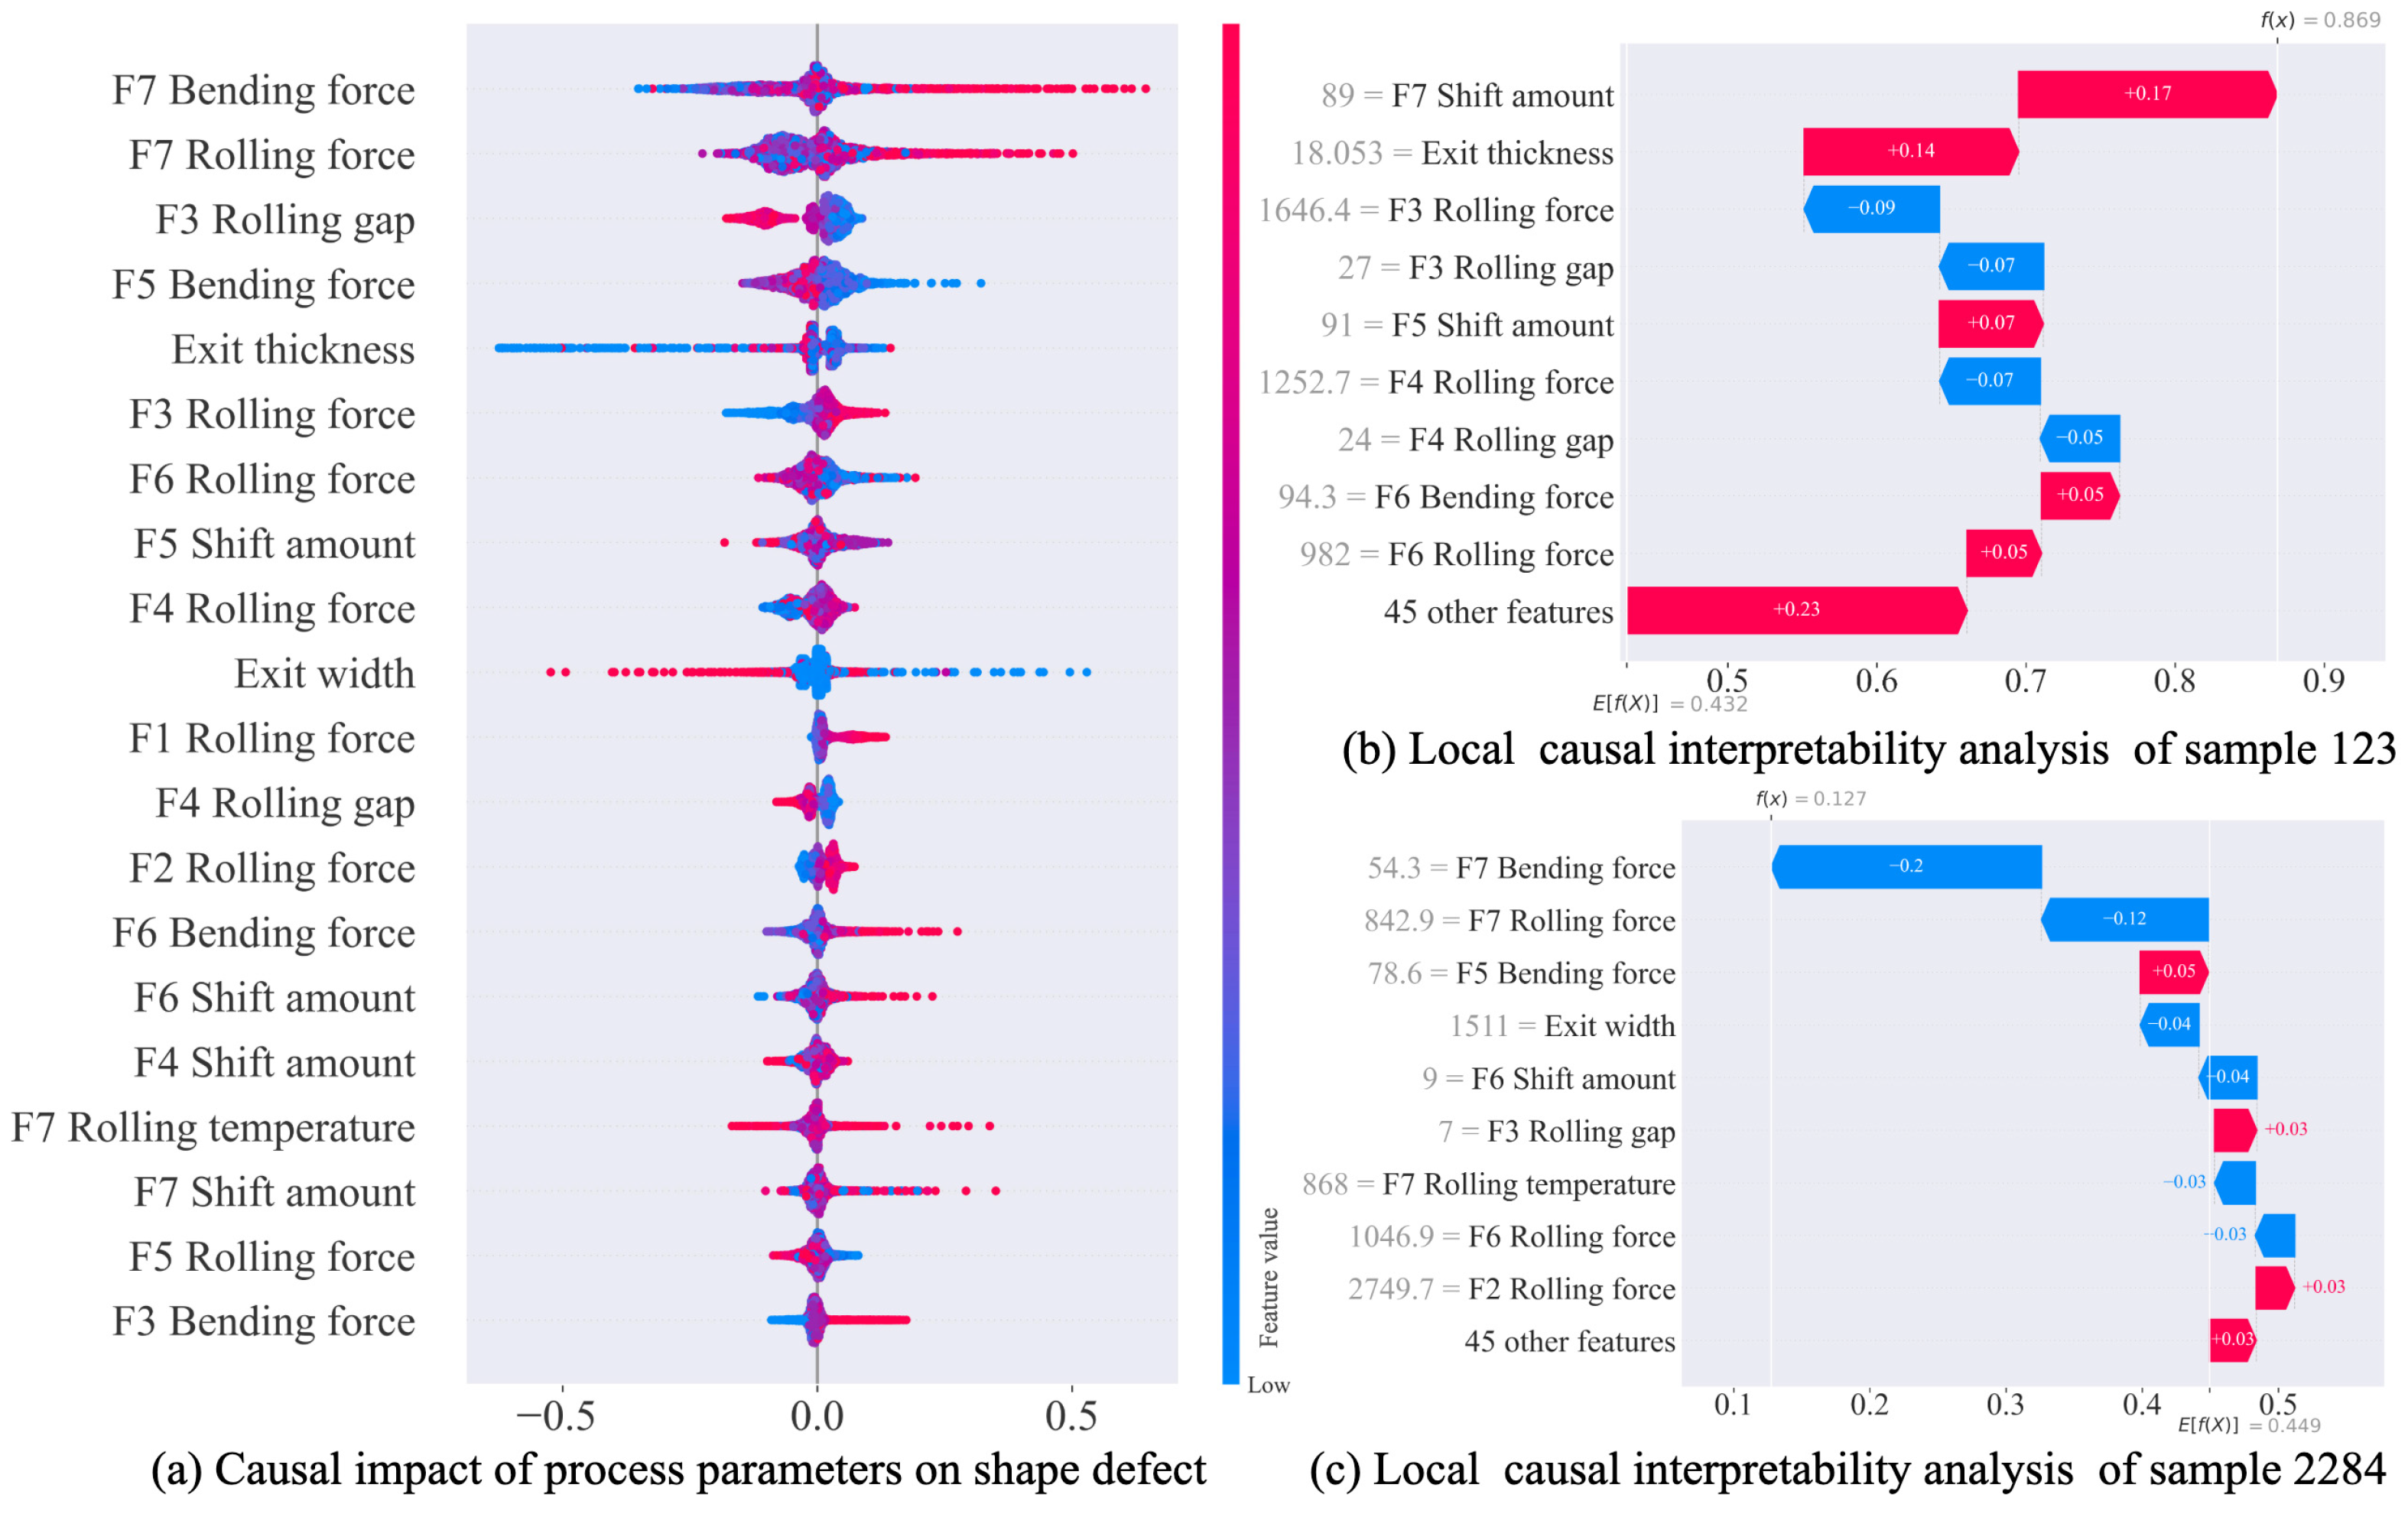
To comprehensively decipher the decision-making mechanism of the diagnostic model, a multi-granular interpretation analysis was conducted using causal feature attribution, with the corresponding results visualized in Figure 7. The global summary plot first aggregates the calculated attribution values across the entire dataset to reveal the overall contribution hierarchy. This analysis identifies F7 bending force, F7 rolling force, and F3 rolling gap as the top three determinants of strip shape quality. This ranking result exhibits strong mechanistic consistency with rolling theory, as the dominance of F7 parameters confirms that the final finishing stand acts as the critical actuator for ultimate flatness and crown correction. Furthermore, the high ranking of the F3 rolling gap reflects the pivotal role of intermediate stands in establishing the preliminary transverse thickness profile, which serves as the geometric precursor for downstream processing. Notably, exit thickness also emerges as a key factor, aligning with the physical reality that thinner strips are inherently more susceptible to buckling and shape defects due to reduced structural stiffness.
To demonstrate sample-specific diagnostic capabilities beyond these global trends, two representative cases were analyzed to contrast the decision paths for defective versus non-defective strips. For the defective sample 123, the model predicted a high defect probability of 0.869, with the corresponding waterfall plot revealing that F7 shift amount and exit thickness were the primary drivers pushing the prediction toward the defect class. This suggests that for this specific strip, improper roll shifting at the final stand—potentially leading to an uneven transverse distribution of the rolling pressure—combined with critical thickness constraints, constituted the root cause of the quality failure. By pinpointing these localized anomalies, the framework enables a transition from generic process monitoring to precise, coil-specific troubleshooting.
In contrast, the non-defective sample 2284, for which the model predicted a low defect probability of 0.127, exhibits a distinctly different attribution pattern where the F7 bending force and F7 rolling force exhibited strong negative contribution scores. In this instance, these parameters acted as stabilizing factors that successfully mitigated the risk of defect formation, effectively counteracting potential upstream disturbances. This indicates that optimal configurations of the bending and rolling forces at the final stand can successfully compensate for geometric inherited errors from previous stages. Collectively, these contrasting cases validate the model’s capability to provide granular, context-aware diagnostics, allowing engineers to identify distinct root causes for individual coils rather than relying on generic control rules that may overlook sample-specific nuances.

4.4.3. Process Parameter Optimization

This final stage implements the PLR strategy to determine optimal intervention intervals and directions, directly validating the structural superiority of the causal approach through comparative experiments. The process begins with the rigorous selection of intervention variables, where the top 20 most influential parameters were chosen for each method based on their contribution rankings. The causal feature attribution identifies a hierarchy dominated by upstream root causes such as F1 rolling force and F2 rolling force, alongside critical downstream effectors like F7 bending force and F7 rolling force. In contrast, the associational baseline tends to prioritize intermediate or symptomatic variables such as F3 rolling gap and F6 rolling force. While the two methods share an intersection of 14 parameters—including F5 shift amount, F4 bending force, and F7 rolling force—the remaining unique features identified by the causal approach demonstrate a superior capacity to capture the long-range hereditary effects that are often obscured by mere statistical correlations.
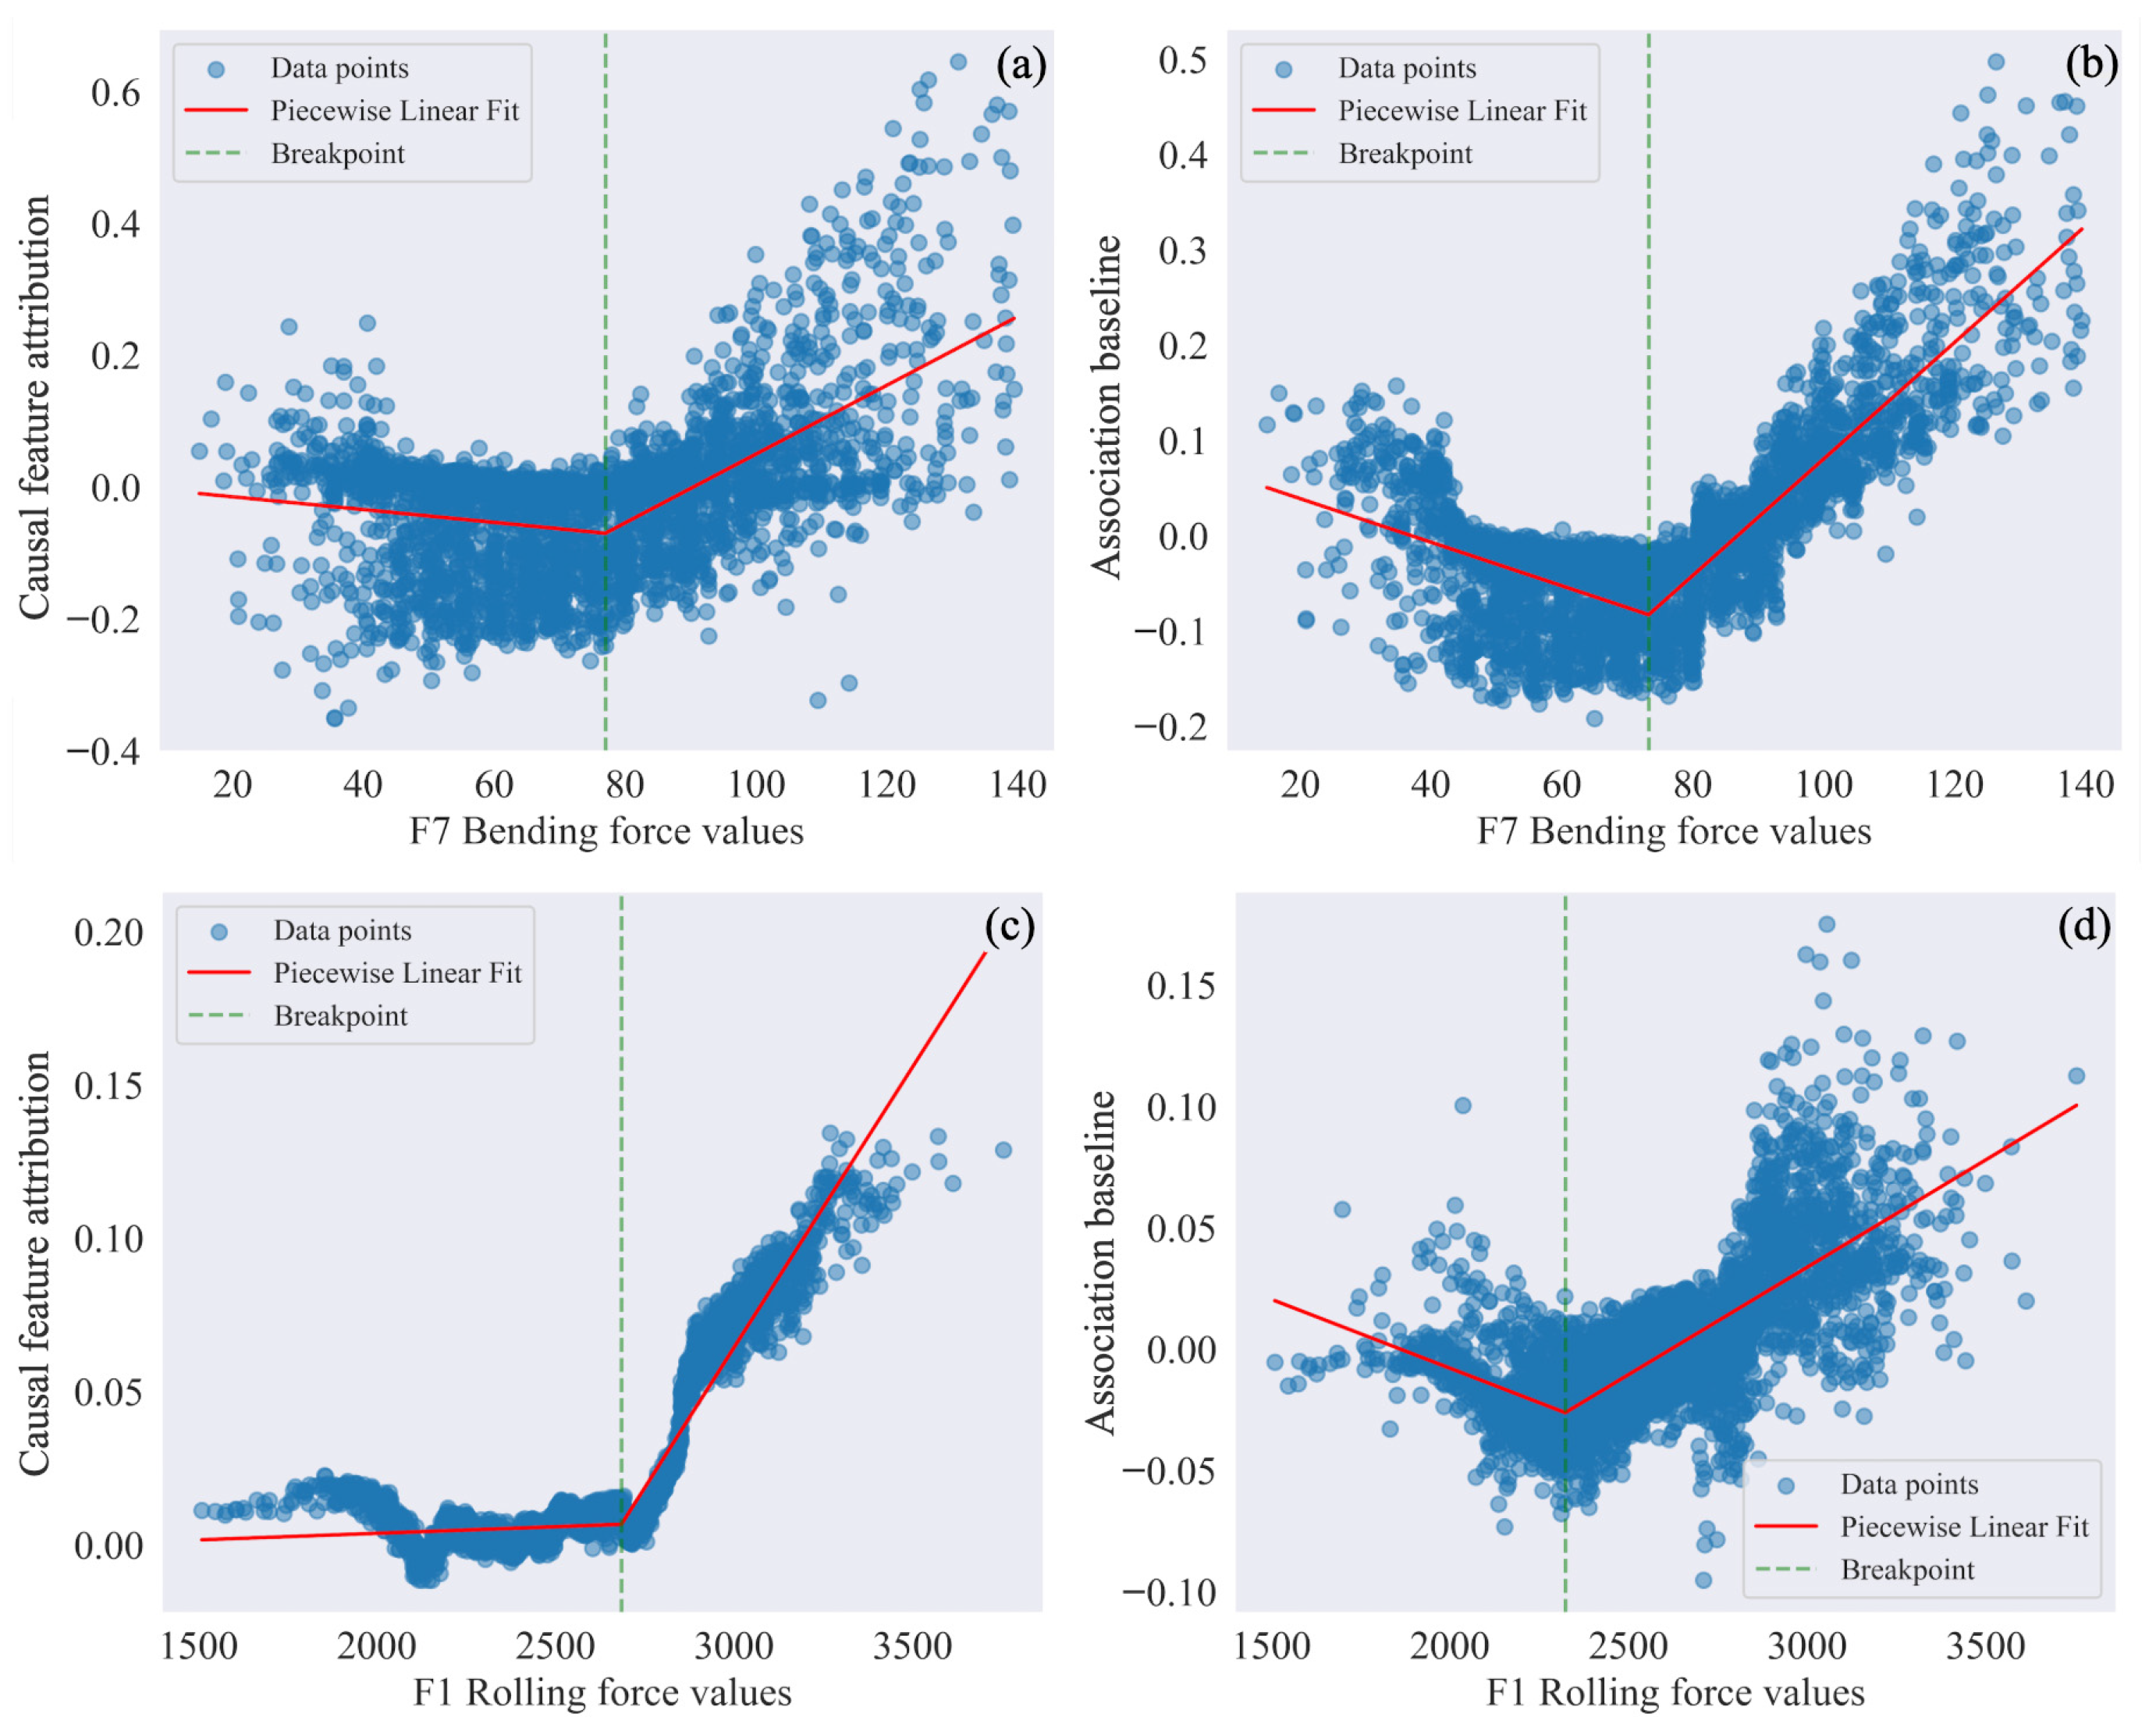
The fundamental divergence in optimization guidance is visualized in Figure 8. For the F7 bending force, as shown in Figure 8a,b, although both methods identify a V-shaped trend, the causal feature attribution determines a higher critical breakpoint of 77.00 compared to the baseline value of 73.27, indicating a more precise calibration of the optimal operating range. A far more profound contradiction is revealed in the analysis of the F1 rolling force in Figure 8c,d; the causal approach identifies a monotonic increasing trend with a change point of 2684.68, correctly reflecting the physical reality that excessive entry-stage pressure exacerbates crown defects. Conversely, the associational baseline exhibits a misleading V-shaped pattern with a lower change point of 2323.10, erroneously suggesting that increasing the force could reduce defects within certain ranges. This confirms that the baseline approach confounds upstream root causes with downstream effects, leading to hazardous intervention advice that contradicts metallurgical principles. As detailed in Table 4, these numerical shifts in identified breakpoints—including the significant unmasking of the F4 rolling gap threshold from 5.28 to 11.00 and the recalibration of the F7 rolling force at 927.11—provide objective evidence of the superior control logic achieved through causal constraints.
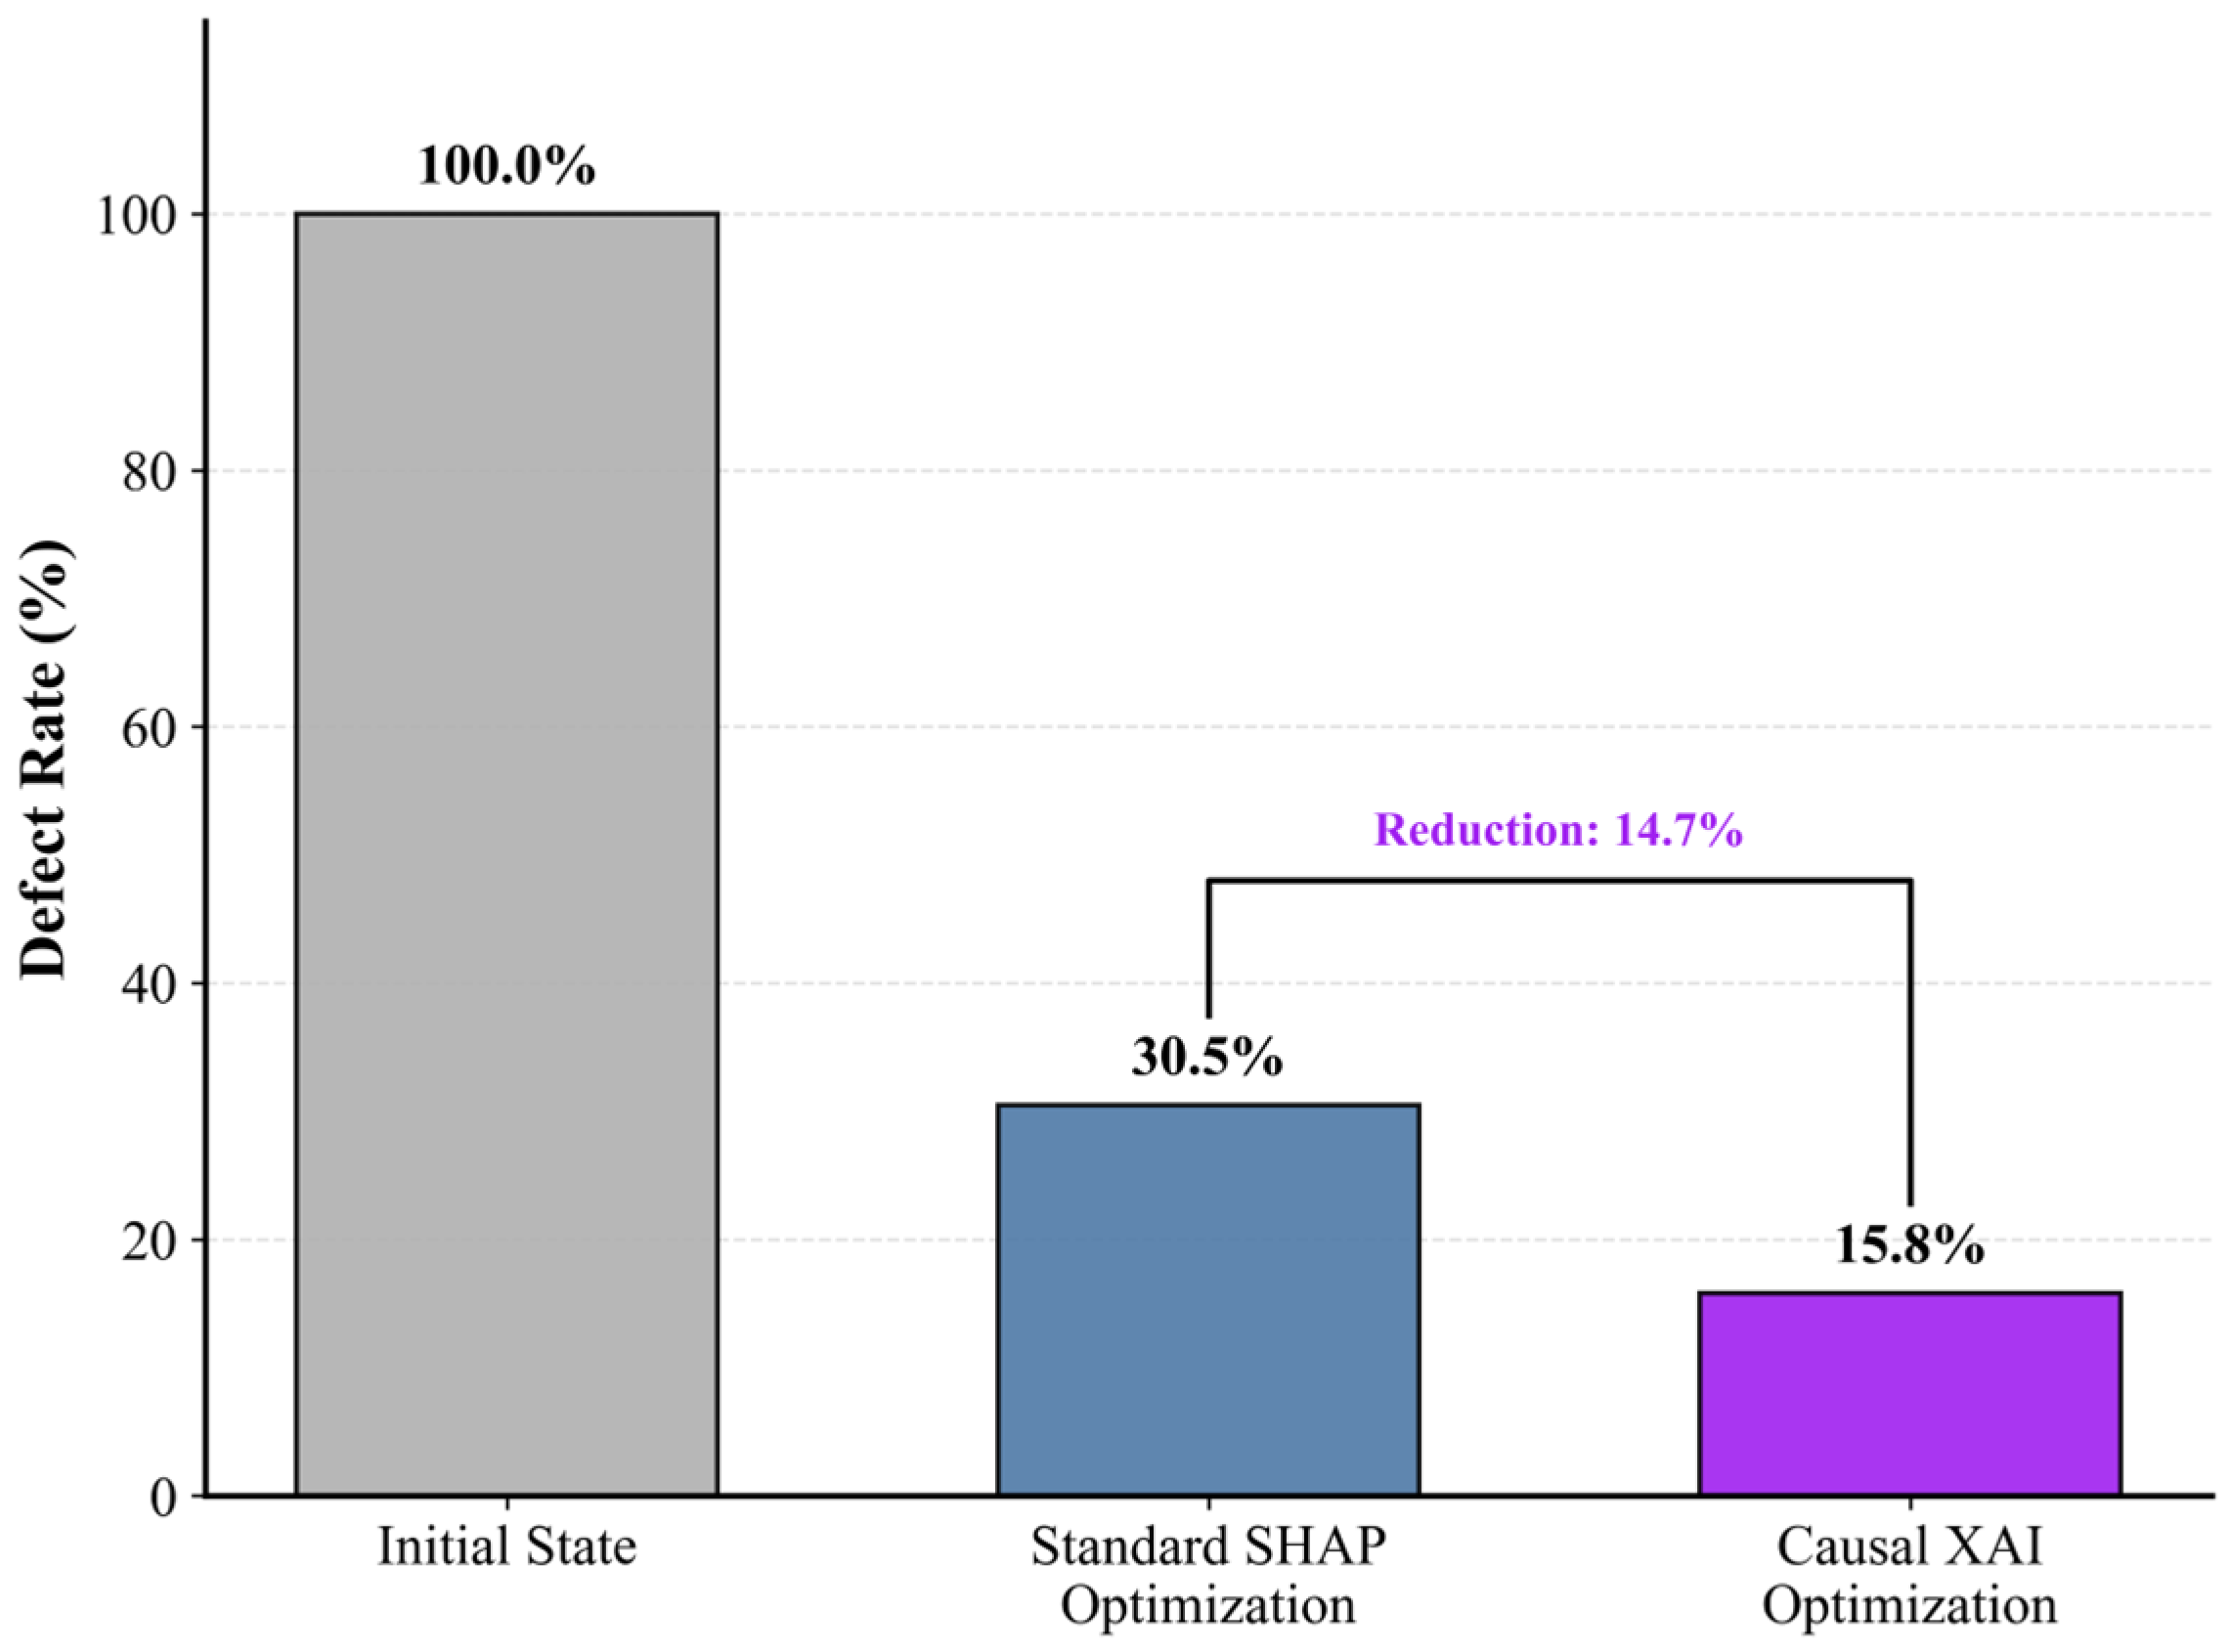
The practical efficacy of these strategies was evaluated through a simulation experiment comprising 30 iterations ( l = 30 ), each processing 100 defective samples with slope threshold of T = 0.05 and intervention amplitude of α = 0.2 . As shown in Figure 9, the optimization strategy based on the standard SHAP reduced the defect rate from 100% to 30.5%. In contrast, the causal XAI optimization achieved a significantly superior defect rate of 15.8%.
This net reduction of 14.7% conclusively demonstrates that causally informed interventions provide more precise and effective guidance for mitigating strip shape defects in industrial operations. From an engineering perspective, this improvement translates directly into reduced off-grade products and enhanced structural reliability. By successfully filtering out spurious correlations and identifying the true mechanistic drivers of defects, the proposed framework transforms complex manufacturing data into reliable, actionable prescriptions. This analysis offers a clear roadmap for the integration of causal inference into real-time industrial process control, enabling a more stable and efficient fabrication environment for high-quality engineering structures.

5. Conclusions

This study establishes a systematic causal XAI diagnosis and optimization framework for hot-rolled strip shape quality, effectively addressing the opacity issues inherent in traditional “black-box” modeling. By synergizing domain knowledge with data-driven structure learning (NOTEARS-MLP), the framework accurately reconstructs the complex, coupled topology characterizing the rolling process. This hybrid strategy augments high-precision AutoML predictive mapping with strict causal constraints, successfully transforming the diagnostic paradigm from passive correlation fitting to transparent, mechanistically grounded root-cause analysis.
Experimental validation conclusively demonstrates the superiority of the proposed methodology over standard associational approaches. The optimization strategy, guided by causal feature attribution and PLR, achieved a defect rate of 15.8%, representing a net reduction of 14.7% compared to the associational baseline (30.5%). Crucially, this performance gain is underpinned by mechanistic fidelity: unlike the associational baseline, which erroneously prioritized intermediate variables (e.g., F3 rolling gap, F5 bending force), the causal framework correctly identified the true root causes—specifically, the F1 rolling force for profile establishment and the F7 bending force for final flatness correction. Scientifically, this highlights the inherent “cascade effect” of deformation, successfully bridging algorithmic attributions with classical rolling theory. This distinction confirms that aligning diagnostic insights with physical generation mechanisms is essential for distinguishing true intervention targets from spurious statistical associations, thereby yielding substantial practical value for industrial quality control.
While the proposed framework successfully quantifies the causal contributions of process parameters to shape defects—demonstrated by ranking absolute attribution values and utilizing PLR to model nonlinear relationships for targeted interventions —it is important to acknowledge the theoretical boundaries of this approach regarding strict causal identification. The causal feature attribution employed in this study successfully quantifies the parameters’ impact on the model’s predictive decision under structural constraints. However, it fundamentally differs from strict causal effect estimation in traditional causal inference (e.g., the direct computation of interventional effects via do-calculus). Because the diagnostic baseline is built upon data-driven AutoML techniques, the derived attributions serve as a highly accurate mechanistic approximation for diagnosis rather than exact physical structural equation coefficients.
Future investigations will focus on extending the framework to dynamic and non-stationary production environments. Research efforts will be directed toward investigating time-varying causal discovery algorithms to adapt to shifting production modes and evolving material specifications. Additionally, to address the current limitations in strict causal identification, future studies will explore the integration of quantitative causal effect estimation methods, such as structural causal models and formal interventional analysis. This will advance the framework from causal feature attribution toward computing the exact physical impact of process adjustments. Furthermore, emphasis will be placed on optimizing the computational efficiency of the causal inference engine to enable direct, real-time integration with industrial process control systems. Such advancements will facilitate a transition from offline diagnosis to proactive, real-time quality management, further enhancing the stability and intelligence of the hot rolling manufacturing process.

Author Contributions

Y.W.: Writing—original draft, Writing—review and editing, Visualization, Validation, Software, Methodology, Formal analysis, Data curation, Conceptualization. P.X.: Validation, Resources, Investigation, Data curation, Conceptualization. D.L.: Resources, Investigation, Funding acquisition, Formal analysis, Data curation. Z.L.: Writing—review and editing, Supervision, Methodology, Investigation, Funding acquisition, Formal analysis, Data curation, Conceptualization. All authors have read and agreed to the published version of the manuscript.

Funding

This work was supported by the National Major Science and Technology Projects of China—Intelligent Manufacturing Systems and Robots (2025ZD1602203) and the Fundamental Research Funds for the Central Universities, University of Science and Technology Beijing (Grant numbers: FRF-BD-22-03, FRF-BD-23-02).

Data Availability Statement

Restrictions apply to the availability of these data. The data were obtained from a collaborating enterprise and are not publicly available due to commercial confidentiality agreements.

Conflicts of Interest

Author Dongyu Li was employed by the company Ansteel Co., Ltd. The remaining authors declare that the research was conducted in the absence of any commercial or financial relationships that could be construed as a potential conflict of interest.

References

  1. He, H.; Shao, J.; Wang, X.; Yang, Q.; Liu, Y.; Xu, D.; Sun, Y. Research and Application of Approximate Rectangular Section Control Technology in Hot Strip Mills. J. Iron Steel Res. Int. 2021, 28, 279–290. [Google Scholar] [CrossRef]
  2. Meng, L.; Ding, J.; Li, X.; Cao, G.; Li, Y.; Zhang, D. Novel Shape Control System of Hot-Rolled Strip Based on Machine Learning Fused Mechanism Model. Expert Syst. Appl. 2024, 255, 124789. [Google Scholar] [CrossRef]
  3. Zhang, Y.; Zhao, M.; Wang, Q.; Peng, W.; Li, X.; Di, H.; Zhang, D. Analysis of Flatness Actuator Efficiency in Thin Strip Steel Tandem Cold Rolling by FEM Considering the Effect of Time-Varying Work Roll Thermal Crown. Int. J. Adv. Manuf. Technol. 2023, 128, 4035–4047. [Google Scholar] [CrossRef]
  4. Wu, H.; Sun, J.; Peng, W.; Jin, L.; Zhang, D. Analysis of Flatness and Critical Crown of Hot-Rolled Strip Based on Thermal–Mechanical Coupled Residual Stress Analytical Model. Appl. Math. Model. 2024, 126, 348–380. [Google Scholar] [CrossRef]
  5. Zhao, W.; Qin, X.; Qu, H.; Wu, Q.; Chen, W.; Liu, F.; Wang, H.; Li, F. Numerical Analysis of Contact Pressure between Rolls of Sendzimir Mill Based on Double Influence Function Method and Conjugate Gradient Techniques. Adv. Eng. Softw. 2023, 176, 103388. [Google Scholar] [CrossRef]
  6. Chen, Y.; Peng, L.; Wang, Y.; Zhou, Y.; Li, C. Prediction of Tandem Cold-Rolled Strip Flatness Based on Attention-LSTM Model. J. Manuf. Process. 2023, 91, 110–121. [Google Scholar] [CrossRef]
  7. Wang, F.; He, A.; Liu, C.; Xiao, W.; Song, Y.; Chen, C.; Qiang, Y. Physics-Informed Semi-Supervised Learning for Hot-Rolled Strip Flatness Pattern Recognition Based on FixMatch Method. Expert Syst. Appl. 2026, 296, 128885. [Google Scholar] [CrossRef]
  8. Boudiaf, A.; Benlahmidi, S.; Harrar, K.; Zaghdoudi, R. Classification of Surface Defects on Steel Strip Images Using Convolution Neural Network and Support Vector Machine. J. Fail. Anal. Prev. 2022, 22, 531–541. [Google Scholar] [CrossRef]
  9. Sun, J.; Deng, J.; Peng, W.; Zhang, D. Strip Crown Prediction in Hot Rolling Process Using Random Forest. Int. J. Precis. Eng. Manuf. 2021, 22, 301–311. [Google Scholar] [CrossRef]
  10. Wang, Z.; Liu, Y.; Wang, T.; Gong, D.; Zhang, D. Prediction Model of Hot Strip Crown Based on Industrial Data and Hybrid the PCA-SDWPSO-ELM Approach. Soft Comput. 2023, 27, 12483–12499. [Google Scholar] [CrossRef]
  11. Song, C.; Cao, J.; Zhao, Q.; Sun, S.; Xia, W.; Sun, L. A High-Precision Crown Control Strategy for Hot-Rolled Electric Steel Using Theoretical Model-Guided BO-CNN-BiLSTM Framework. Appl. Soft Comput. 2024, 152, 111203. [Google Scholar] [CrossRef]
  12. Ding, J.; Du, H.; Meng, L.; Zhao, J.; Wang, G.; Zhang, D. Deep Stochastic Configuration Networks with Different Distributions for Crown Prediction of Hot-Rolled Non-Oriented Silicon Steel. J. Manuf. Process. 2024, 123, 83–95. [Google Scholar] [CrossRef]
  13. Erickson, N.; Mueller, J.; Shirkov, A.; Zhang, H.; Larroy, P.; Li, M.; Smola, A. AutoGluon-Tabular: Robust and Accurate AutoML for Structured Data. arXiv 2020, arXiv:2003.06505. [Google Scholar]
  14. Wu, Y.; Zhang, H.; Jian, L.; Lv, Z. A Quantitative Causal Analysis and Optimization Framework for Inclusions of Steel Products. Adv. Eng. Inform. 2024, 62, 102629. [Google Scholar] [CrossRef]
  15. Czako, Z.; Sebestyen, G.; Hangan, A. AutomaticAI—A Hybrid Approach for Automatic Artificial Intelligence Algorithm Selection and Hyperparameter Tuning. Expert Syst. Appl. 2021, 182, 115225. [Google Scholar] [CrossRef]
  16. Singh, V.K.; Joshi, K. Automated Machine Learning (AutoML): An Overview of Opportunities for Application and Research. J. Inf. Technol. Case Appl. Res. 2022, 24, 75–85. [Google Scholar] [CrossRef]
  17. Presciuttini, A.; Cantini, A.; Costa, F.; Portioli-Staudacher, A. Machine Learning Applications on IoT Data in Manufacturing Operations and Their Interpretability Implications: A Systematic Literature Review. J. Manuf. Syst. 2024, 74, 477–486. [Google Scholar] [CrossRef]
  18. Ribeiro, M.T.; Singh, S.; Guestrin, C. “Why Should I Trust You?”: Explaining the Predictions of Any Classifier. In Proceedings of the 22nd ACM SIGKDD International Conference on Knowledge Discovery and Data Mining; Association for Computing Machinery: New York, NY, USA, 2016; pp. 1135–1144. [Google Scholar]
  19. Štrumbelj, E.; Kononenko, I. Explaining Prediction Models and Individual Predictions with Feature Contributions. Knowl. Inf. Syst. 2014, 41, 647–665. [Google Scholar] [CrossRef]
  20. Lundberg, S.; Lee, S.-I. A Unified Approach to Interpreting Model Predictions. In Proceedings of the Advances in Neural Information Processing Systems 30 (NIPS 2017), Long Beach, CA, USA, 4–9 December 2017. [Google Scholar]
  21. Shen, C.; Wang, C.; Wei, X.; Li, Y.; van der Zwaag, S.; Xu, W. Physical Metallurgy-Guided Machine Learning and Artificial Intelligent Design of Ultrahigh-Strength Stainless Steel. Acta Mater. 2019, 179, 201–214. [Google Scholar] [CrossRef]
  22. Frye, C.; Rowat, C.; Feige, I. Asymmetric Shapley Values: Incorporating Causal Knowledge into Model-Agnostic Explainability. In Proceedings of the Advances in Neural Information Processing Systems; Curran Associates, Inc.: Red Hook, NY, USA, 2020; Volume 33, pp. 1229–1239. [Google Scholar]
  23. Zhang, C.; Wang, Y.; Li, S.; Chen, X. Root Cause Diagnosis in Process Industry via Bayesian Network Enhanced by Prior Knowledge and Randomized Optimization. Chem. Eng. Sci. 2025, 312, 121683. [Google Scholar] [CrossRef]
  24. Ribeiro, A.H.; Heider, D. dcFCI: Robust Causal Discovery Under Latent Confounding, Unfaithfulness, and Mixed Data. arXiv 2025, arXiv:2505.06542. [Google Scholar] [CrossRef]
  25. Zhao, X.; Wan, W.; Fang, Z. IGES-RCI: Improved Greedy Equivalence Search and Recursive Causal Inference for Industrial Equipment Failure Prediction. IEEE Trans. Knowl. Data Eng. 2025, 37, 5983–5993. [Google Scholar] [CrossRef]
  26. Zhang, C.; Yu, H.; Wang, G.; Xie, Y. LiNGAM-SF: Causal Structural Learning Method with Linear Non-Gaussian Acyclic Models for Streaming Features. IEEE Trans. Neural Netw. Learn. Syst. 2025, 36, 10693–10706. [Google Scholar] [CrossRef] [PubMed]
  27. Zhao, B.; Wang, S.; Chi, L.; Zhao, C.; Yuan, H.; Li, Q.; Liu, X.; Geng, J.; Yuan, Y. HANM: Hierarchical Additive Noise Model for Many-to-One Causality Discovery. IEEE Trans. Knowl. Data Eng. 2023, 35, 12708–12720. [Google Scholar] [CrossRef]
  28. Li, Z.; Guo, X.; Qiang, S. A Survey of Deep Causal Models and Their Industrial Applications. Artif. Intell. Rev. 2024, 57, 298. [Google Scholar] [CrossRef]
  29. Vuković, M.; Thalmann, S. Causal Discovery in Manufacturing: A Structured Literature Review. J. Manuf. Mater. Process. 2022, 6, 10. [Google Scholar] [CrossRef]
  30. Zheng, X.; Aragam, B.; Ravikumar, P.K.; Xing, E.P. DAGs with NO TEARS: Continuous Optimization for Structure Learning. In Proceedings of the Advances in Neural Information Processing Systems; Curran Associates, Inc.: Red Hook, NY, USA, 2018; Volume 31. [Google Scholar]
  31. Zheng, X.; Dan, C.; Aragam, B.; Ravikumar, P.; Xing, E. Learning Sparse Nonparametric DAGs. In Proceedings of the Twenty Third International Conference on Artificial Intelligence and Statistics; PMLR: Cambridge, MA, USA, 2020; pp. 3414–3425. [Google Scholar]
  32. Wang, Y.; Zhang, T.; Ye, H.; Xiong, Z.; He, X. A Shape-Based Monitoring Method for Variable Trajectories of Finishing Mill Processes. IFAC-PapersOnLine 2024, 58, 264–269. [Google Scholar] [CrossRef]
  33. Zeng, L.; Deng, X.; Li, F.; Dong, C.; Wang, S.; Yang, H.; Tang, C.; Li, Y. Study on Dynamic Wear Evolution of Modified Gear Rack Considering the Real-Time Variation of Contact Characteristics. Wear 2025, 571, 205845. [Google Scholar] [CrossRef]
  34. Ding, C.; Sun, J.; Li, X.; Peng, W.; Zhang, D. A High-Precision and Transparent Step-Wise Diagnostic Framework for Hot-Rolled Strip Crown. J. Manuf. Syst. 2023, 71, 144–157. [Google Scholar] [CrossRef]
  35. Wang, F.; Liu, C.; He, A.; Song, Y.; Shao, J.; Yao, C.; Qiang, Y.; Liu, H.; Ma, B. An Optimization Framework for Hot-Rolled Strip Crown Control Based on Model-Driven Digital Twin. J. Iron Steel Res. Int. 2025, 32, 1920–1939. [Google Scholar] [CrossRef]
  36. Li, G.; Gong, D.; Lu, X.; Zhang, D. Ensemble Learning Based Methods for Crown Prediction of Hot-Rolled Strip. ISIJ Int. 2021, 61, 1603–1613. [Google Scholar] [CrossRef]
  37. Li, Z.Q.; Liu, Y.M.; Wang, T.; Huang, Q.X. An Analytical Prediction Model of Strip Crown Based on Multi-Factor Interaction Mechanism. Int. J. Adv. Manuf. Technol. 2022, 121, 5943–5955. [Google Scholar] [CrossRef]
  38. Wu, H.; Sun, J.; Lu, X.; Peng, W.; Wang, Q.; Zhang, D. Predicting Stress and Flatness in Hot-Rolled Strips during Run-out Table Cooling. J. Manuf. Process. 2022, 84, 815–831. [Google Scholar] [CrossRef]
  39. Li, L.; Xie, H.; Liu, T.; Huo, M.; Liu, X.; Li, X.; Shi, K.; Li, J.; Liu, H.; Sun, L. Influence Mechanism of Rolling Force on Strip Shape during Tandem Hot Rolling Using a Novel 3D Multi-Stand Coupled Thermo-Mechanical FE Model. J. Manuf. Process. 2022, 81, 505–521. [Google Scholar] [CrossRef]
  40. Li, M.; Sun, H.; Huang, Y.; Chen, H. Shapley Value: From Cooperative Game to Explainable Artificial Intelligence. Auton. Intell. Syst. 2024, 4, 2. [Google Scholar] [CrossRef]
  41. Liu, R.; Zhang, Q.; Lin, D.; Zhang, W.; Ding, S.X. Causal Intervention Graph Neural Network for Fault Diagnosis of Complex Industrial Processes. Reliab. Eng. Syst. Saf. 2024, 251, 110328. [Google Scholar] [CrossRef]
  42. Chen, H.; Covert, I.C.; Lundberg, S.M.; Lee, S.-I. Algorithms to Estimate Shapley Value Feature Attributions. Nat. Mach. Intell. 2023, 5, 590–601. [Google Scholar] [CrossRef]
  43. Kelen, D.M.; Petreczky, M.; Kersch, P.; Benczúr, A.A. Theoretical Evaluation of Asymmetric Shapley Values for Root-Cause Analysis. In Proceedings of the 2023 IEEE International Conference on Data Mining (ICDM), Shanghai, China, 1–4 December 2023; pp. 210–219. [Google Scholar]
  44. Takahashi, D.; Shimizu, S.; Tanaka, T. Counterfactual Explanations of Black-Box Machine Learning Models Using Causal Discovery with Applications to Credit Rating. In Proceedings of the 2024 International Joint Conference on Neural Networks (IJCNN), Yokohama, Japan, 30 June–5 July 2024; pp. 1–8. [Google Scholar]
  45. Hou, Y.; Rabbani, S.B.; Hong, L.; Diawara, N.; Samad, M.D. Causal Explainability of Machine Learning in Heart Failure Prediction from Electronic Health Records. In Proceedings of the 2025 IEEE International Conference on Information Reuse and Integration and Data Science (IRI), San Jose, CA, USA, 6–8 August 2025. [Google Scholar]
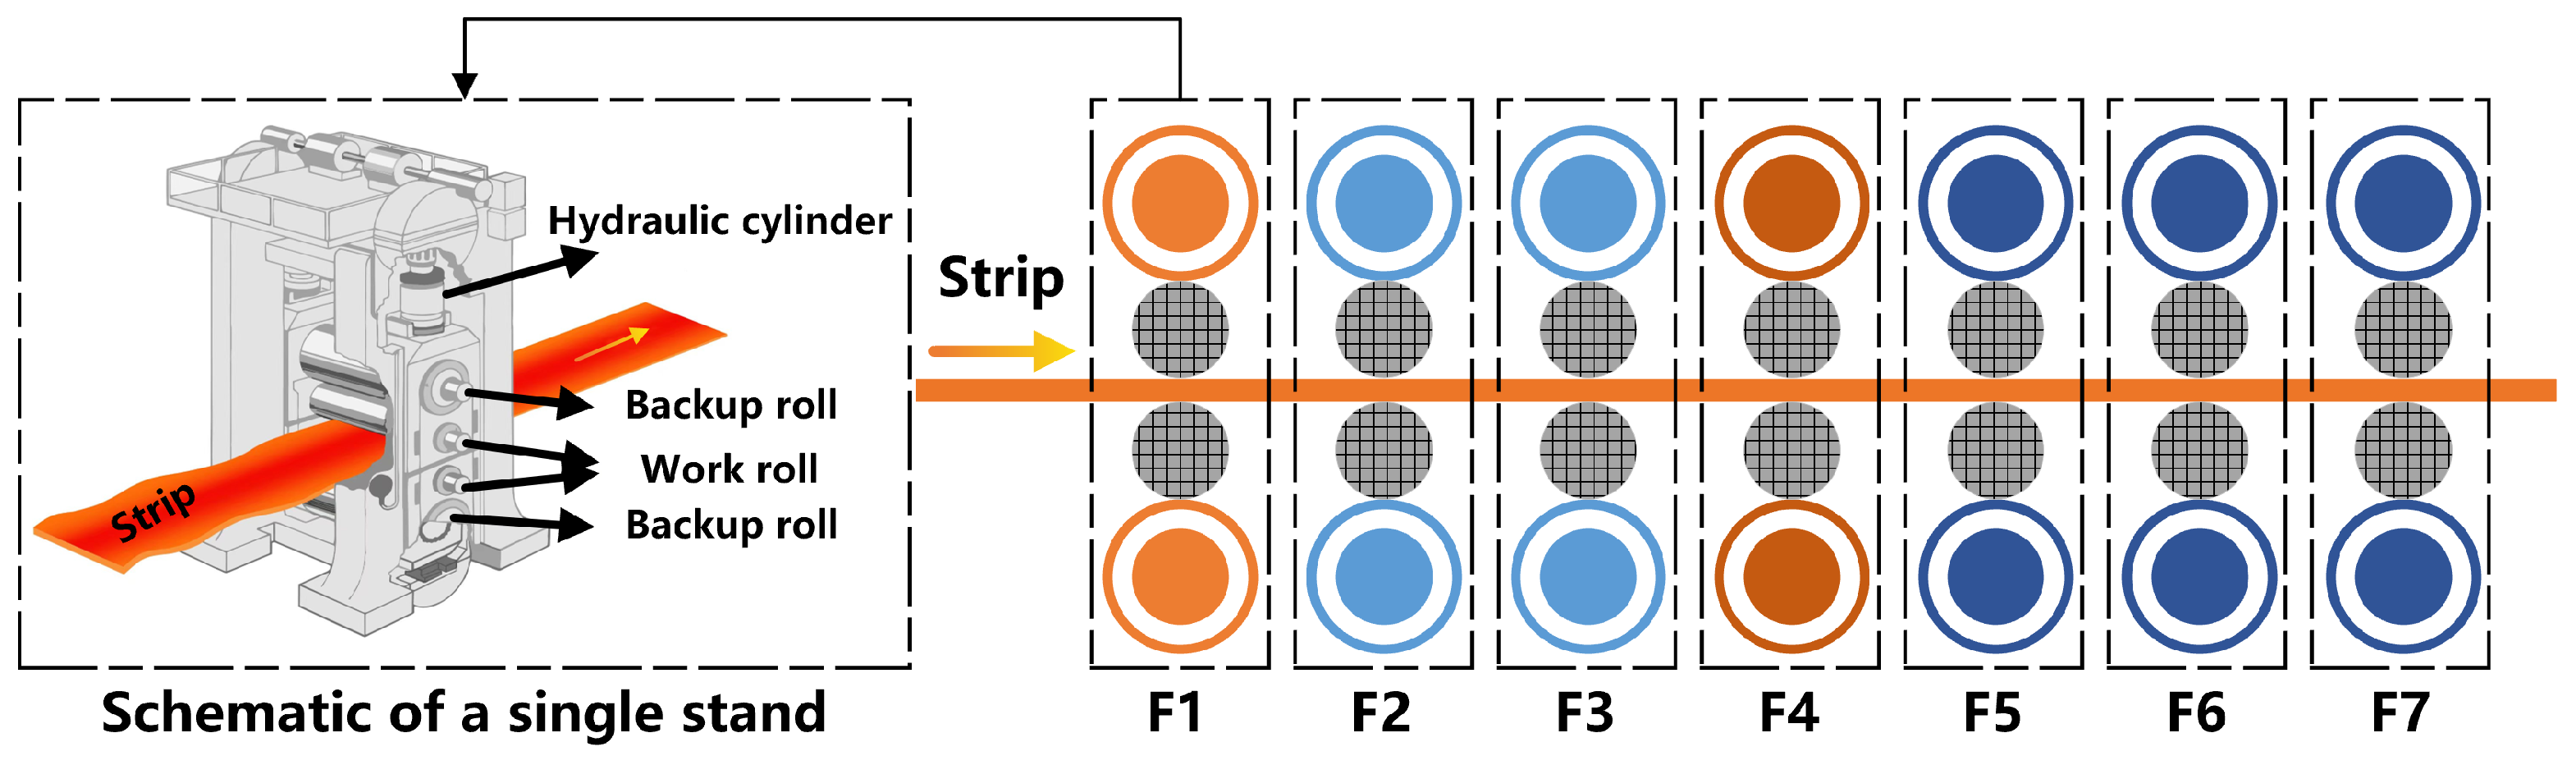
Figure 1. The schematic layout of the seven-stand finishing mill line (F1~F7).
Metals 16 00401 g001
Figure 2. Schematic representation of strip shape quality indicators: (a) cross-sectional profile for crown measurement definition; (b) characteristic morphological patterns of flatness defects.
Metals 16 00401 g002
Figure 3. Step-wise prediction and diagnostic framework for hot-rolled strip shape.
Metals 16 00401 g003
Figure 4. Causal structure diagrams for process parameters within rolling stands F1–F7.
Metals 16 00401 g004
Figure 5. The prediction performance of the optimal model: (a) ROC curve (The dashed diagonal line represents the performance of a random classifier ( A U C = 0.5 )); (b) Confusion matrix; (c) PR curve.
Metals 16 00401 g005
Figure 6. Average feature attribution comparison based on causal XAI and the associational baseline.
Metals 16 00401 g006
Figure 7. Causal XAI-based interpretability analysis: (a) Global summary of causal impact on shape defects; (b) Local explanation for defective sample 123; (c) Local explanation for non-defective sample 2284.
Metals 16 00401 g007
Figure 8. Comparative PLR results: (a,c) causal feature attribution; (b,d) associational baseline. Top row: F7 bending force; Bottom row: F1 rolling force.
Metals 16 00401 g008
Figure 9. Comparison of defect rate reduction performance: initial state vs. associational baseline vs. causal XAI optimization.
Metals 16 00401 g009
Table 1. The specific parameters of the devices in the finishing rolling line.
Specific ParametersStands
F1~F4F5~F7
Main motor power (kW)80007800
Work roll barrel length (mm)18801880
Backup roll barrel length (mm)15801580
Work roll diameter (mm)12001200
Backup roll diameter (mm)15501550
Work roll bearing distance (mm)29802980
Backup roll bearing distance (mm)27802780
Work roll material typeHigh-speed steelInfinite chilled cast iron
Work roll density (kg/m3)78007200
Frictional coefficient0.3–0.40.2–0.3
Maximum rolling force (kN)40,00035,000
Table 2. Description and statistical range of input features for strip shape diagnosis.
NumberDescriptionUnitMin.Max.
1Carbon equivalentwt.%0.110.22
2Entrance thicknessmm36.8079.90
3Rolling Times27.0088.00
4Exit widthmm1265.002018.00
5Exit thicknessmm2.5024.09
6–12Shift amount (F1–F7)mm−141.00140.00
13–19Bending force (F1–F7)tf9.30151.00
20–26Rolling force (F1–F7)tf346.103753.60
27–33Rolling speed (F1–F7)m/s0.7012.00
34–40Rolling gap (F1–F7)mm2.0048.00
41–47Rolling reduction (F1–F7)mm0.0050.20
48–54Rolling temperature (F1–F7)°C806.001092.00
Table 3. Performance comparison of candidate models within the AutoML framework.
ModelAccuracyMCCROC-AUCF1PrecisionRecall
WeightedEnsemble_L20.95390.90790.99060.95240.9440.9609
LightGBMLarge0.95320.90630.99160.95160.94390.9593
XGBoost0.94980.89950.98170.94790.94260.9533
RandomForestEntr0.94870.8980.98960.94750.93130.9642
RandomForestGini0.94590.89220.98920.94450.92910.9604
ExtraTreesGini0.94560.89180.98790.94430.92730.962
ExtraTreesEntr0.94460.88960.98840.94320.92710.9598
KNeighborsDist0.93620.87230.9850.9330.94050.9257
LightGBMXT0.930.86020.97550.92790.91640.9398
LightGBM0.91670.83380.96790.91460.89970.93
CatBoost0.85560.7130.93530.85440.82690.8839
NeuralNetFastAI0.79630.59430.87530.79490.76850.8231
KNeighborsUnif0.75570.51010.83950.73980.75590.7244
Table 4. Comparison of PLR change points between causal feature attribution and associational baseline.
Process ParameterCausal Change PointBaseline Change PointShift
F1 rolling force 2684.682323.1361.58
F7 bending force 7773.273.73
F7 rolling force 927.11921.795.32
F6 rolling gap 11.5711.190.38
F4 rolling gap 115.285.72
Disclaimer/Publisher’s Note: The statements, opinions and data contained in all publications are solely those of the individual author(s) and contributor(s) and not of MDPI and/or the editor(s). MDPI and/or the editor(s) disclaim responsibility for any injury to people or property resulting from any ideas, methods, instructions or products referred to in the content.