1. Introduction
High-performance engineering applications often require metallic components capable of operating under severe thermo-mechanical conditions. In such environments, the selection of suitable materials and manufacturing strategies becomes critical to ensure structural integrity, thermal stability, and long-term reliability. Conventional solutions frequently rely on high-temperature alloys or refractory materials designed to withstand extreme operating conditions; however, the fabrication of complex geometries using these materials can be challenging with traditional manufacturing techniques, particularly when rapid prototyping or design flexibility is required [
1].
Additive manufacturing (AM) has recently emerged as an advantageous approach for the fabrication of rapid prototypes and functional components in many engineering fields, as it enables near-net-shape production and offers the potential for integrating advanced functionalities such as internal cooling channels and multi-material configurations, [
2]. In particular, laser-directed energy deposition (DED) [
3,
4,
5,
6] is well-suited for the manufacture of axisymmetric components and for localized material deposition.
AM with AISI 316L stainless steel via directed energy deposition (DED) has gained considerable attention due to its versatility for producing functional components and repairing damaged parts [
7,
8]. In laser-based systems, the choice between powder and wire feedstock is a determining factor that defines both process efficiency and final material characteristics [
9,
10]. Laser DED can be implemented using either wire [
11] or powder feedstock [
12], and although both approaches are widely used in industrial applications, their influence on the resulting microstructure remains strongly process-dependent. Powder-fed Laser DED is particularly suited for fabricating high-precision components with good surface finish, while wire-fed DED enables significantly higher deposition rates, facilitating the construction of large-scale structures [
10,
13]. These variations in feedstock delivery and energy density result in distinct thermal histories and cooling rates, which directly govern microstructural evolution [
4,
14]. Both processes typically generate hierarchical microstructures composed of epitaxially growing columnar grains with dendritic or cellular substructures, often containing metastable δ-ferrite within the austenitic matrix because of rapid, non-equilibrium solidification [
15,
16].
Differences in material delivery, melt pool dynamics, and thermal history are expected to produce distinct solidification morphologies and defect populations, which may ultimately affect the performance of components exposed to severe thermo-mechanical environments. Research indicates that wire-fed DED tends to produce coarser dendritic structures due to comparatively slower cooling rates, whereas powder-fed DED under faster cooling conditions typically results in more refined microstructures [
10,
16]. However, comparative studies addressing the microstructural response of wire- and powder-fed DED for representative geometries remain limited.
From an application perspective, high-performance engineering components often require alloys such as nickel or titanium-based superalloys to withstand extreme thermal and mechanical conditions. Nevertheless, processing such alloys by conventional manufacturing methods can be challenging, particularly for complex geometries, whereas additive manufacturing offers opportunities to fabricate near-net-shape parts despite challenges related to cracking or segregation. For this reason, an initial assessment using a well-established austenitic alloy such as AISI 316L provides a controlled framework to isolate the effect of deposition strategy on microstructural development before extending the approach to more demanding materials in the respective fields of application. This microstructural assessment using AISI 316L as a model alloy provides fundamental insights into the solidification behavior of L-DED processes, including dendritic scale, microsegregation patterns, and phase formation. The quantitative framework established here—combining thermal modeling, CALPHAD simulations, and microstructural characterization—can be directly applied to optimize the processing of more demanding alloys for high-performance engineering applications.
Within this context, the present work focuses on the microstructural characterization of specimens fabricated by using Laser DED feedstock as wire and powder. By examining the microstructure obtained in an austenitic alloy under two different deposition configurations, this study aims to identify process–structure relationships that will serve as a basis for the subsequent optimization of Laser DED methods for high-temperature alloys in advanced engineering applications.
2. Materials and Methods
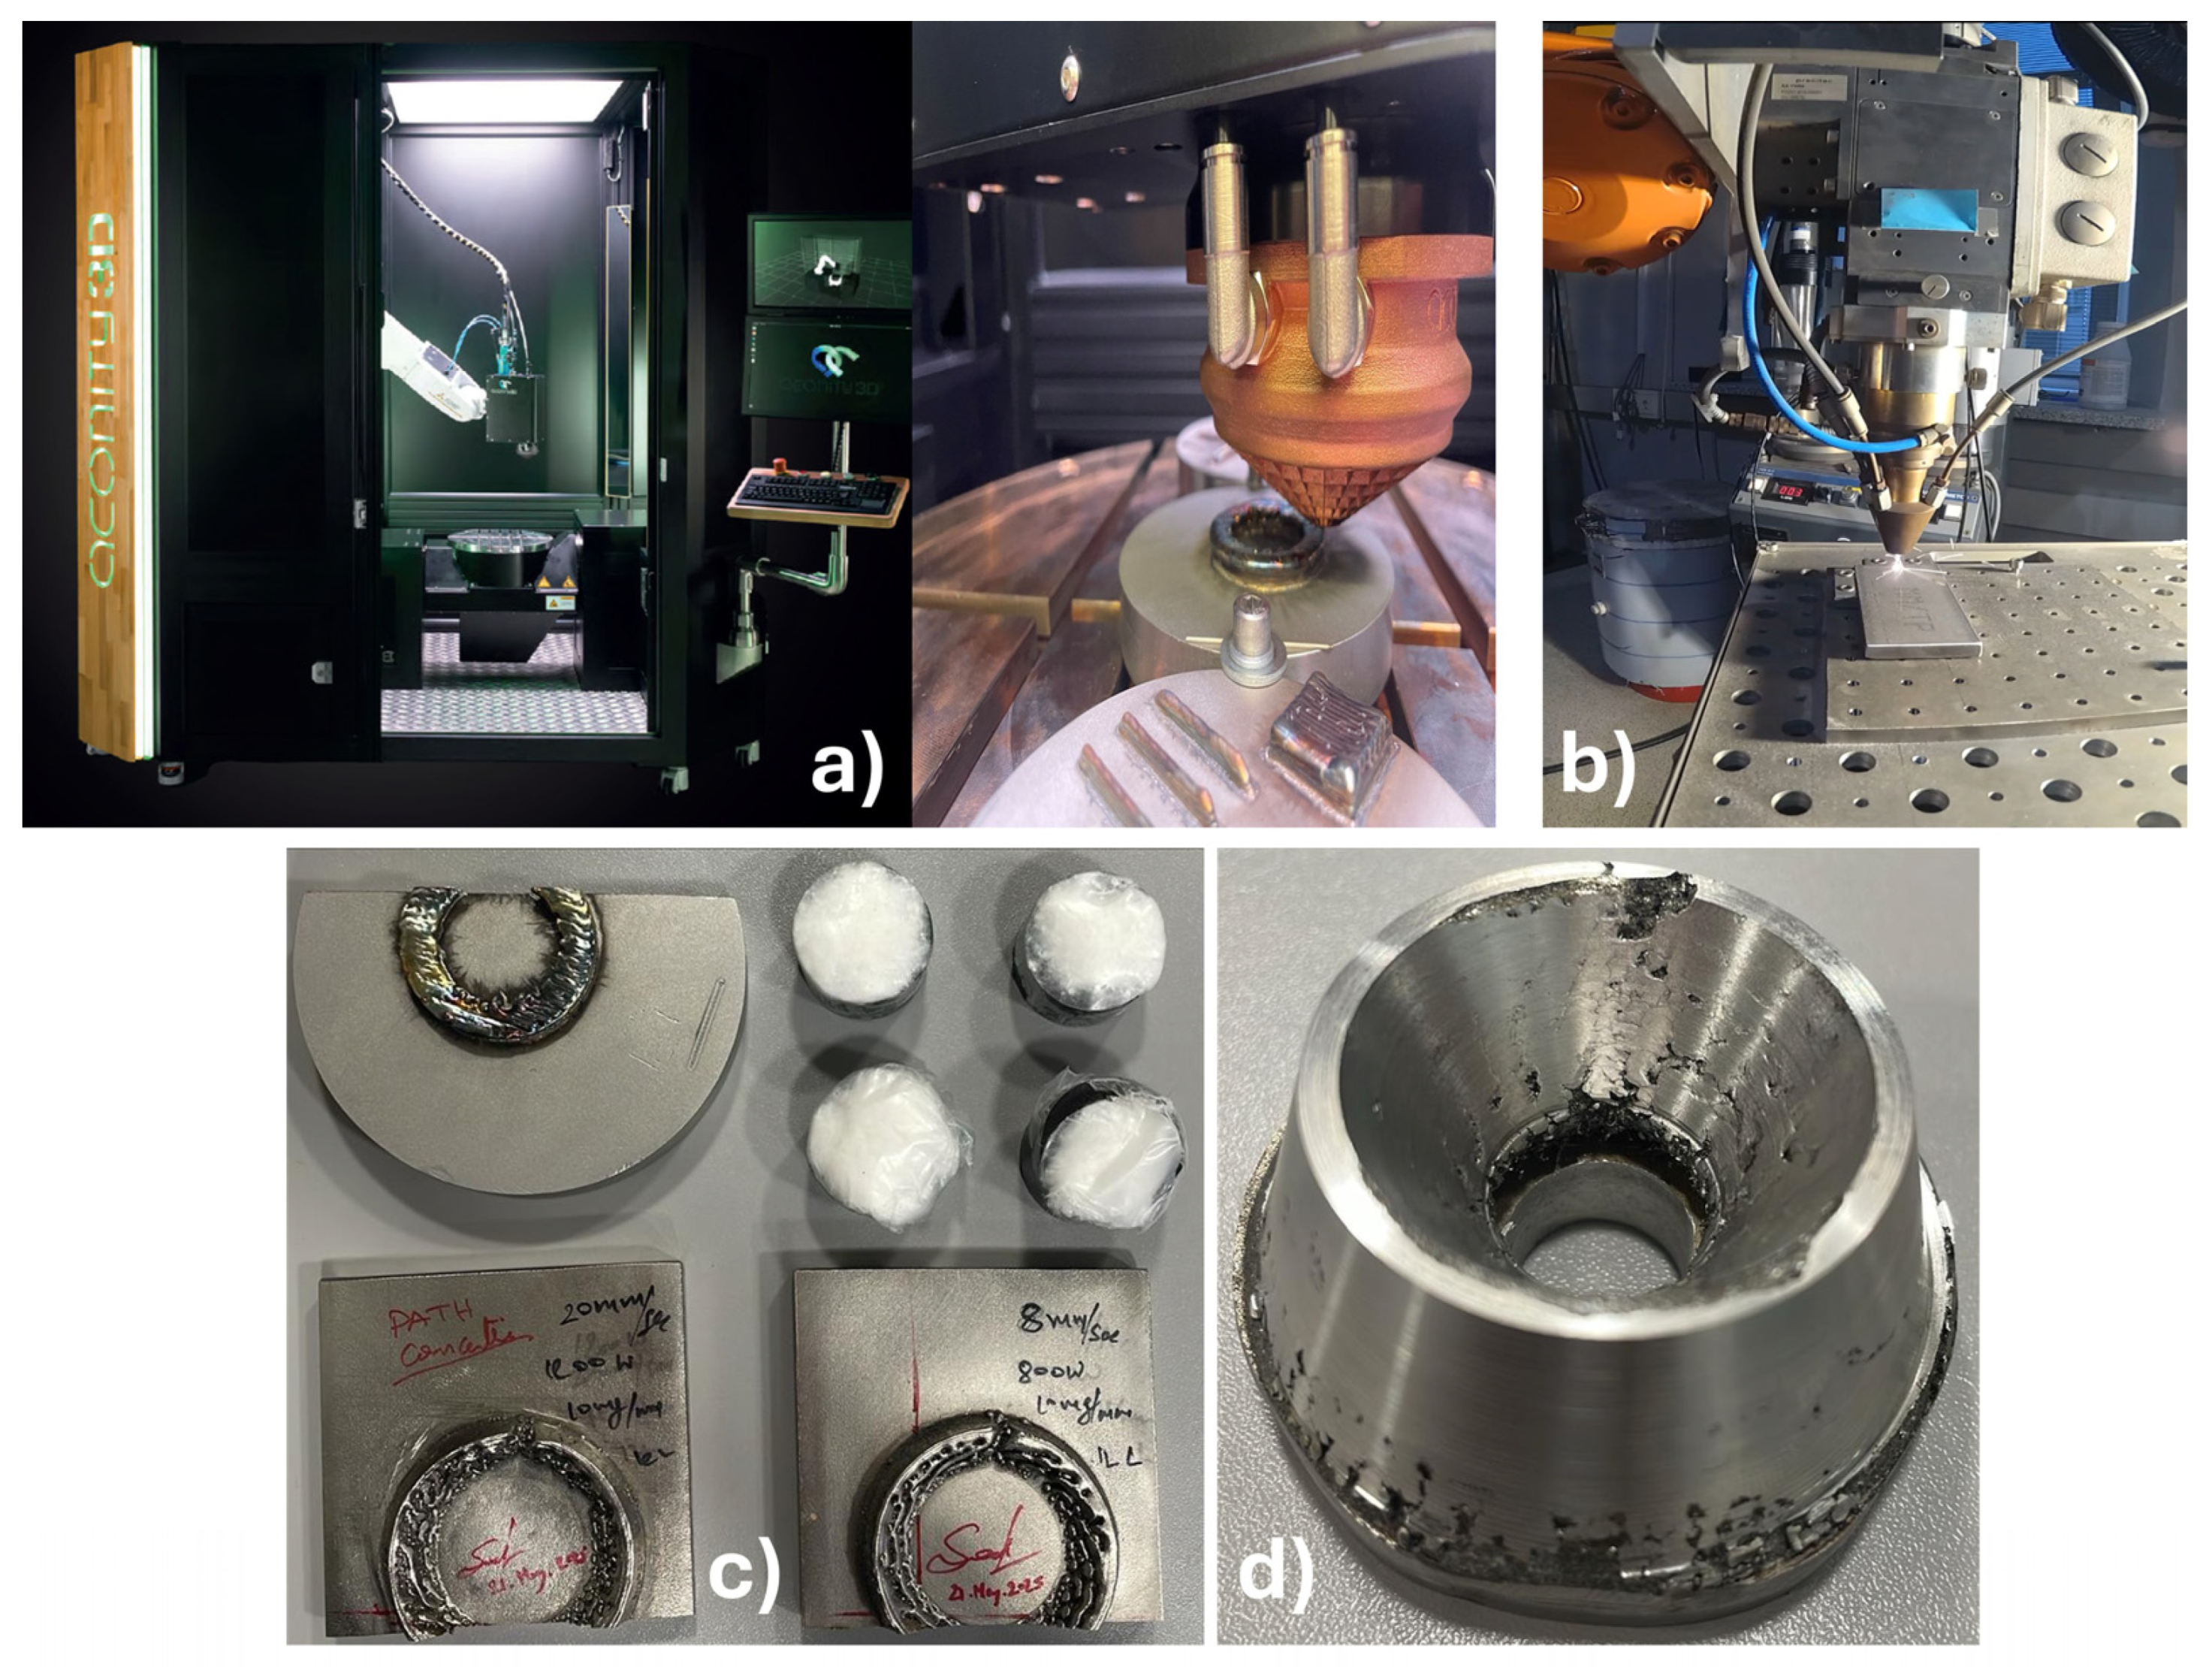
The specimens fabricated are similar to hollow cylinders with an outer diameter of approximately 40 mm, an inner diameter of approximately 20 mm varying with height, and a height of about 20 mm. They were fabricated onto 10 mm thick AISI 316L substrates using two distinct laser-directed energy deposition (L-DED) platforms and their respective feedstocks. Samples produced via laser wire DED (LW-DED) were fabricated using a 0.8 mm diameter AISI 316L wire on AconityWIRE system (Aconity3D GmbH, Herzogenrath, Germany), which integrates a high-power laser with the wire feeder within a sealed inert chamber (
Figure 1a). In contrast, samples produced via laser powder DED (LP-DED) were manufactured using gas-atomized AISI 316L powder with a particle size distribution of +45–106 µm. The deposition was carried out on a custom robotic cell built at our campus with maximum power of 2.2 kW continuous-wave Nd:YAG laser ROFIN-SINAR (ROFIN, Hamburg, Germany) shown in (
Figure 1b). The laser beam is delivered through a Precitec four-jet coaxial deposition head, mounted on a 6-axis ABB IRB 2400 industrial robotic manipulator (ABB, Zürich, Switzerland). Metallic powder is supplied by a Metco Twin 150 dual-hopper feeder (Oerlikon, Winterthur, Switzerland). The nominal chemical composition of both feedstocks, as provided by the suppliers, is detailed in (
Table 1). All processes were conducted under an inert gas (Ar) shroud to prevent oxidation.
Equilibrium solidification sequences and phase fractions for AISI 316L were estimated using the open-source CALPHAD software PyCALPHAD (0.11.0) [
17]. These calculations provided guidance on the expected formation of austenite and δ-ferrite during solidification, supporting the interpretation of the experimental microstructures observed in the deposited specimens.
The main processing parameters for the powder-based and wire-based DED processes are summarized in
Table 2. Four different energy metrics were considered: the linear energy density
(J/mm), representing the laser energy delivered per unit scan length; the volumetric energy density
(J/mm
3), describing the nominal energy input per unit volume of material processed; the mass-specific energy input
(kJ/g), quantifying the energy supplied per unit mass of material fed into the process; and the surface energy density
(J/mm
2), which expresses the laser energy applied per unit area of the scan track.
In
Table 2, the imposed parameters are the laser power
, the scan speed
, the laser spot diameter at the working surface, and the material feed rate (powder mass flow rate or wire feeding velocity). In addition, the deposition strategy was defined by the hatch spacing
and the layer thickness
. From these primary parameters, the linear mass feed rate and the different energy metrics were derived, providing normalized quantities that facilitate a direct comparison between the two deposition processes.
For the powder-based process, the feed rate was directly controlled as a mass flow rate (mg/s) and converted into a linear mass feed rate (mg/mm) by normalization with the laser scan speed. This parameter represents the amount of material supplied per unit scan length. For the wire-based process, the feed rate was imposed as a linear feeding velocity (mm/s) and converted into mass per unit length assuming a fully dense cylindrical wire. In this case, the linear mass feed rate corresponds to the mass of wire delivered per unit scan length and was calculated as , where is the material density and is diameter of the wire feed.
Post-fabrication, samples were sectioned, hot-mounted, and prepared following standard metallographic procedures. Final polishing was carried out using a 1 µm diamond suspension. The microstructure was revealed by electrolytic etching in 10% oxalic acid at 4 V for 2–4 s. Initial observations were performed using an optical microscope (Nikon Eclipse L150, Nikon Corp., Tokyo, Japan). Higher-magnification imaging and semi-quantitative compositional analyses were conducted using a scanning electron microscope (JEOL JSM-6400, JEOL Ltd., Tokyo, Japan) equipped with an energy-dispersive X-ray spectroscopy (EDS) system. Vickers microhardness measurements were performed using a load of 1.961 N (HV0.2) and a dwell time of 10 s.
3. Results
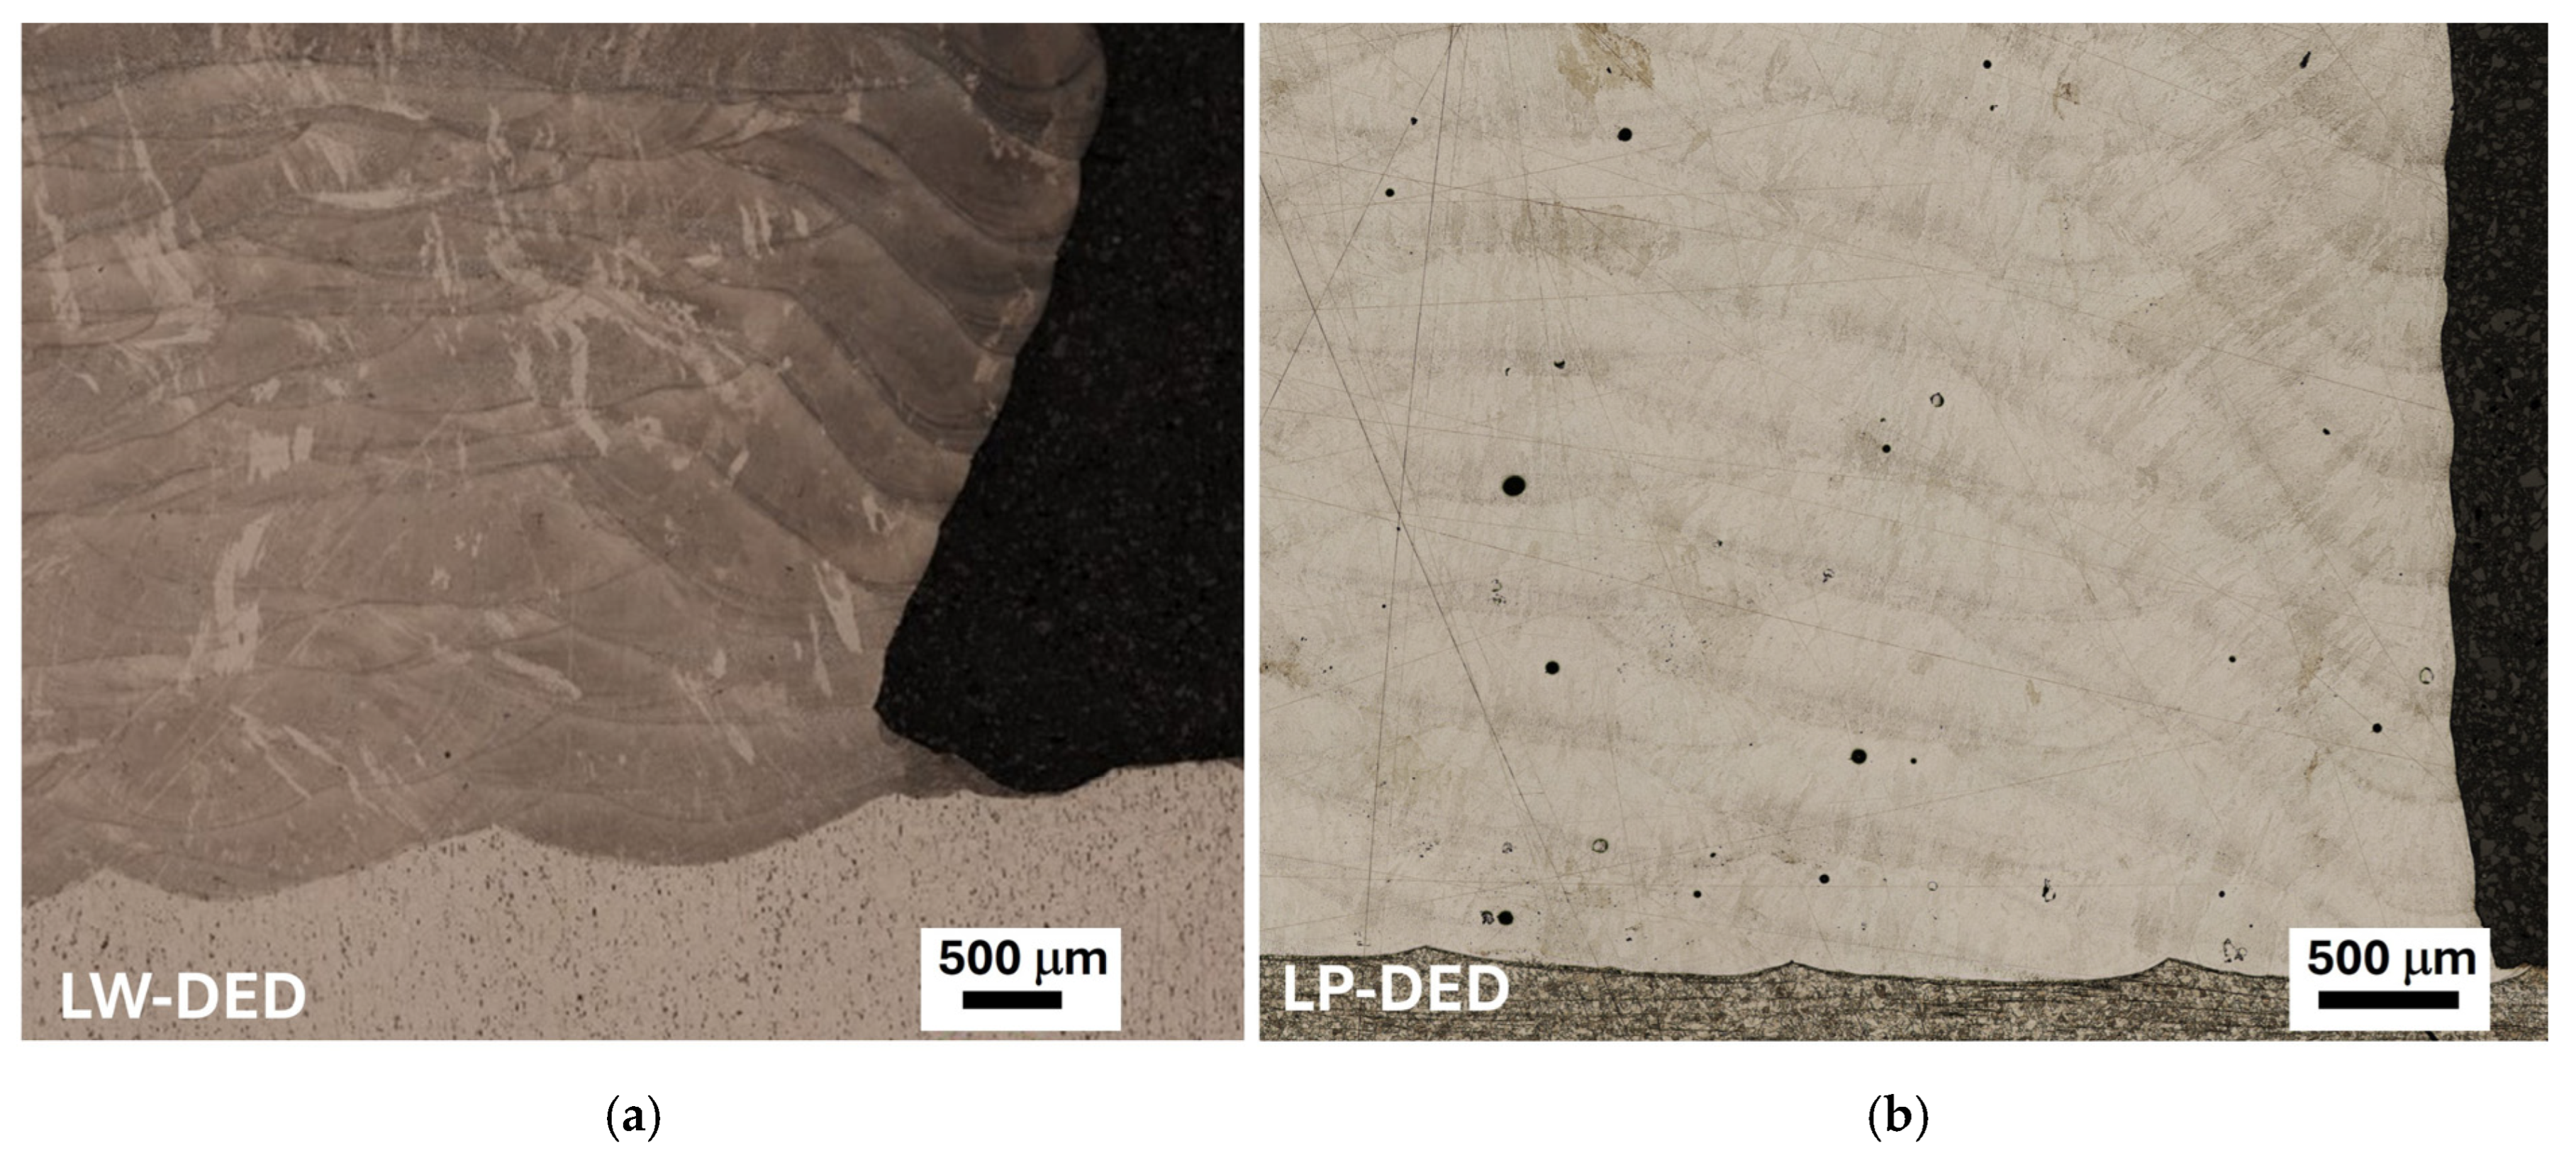
The optical micrograph of the LW-DED sample cross-section (
Figure 2) reveals the characteristic layered structure of the process. Clearly visible, overlapping weld beads display a semi-elliptical shape, each with a distinct remelted zone at the interface confirming good interlayer bonding. Some columnar grains are observed growing epitaxially across multiple deposited layers. No significant porosity or lack-of-fusion defects are visible in this field of view, indicating adequate process parameters for complete fusion. The same layered structure is visible in the LP-DED material which, as a difference, exhibits a low but noticeable population of fine spherical pores. This porosity is characteristic of powder-fed DED processes [
18] and can be attributed to two main mechanisms. First, during deposition, fast-moving powder particles impacting the melt pool surface can entrain shielding gas, which becomes trapped upon solidification. Second, residual porosity may be inherited from the feedstock itself, as gas-atomized powder particles can contain small, hollow pores or satellite structures formed during atomization. In contrast, the solid, dense nature of the wire feedstock makes the LW-DED material effectively free from this type of porosity [
19]. Despite being present, the pores observed in the LP-DED sample are typically small and, given their fine size and spherical morphology, are not expected to significantly compromise the mechanical integrity of the deposits.
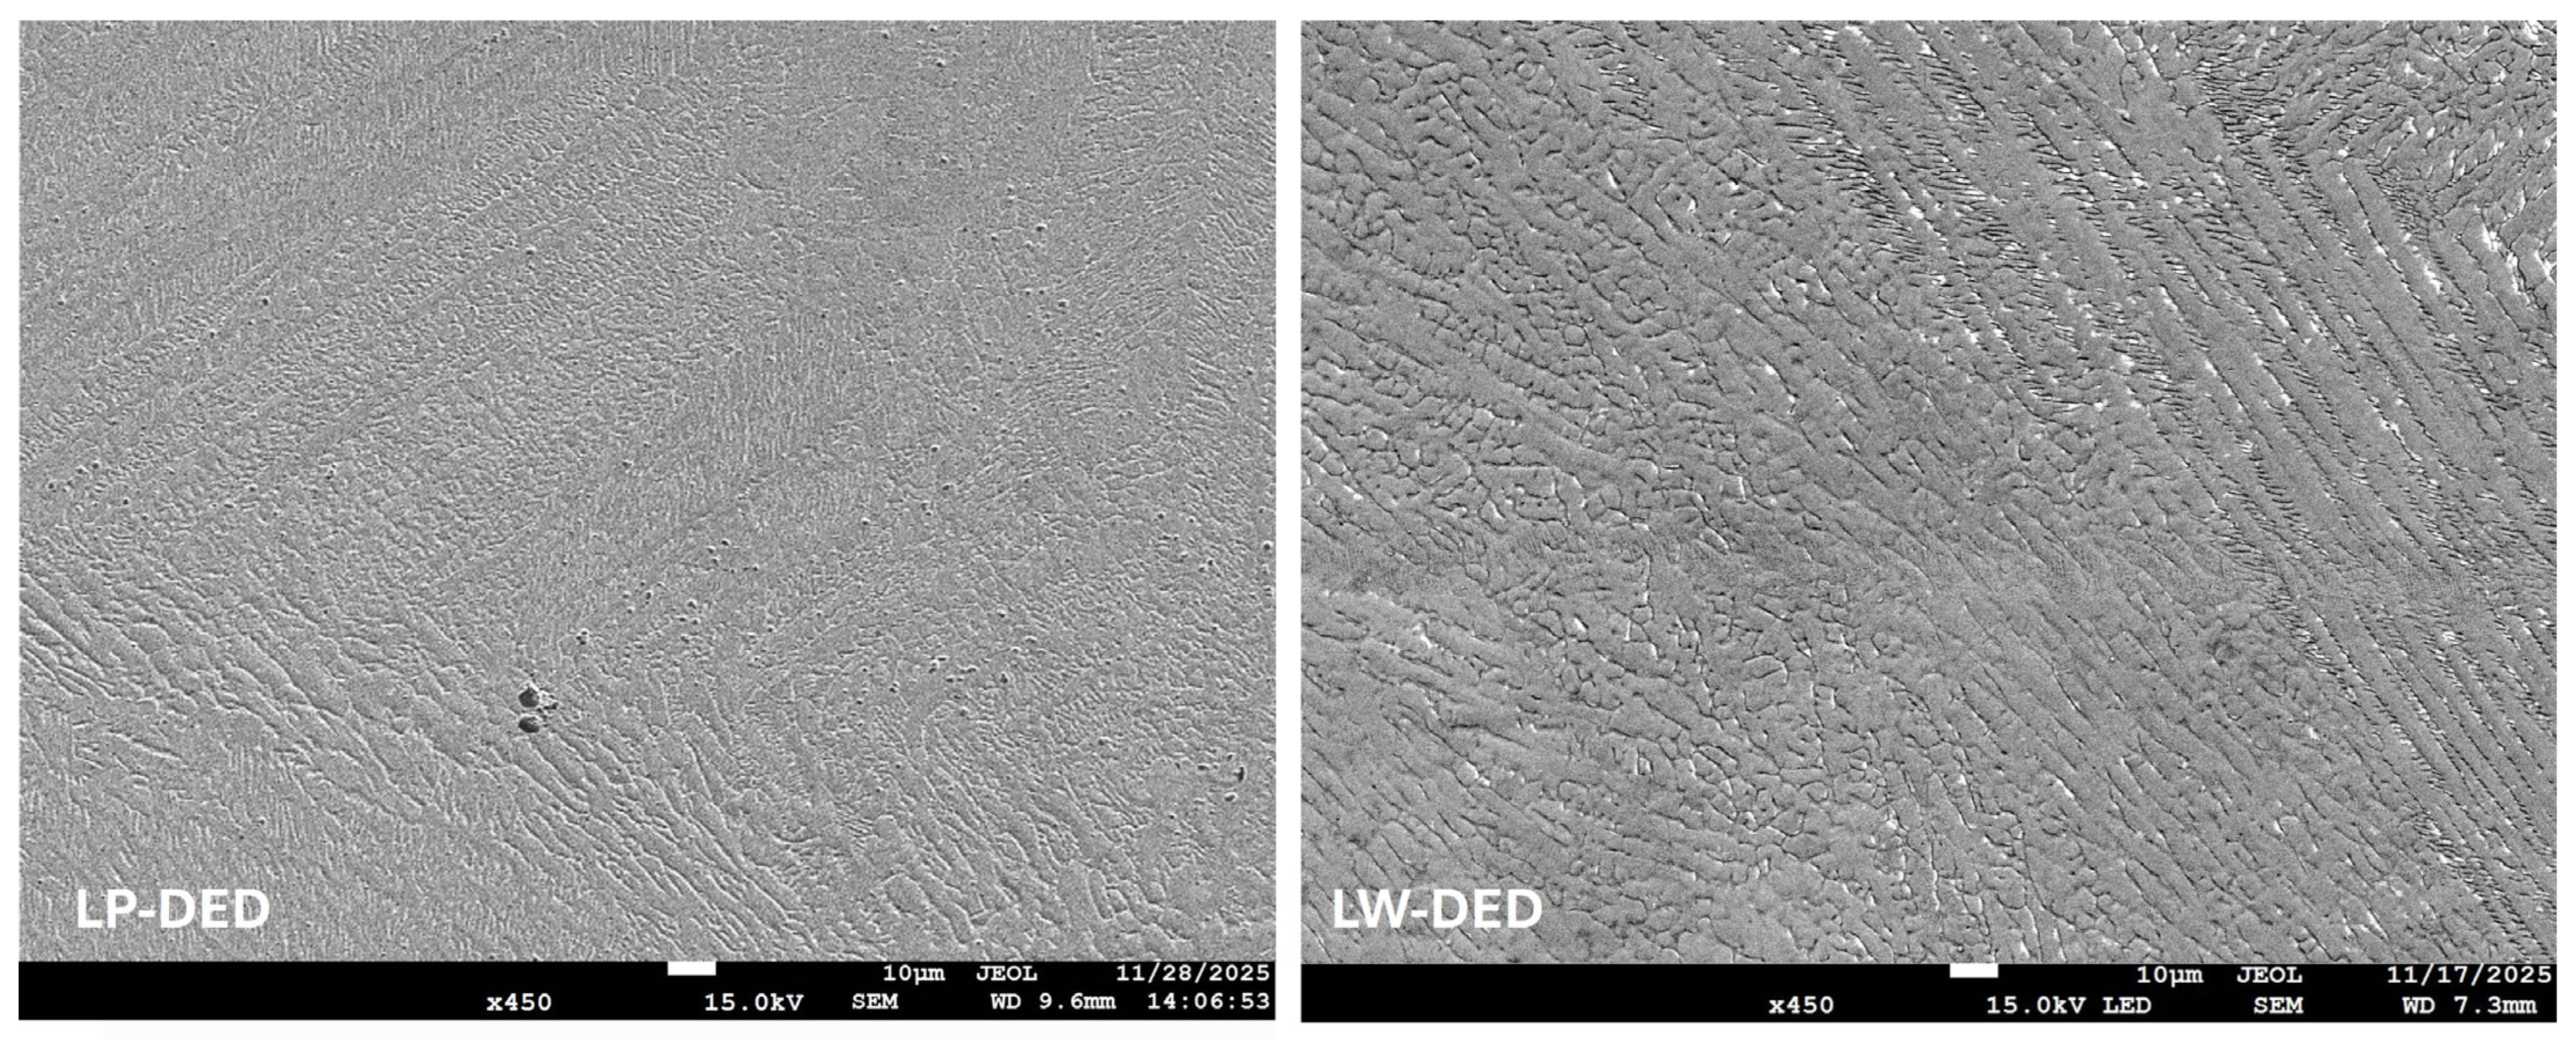
Microstructural characterization via SEM revealed fundamental differences in the solidification mechanisms associated with each feedstock type. The specimen fabricated via LP-DED (
Figure 3) exhibited a fine cellular–dendritic solidification structure, where melt pool boundaries were well-defined by inward-growing columnar grains, with a slight tendency toward equiaxed formation in the pool centers. In contrast, the microstructure produced by LW-DED was markedly coarser, dominated by large columnar dendrites that displayed pronounced epitaxial growth across multiple deposition layers, resulting in less distinct fusion boundaries.
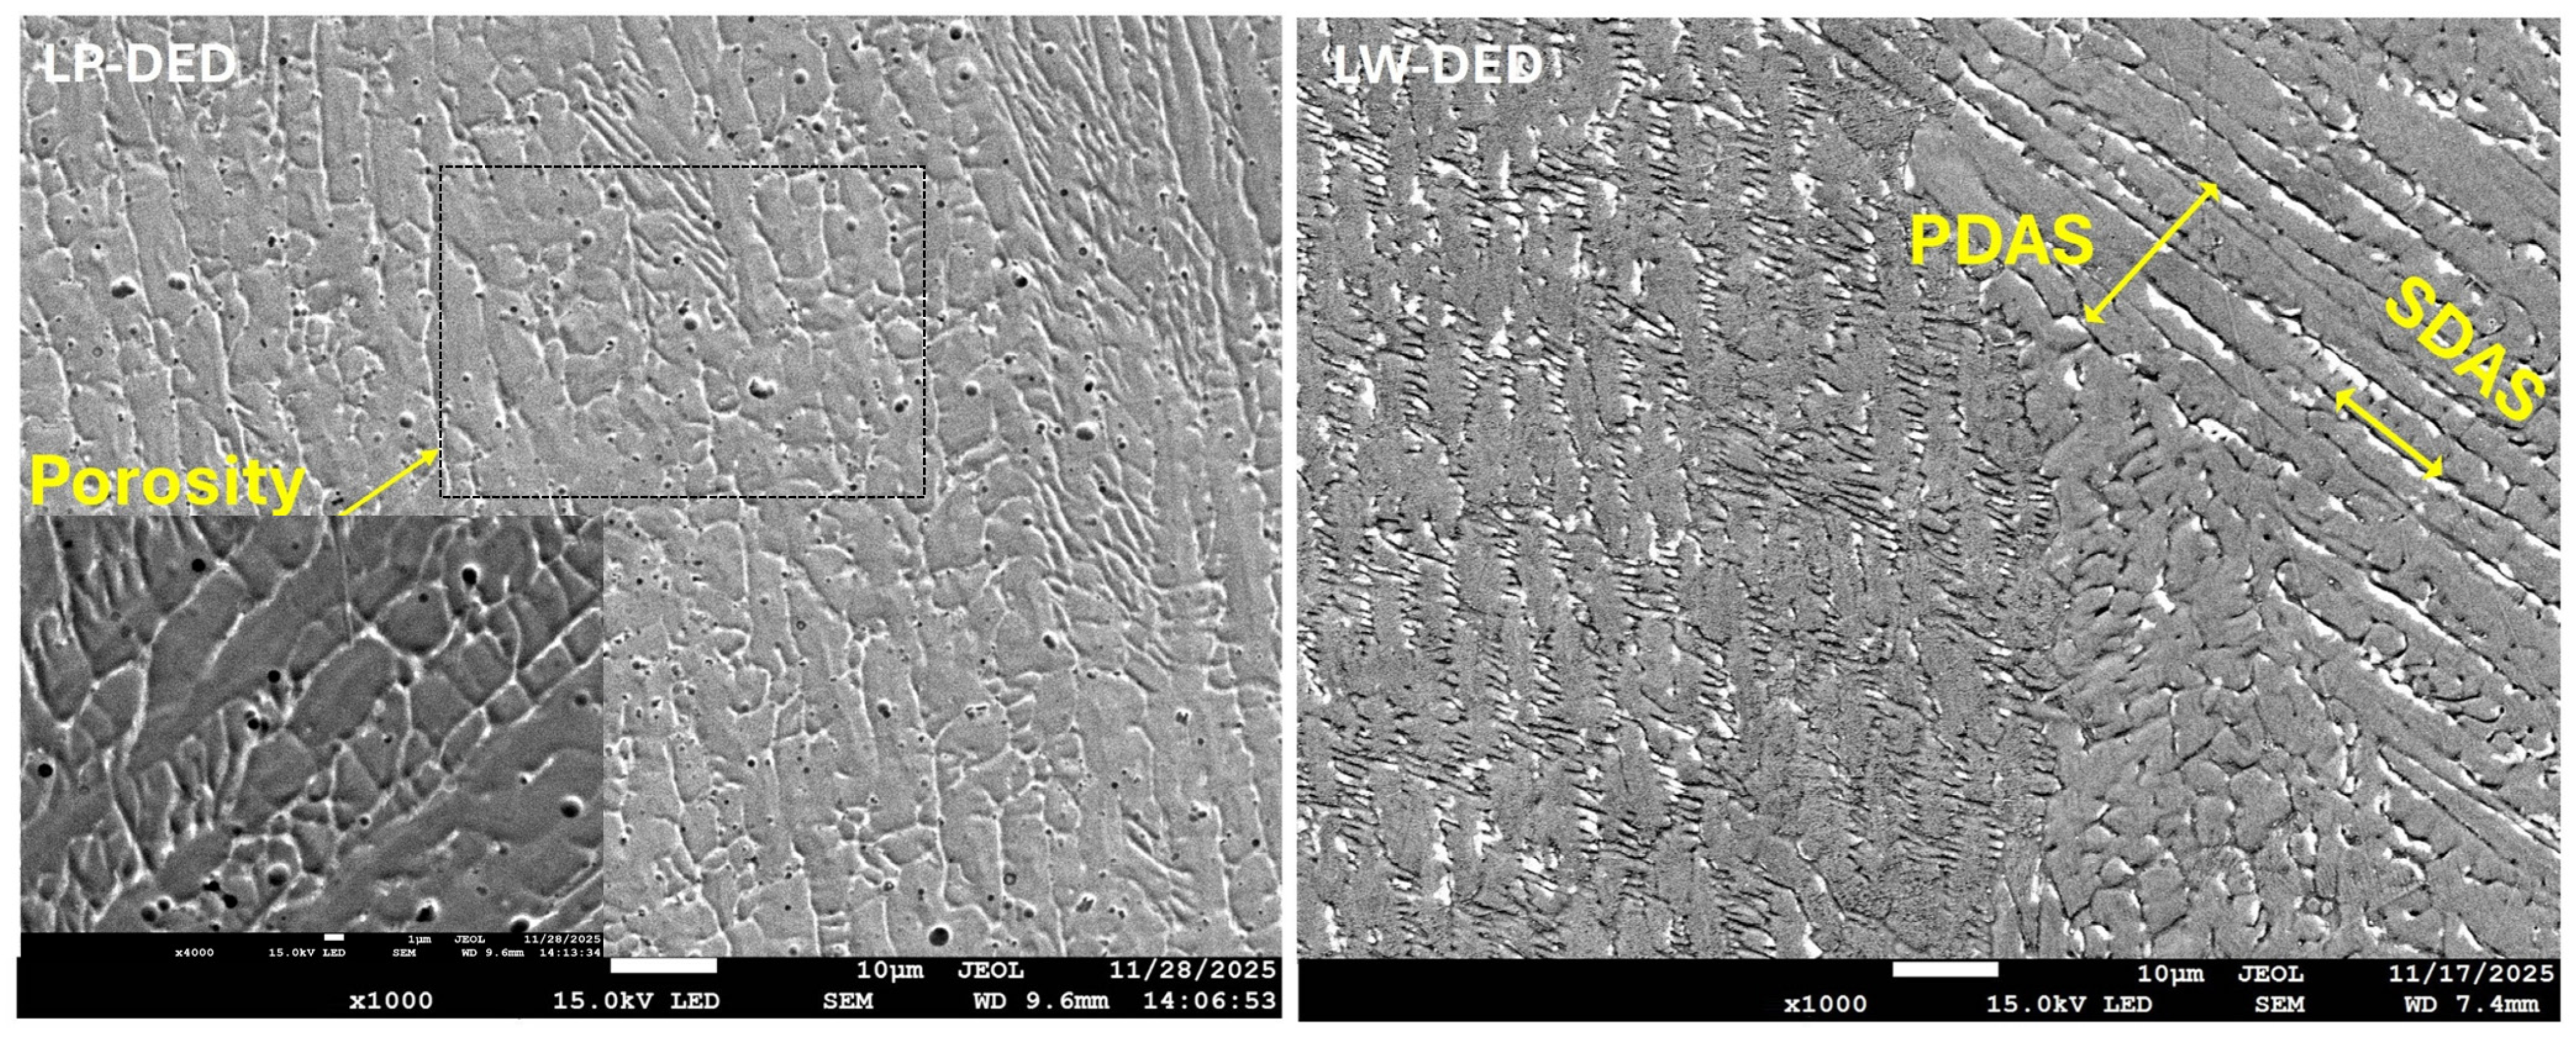
Higher-magnification examination provided further details. The LP-DED sample above (
Figure 4) shows a homogeneous distribution of fine, spherical pores, typically with diameters below 5 µm. In the LW-DED sample, no significant porosity was observed within the examined field. To quantify the scale of solidification, the primary (PDAS, λ
1) and secondary (SDAS, λ
2) dendrite arm spacings were systematically measured on five representative regions at different heights along the build direction for each sample. No significant variation was observed between locations, confirming microstructural homogeneity throughout the deposited material. The measurement protocol involved drawing intercept lines perpendicular to the growth direction of primary dendrites for PDAS and along secondary arms for SDAS, as exemplified by the overlaid annotations in (
Figure 4). This approach ensured consistent capture of the characteristic spacings for both microstructures. The resulting average values, compiled in
Table 3, confirm that the dendritic structure in the LW-DED sample is consistently coarser than that in the LP-DED sample.
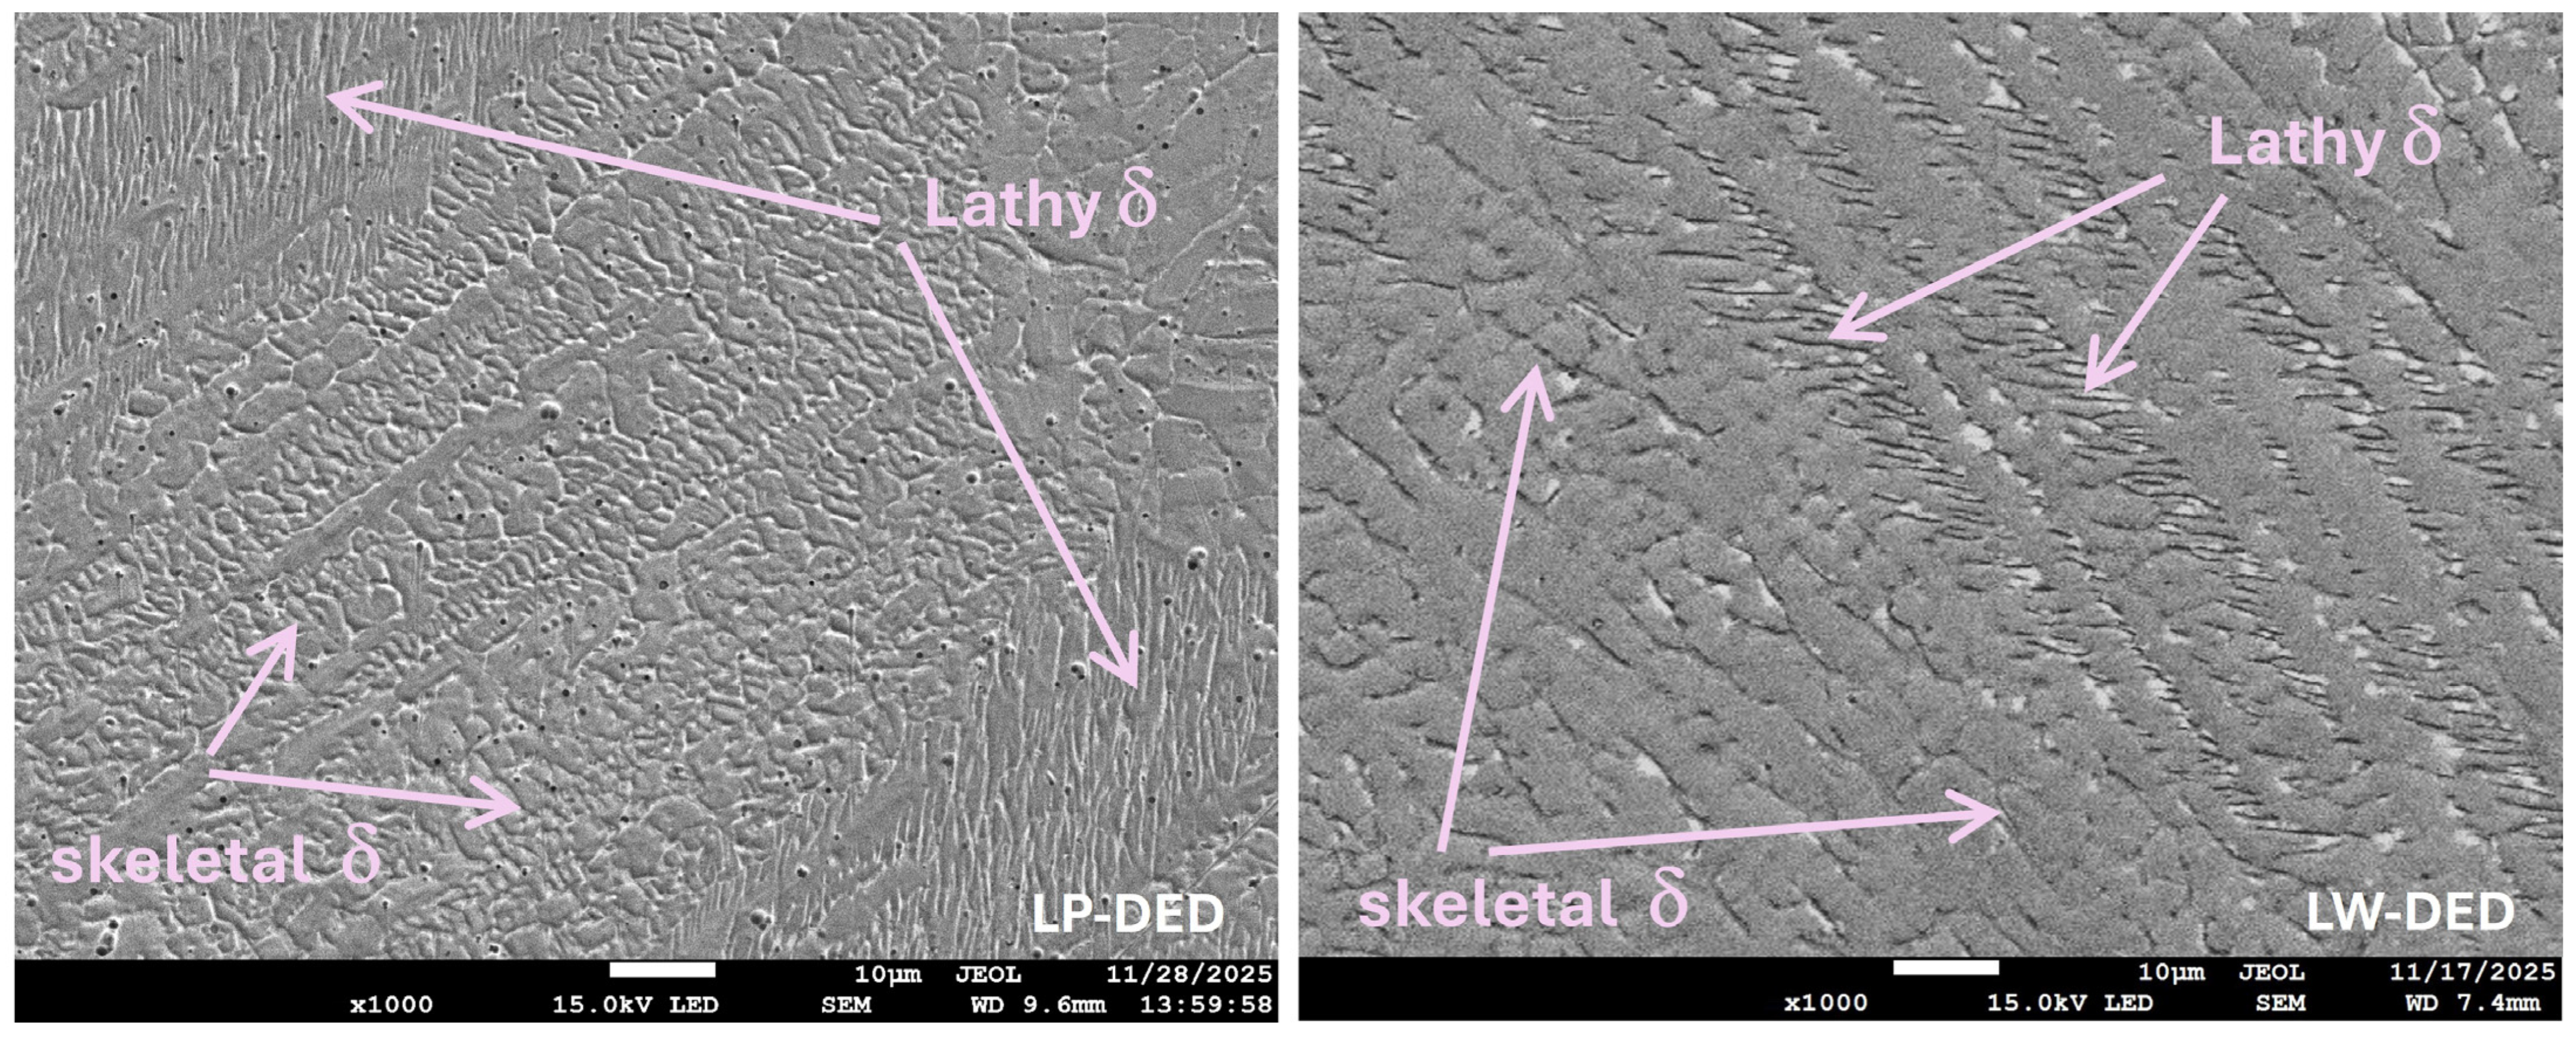
SEM examination also revealed the presence of two distinct δ-ferrite morphologies within the dendritic microstructure (
Figure 5). Skeletal (vermicular) ferrite, forming an interconnected network along interdendritic regions, was observed alongside lathy ferrite, characterized by elongated, plate-like features arranged in parallel arrays. These morphologies are commonly reported in directed energy deposition of 316L and have been documented in the literature [
20,
21]. A higher proportion of the lathy morphology was noted in the LP-DED sample.
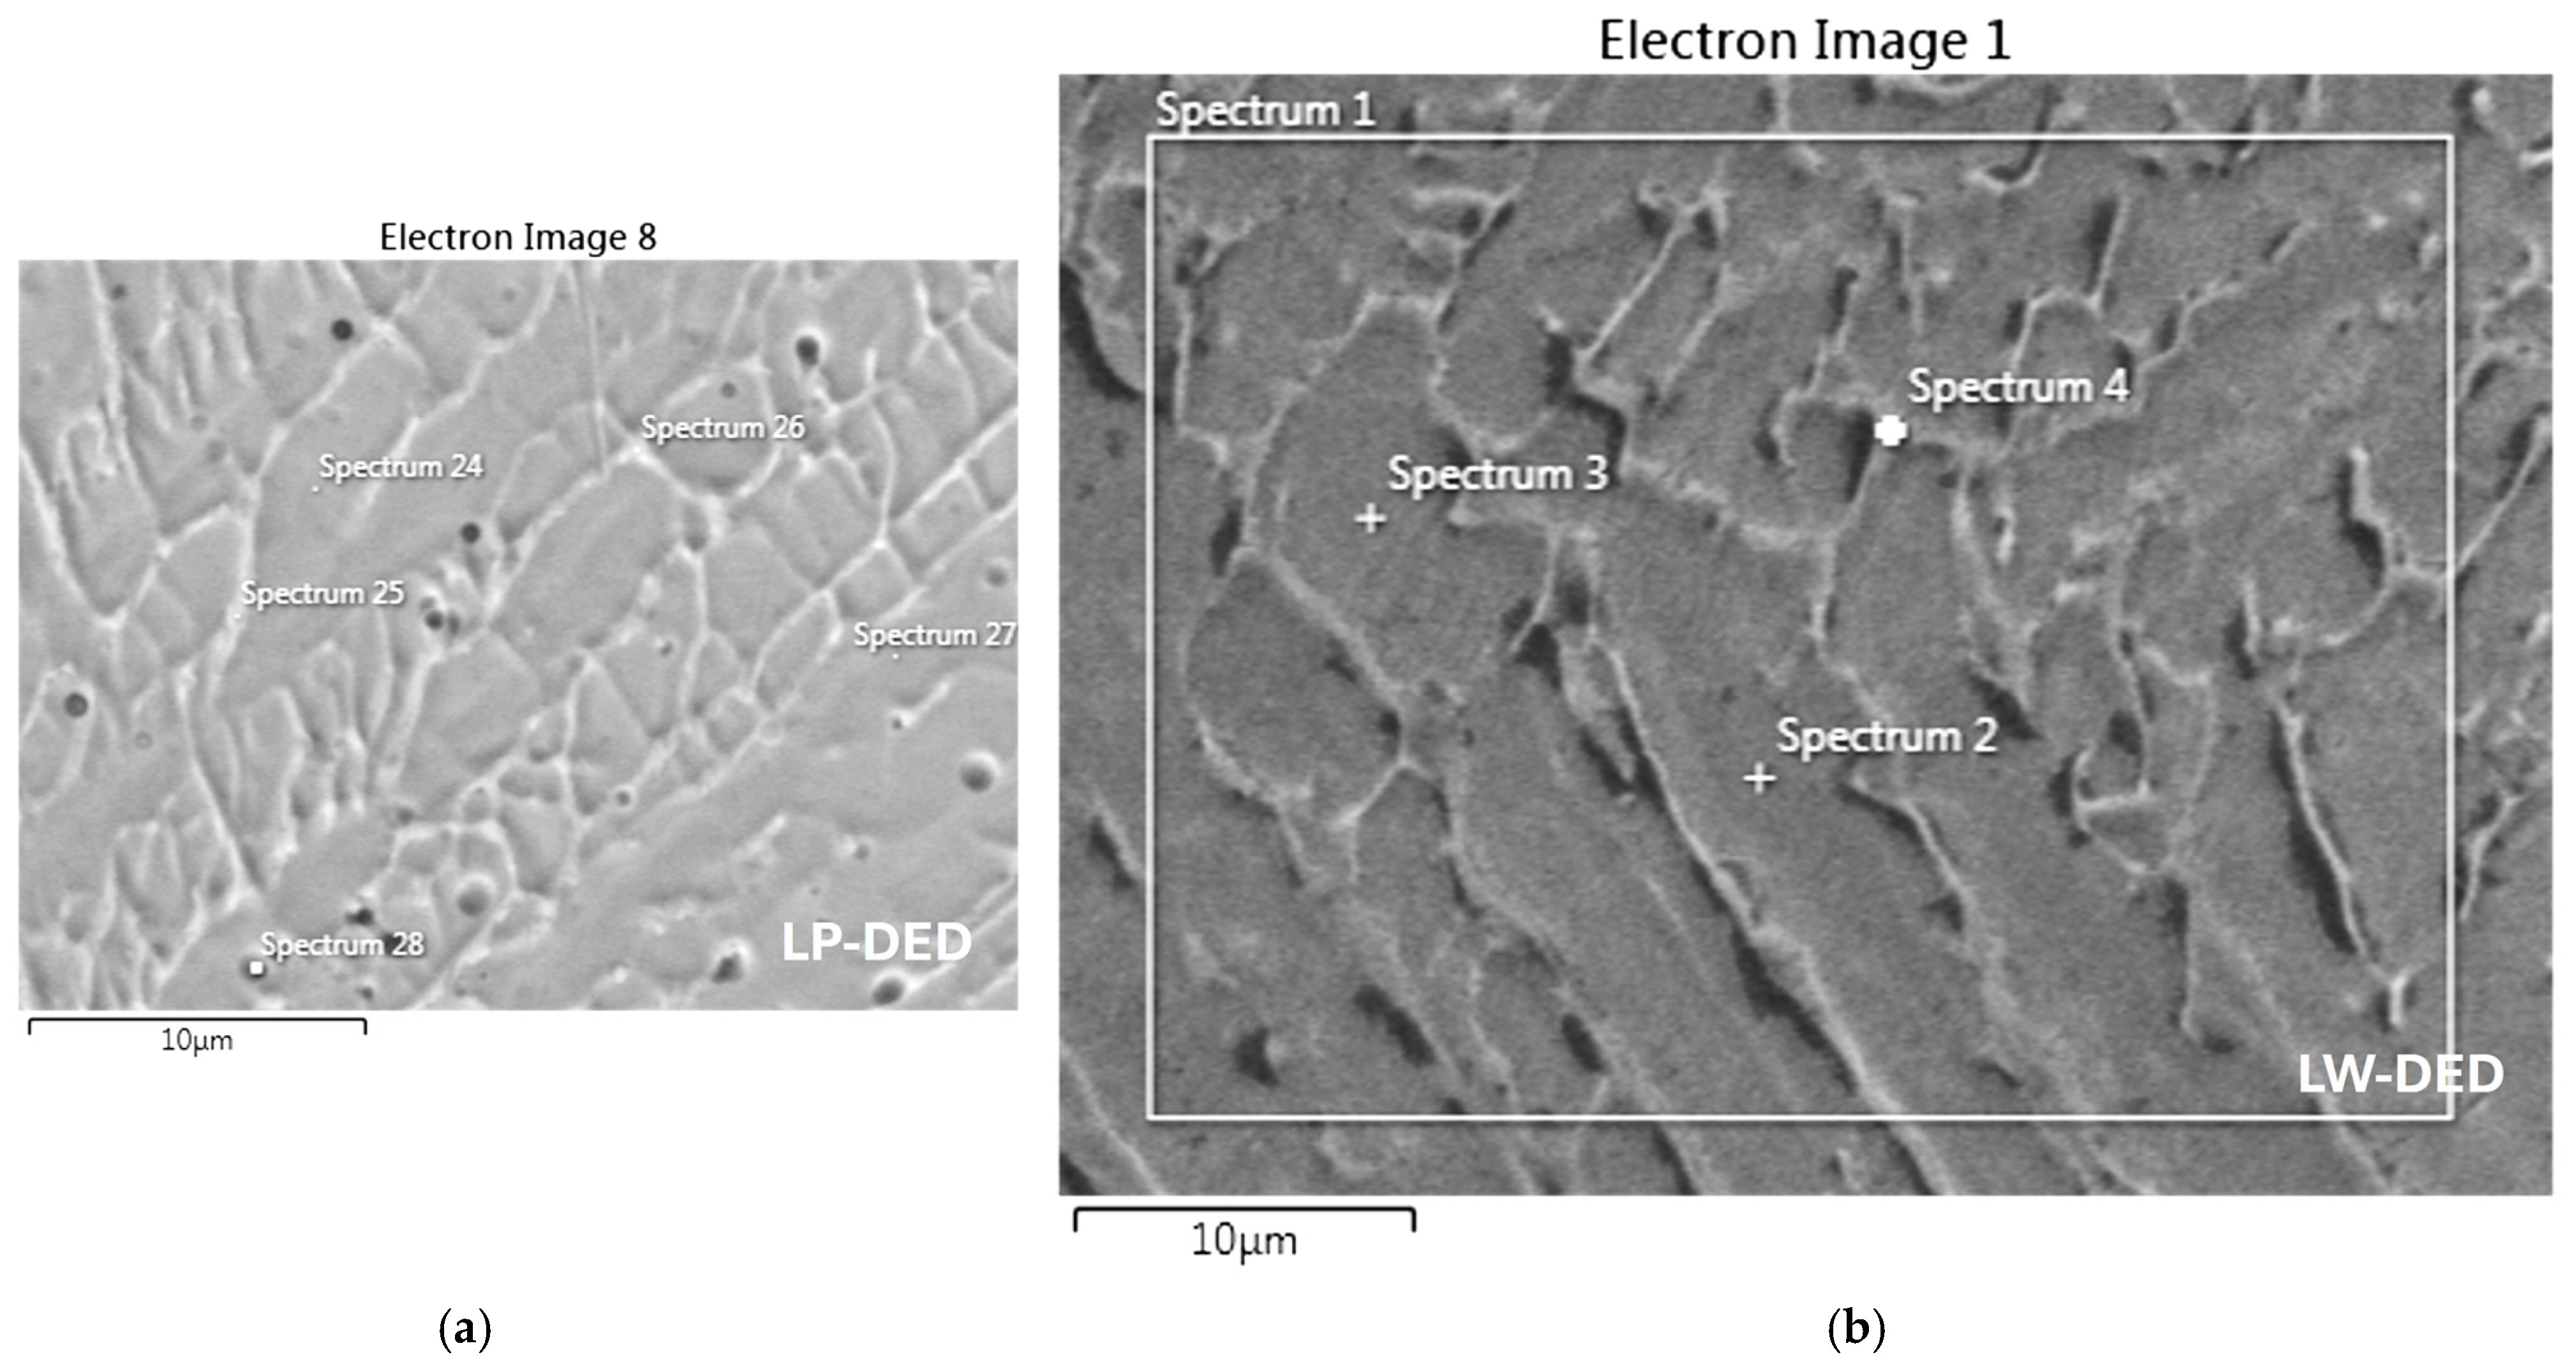
To assess microsegregation after solidification, semi-quantitative composition was measured at specific points via EDS. The high-magnification SEM images (
Figure 5) show the analysis locations on dendritic cores and in interdendritic regions. This allows for a direct comparison between the composition of the first solid to form (the dendrites) and the solute-enriched residual liquid. The weight percentages for the main alloying elements (Fe, Cr, Ni, Mo, Si) are presented in
Table 4.
The bulk compositions for both the LP-DED and LW-DED samples correspond well to standard AISI 316L specifications, confirming the integrity of the deposited material. A comparison between the dendritic and interdendritic regions reveals a distinct difference between the two processes. For the LW-DED sample (
Figure 6), the compositional measurements for all key elements (Fe, Cr, Ni, Mo, Si) show no statistically significant variation between the dendritic cores and the interdendritic areas. The values for each element in these two regions fall within each other’s margin of error, indicating a homogeneous solute distribution at the microstructural scale. Unlike the homogeneous composition of the LW-DED material, the LP-DED structure exhibits the chemical signature of microsegregation. This is seen as an enrichment of ferrite-stabilizing elements like Si and Mo in the last-to-solidify interdendritic areas, alongside a depletion of the austenite stabilizer Ni.
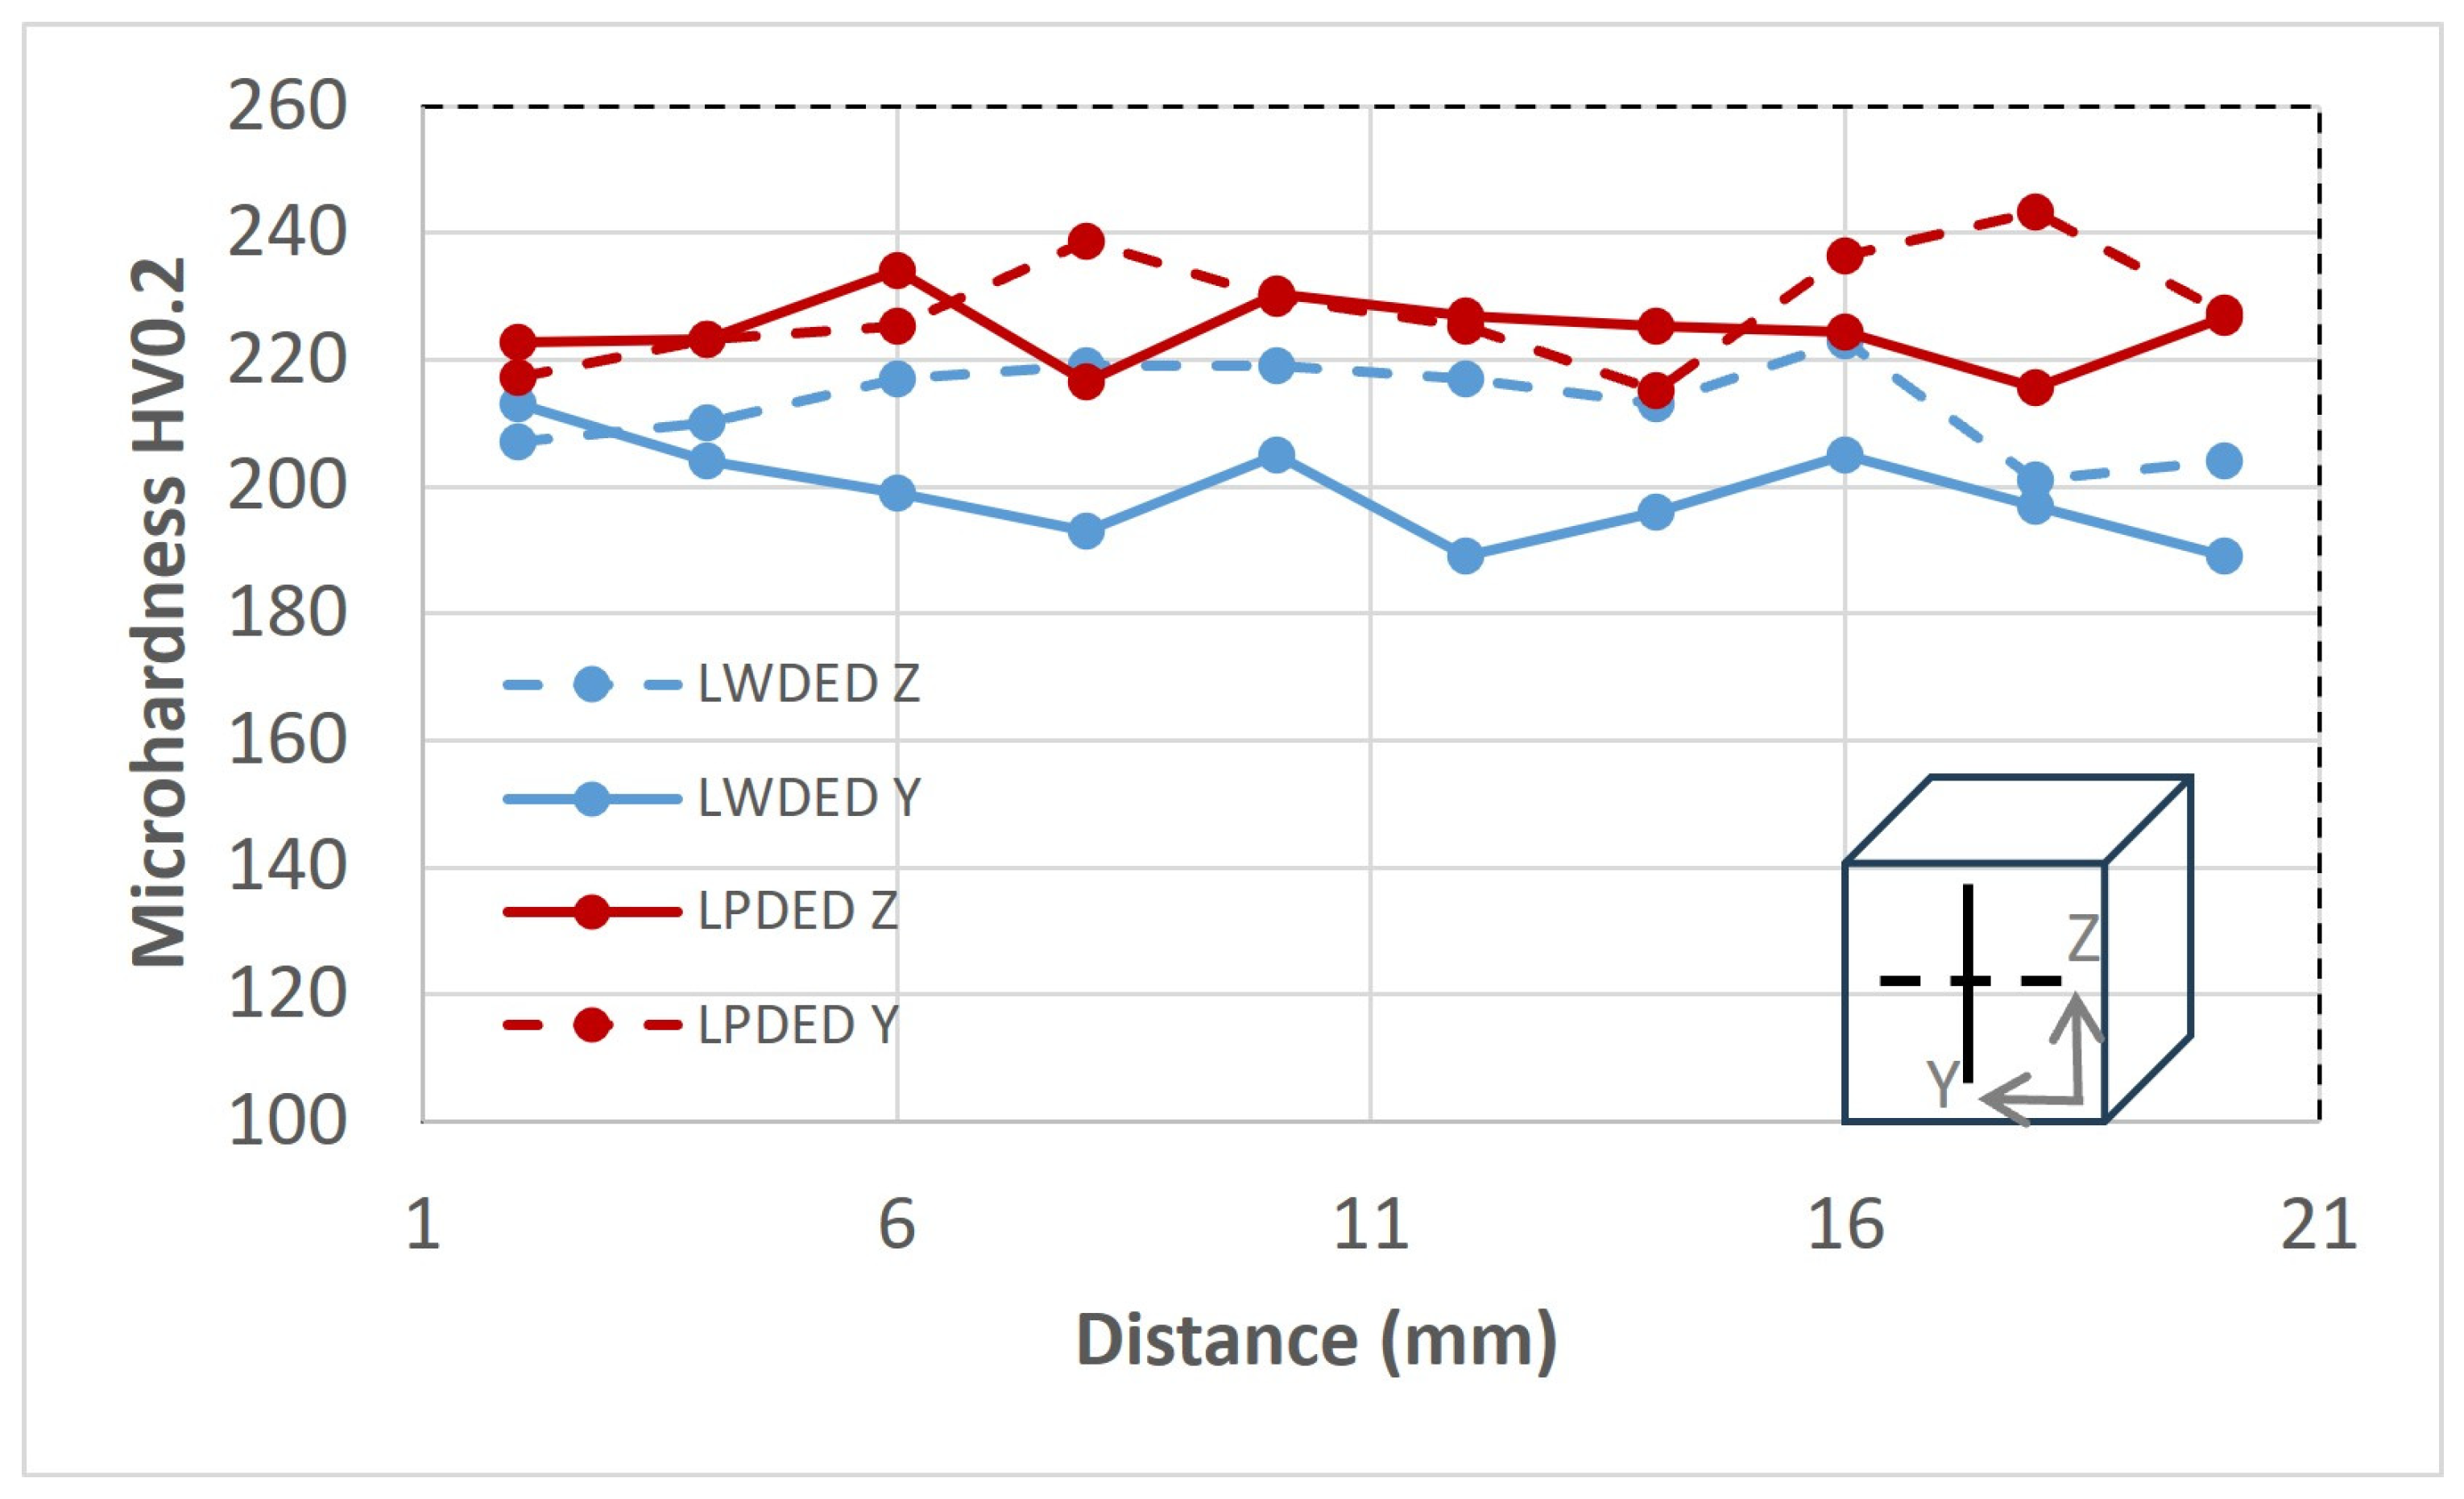
The microhardness profile across the deposited material was evaluated. Indentations were performed on cross-sectional samples along two primary axes: one aligned with the build direction (vertically, every 2 mm) and another traversing the sample width (horizontally). For both the LP-DED and LW-DED samples, the hardness values were found to be generally homogeneous, with no significant trends or gradients observed along either measurement direction (
Figure 7). The average Vickers microhardness for the LP-DED specimen was 226 ± 8 HV. The LW-DED specimen exhibited a slightly lower average hardness of 206 ± 10 HV.
4. Discussion
The microstructure of a solidified alloy is primarily governed by the cooling rate (
) and the thermal gradient (
) at the solid–liquid interface. These two quantities are related by the expression
, where
is the solidification rate (or growth rate). In laser-based additive manufacturing processes,
can be approximated as
, where
is the laser scan speed and
is the angle between the scan direction and the direction of crystal growth [
22]. A high
ratio promotes columnar grain growth, while a low
ratio favors the formation of equiaxed grains. Additionally, a high product
corresponds to a high cooling rate, which tends to refine the microstructure, whereas a low
leads to coarser features.
To obtain quantitative estimates of the thermal gradient and cooling rate, the Rosenthal equation—originally developed for welding—was employed [
23]. This analytical solution describes the temperature field around a moving heat source in a semi-infinite body under steady-state conditions. Although originally intended for welding, it has been widely adopted in Laser DED and additive manufacturing modeling due to its simplicity and reasonable accuracy. The temperature distribution around the heat source can then be expressed as follows:
In Equation (1), denotes the temperature at a given point, while is the initial temperature of the substrate. The material properties are represented by , the thermal conductivity, and , the thermal diffusivity. The laser scan speed is given by . The absorbed power is obtained from the nominal laser power and the absorptivity as . The spatial coordinates and describe the geometry of the melt pool: is the distance measured from the heat source along the direction of travel, and is the radial distance from the heat source to any point of interest.
In this approach, Equation (1) is evaluated along the laser scan direction at the melt pool boundary. From this, the thermal gradient
and the cooling rate
can be derived analytically. The thermal gradient along the scan direction is given by the derivative of temperature with respect to
:
The cooling rate, which represents the rate of temperature change with time at a fixed point, follows from the chain rule as the product of the thermal gradient and the scan speed:
For the purpose of estimating the thermal gradient and cooling rate, a constant melting temperature of 1700 K was assumed for the 316L stainless steel, along with a thermal conductivity of 14 W/mK. The initial substrate temperature was taken as 300 K. The absorbed power is calculated assuming full absorption of the laser power (η = 1) substitution in the above equations, which gives K/m and = 1724 K/s for the LP DED process and K/m and = 1379 K/s.
The primary dendrite arm spacing (PDAS) is usually correlated with the cooling rate using empirical power-law models, particularly the following:
where
and
are material constants. For AISI 316L, values of
μm·(K/s)
n and
were adopted, based on established correlations for austenitic stainless steels [
24].
The PDAS values predicted by this empirical model using the cooling rates from the Rosenthal equation (assuming 99.99% laser absorption) are approximately 6.8 μm for LP-DED and 7.4 μm for LW-DED, both higher than the measured values of 3.29 μm and 5.15 μm. This overestimation is largely due to the assumption of full absorption, which is not realistic. In DED processes, absorptivity is typically around 30–50% due to reflections and beam attenuation [
25]. For powder-fed DED, additional losses of 5–20% occur due to scattering and reflection of the laser beam by the powder particles as they intersect the beam path [
26]. This attenuation effect becomes more pronounced at higher powder feed rates, where a denser particle stream intercepts a larger fraction of the incident energy before it reaches the melt pool. Using more realistic absorptivity values—e.g., η = 0.3 for LP-DED and η = 0.5 for LW-DED—gives revised PDAS estimates of approximately 4.5 μm and 5.8 μm, which are much closer to the experimental data. In any case, the predicted trend—finer PDAS for LP-DED and coarser for LW-DED—is consistent with the experimental observations. This confirms that the higher cooling rate experienced by the LP-DED process is the primary factor responsible for its more refined dendritic structure, while the lower cooling rate in LW-DED leads to coarser dendrites.
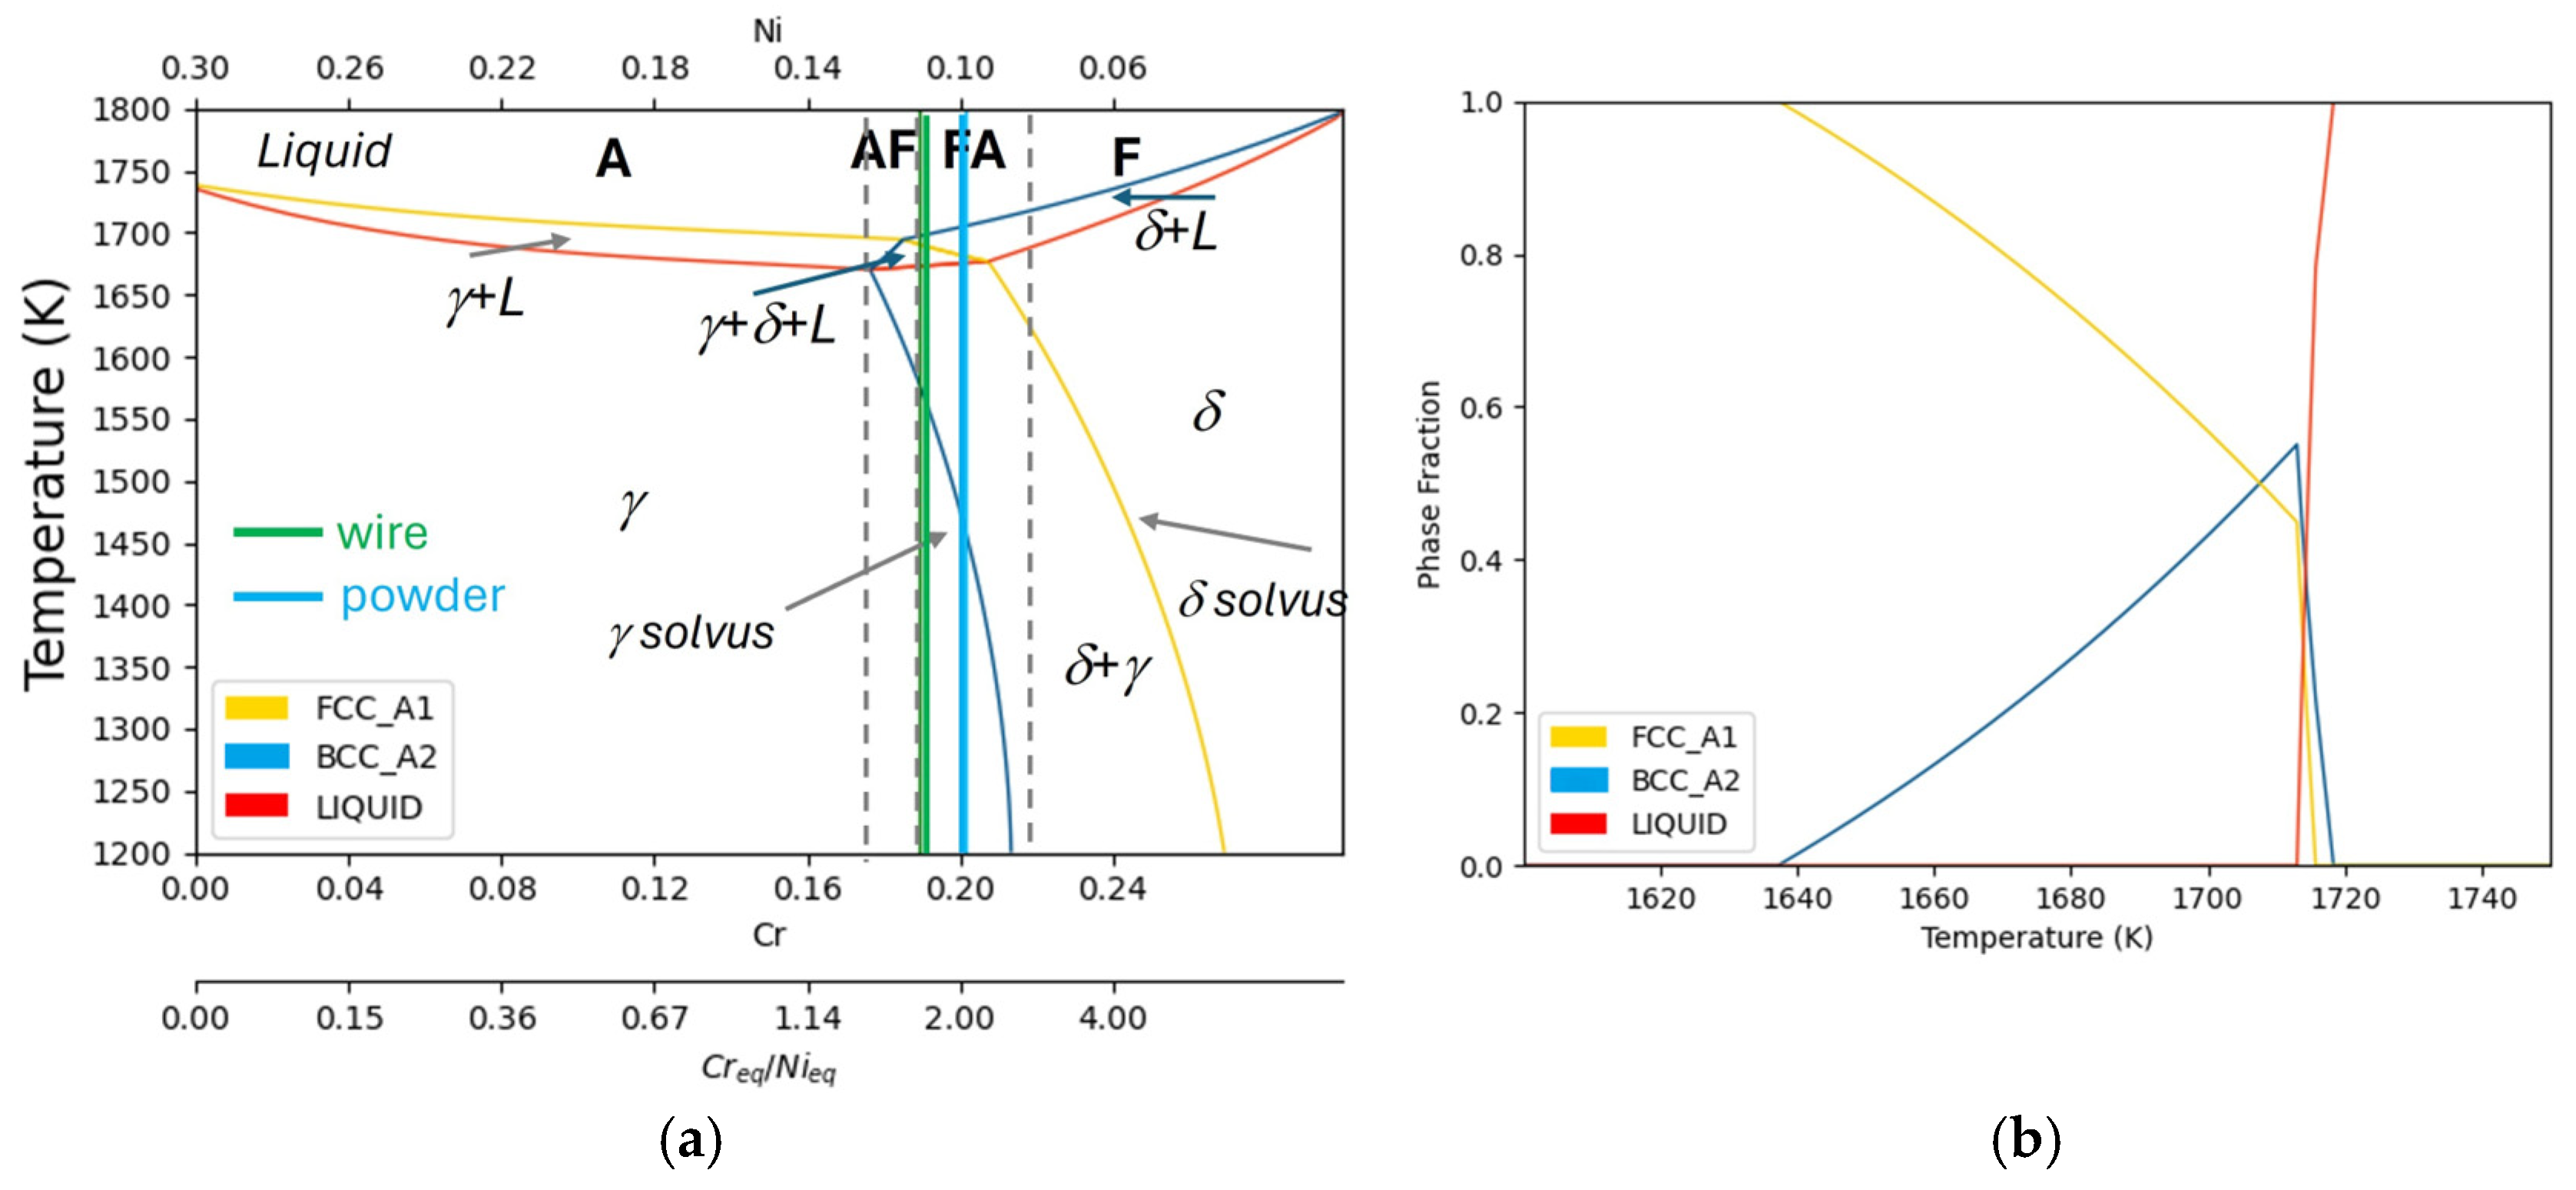
The solidification microstructure observed in this work is consistent with the T-C section of Cr-Fe-Ni phase diagram plotted in (
Figure 8a) for a nominal 70 wt.% Fe content. This diagram maps the thermodynamically stable phase regions—liquid (L), austenite (γ), ferrite (δ), and their two-phase fields—as a function of temperature and the chromium-to-nickel equivalent ratio (Cr
eq/Ni
eq), where Cr
eq = %Cr + %Mo + 1.5 × %Si and Ni
eq = %Ni + 30 × %C + 0.5 × %Mn. The vertical bands on this diagram indicate the possible solidification sequence upon cooling. Four distinct solidification modes are identified: austenitic (A, where L → γ), austenitic-ferritic (AF, L → γ → γ + δ), ferritic-austenitic (FA, L → δ → δ + γ), and ferritic (F, L → δ). Based on the calculated Cr
eq/Ni
eq ratio, the nominal composition of standard AISI 316L falls within the FA region of the Fe–Cr–Ni pseudo-binary diagram. Under these conditions, solidification begins with primary δ-ferrite, followed by the formation of austenite (γ) upon further cooling. This sequence is consistent with the CALPHAD-based equilibrium calculations (
Figure 8), which predict an initial increase in δ-ferrite fraction followed by the growth of γ until both phases reach comparable fractions. Further cooling through the δ + γ two-phase field results in progressive transformation of δ-ferrite to austenite, yielding a predominantly austenitic microstructure with a limited fraction of retained δ-ferrite at room temperature. Both feedstocks are thus expected to solidify according to the FA mode, consistent with the mainly austenitic matrix observed experimentally.
Some of the microstructural differences observed after solidification, such as the formation of δ-ferrite in the LP-DED material, can be related to the compositional variation between the two feedstocks, especially the higher silicon content of the powder. The LP-DED powder exhibits a higher silicon content, leading to an increased Cr
eq/Ni
eq ratio of approximately 1.9, compared to 1.6 for the wire feedstock. This shifts the powder-derived material closer to the FA–F boundary on the pseudobinary phase diagram (
Figure 8), where δ-ferrite formation is thermodynamically favored. However, the equilibrium diagram alone provides an incomplete description of solidification under the rapid cooling conditions characteristic of L-DED. The extremely high cooling rates inherent to these processes can lead to significant deviations from equilibrium, particularly in terms of solute partitioning and phase retention.
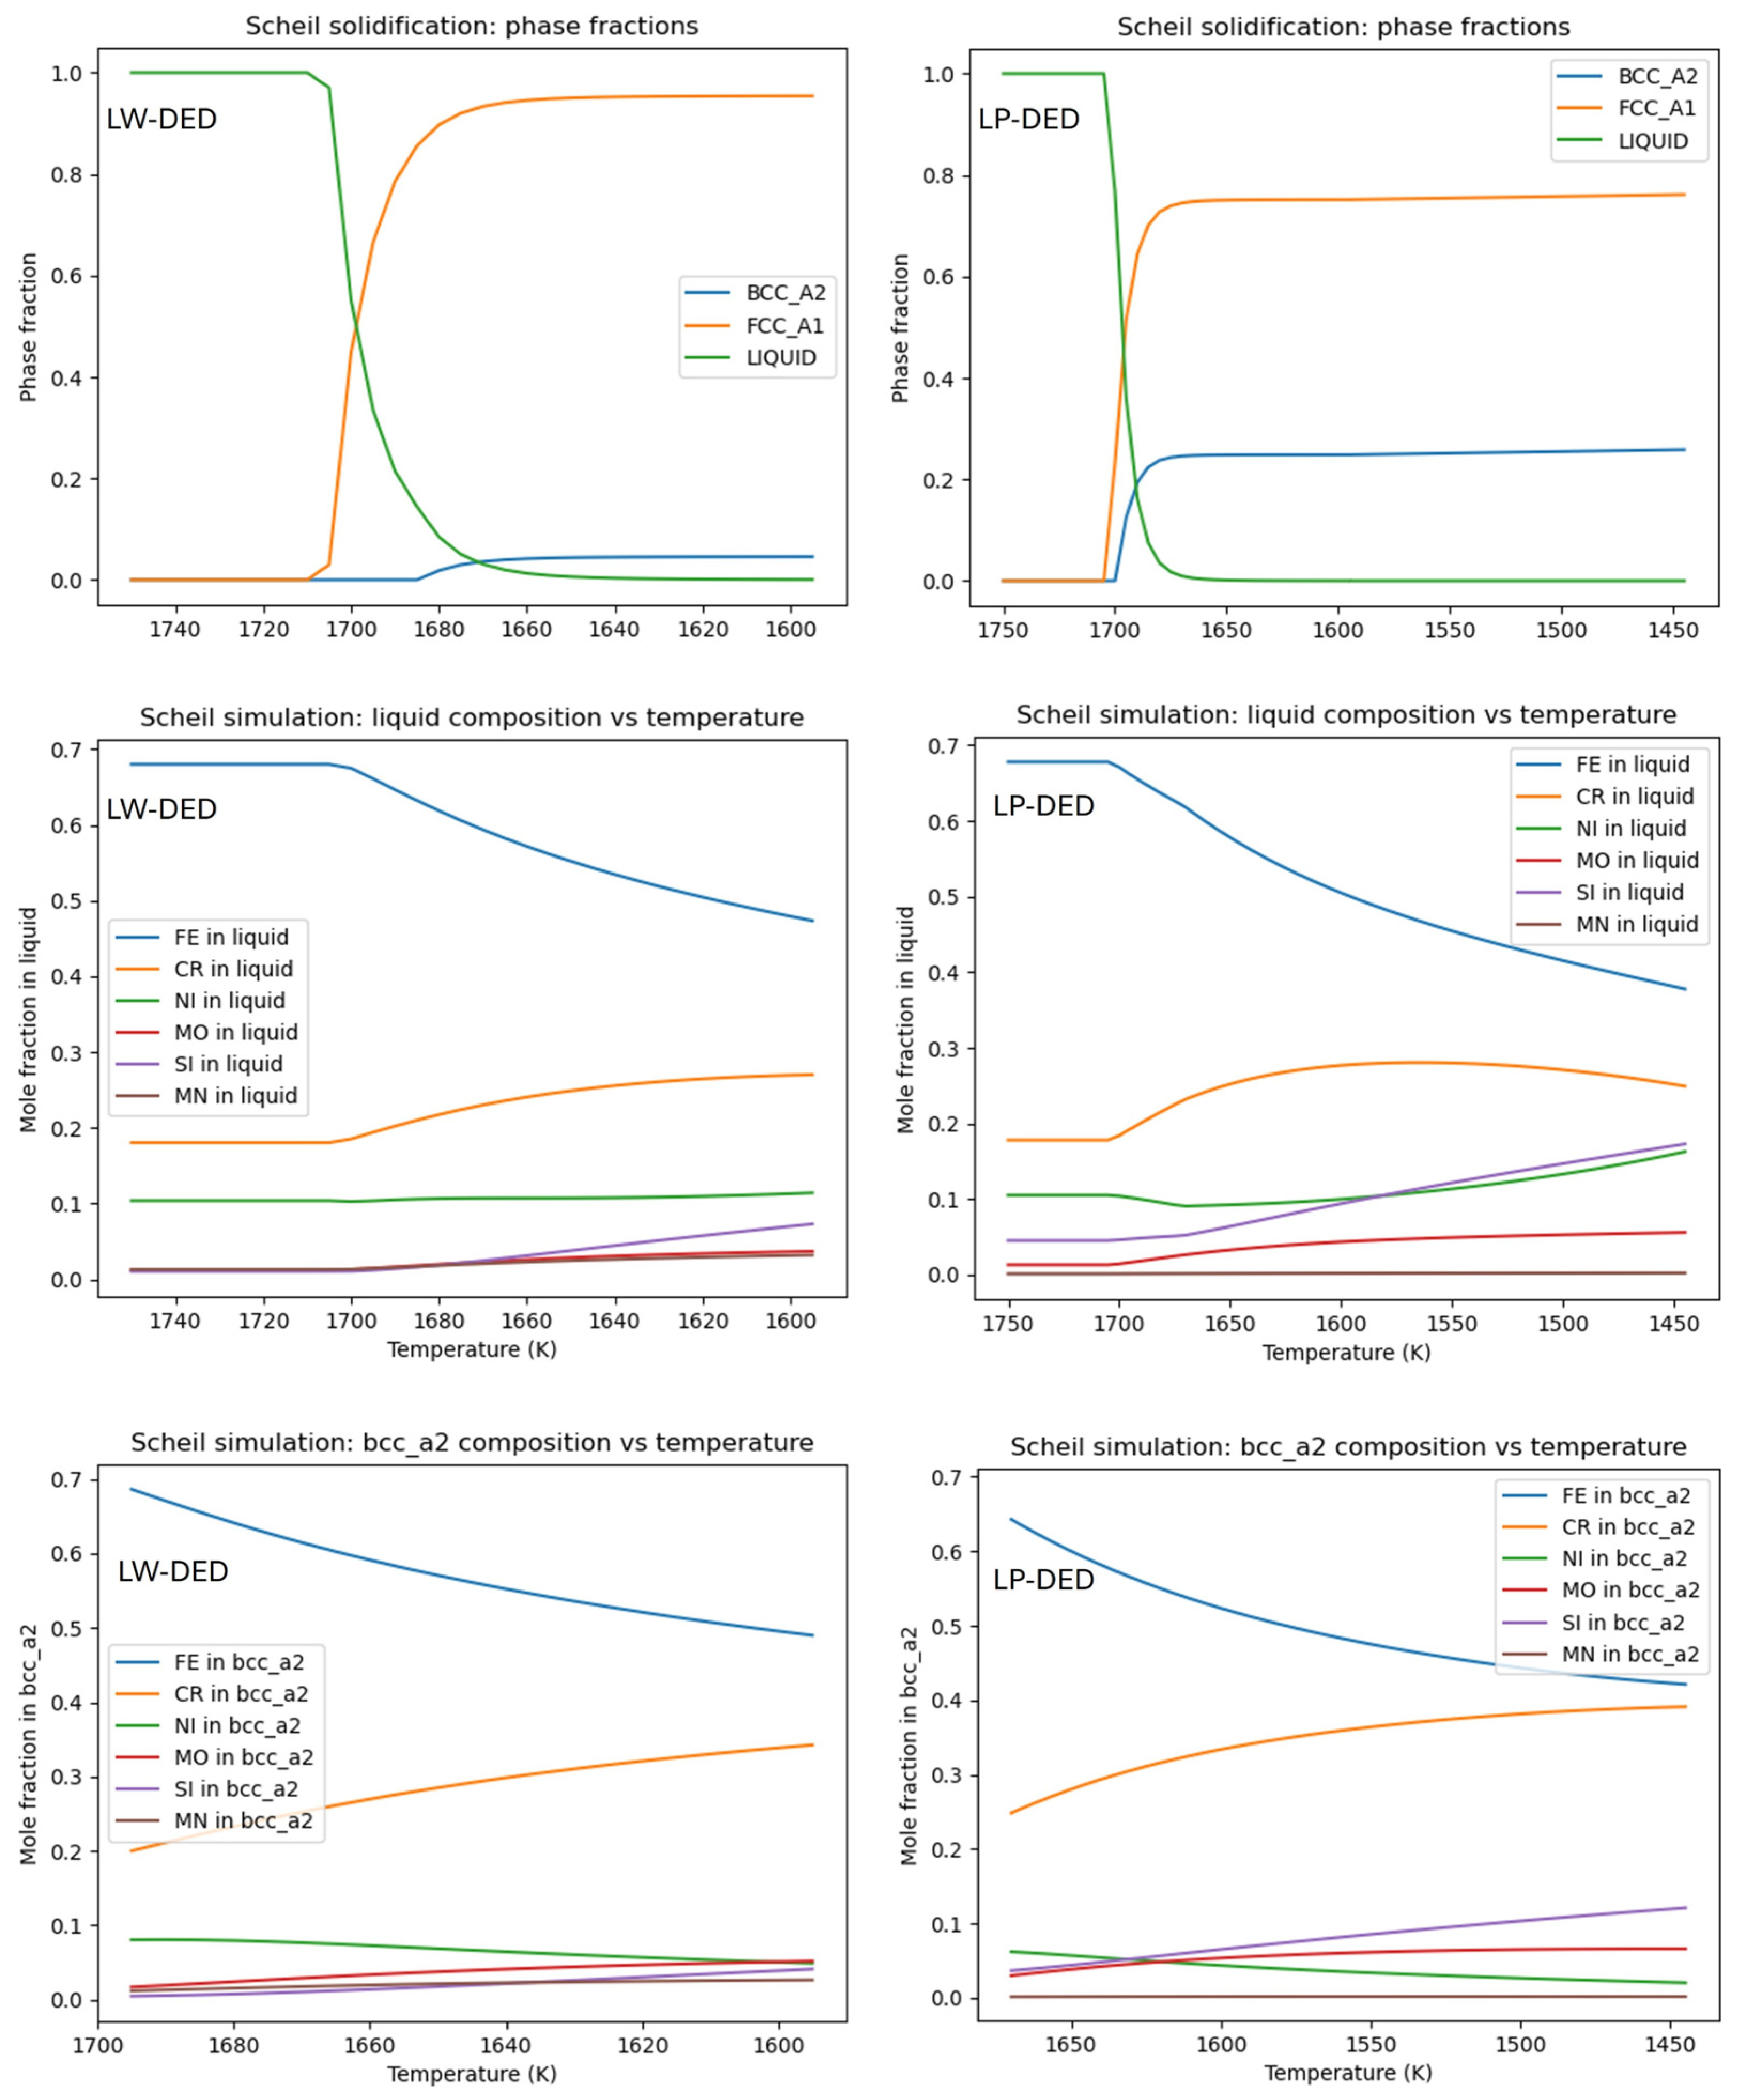
To better understand the solidification behavior of the two feedstocks, Scheil-Gulliver solidification simulations were performed. This model assumes complete mixing in the liquid, no diffusion in the solid, and local equilibrium at the solid–liquid interface, offering a more realistic approximation of non-equilibrium solidification than the lever rule. The simulations were carried out using the nominal compositions of the wire and powder feedstocks within a thermodynamic database for the Fe–Cr–Ni system. The results are presented in (
Figure 9), which shows the evolution of phase fraction liquid composition as a function of temperature during solidification.
For both materials, solidification begins with the formation of primary austenite (γ) at approximately 1700 K (
Figure 9 top), which is consistent with the liquidus temperature of AISI 316L. However, the solidification interval differs markedly between the two compositions. In the LW-DED alloy, solidification is essentially complete by around 1600 K, with only a minor amount of δ-ferrite forming in the final stages. In contrast, the LP-DED alloy exhibits a wider solidification range, extending down to approximately 1450 K, and predicts a significantly higher fraction of δ-ferrite. This broader interval reflects the more pronounced partitioning behavior induced by the higher silicon content of the powder feedstock. Silicon is rejected by the growing austenite, accumulating in the interdendritic liquid and delaying complete solidification.
The evolution of the liquid composition during solidification shown in the middle section of the same figure provides a direct view of solute redistribution. In the LW-DED alloy, moderate enrichment of Cr, Mo and Si is observed in the residual liquid. The same elements also segregate in the LP-DED alloy, but the effect is considerably more pronounced, particularly for Si. This confirms that silicon, as a potent ferrite stabilizer, is strongly rejected by the growing austenite and accumulates in the interdendritic liquid. The higher silicon content of the powder therefore amplifies the chemical driving force for δ-ferrite formation.
Finally, the composition of the δ-ferrite phase itself during its formation is shown at the bottom of (
Figure 9). While the Cr, Mo and Ni contents in the ferrite are broadly similar between the two alloys, in the LP-DED material, the ferrite is systematically enriched in silicon compared to that in the LW-DED material.
This higher Si content may contribute not only to the stabilization of the ferrite at lower temperatures but also influence its final morphology. The relationship between composition, cooling rate and ferrite morphology is well-documented in the literature [
16,
20,
21]. Within the FA solidification mode, which applies to both materials, two main ferrite morphologies are commonly observed depending on the exact Cr
eq/Ni
eq ratio and the local cooling conditions.
For materials with Creq/Nieq ratios in the lower to middle range of the FA mode, such as the LW-DED alloy with its ratio of approximately 1.6, ferrite typically adopts a skeletal (or vermicular) morphology. This appears as a continuous, interconnected network along the interdendritic boundaries and is characteristic of solidification where diffusion plays a more significant role in shaping the final microstructure.
As the Creq/Nieq ratio increases towards the upper boundary of the FA mode—as is the case for the LP-DED alloy with its ratio of approximately 1.9—and particularly when combined with higher cooling rates, the ferrite morphology shifts towards lathy. This elongated, plate-like structure, often arranged in parallel arrays and is associated with higher solidification velocities. Under these conditions, the austenite that forms from the primary ferrite does so with a different crystallographic orientation which gives the ferrite its characteristic lathy appearance. The higher cooling rate experienced by the LP-DED process therefore acts in concert with its more ferritizing composition to promote this morphology.
The observations from the present work are fully consistent with this framework. The LP-DED sample, with its higher Creq/Nieq ratio and faster cooling rate, exhibits a clear predominance of lathy ferrite. The LW-DED sample, with its lower Creq/Nieq and slower cooling, shows mostly skeletal ferrite. Taken together, the simulations indicate that the higher cooling rate of the LP-DED process acts in concert with its more ferritizing composition. The combination of a wider solidification interval, segregation of Cr, Mo and Si, and greater enrichment of Si in the δ-ferrite provides a consistent explanation for the larger fraction of retained ferrite and the predominance of the lathy morphology observed experimentally in the powder-deposited material.
The microhardness measurements reveal a consistent difference between the two deposition conditions. The LP-DED sample exhibits an average hardness of 226 ± 8 HV, while the LW-DED sample averages 206 ± 10 HV. Importantly, for both materials the hardness values were found to be relatively uniform across the deposited walls, with no significant gradients observed along the build direction or across the sample width (
Figure 7). This homogeneity indicates stable thermal conditions throughout the deposition process and suggests that the microstructural features discussed earlier are evenly distributed. The approximately 20 HV difference between the two samples can be attributed to two main factors previously discussed. First, the finer dendritic structure of the LP-DED material (smaller PDAS ≈ 3.29 µm) provides a greater density of barriers to dislocation motion compared to the coarser structure of the LW-DED sample (PDAS ≈ 5.15 µm), increasing hardness through a Hall–Petch-type mechanism. Second, the predominance of lathy ferrite in the LP-DED sample contributes to its higher hardness. Studies have reported that lathy ferrite tends to be harder than vermicular or skeletal morphologies [
16], likely due to greater solute enrichment and different interface characteristics. The EDS measurements (
Table 4) confirm this enrichment, particularly for Si, in the LP-DED ferrite, supporting this interpretation.





 ,
,