Article

Determining Material Characteristics for Finite Element Simulations of Plastic Forming of the EN AW-7075 Aluminum Alloy


1
Łukasiewicz Research Network—Institute of Non-Ferrous Metals, 44-100 Gliwice, Poland
2
Faculty of Non Ferrous Metals, AGH University of Science and Technology in Krakow, 30-059 Kraków, Poland
*
Author to whom correspondence should be addressed.
Metals 2026, 16(2), 219; https://doi.org/10.3390/met16020219
Submission received: 12 January 2026 / Revised: 2 February 2026 / Accepted: 10 February 2026 / Published: 14 February 2026
(This article belongs to the Section Computation and Simulation on Metals)

Abstract

FEM numerical analyses can be indicated as a common and basic tool used in the design of processes based on the plastic forming of metals. In such simulations, the accuracy of the results strongly depends on the quality of the material constitutive data used as the input. Good understanding of metals and their alloys’ deformation behavior, especially at hot working temperatures, is the key to developing or optimizing proper and economical processes. To provide reliable FEM simulation results, it is crucial to select an appropriate experimental method describing material behavior at elevated deformation temperatures. The most commonly method used for this is hot torsion tests, which can effectively provide a basis for developing constitutive models (for example, the Hensel–Spittel equation), but also produce the material constants needed to fully describe the behavior of the metal. This paper analyzes three experimental methods, compression testing, torsion testing, and spherical probe pressing, for determining material flow stress characteristics required for FEM simulations. The study focuses on the EN AW-7075 alloy, a high-strength aluminum alloy with limited hot workability. The methods were validated by comparing FEM predictions of extrusion force and profile temperature with results from industrial extrusion trials conducted on a 5 MN horizontal press.

1. Introduction

The widespread use of FEM-based software (Q-Form Extrusion v. 11.0.2 was used in this work) in metal-forming industries is undeniable. Many industrial plants have established technology development centers that rely on such tools due to their high accuracy and relatively short calculation times. However, a critical limitation of FEM remains in its dependence on accurate constitutive data describing material behavior at elevated temperatures and large deformations. For commonly used alloys, this is not a major problem, as commercial FEM software typically provides built-in databases. Yet, for high-strength aluminum alloys such as the 7XXX series, including EN AW-7075, the available data are limited and often insufficient. The situation becomes even more challenging when processes involve modified alloys (e.g., with increased contents of the main alloying elements), in which case the most reliable solution is often to develop new material data. Recent studies have also addressed the reliability of FEM predictions for 7XXX series alloys under hot forming conditions [1,2]. Moreover, EN AW-7075 exhibits strong pronounced temperature and strain rate-dependent behavior during hot deformation, which further complicates its accurate numerical description [3,4].
EN AW-7075 is widely recognized for its high strength-to-weight ratio, which makes it an attractive choice in aerospace, automotive, and defense applications. At the same time, its reduced plasticity in hot forming processes such as extrusion or forging poses serious challenges. Inaccurate or incomplete input data can lead to significant errors in predicting extrusion forces, temperature fields, and defect formation during simulations, particularly when calculations are aimed at high-efficiency processes involving high unit pressures and maximum possible strain rates. Reliable experimental characterization is therefore essential for developing accurate FEM material models [5,6,7,8,9,10].
Beyond classical constitutive modeling, recent research increasingly focuses on the integration of experimental data with advanced numerical approaches [11], including crystal plasticity FEM (CPFE) and hybrid FEM machine learning frameworks [8]. In such approaches, the accuracy of experimentally derived input parameters becomes even more critical, which further emphasizes the need for a systematic evaluation of the experimental techniques used for material characterization.
Several experimental techniques are currently used to obtain flow stress data as a function of strain, strain rate, temperature, and high-temperature material phenomena [11,12,13,14,15]. The three most widely adopted are as follows:
  • Compression test—Cylindrical specimens are compressed between flat plates. The method is simple, inexpensive, and requires only standard testing machines, which makes it the most accessible technique. However, friction at the plate–sample interface, even when lubricants and special sample geometries are applied, leads to non-uniform deformation. Another disadvantage is the fact that tests are usually performed at constant cross-head speed, which results in varying strain rates during the experiment. This phenomenon can significantly affect the results, typically when industry average values of strain rates are in use. Moreover, the maximum achievable strain is usually below one, which limits its applicability for alloys requiring larger deformation ranges. In the extrusion of EN AW-7075, for example, typical effective strains can vary from three to seven, well beyond the capacity of the compression test [16,17,18,19,20].
  • Tensile test—Specimens are elongated until fracture under uniaxial tension. This method provides accurate stress–strain data at low-to-moderate strains and is widely used to determine material strength and ductility. However, it does not adequately represent most forming processes, which are dominated by compressive and hydrostatic stress states (e.g., forging or extrusion). In addition, strain localization and necking occur in a relatively early state of the test, which limits the amount of usable flow stress data. Similar to compression testing, tensile tests are typically performed at a constant cross-head speed, resulting in variable strain rates during deformation, which further limits their applicability for hot forming simulations.
  • Torsion test—Cylindrical samples are twisted under controlled temperature and strain-rate conditions. This technique allows for large, uniform strains while eliminating most frictional effects, making it the benchmark method for hot deformation testing [5,6]. Nevertheless, torsion testing requires specialized plastometers, complex specimen preparation, and relatively high operational costs, which restrict its broader use in industrial laboratories. Comparative studies reported in the literature highlight both the advantages and limitations of torsion, compression, and other experimental methods used for hot deformation characterization [11,12].
Because none of these methods are free from limitations, the search for alternative experimental approaches continues. One promising concept is the spherical probe pressing test, in which a spherical indenter is pressed into a cylindrical specimen. This setup uses simple geometries and standard testing machines, which makes it highly suitable for industrial applications. However, frictional effects, variable strain rates, and limited achievable strains must be carefully considered when analyzing results. Comparative studies are therefore necessary to establish the reliability and practical applicability of this method relative to compression and torsion testing.
The present study analyzes and compares three experimental methods, compression testing, torsion testing, and spherical probe pressing, applied to the EN AW-7075 aluminum alloy. The objective is to evaluate the accuracy and limitations of each approach and to provide practical recommendations for their use in FEM simulations of hot plastic forming processes, with particular emphasis on industrial extrusion applications.

2. Materials and Methods

2.1. Material for Tests

The EN AW-7075 aluminum alloy was selected for testing as it is a commonly used “hard aluminum alloy” [14,15]. This alloy shows reduced plasticity in hot plastic processing such as forging or extrusion; therefore, it was chosen as a promising material for tests with a new method based on spherical probe pressing, which shows some limitations due to the relatively low range of deformation that can be achieved.
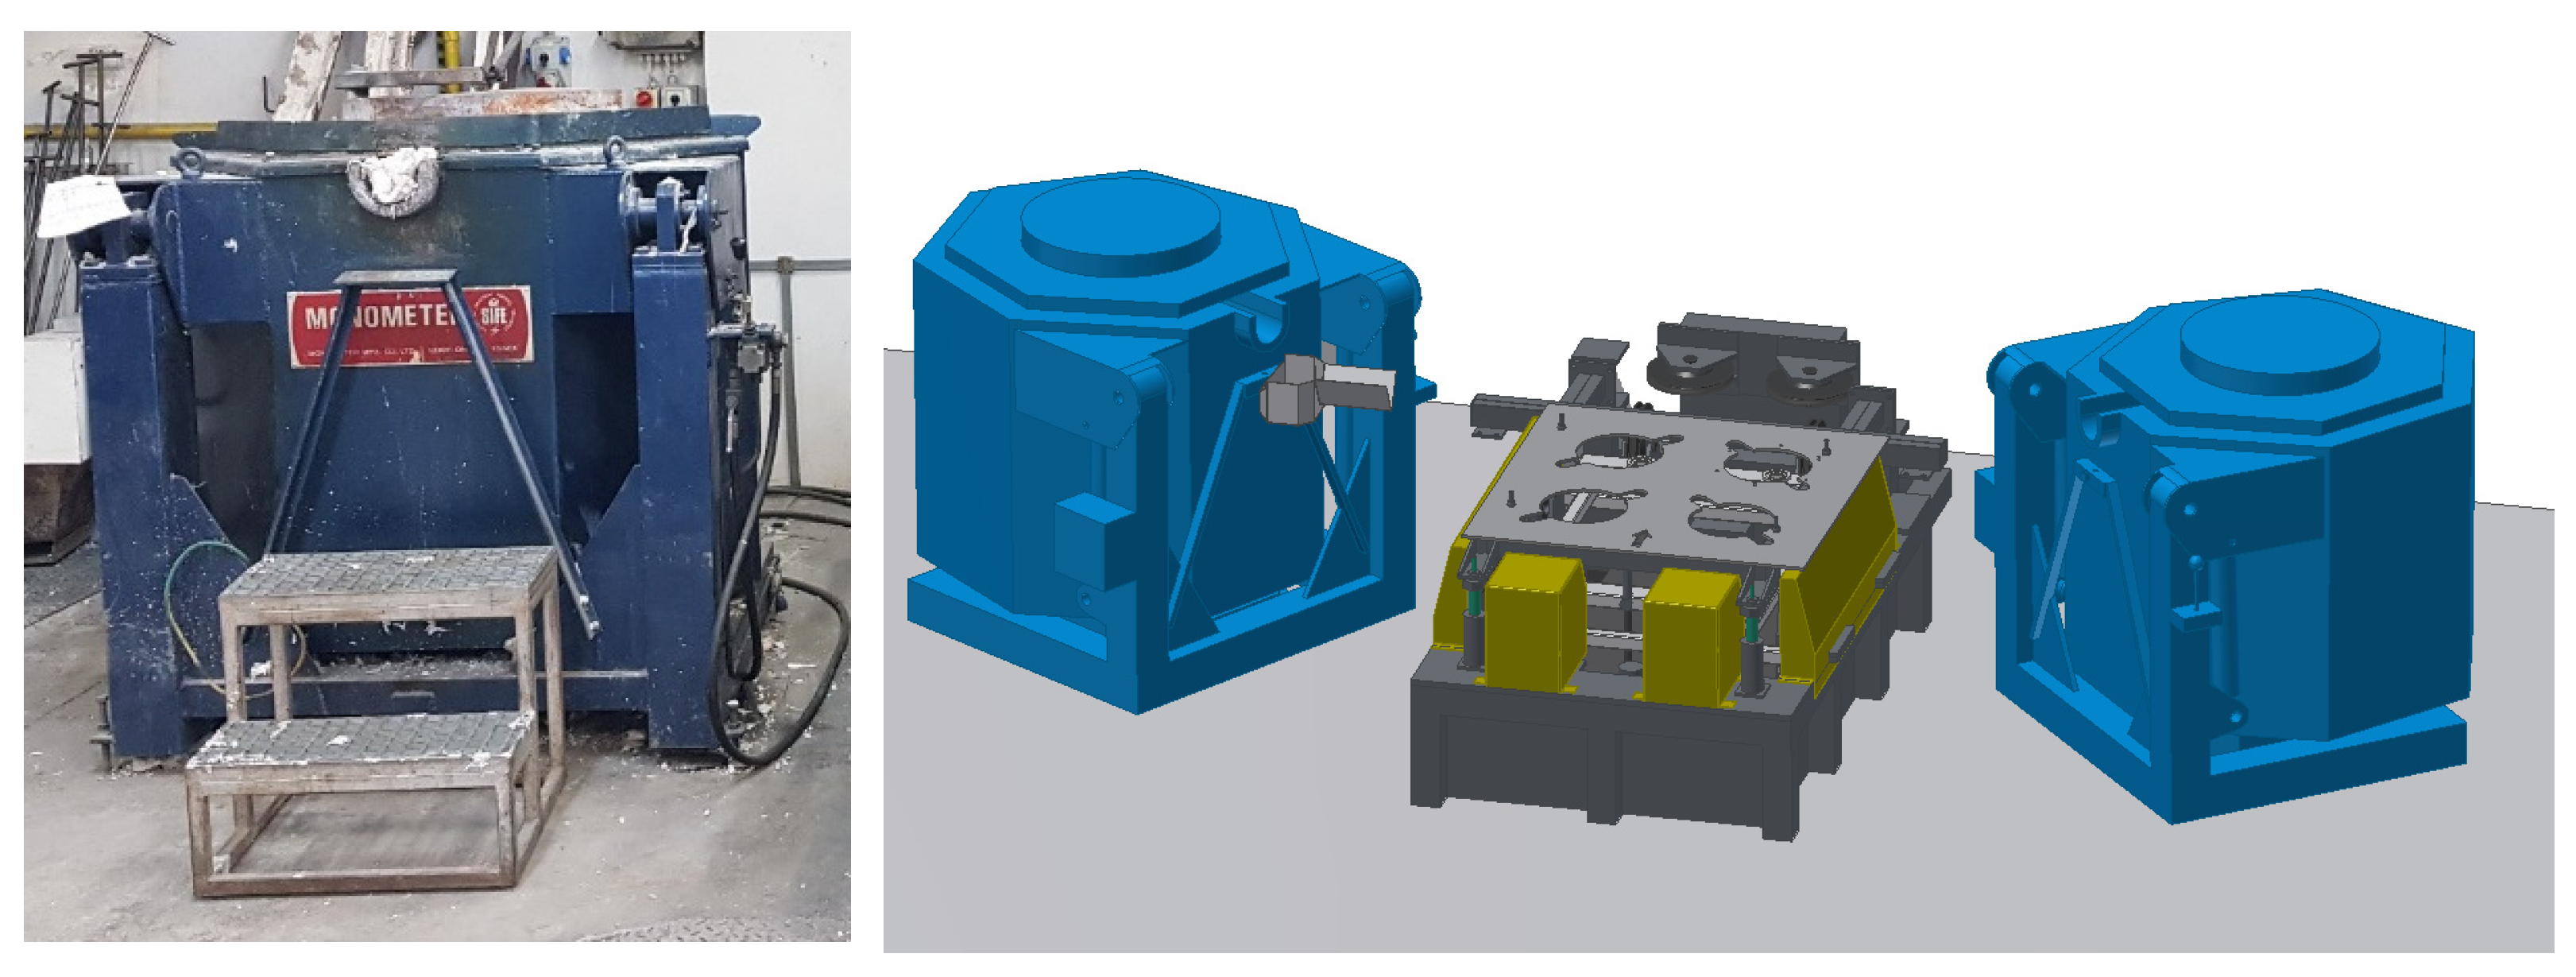
The experimental work started with the preparation of billets with a diameter of 102 mm for subsequent physical testing on a 5 MN horizontal extrusion press. The base alloy was melted in a Monometer resistance furnace (Monometer Holdings Ltd., Leigh-on-Sea, UK) with a capacity of 300 kg (Figure 1).
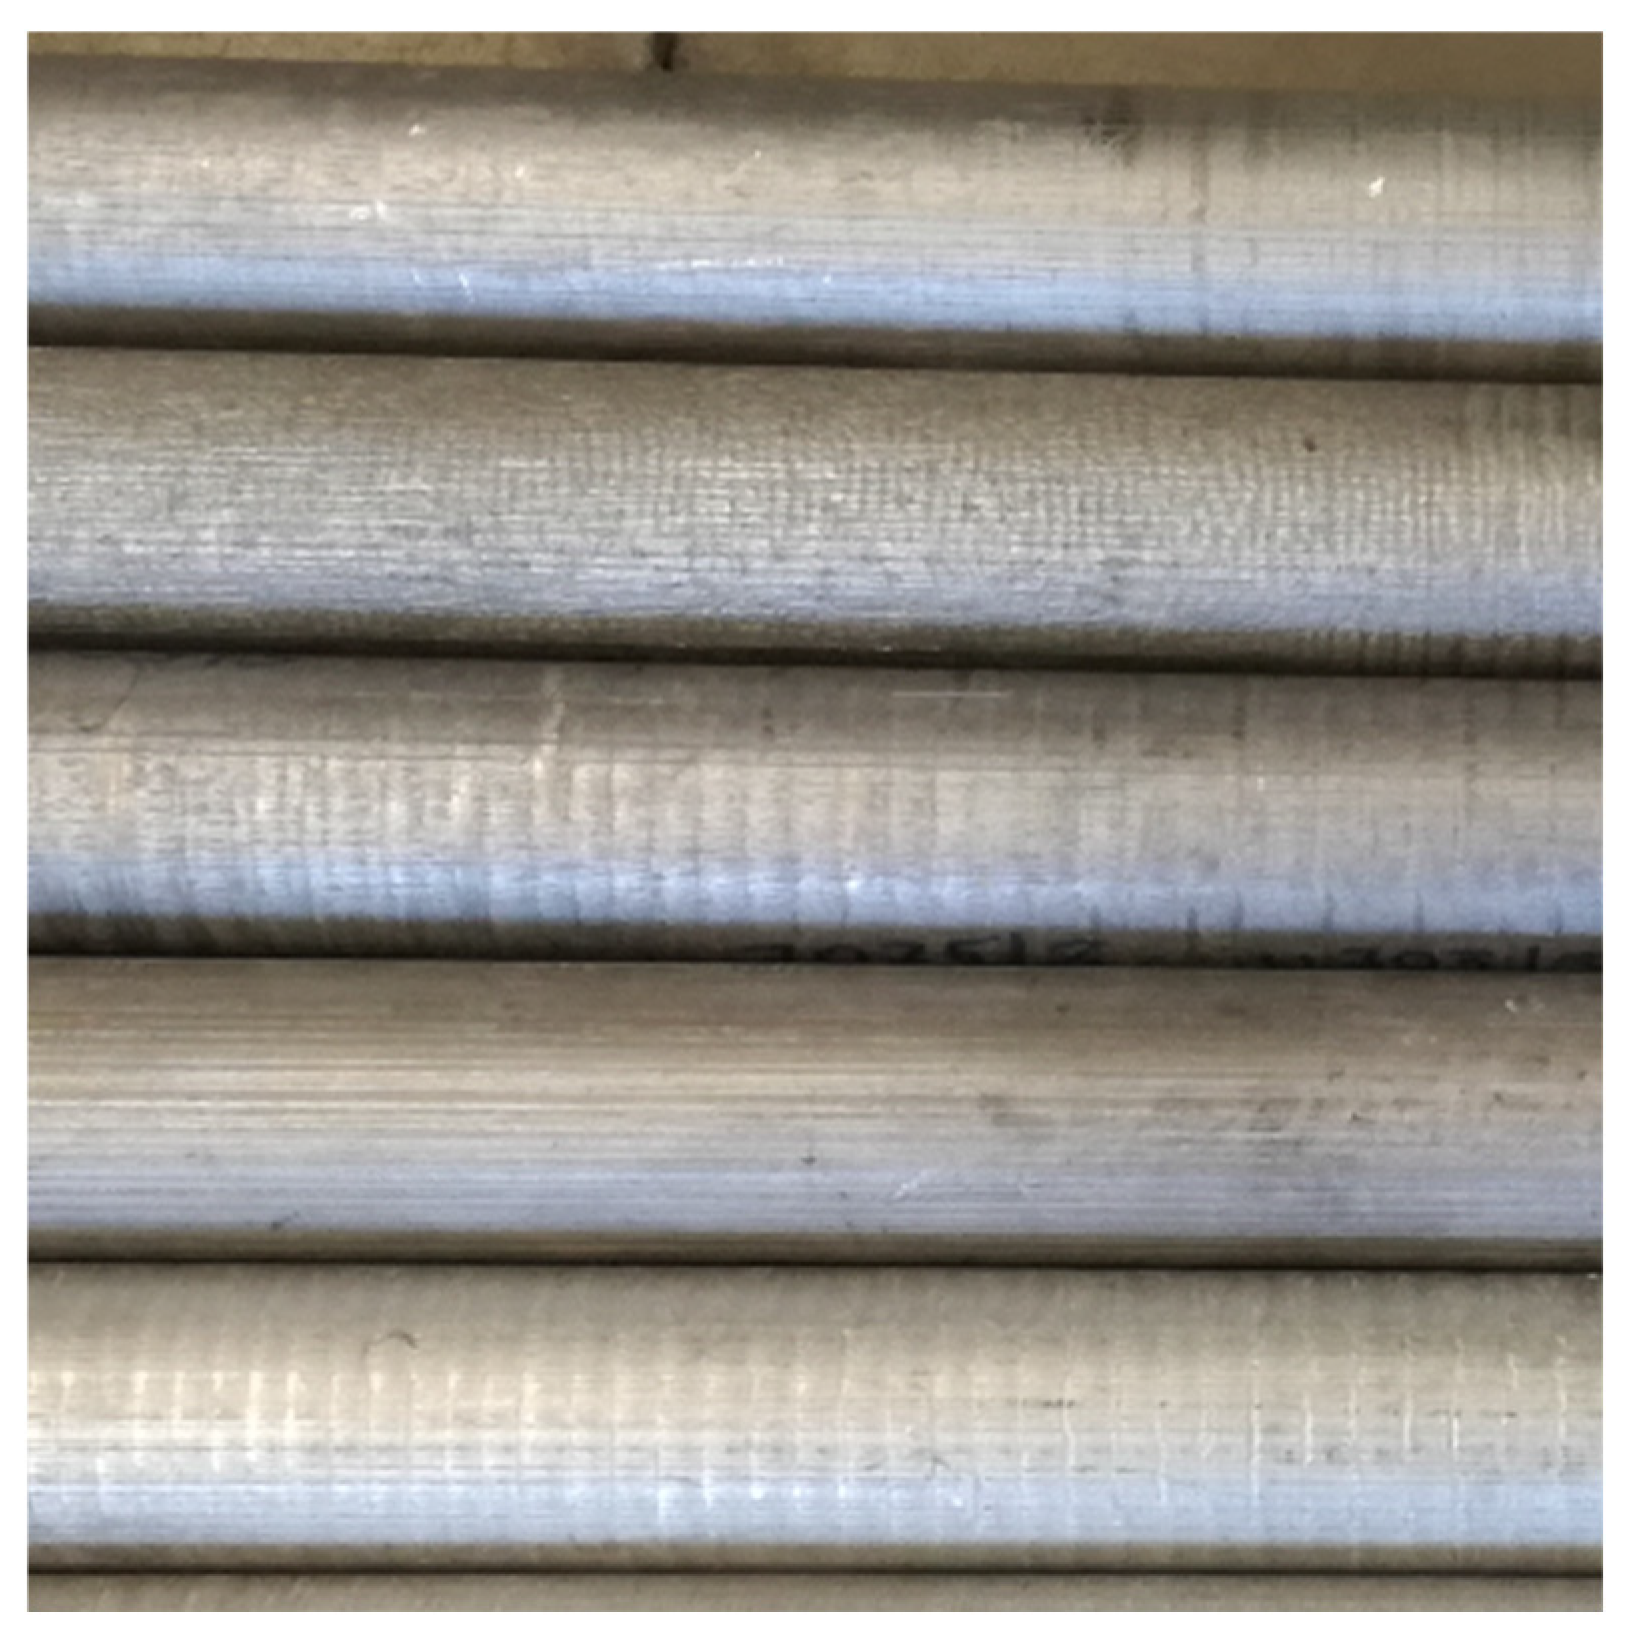
In order to remove non-metallic inclusions and dissolved gases, a refining process was carried out using a UR0 200 device (Łukasiewicz—Institute of Non-Ferrous Metals, Gliwice, Poland), with an argon flow rate of 10 L/min for 10 min. Prior to casting, grain refinement was performed by adding AlTi5B1 master alloy rods to the melt. Subsequently, samples were taken to determine the chemical composition of the alloy. Casting was carried out on a semi-continuous casting station using two Hot-Top crystallizers with continuous lubrication with a diameter of 102 mm. Photos of the billets are presented in Figure 2. Chemical composition is presented in Table 1.
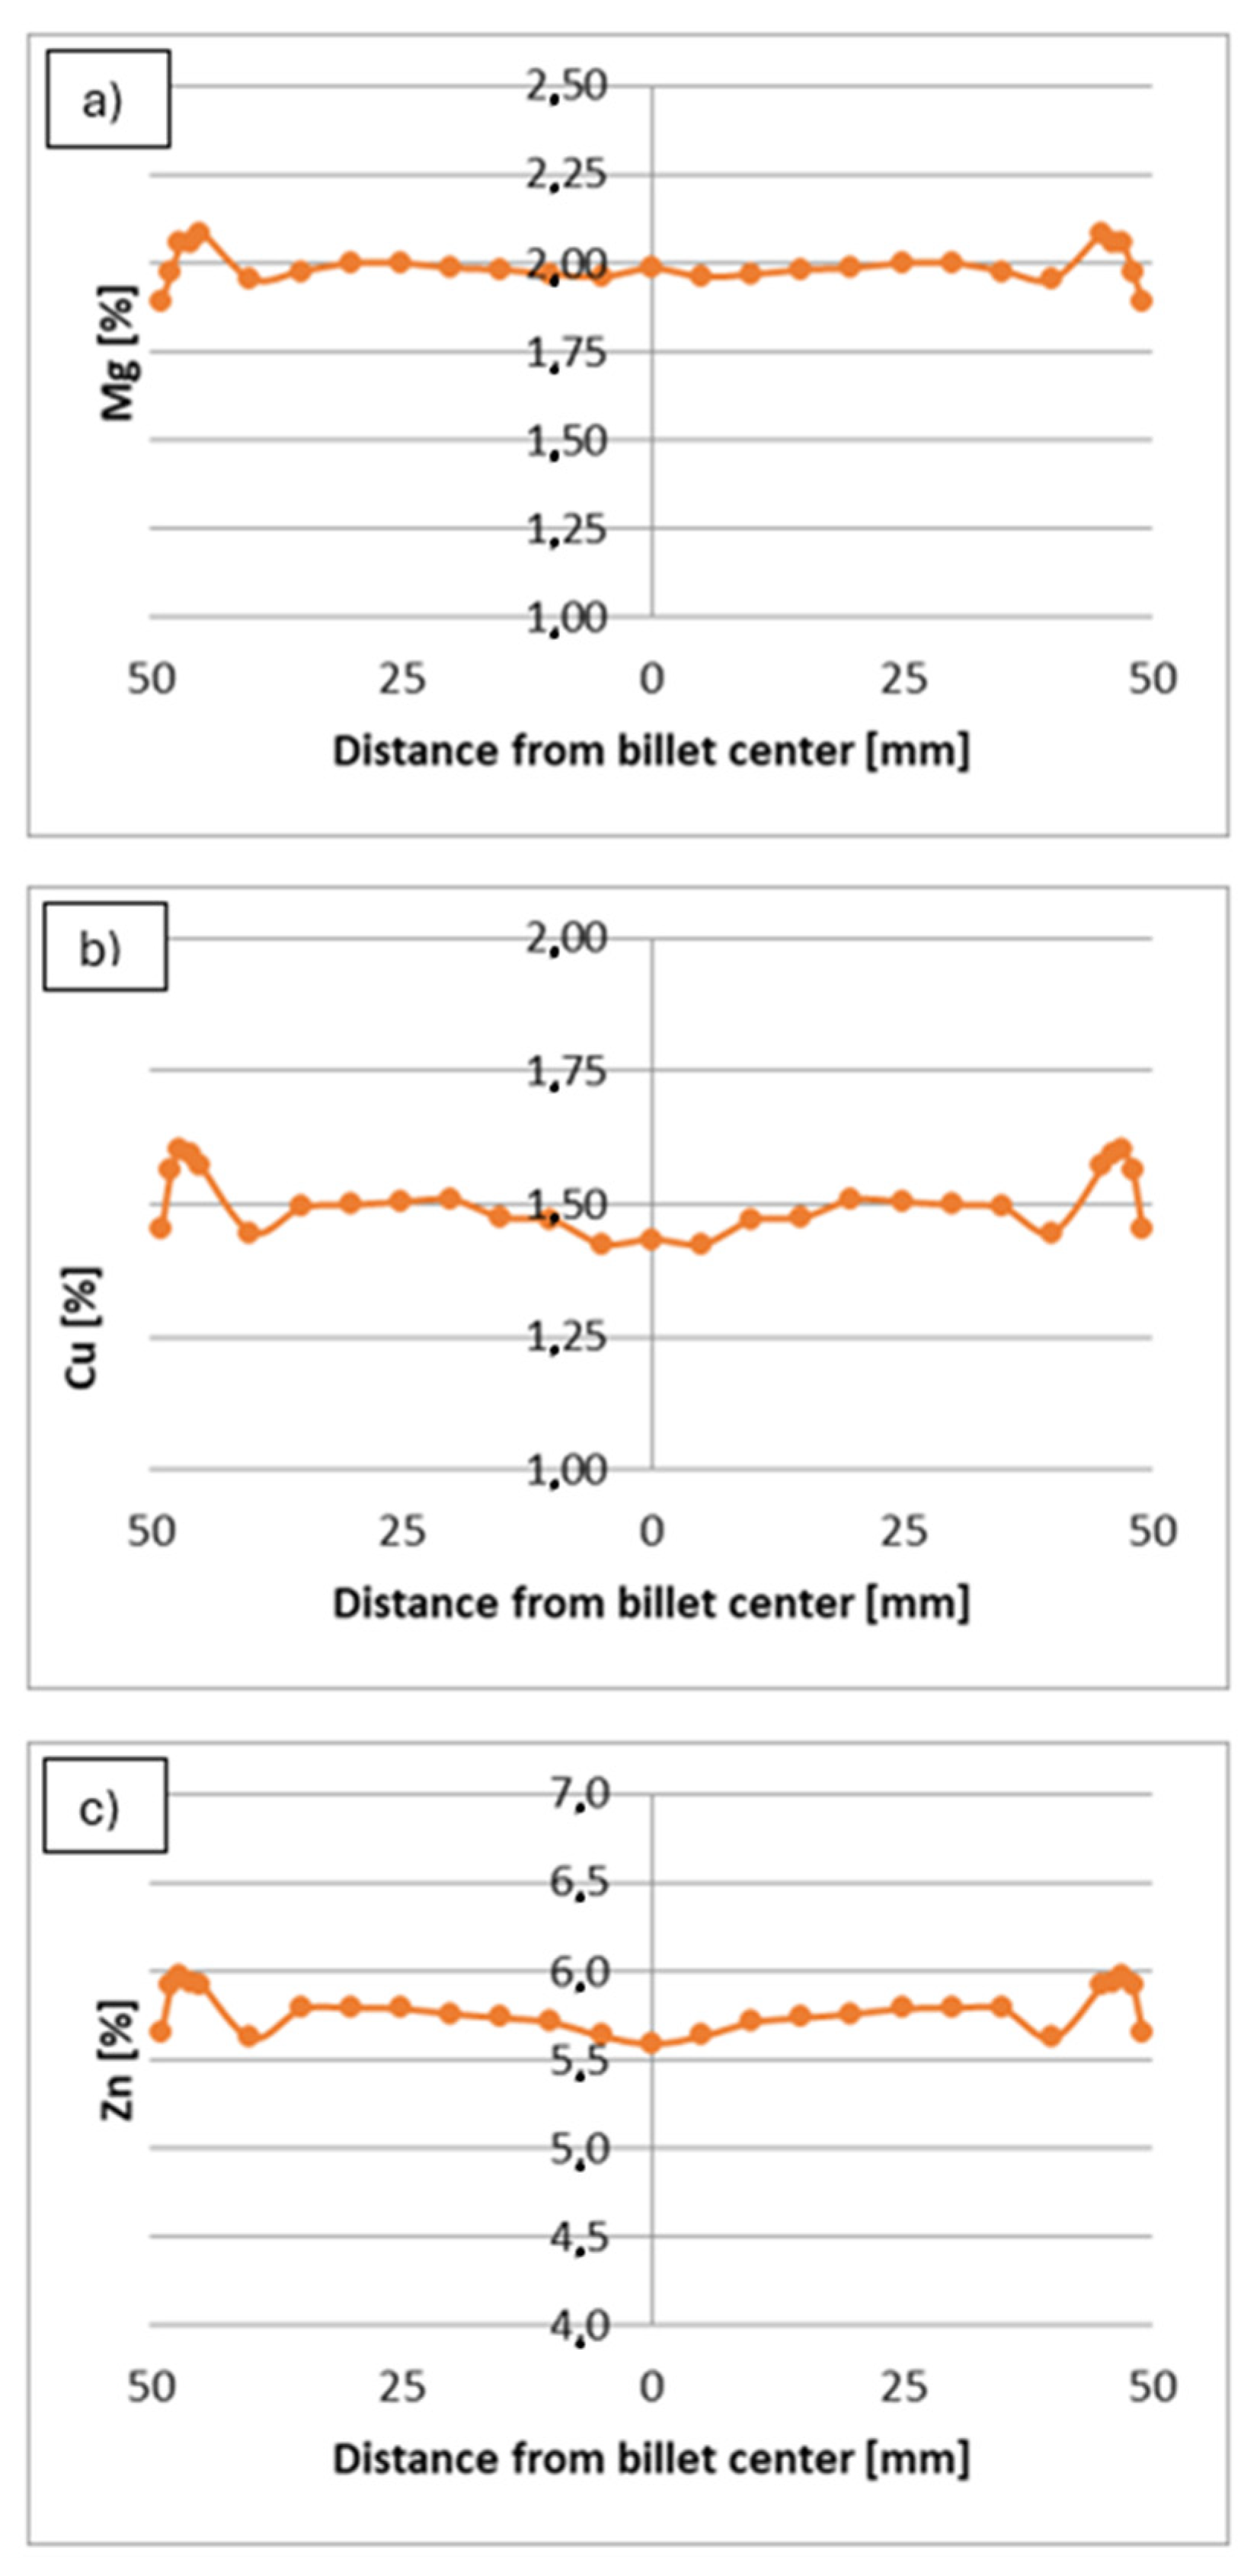
Analyzing the results of the distribution of chemical elements along the diameter of the billets, a phenomenon of slight segregation can be observed in the central zone. Also, in the edge zone, there are natural differences in the chemical composition with a thickness of up to 5 mm (Figure 3). The elemental distribution shown in Figure 3a is based on a single cross-sectional sample taken from the initial part of the billet and is intended to illustrate compositional homogeneity, whereas the chemical composition in Table 1 represents average values measured along the billet length.
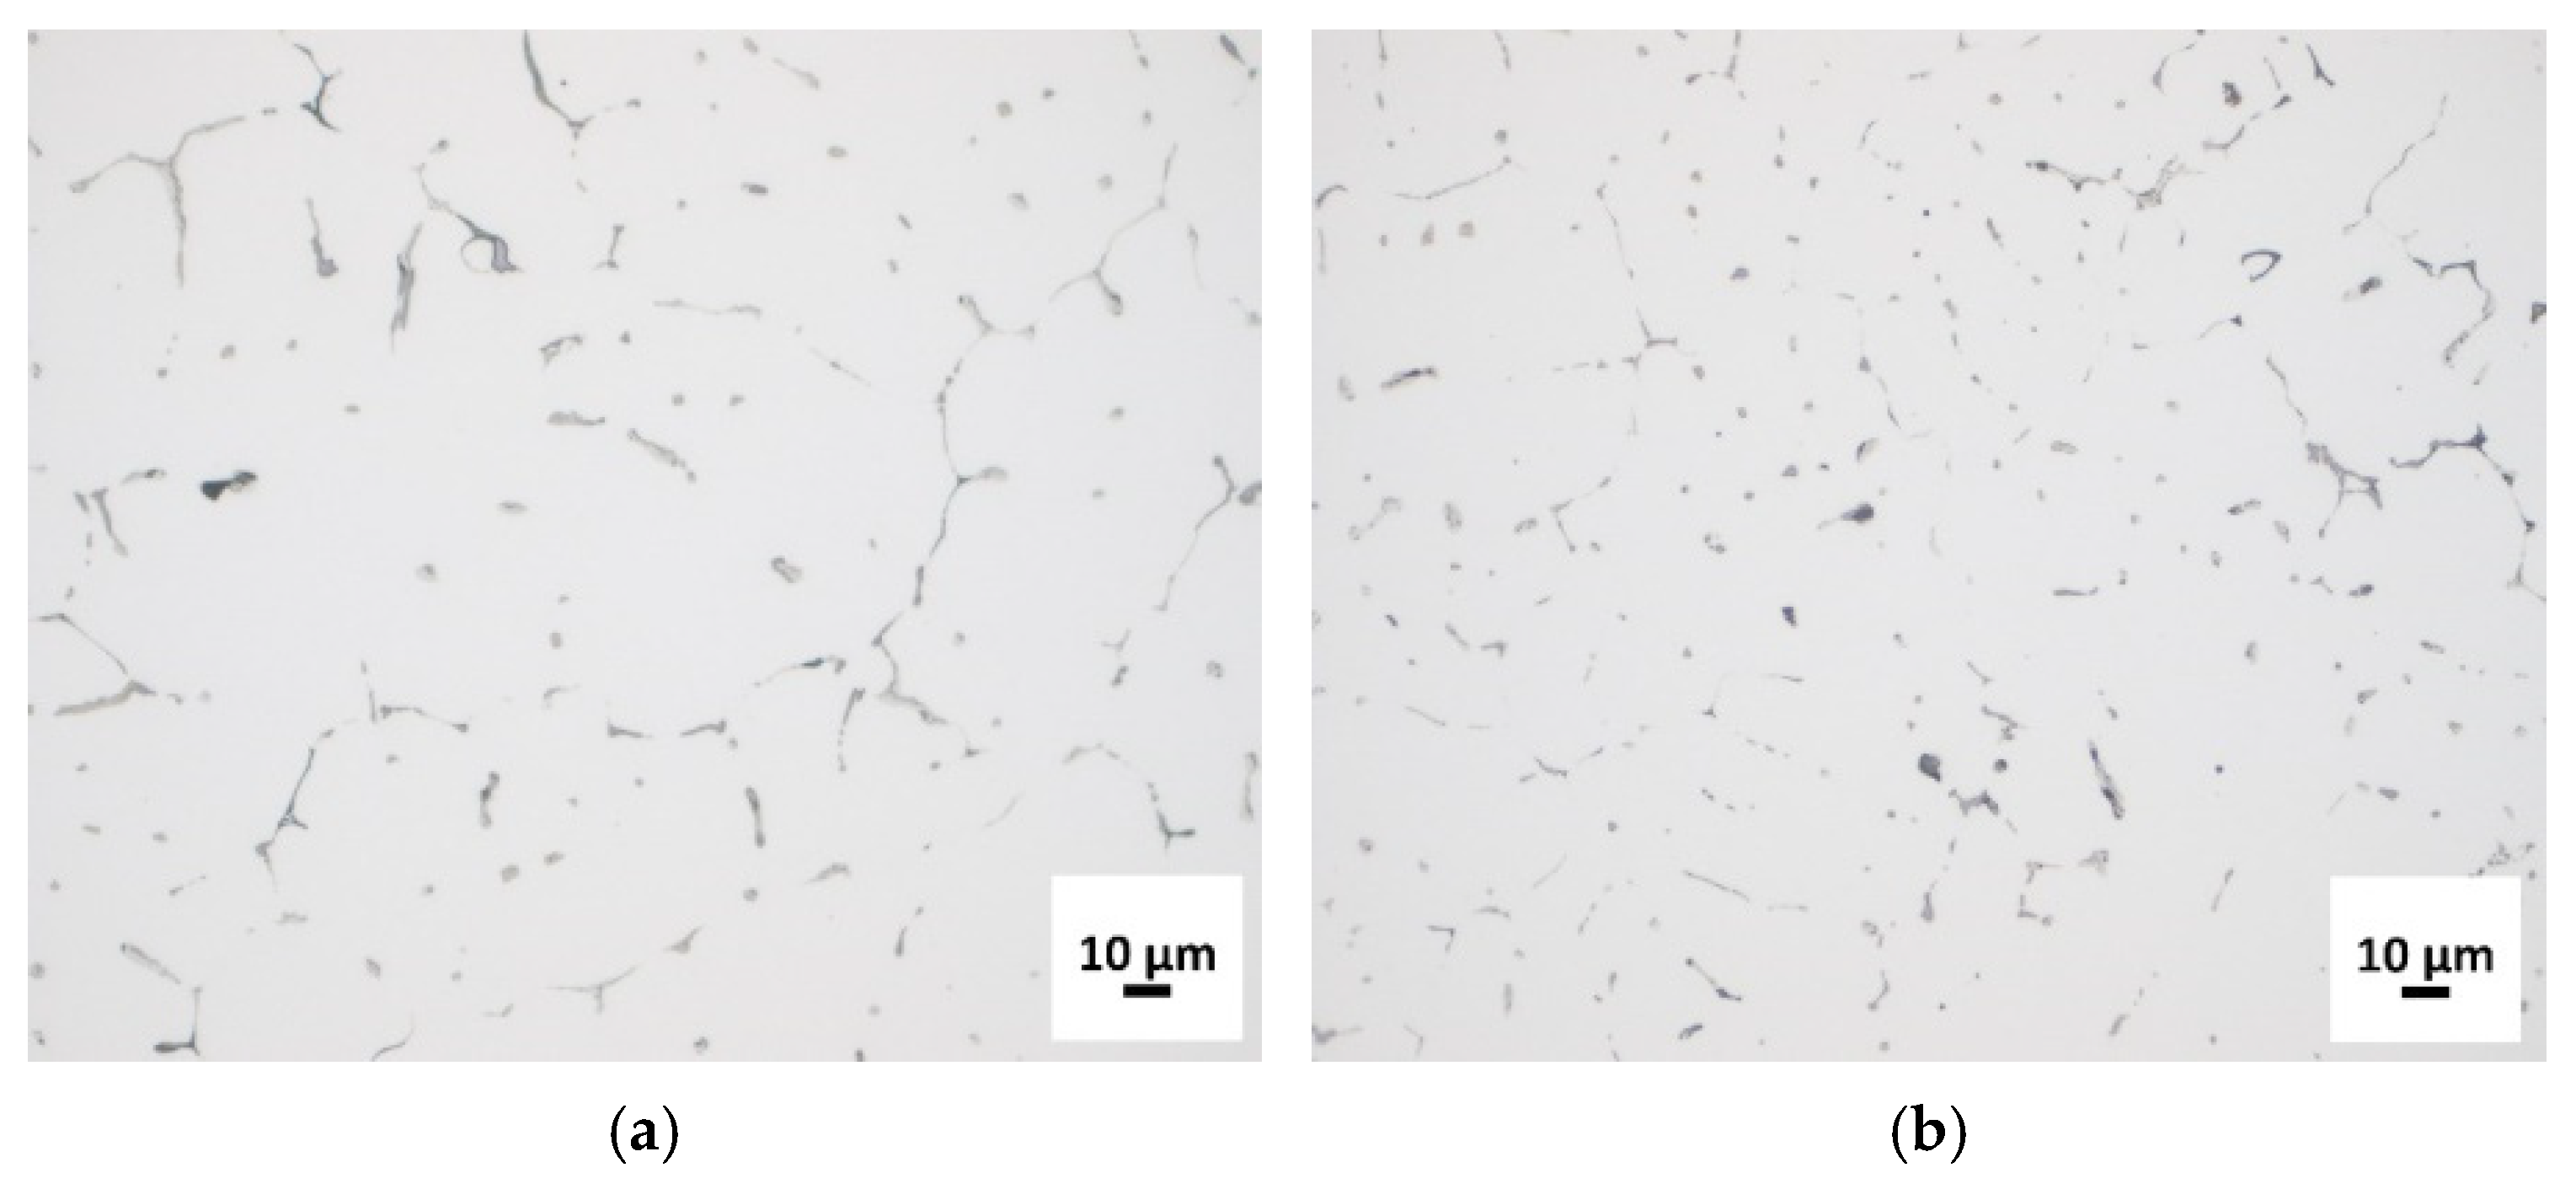
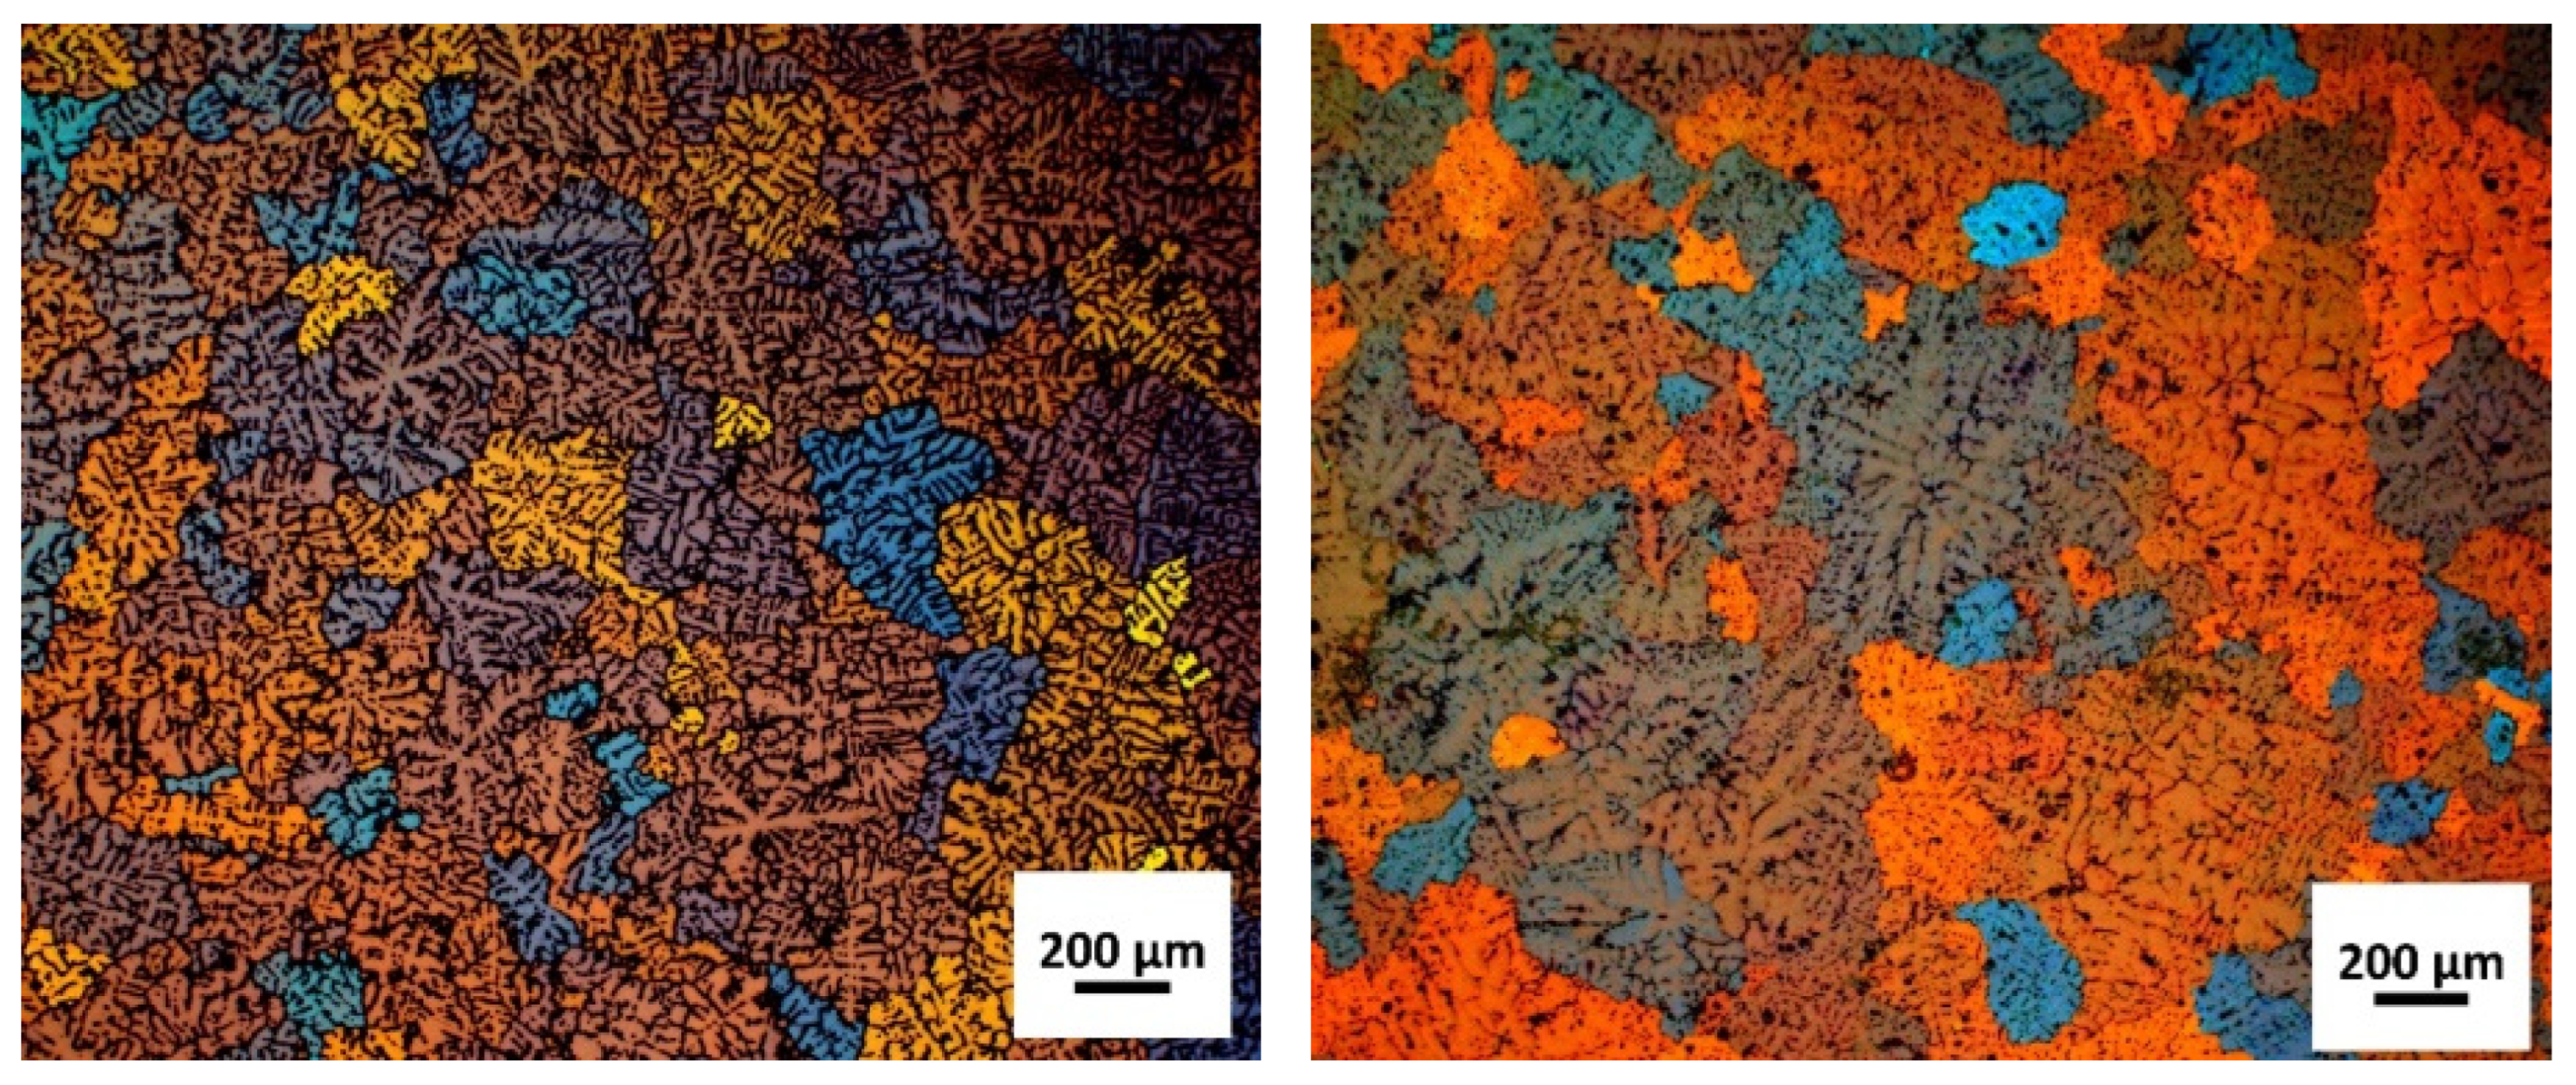
The alloys produced were subjected to metallographic analyses. For structural tests, 10 mm-thick templates (cross-sectional slices) were sectioned from the mid-length of each billet. Observations were carried out on a Zeiss Axio Observer optical microscope (Carl-Zeiss, Oberkochen, Germany). The subject of the analysis was both the microstructure and the grain structure, which were revealed using Barker etching. Figure 4 presents cross-section plane structures of the edge and center of the billets, and Figure 5 presents the grain structure of the tested materials. The analysis results confirm the fine, uniform structure without defects, typical of properly manufactured ingots, making them suitable for further tests. The quantitative grain size analysis was performed for the most representative region of the billet, located approximately at half of the billet radius, based on measurements taken from several locations within this zone. The average grain size after homogenization was 292.2 µm, with a standard deviation of 131.3 µm. The minimum and maximum measured grain sizes were 53.5 µm and 487.1 µm, respectively.
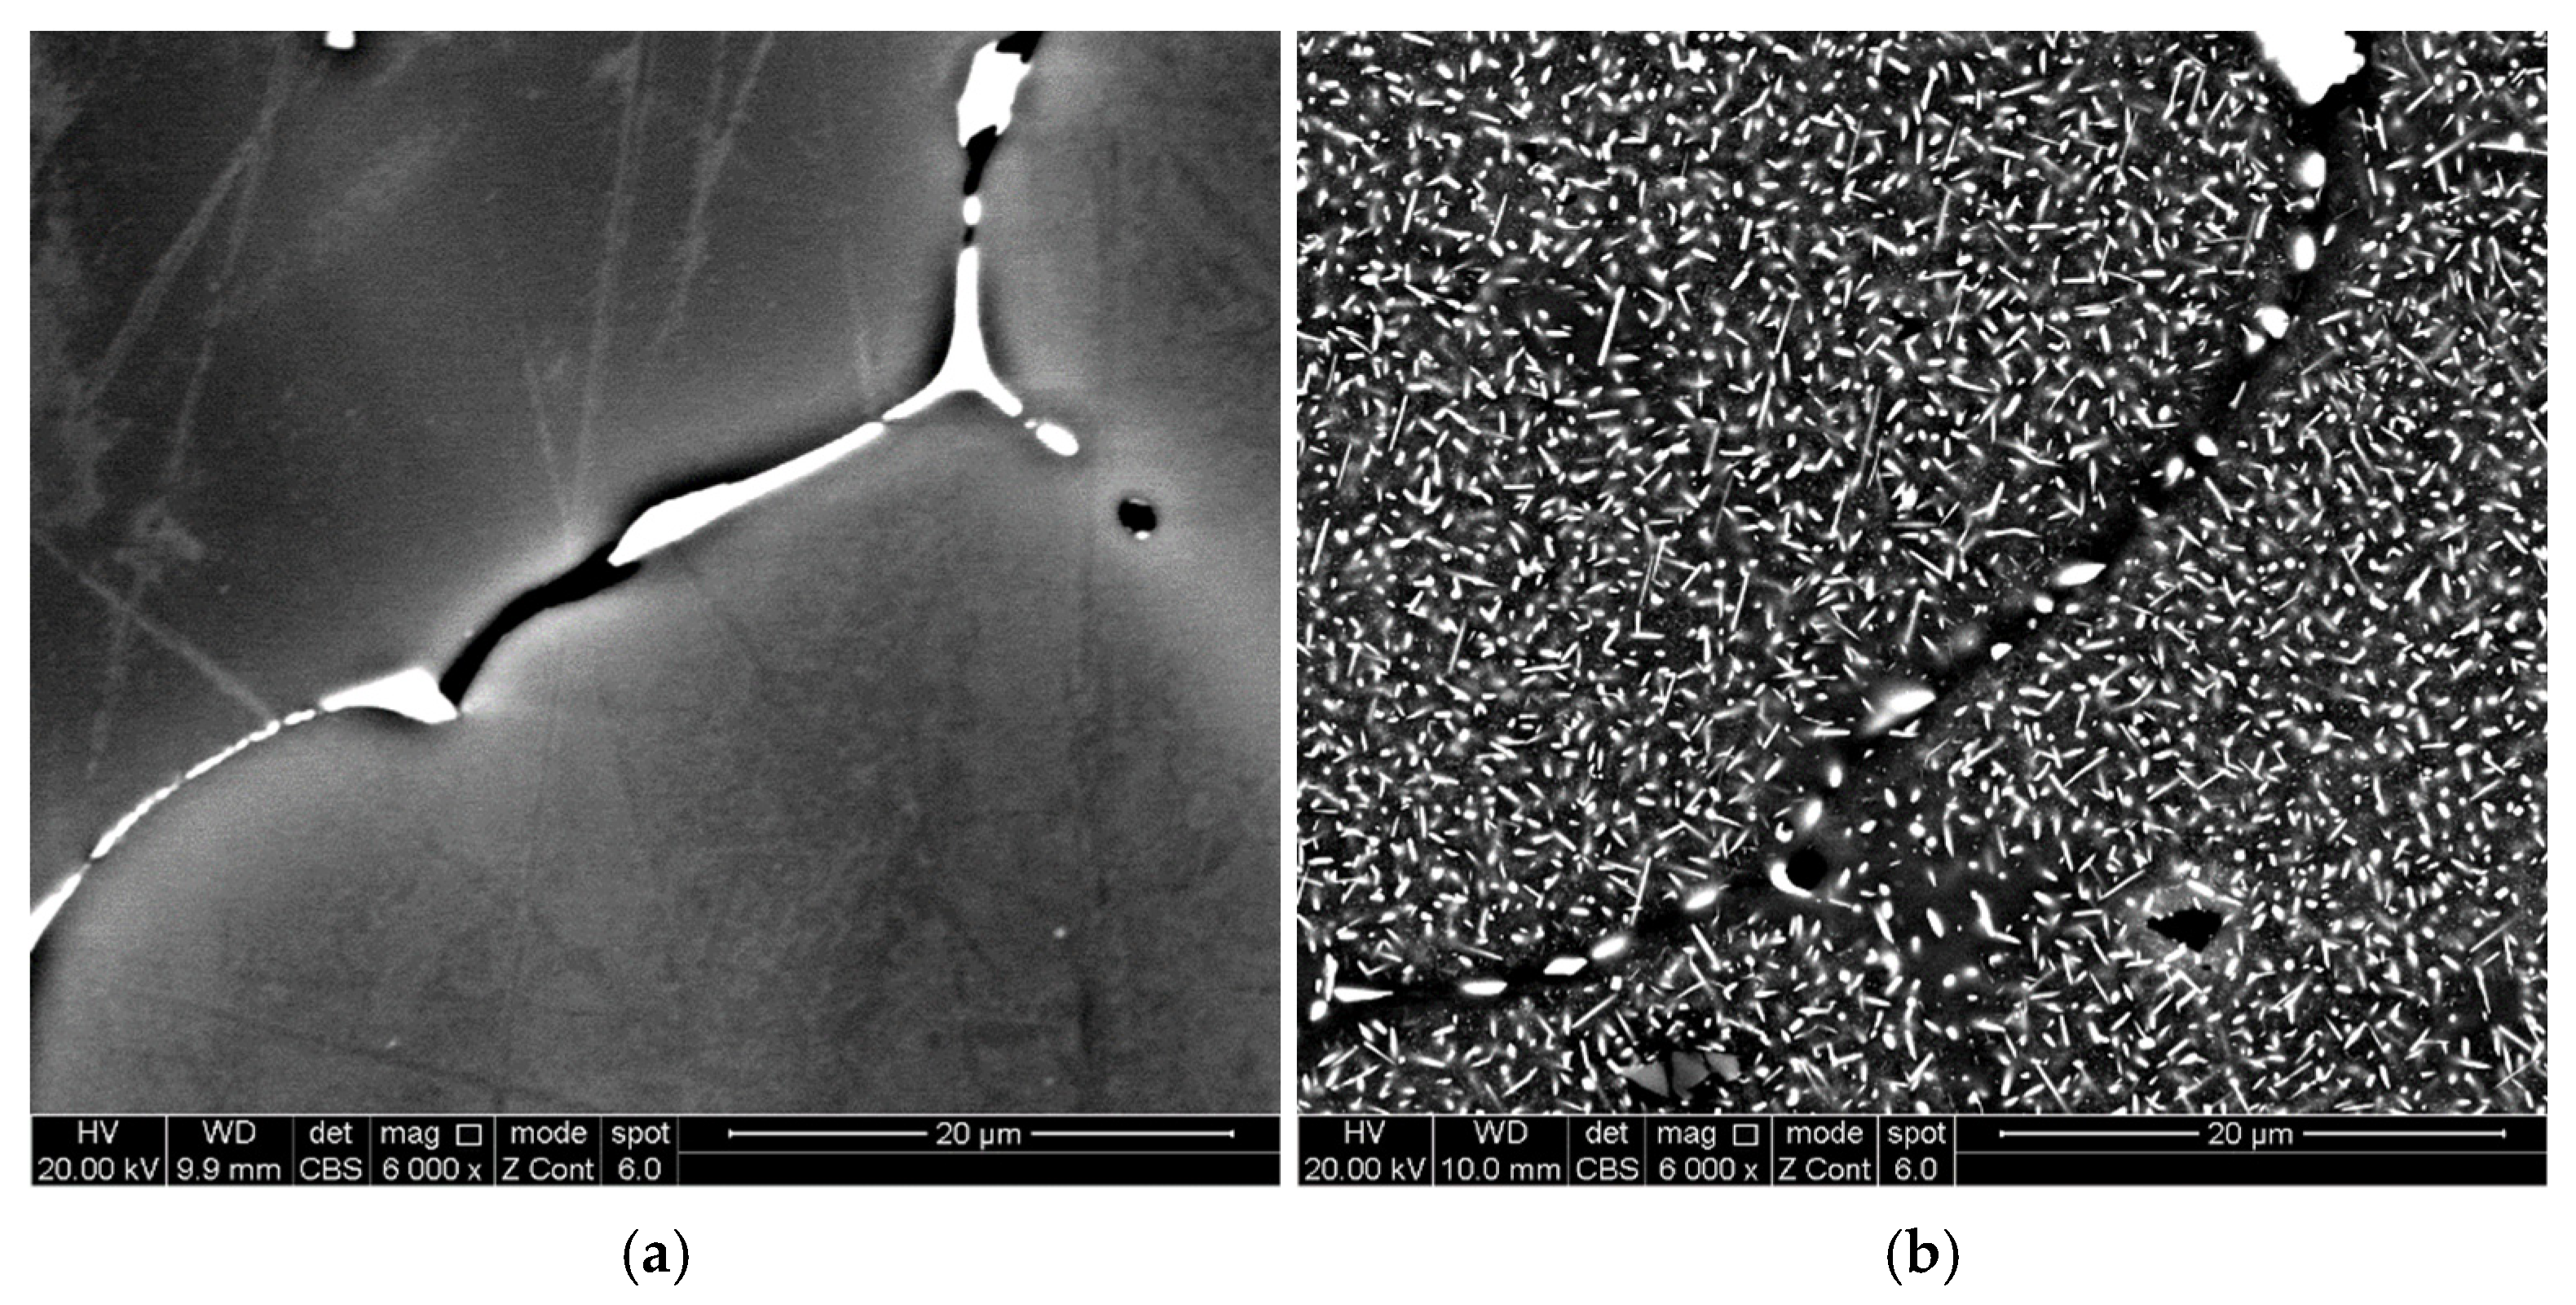
Billets were homogenized using a two-stage heat treatment based on the authors’ previous experience with this alloy. The procedure was based on preheating for 10 h to 465 °C followed by a 2 h holding period, and subsequent heating for 2 h to 475 °C with a final holding time of 4 h. Cooling was performed by air using fans. The applied homogenization heat treatment was selected based on extensive previous technological experience with this type of alloy. Similar parameters have been successfully used in multiple industrial and research projects involving EN AW-7075 and comparable high-strength aluminum alloys, providing stable and reproducible microstructural conditions prior to hot forming. The selected heat treatment ensures sufficient dissolution of segregated phases, chemical homogenization of the billet and a representative initial microstructure for subsequent deformation tests. Comparable homogenization conditions are also commonly applied in industrial practice by the authors’ industrial partners. Figure 6 presents the microstructure of the EN AW-7075 aluminum alloy before and after homogenization, observed using scanning electron microscopy (SEM), which was used as the initial microstructural state prior to hot deformation tests.

2.2. Hot Torsion Tests

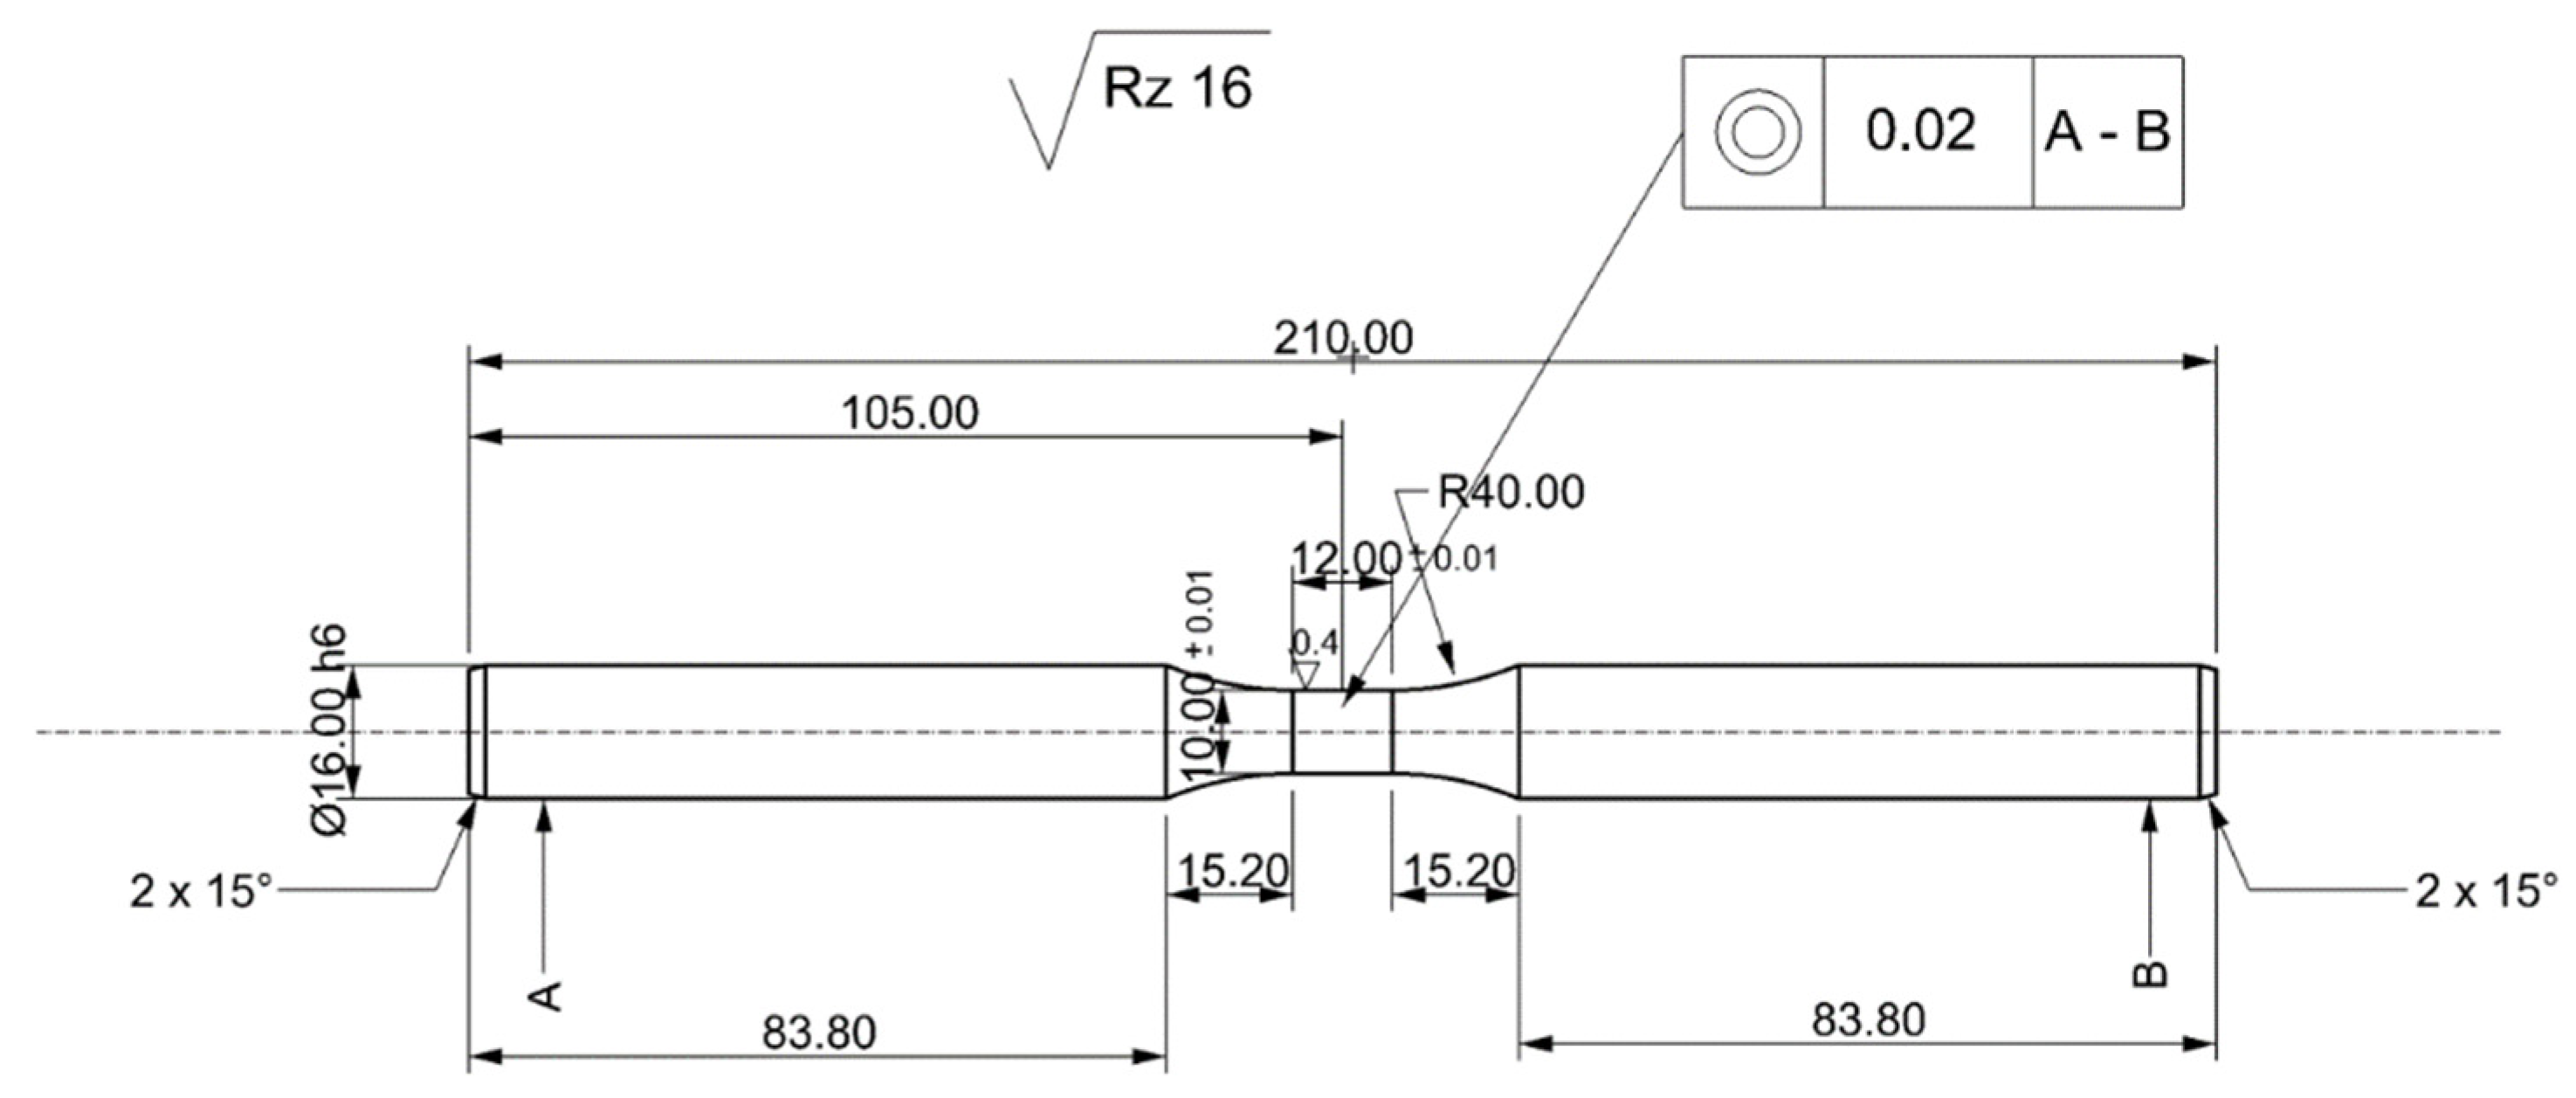
Hot torsion testing was initiated by machining specimens with the geometry illustrated in Figure 7. For tests, round samples with the following dimensions were used: base length l = 12 mm and base diameter d = 10 mm.
Also worth noting is the geometry of the applied torsion specimen (with R = 40), which does not include a sharp transition between the gauge section and the grip area. This configuration was proposed by our subcontractor, who routinely performs torsion testing of aluminum alloys for industrial partners. The geometry was intentionally designed to minimize stress concentration and to ensure a more uniform strain distribution along the gauge length. Although this setup differs from the standard torsion specimen design, it effectively reduces the risk of premature failure near the transition zone and improves the repeatability of the measurements.
The maximum shear strain at the specimen surface was calculated according to Equation (1):
γ = π · d · N L
The corresponding equivalent (von Mises) strain was obtained using Equation (2):
ε e q = π · d · N 3 · L
where γ is the maximum shear strain at the specimen surface, εeq is the equivalent (von Mises) strain, d is the specimen diameter, N is the number of rotations, and L is the gauge length of the specimen.
The maximum shear stress was calculated using the plastic torsion formulation proposed by Nadai according to Equation (3):
τ m a x = 3.2 M 2 π r 3
where τamx is the maximum shear stress at the specimen surface, M is the measured torque, and r0 is the specimen radius.
The corresponding equivalent stress was obtained using Equation (4):
σ e q = 3 · τ m a x
The specimens were subjected to hot torsion, reaching an equivalent strain of up to 5. During the experiments, test parameters were continuously recorded, including specimen temperature, rotational speed, torsional moment, strain rate, rotation angle, and flow stress. After deformation, the samples were cooled in air.
In the subsequent steps, preliminary data processing was performed, and stress–strain curves for varying temperatures and strain rates were developed. The tests were conducted using the STD 812 torsional plastometer from BÄHR-Thermoanalyse GmbH (BÄHR-Thermoanalyse GmbH, Hüllhorst, Germany). The tests were performed in a vacuum chamber, maintaining a constant temperature for the deformed sample and a constant strain rate.
K-type thermocouples were placed using the spot welding method on the side surface of the sample to record and monitor temperature changes. The samples were heated inductively, with a constant heating rate of 5 °C/s to the desired temperature, where they were held for 10 s before being deformed and subsequently cooled. The remaining testing parameters for the torsion experiments were as follows:
  • Nominal strain rates: 0.1 s−1, 1 s−1, and 10 s−1;
  • Test temperatures: 400 °C, 450 °C, and 480 °C.
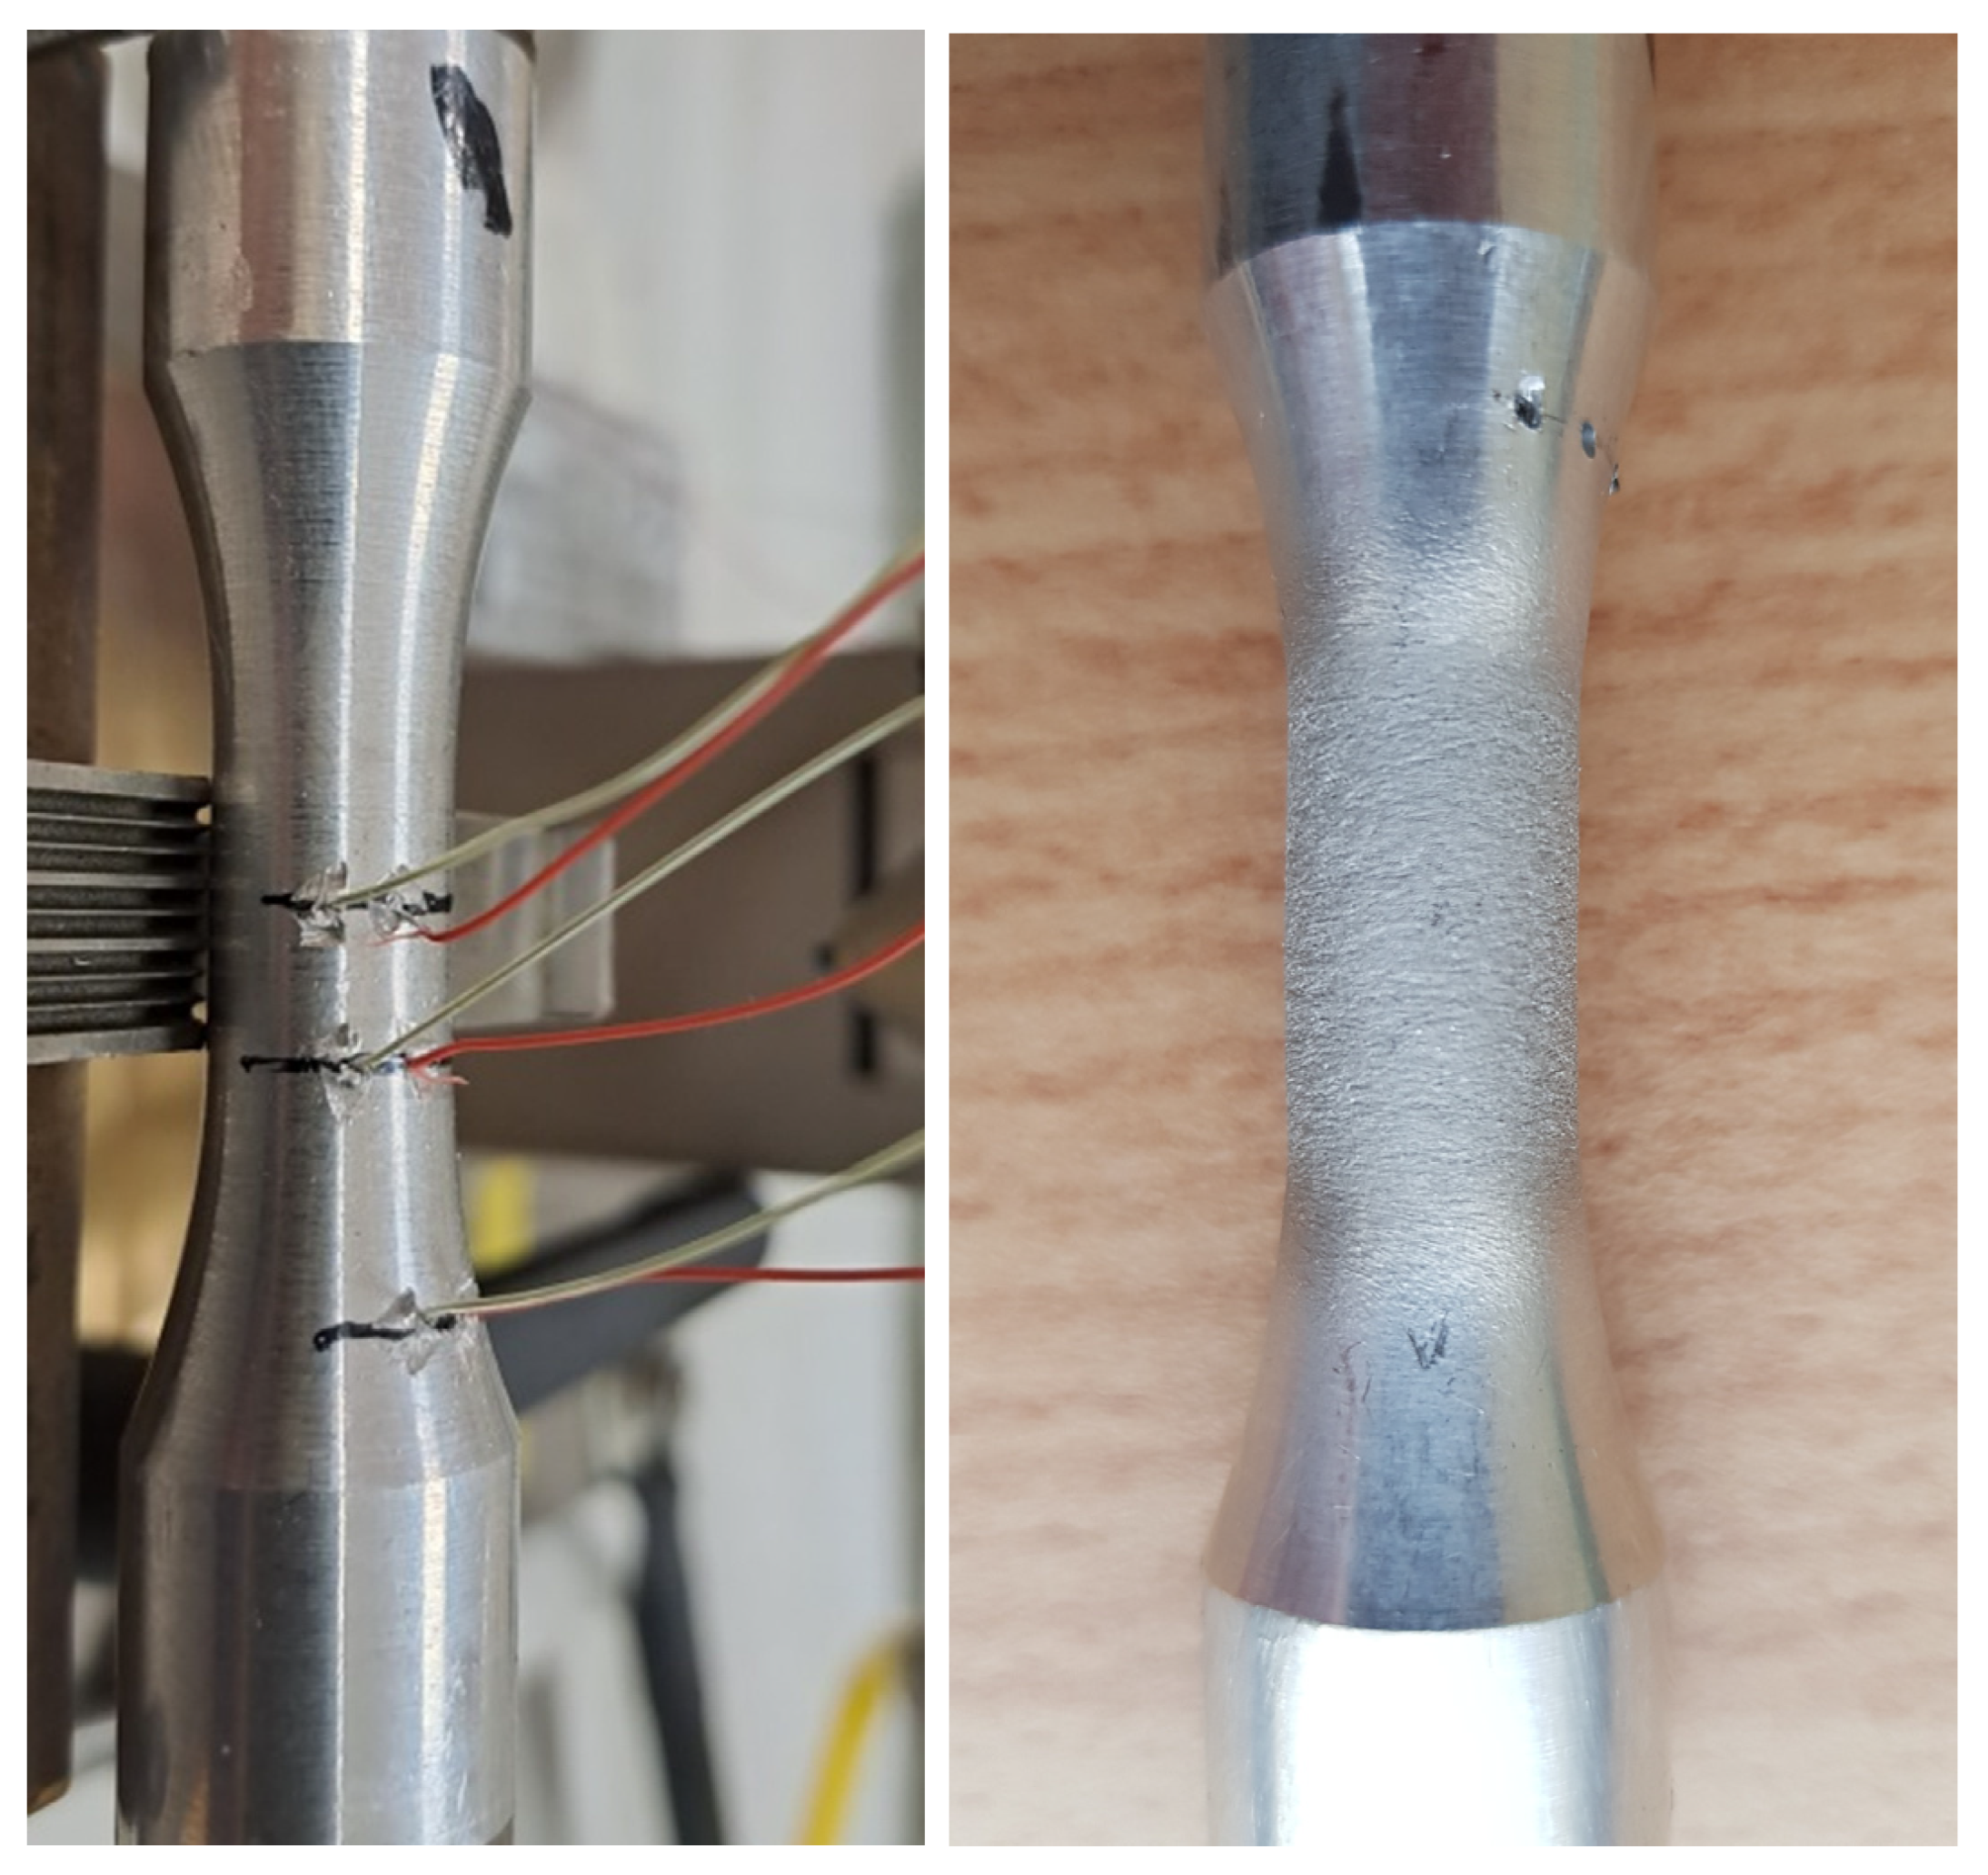
In order to verify temperature uniformity along the specimen length, selected samples were heated to the target temperatures and monitored using thermocouples positioned at different locations on the specimen surface, as illustrated in Figure 8.
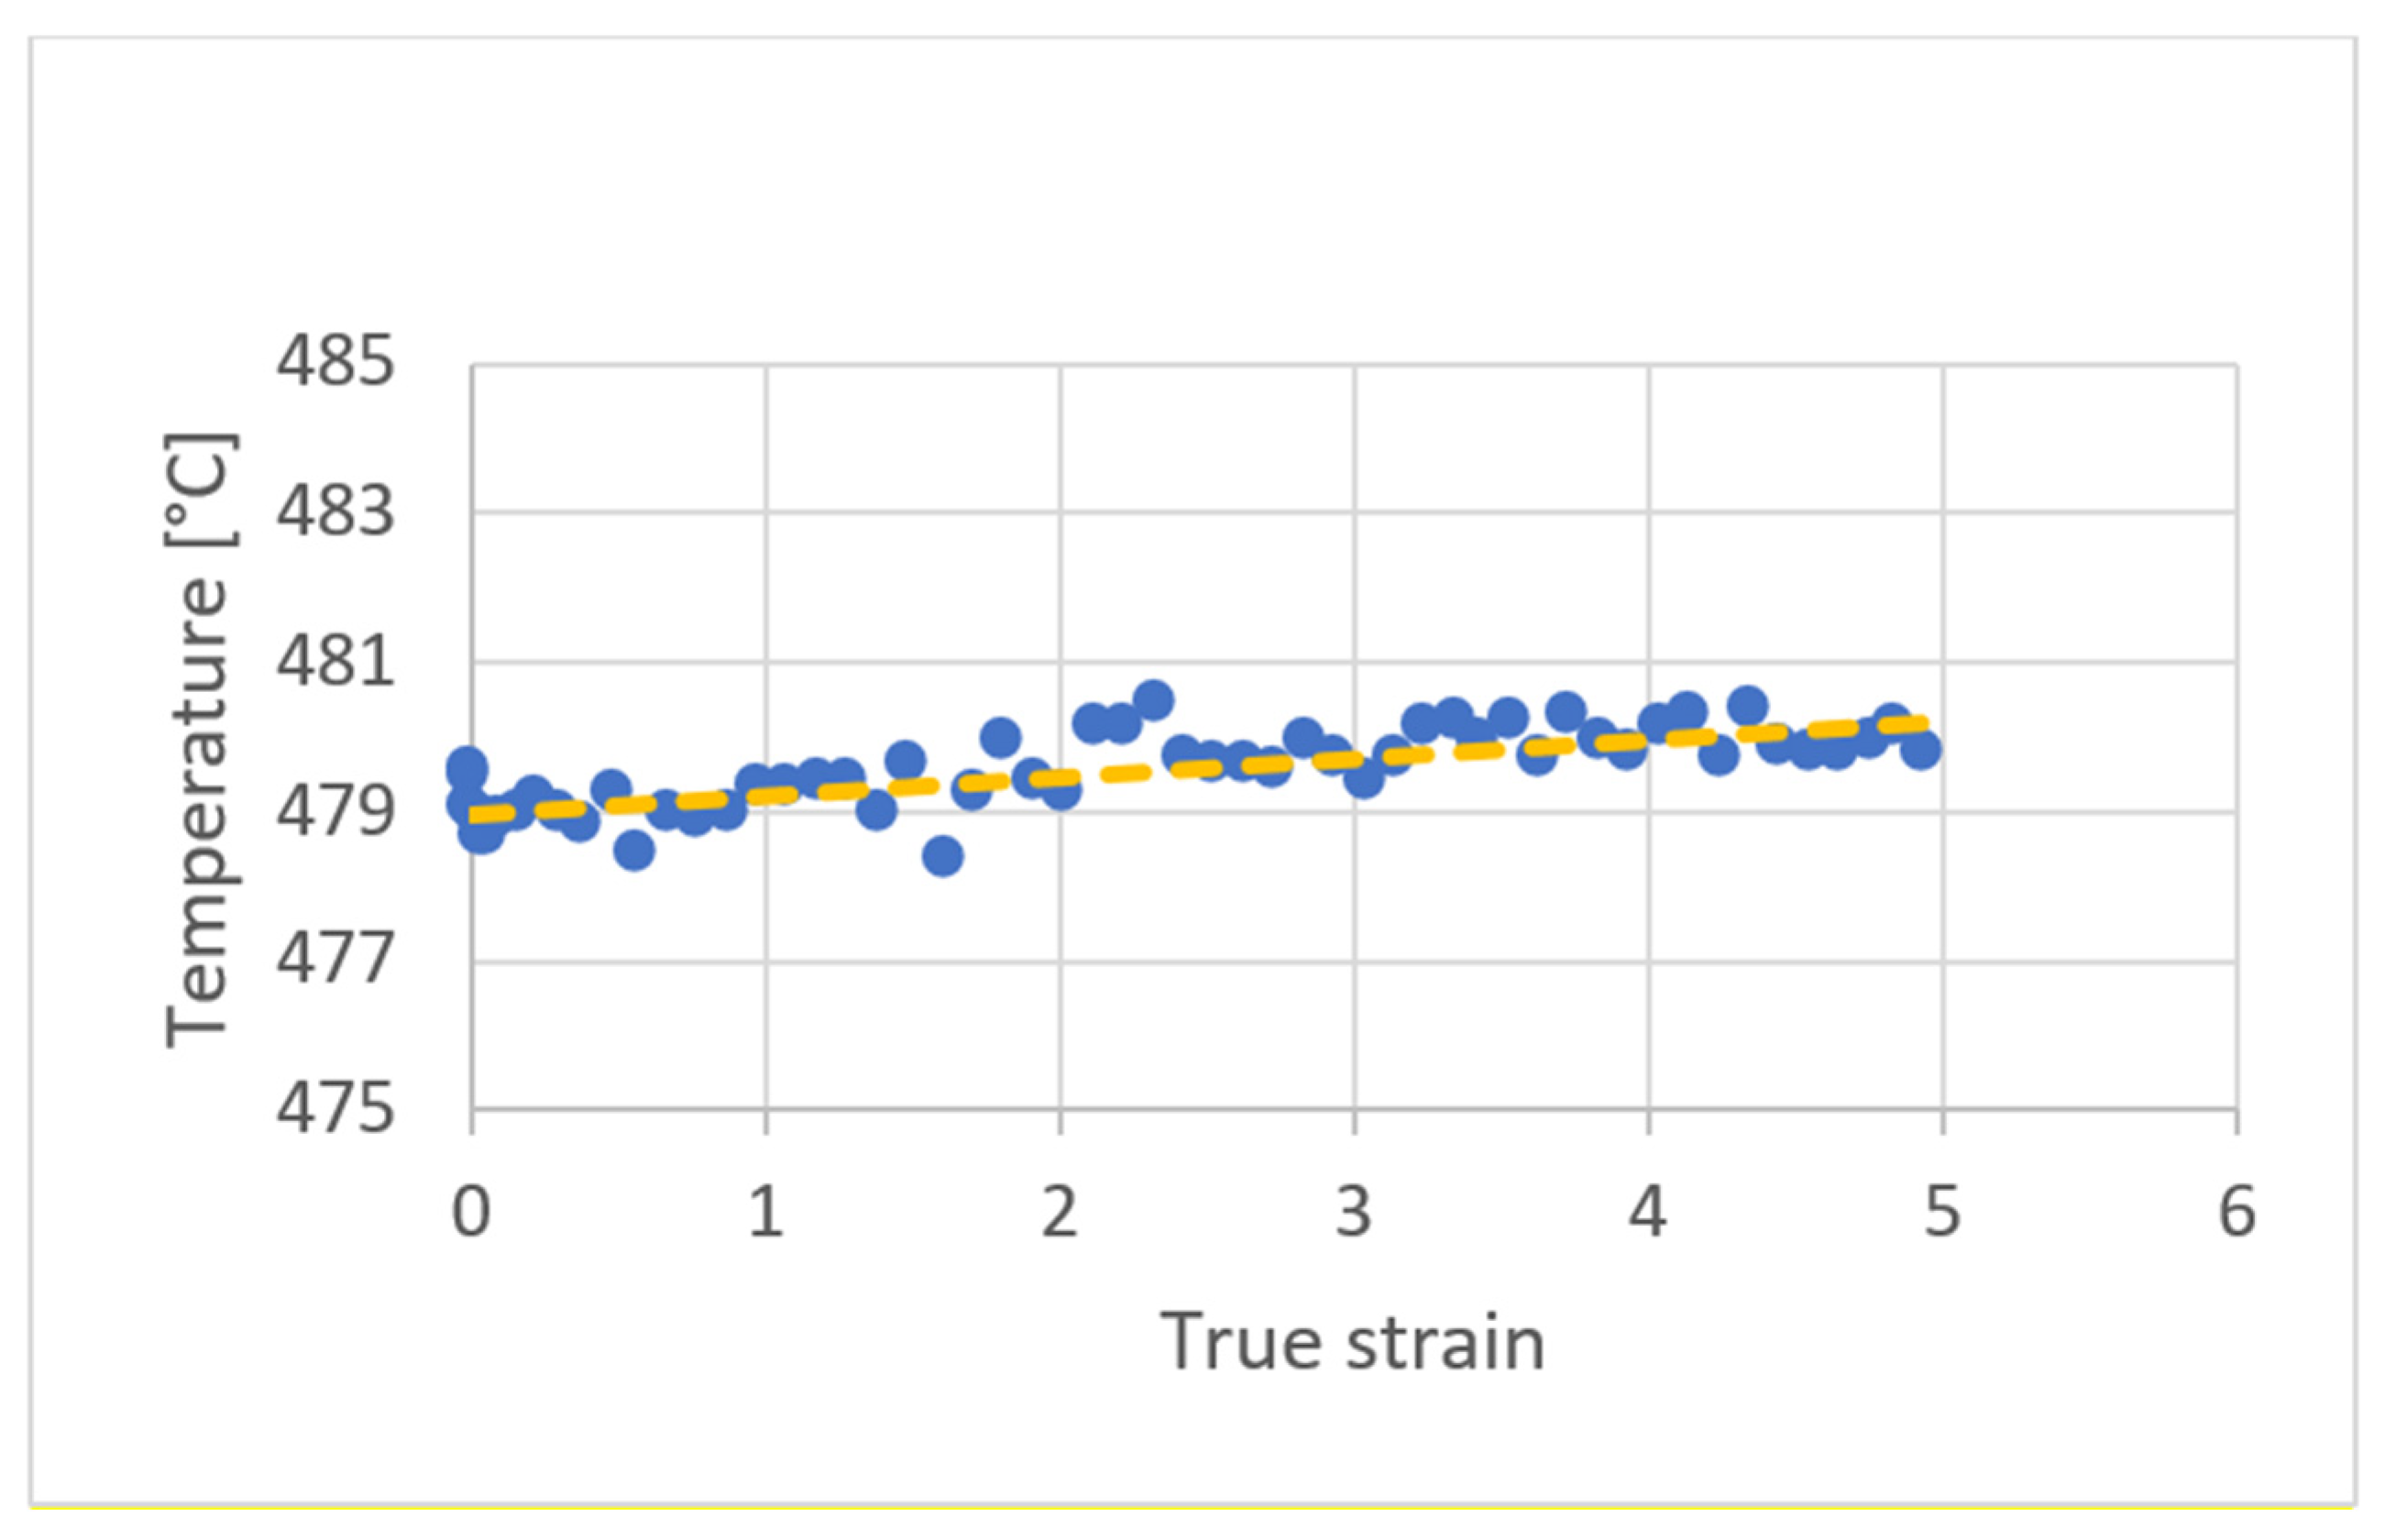
An example of temperature evolution during torsion testing (0.1 s−1, 480 °C) is shown in Figure 9. The instantaneous temperature fluctuations recorded by the thermocouples did not exceed ±3 °C, while the average specimen temperature exhibited a gradual increase of no more than 4 °C over the entire deformation range.

2.3. Hot Compression Tests

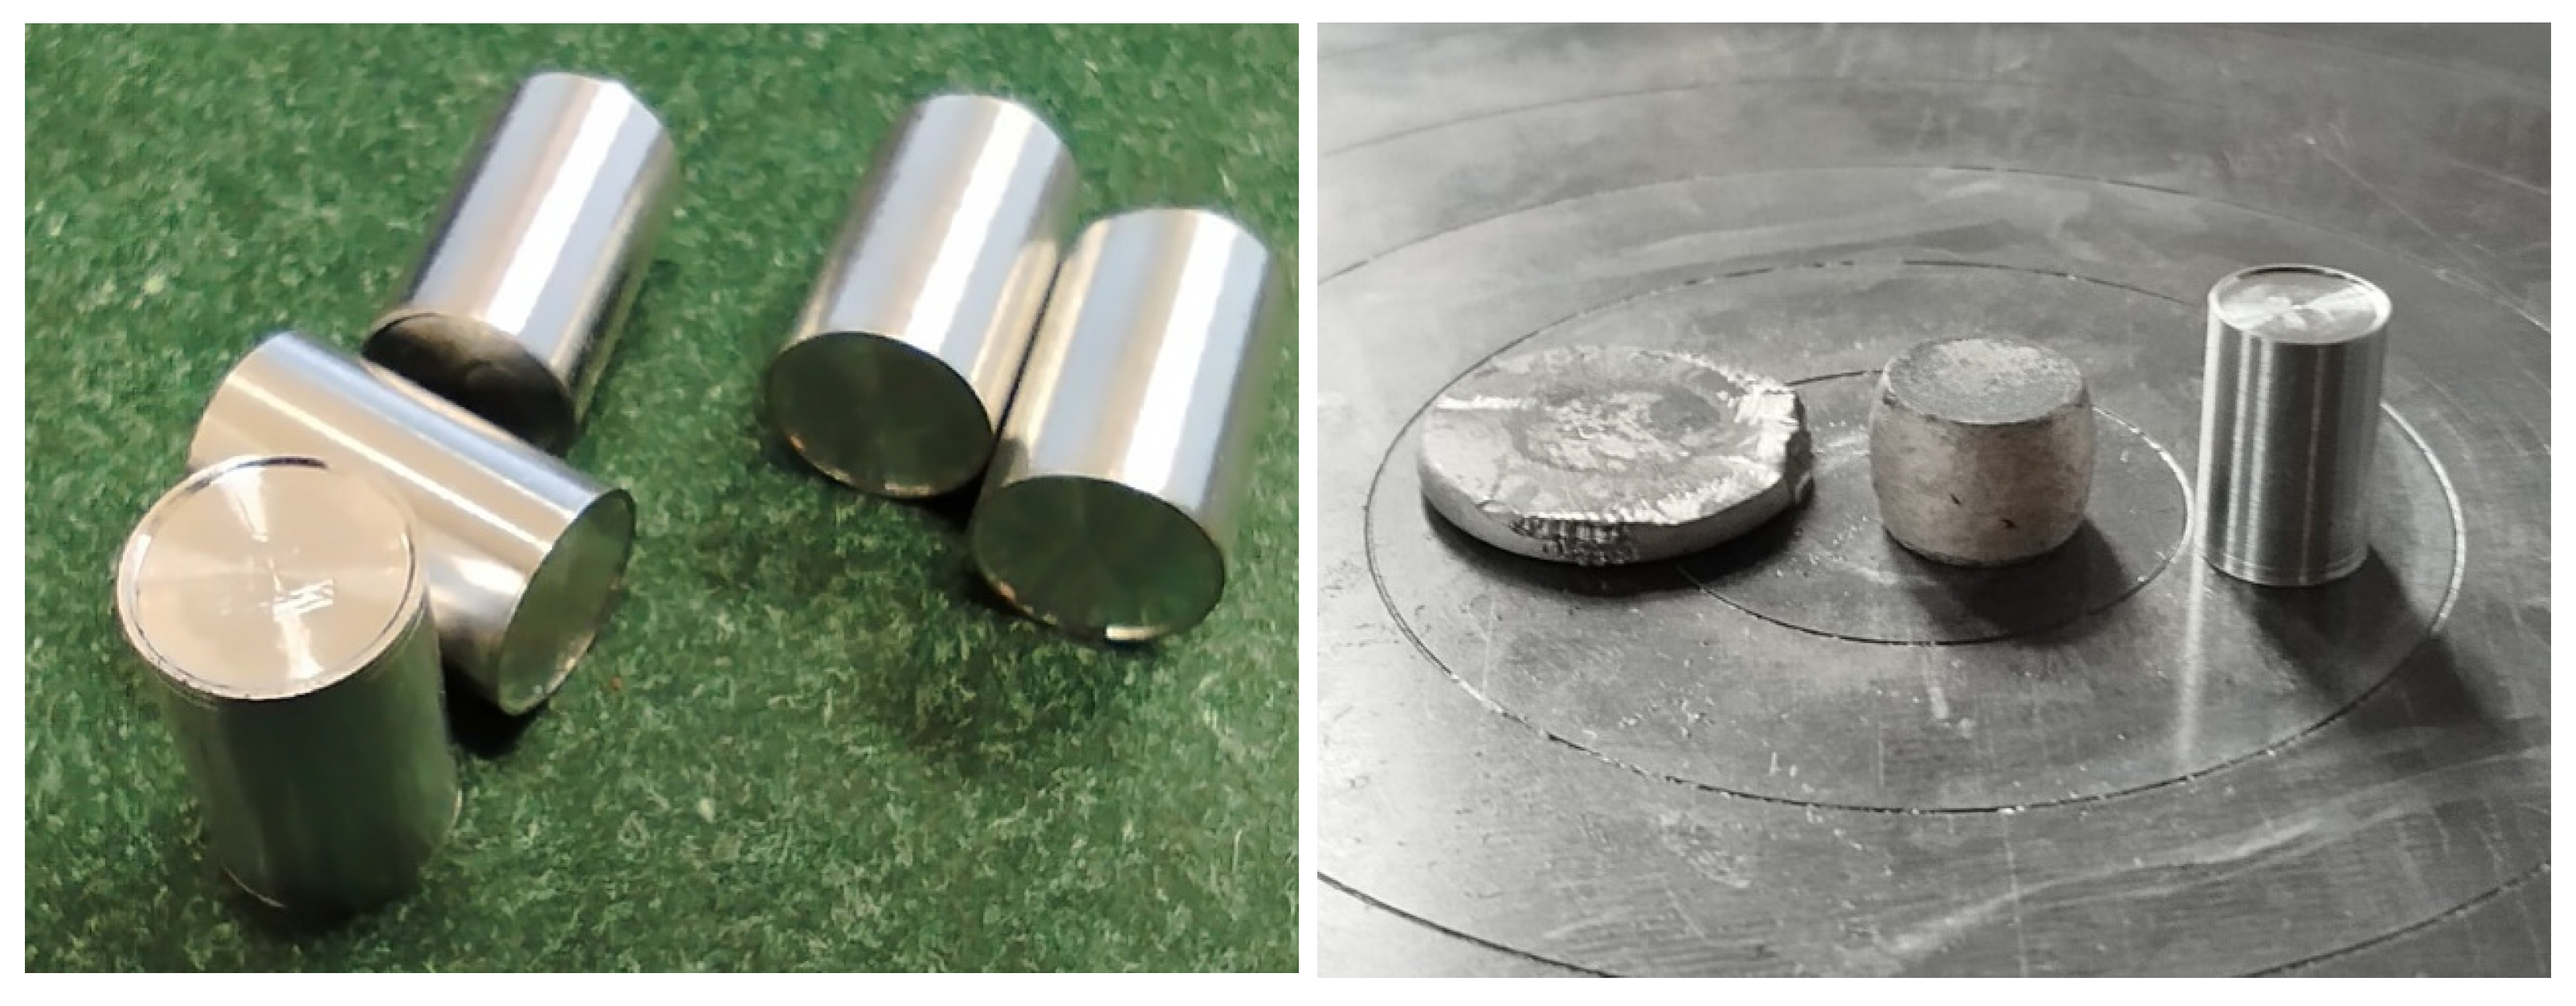
Hot compression tests were performed using cylindrical specimens prepared as shown in Figure 10. In order to reduce the influence of friction at the tool–sample interface, shallow lubrication pockets were machined on both flat faces of each specimen (visible in Figure 10) and filled with compacted boron nitride powder. This approach is commonly applied in high-temperature compression testing to limit frictional constraints and improve deformation homogeneity.
The compression experiments were carried out using an INSTRON 5582 universal testing machine (825 University Avenue, Norwood, MA, USA) with a maximum load capacity of 100 kN, equipped with an INSTRON 600DX high-temperature chamber. All tests were performed at a constant cross-head speed, which resulted in a non-constant strain rate during deformation.
The main test parameters were as follows:
  • Specimen dimensions: diameter 8 mm, height 12 mm;
  • Lubrication pocket depth: 0.25 mm;
  • Nominal strain rates: 0.01 s−1, 0.1 s−1, and 0.5 s−1;
  • Test temperatures: 400 °C, 450 °C, and 480 °C.
Prior to testing, both of the specimens and the compression tools were preheated in the furnace chamber for 60 min to ensure thermal stability. After deformation, the specimens were removed from the testing machine and cooled in still air.
As typically observed in high-temperature compression tests, specimen barreling occurred despite the use of lubrication pockets. This effect indicates that friction could not be fully eliminated. Nevertheless, the applied lubrication method significantly reduced friction compared to tests conducted without lubrication, resulting in a more uniform deformation in the central region of the specimens. Based on a detailed analysis of the flow stress curves and the onset of friction-induced stress increase, it was decided not to apply friction corrections, but instead to limit the usable strain range to values for which the effects of friction remained sufficiently low and did not significantly affect the identification of constitutive parameters. Therefore, a maximum true strain level of ε = 0.9 was adopted for subsequent calculations.

2.4. Spherical Probe Pressing Test

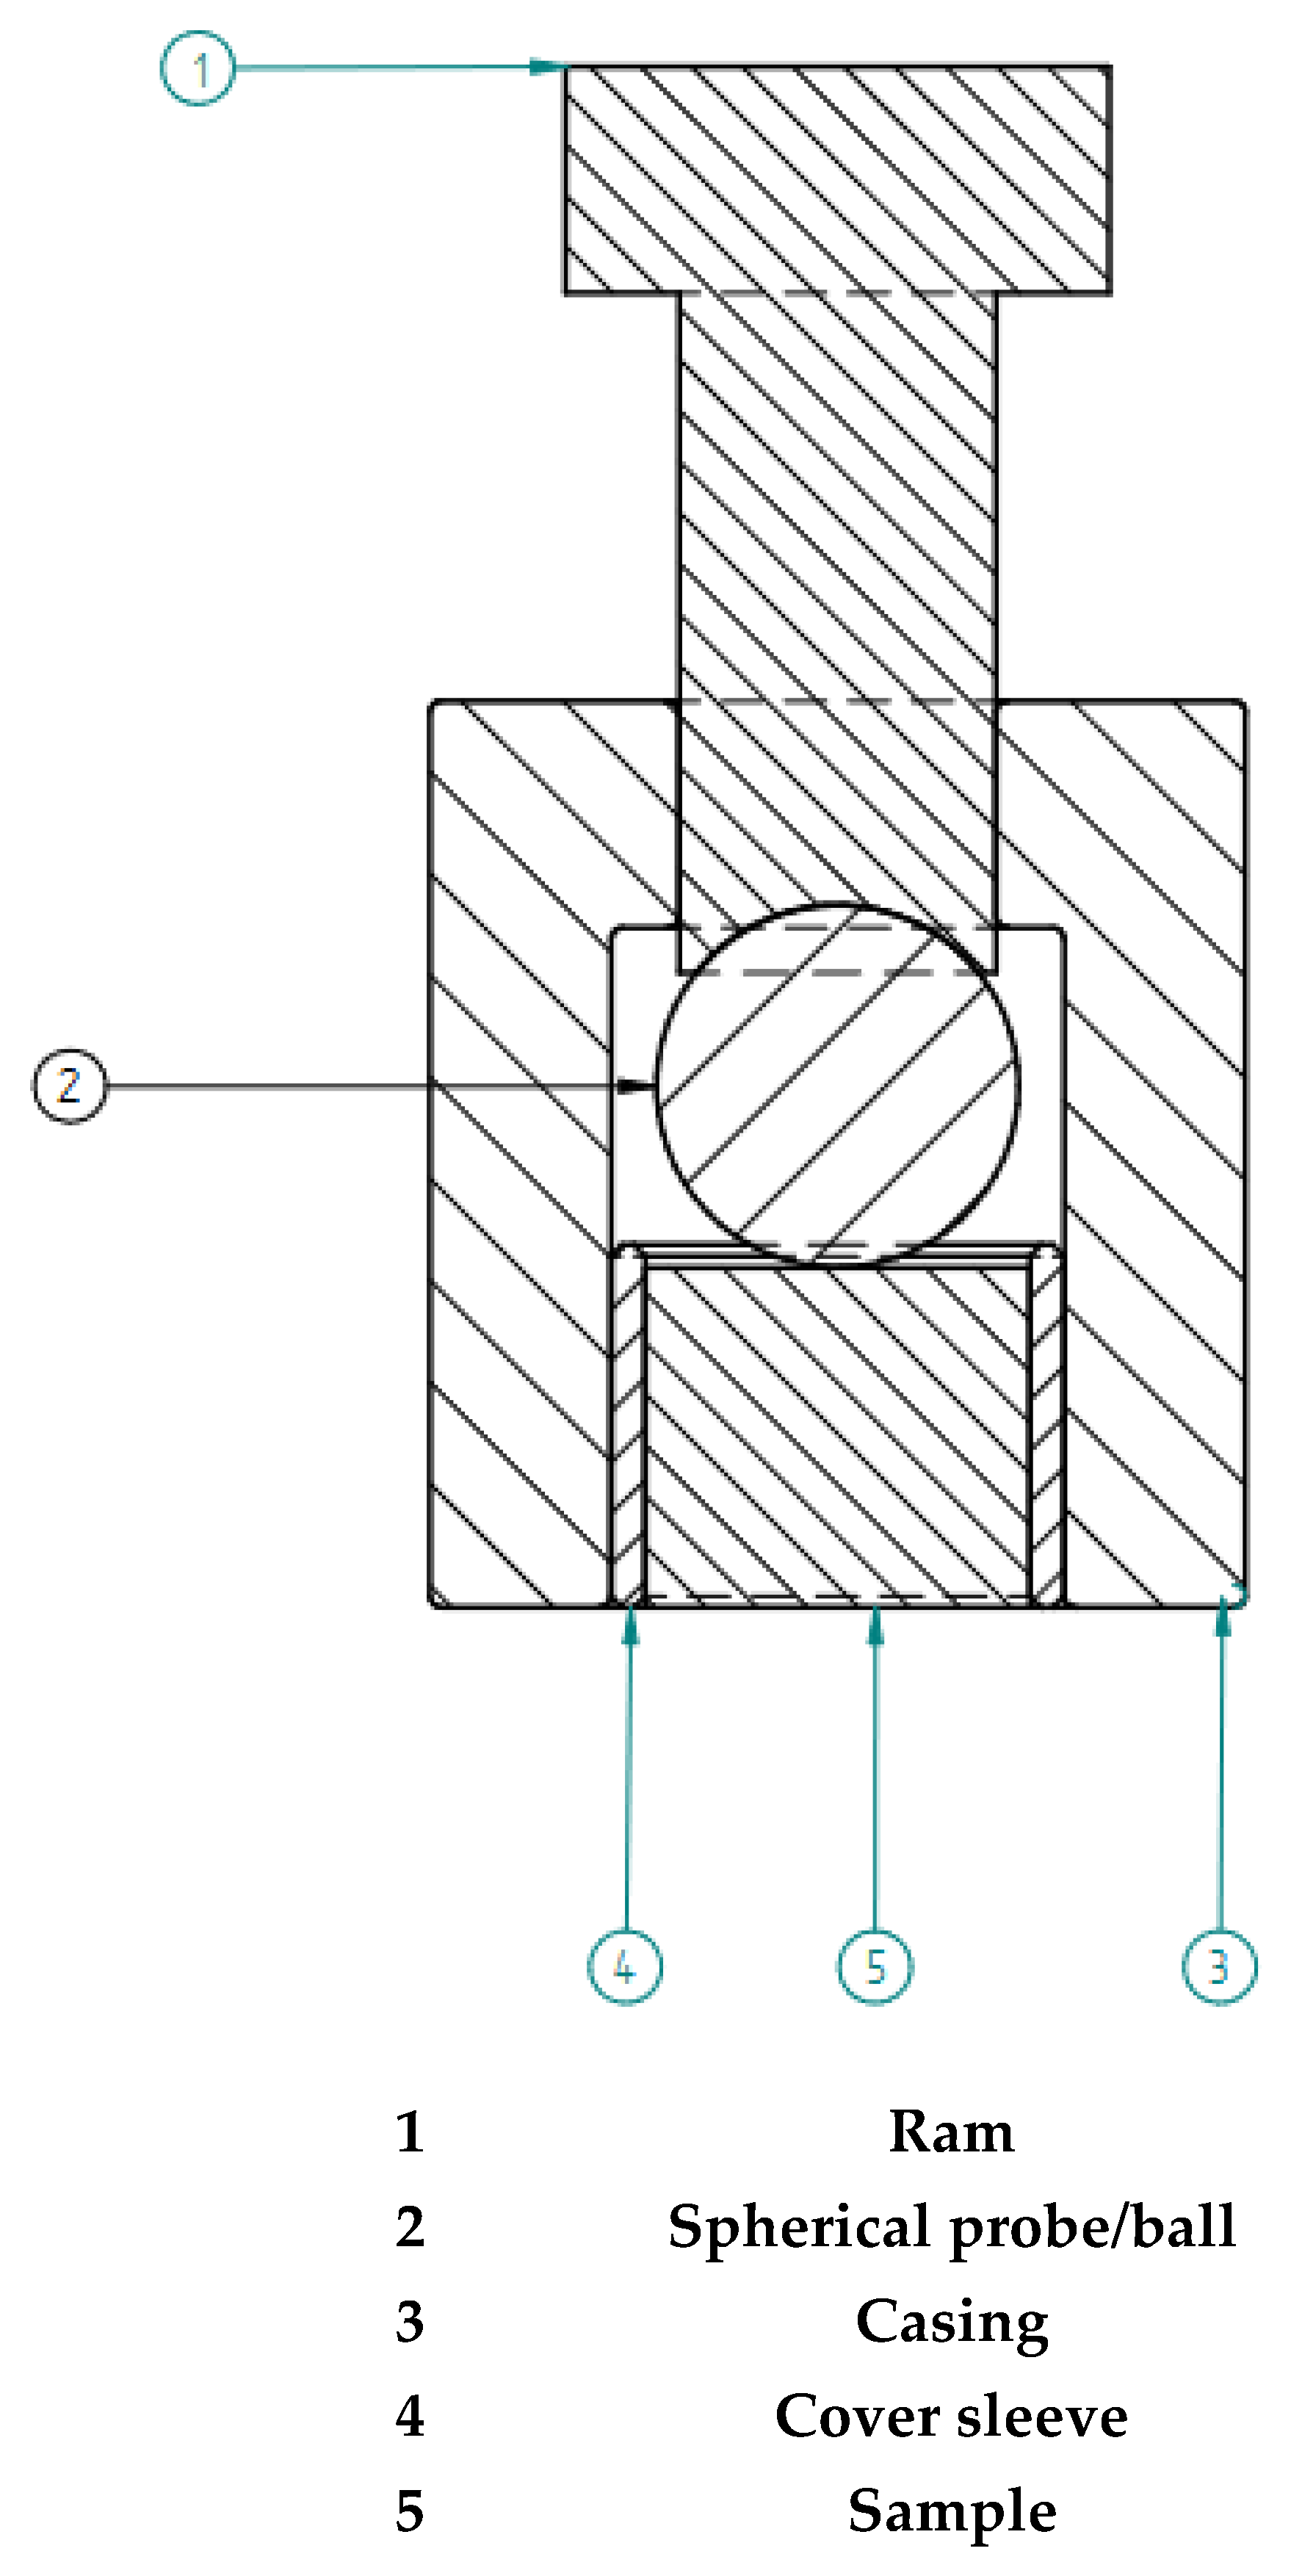
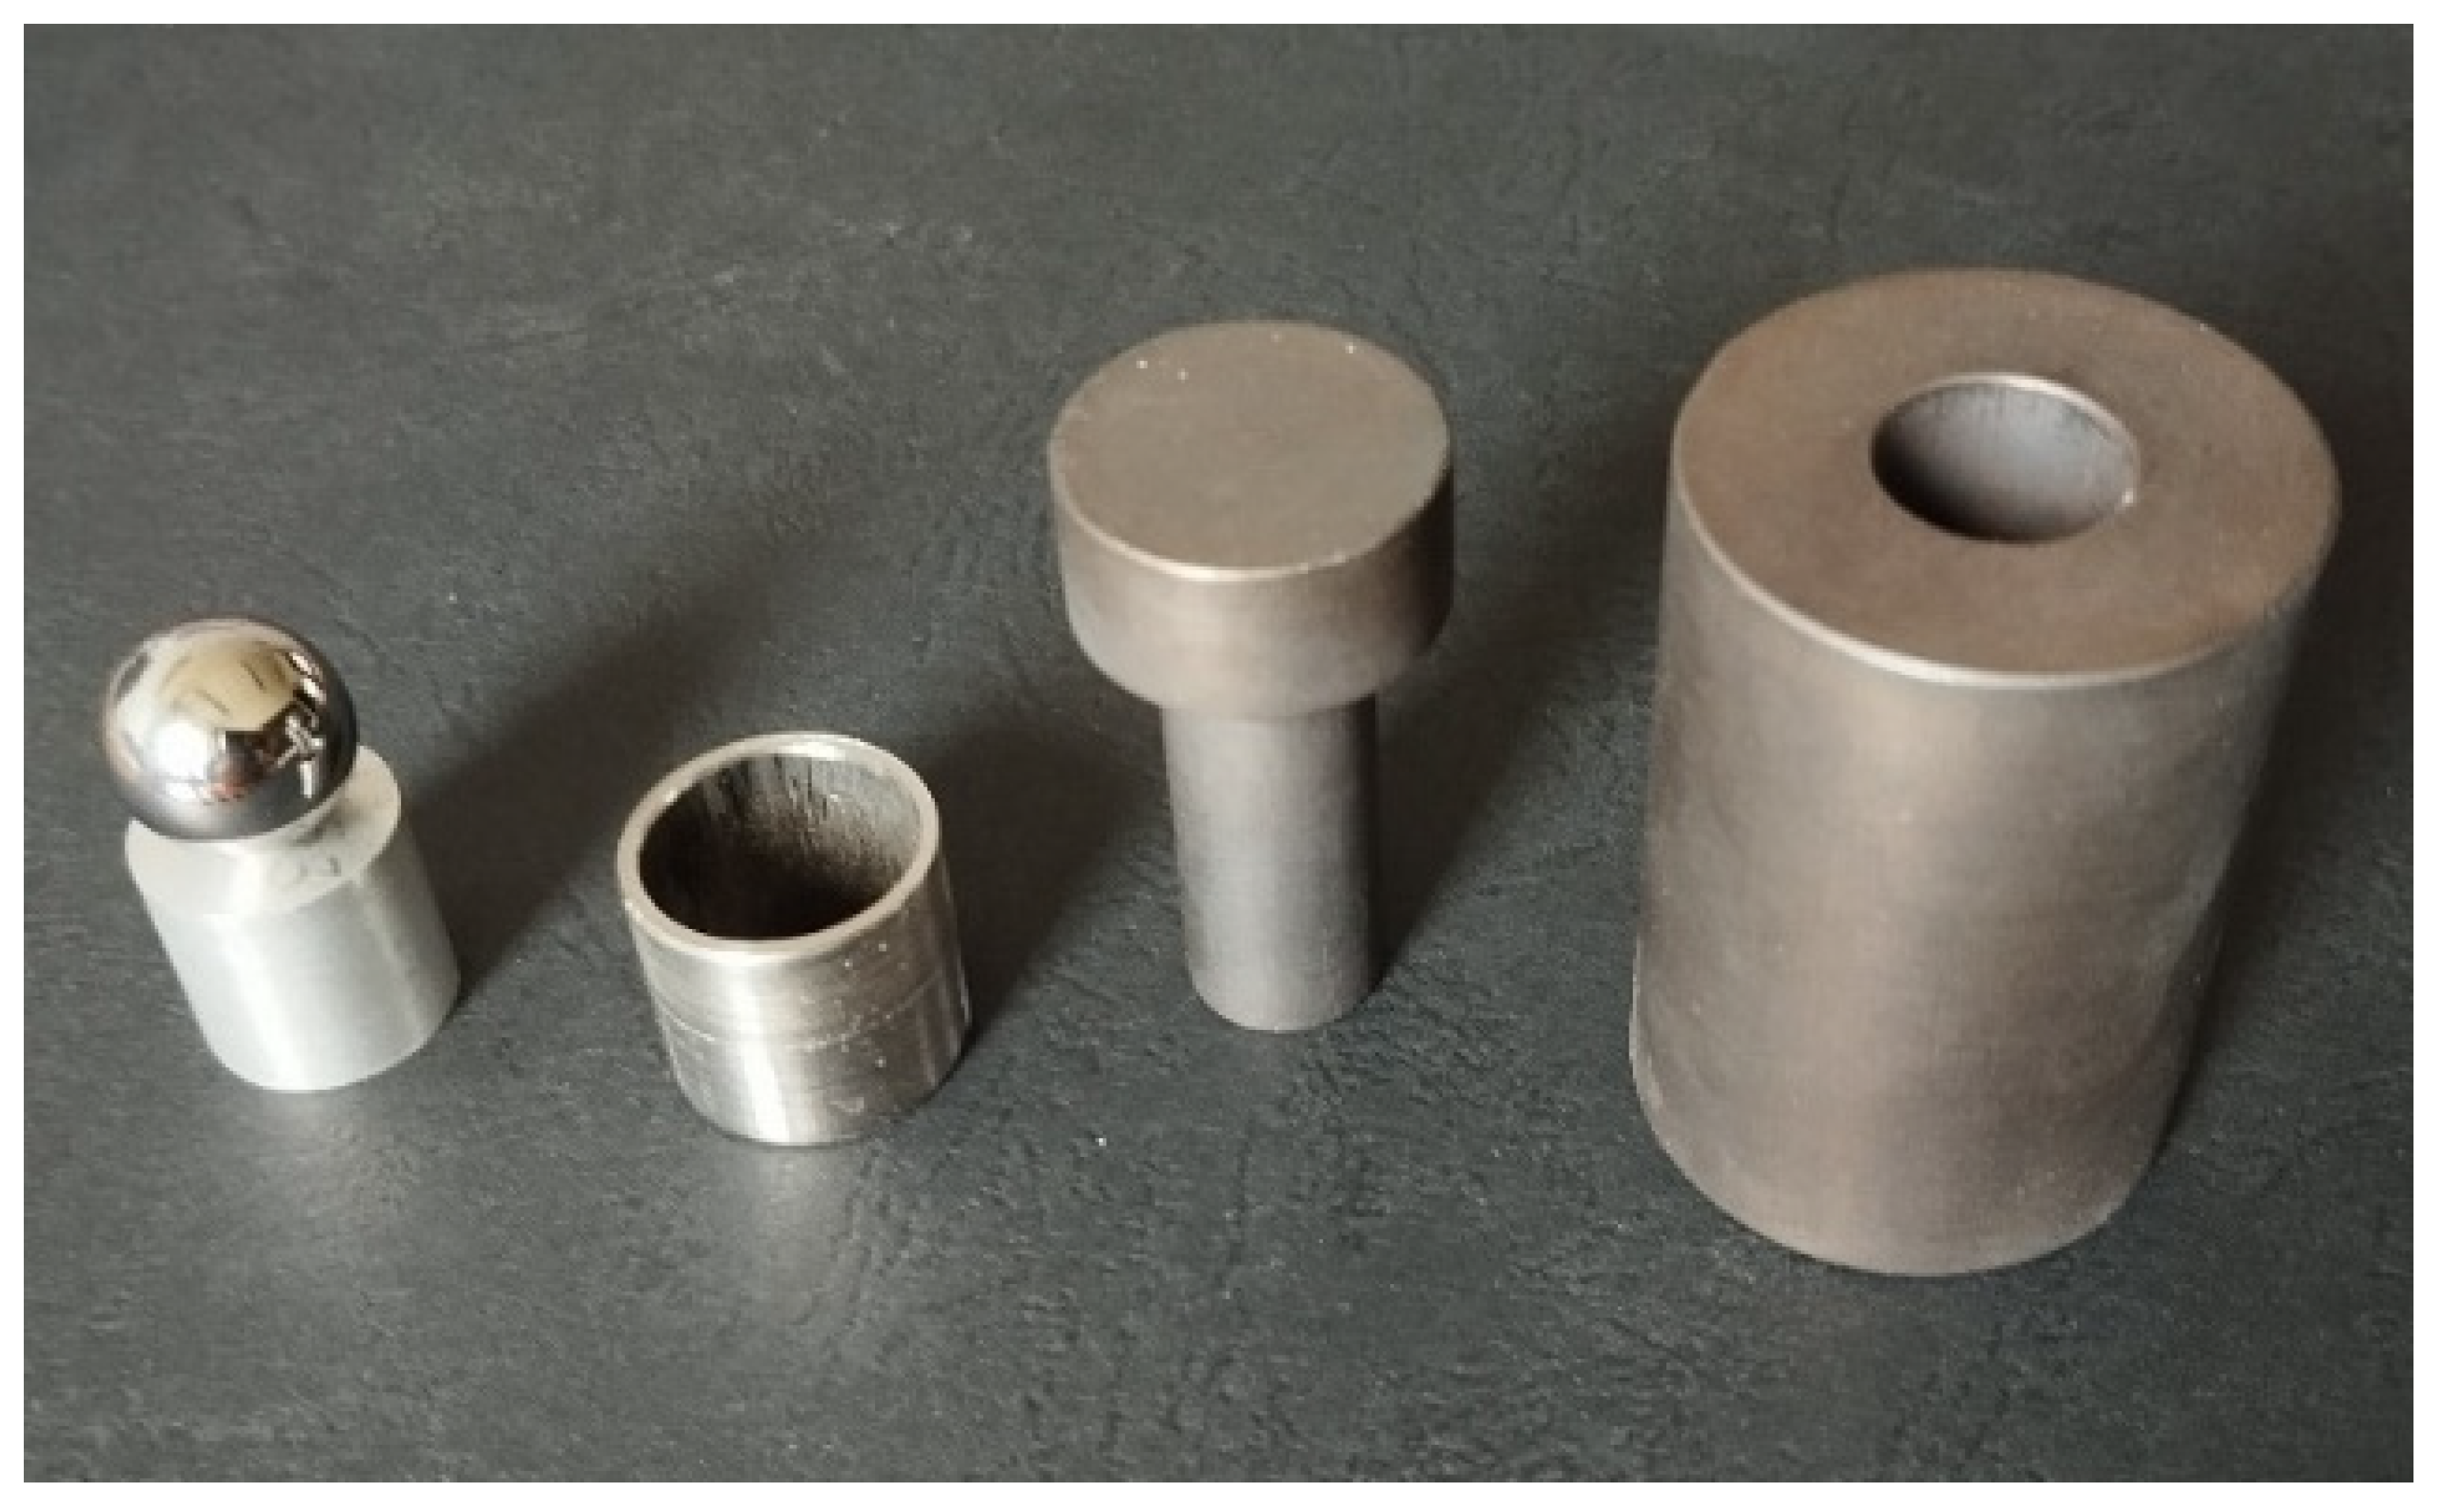
For the spherical probe pressing tests, dedicated tooling was designed and manufactured. The primary design objective was to enable fast specimen exchange and to allow adjustment of the maximum deformation level by using commercially available bearing balls with different diameters. The specimens were cylindrical in shape and could be easily prepared using standard machining procedures. The entire testing setup was compatible with conventional universal testing machines, making the method suitable for potential industrial application.
During the test, a spherical indenter (bearing ball) was pressed into the flat surface of the cylindrical specimen. Due to the probe’s geometry, the deformation level increased continuously during penetration until the indenter reached approximately half of its diameter. Beyond this point, the deformation rate approached a quasi-steady condition, resembling indirect extrusion-like material flow. The instantaneous nominal stress was calculated as the ratio of the measured force to the curved contact surface of the spherical probe, according to Equation (5):
σ nom ( t ) = F ( t ) 2 π R h ( t )
where F(t) is the force recorded by the testing machine, R is the indenter radius, and h(t) is the instantaneous penetration depth obtained from the cross-head displacement.
The equivalent strain was estimated based on the logarithmic change in the specimen surface area, as seen in Equation (6):
ε = l n S 0 S 1
where S 0 and S 1 represent the initial and deformed surface areas, respectively.
The strain definition used in the spherical probe pressing test should be understood as an effective engineering strain measure intended for comparative constitutive identification, and not as a rigorous theoretical description of contact mechanics. The validity of this definition was verified using inverse FEM simulations of the probe test.
It should be emphasized that the spherical probe pressing test represents a simplified, engineering-oriented experimental approach intended primarily for comparative constitutive model identification. Due to the nature of contact deformation, a constant strain rate cannot be directly imposed. Therefore, a representative equivalent strain rate was determined based on FEM simulations of the probe test and used for constitutive model identification.
Extensive preliminary methodological analyses were performed, including attempts to reduce friction effects by high-temperature lubrication and to correct hydrostatic stress contributions. However, these approaches did not lead to sufficiently stable and reproducible constitutive curves suitable for direct theoretical model identification.
As a result, it was found that the most reliable and practically applicable strategy was to intentionally limit the usable strain range to approximately ε ≤ 1, beyond which frictional and hydrostatic effects dominate the mechanical response and significantly affect curve stability. The obtained experimental curves were therefore treated as effective engineering data and subsequently approximated and implemented into the Hensel–Spittel formulation.
Furthermore, an inverse FEM-assisted identification strategy was adopted, in which the experimentally obtained curves were validated and adjusted through numerical simulation of the probe test itself. This approach ensured numerical stability and direct industrial applicability of the resulting constitutive parameters.
Despite its limitations, the spherical probe pressing test remains attractive due to its simplicity, low experimental cost, and compatibility with standard testing equipment. It is therefore proposed as a practical comparative engineering validation tool, enabling cost-effective cross-comparison of constitutive models obtained from different experimental methods using FEM analysis. The main test parameters for the spherical probe pressing experiments were as follows:
  • Specimen dimensions: diameter 15 mm, height 15 mm;
  • Indenter diameter: 13.5 mm;
  • Nominal strain rates: 0.01 s−1, 0.1 s−1, and 1 s−1;
  • Test temperatures: 400 °C and 480 °C.
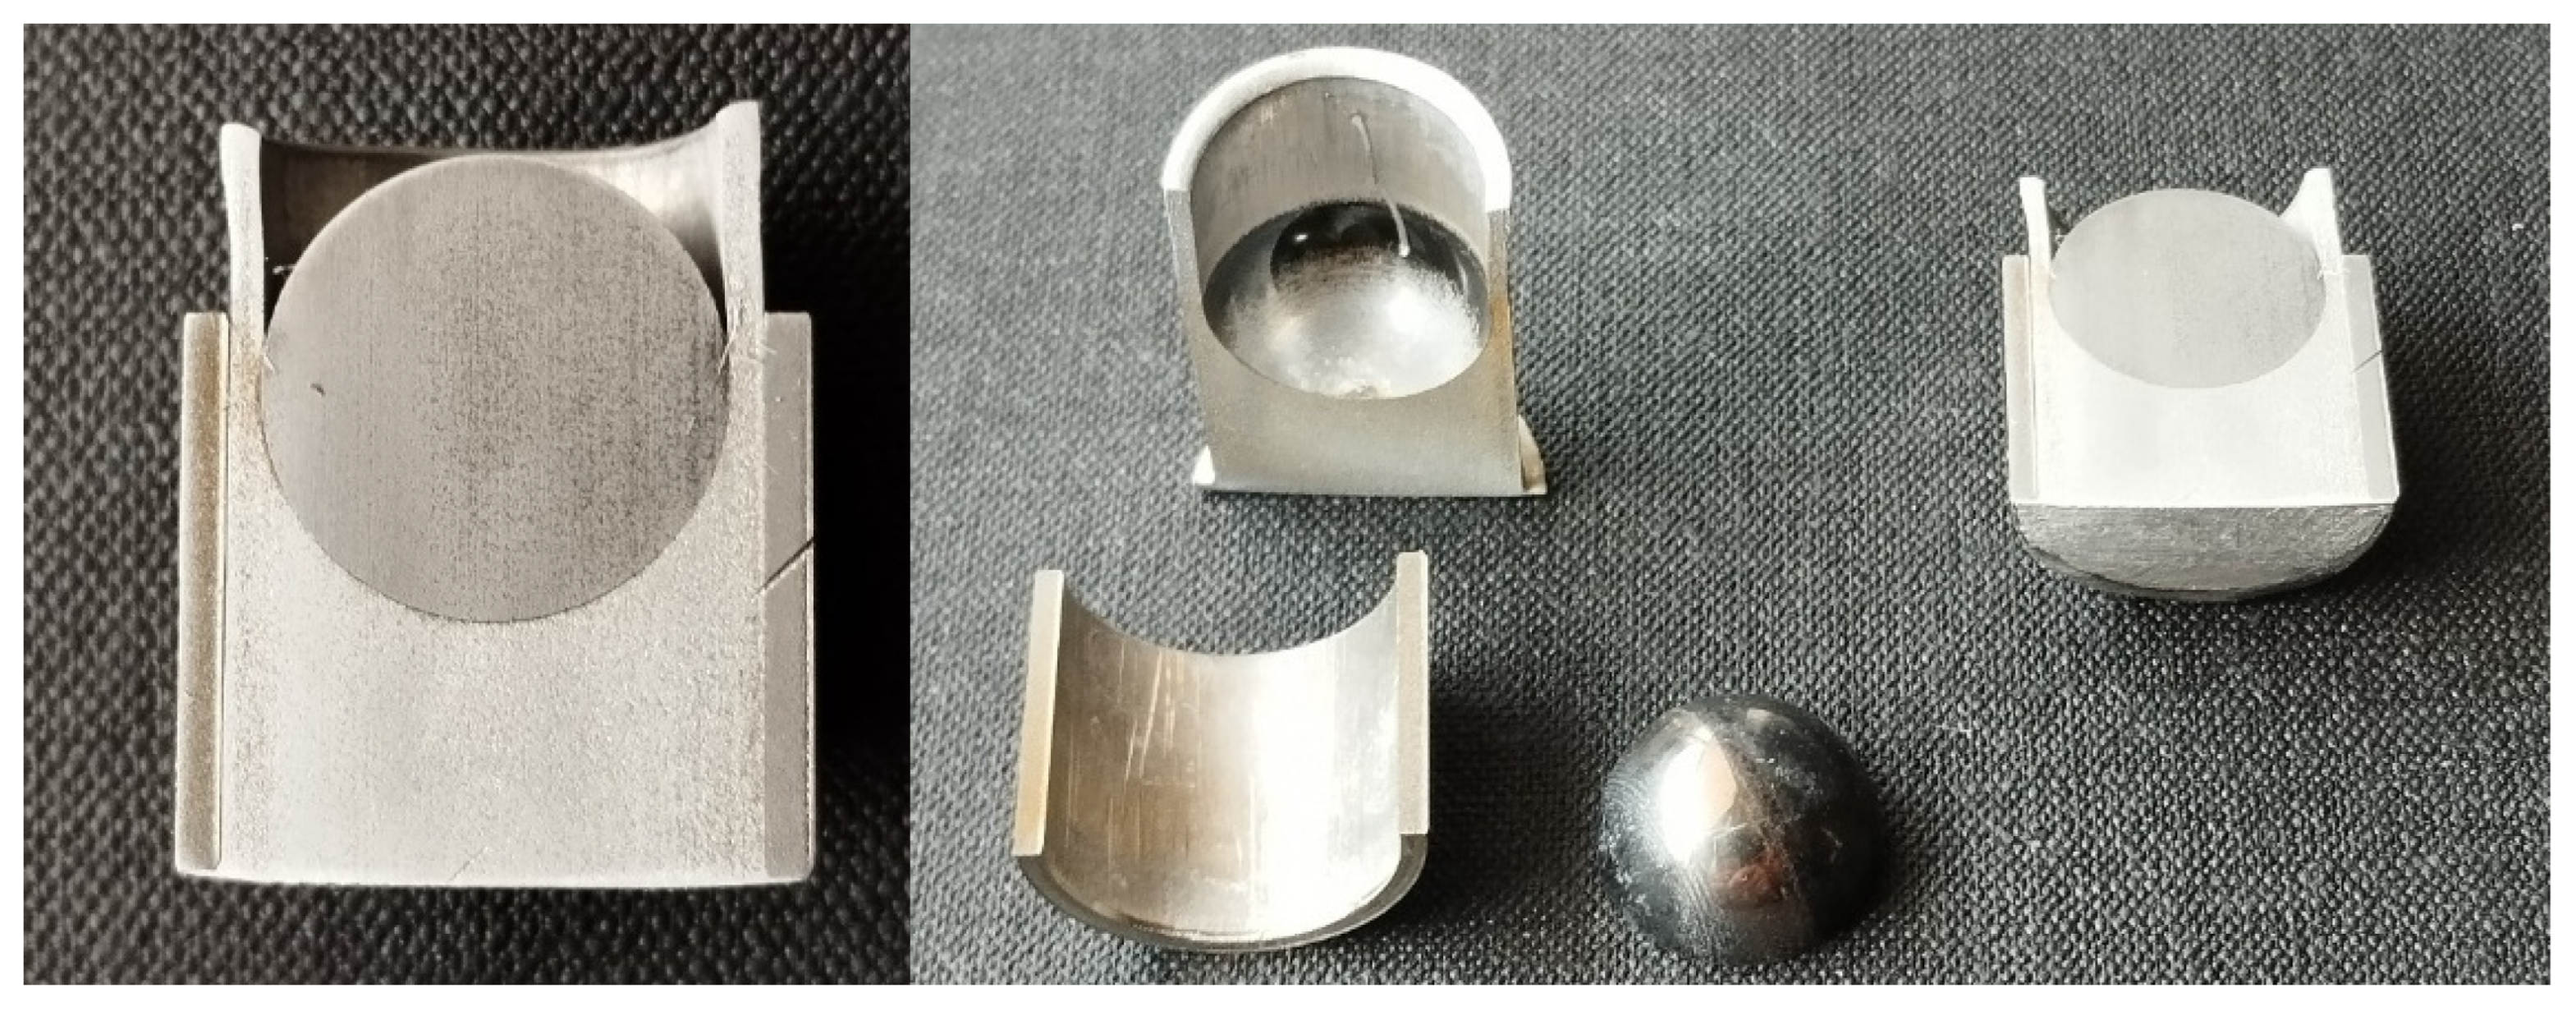
To reduce friction, boron nitride powder was applied as a lubricant at the probe–specimen interface. Photographs and schematic drawings of the testing setup, as well as the specimens after deformation, are presented in Figure 11, Figure 12 and Figure 13.

3. Experimental Data Processing and Constitutive Modeling

The parameters collected during the tests were analyzed to enable their comparison in terms of their usefulness in simulations of plastic forming processes. For applications in FEM analysis the Hensel–Spittel [16] law was considered as it is commonly used as a model for calculating material flow stress behavior involving crucial parameters like temperature, strain dependence and strain rate. The nine-material-parameter version of the H-S law (1.1) was taken as a basis for the calculations:
σ f = A · ε m 1 T · T m 9 · ε m 2 · e m 4 / ε · ( 1 + ε )   m 5 T · e m 7 ε · ε ˙ m 3 · ε ˙ m 8 T
where σf is the material flow stress expressed in MPa and the coefficients represent different values depending on whether the temperature is expressed in °C or K. The coefficients m1 and m9 define the material’s sensitivity to temperature, m5 defines the coupling temperature and strain, m8 represents coupling temperature and strain rate, and the m2, m4, m7 coefficients define the material’s sensitivity to strain, and, finally, m3 depends on the material’s sensitivity to the strain rate. The coefficient values for all three mentioned tests were calculated based on an internal solver implemented in the Q-form Extrusion software. The coefficients given by this are presented in Table 2.
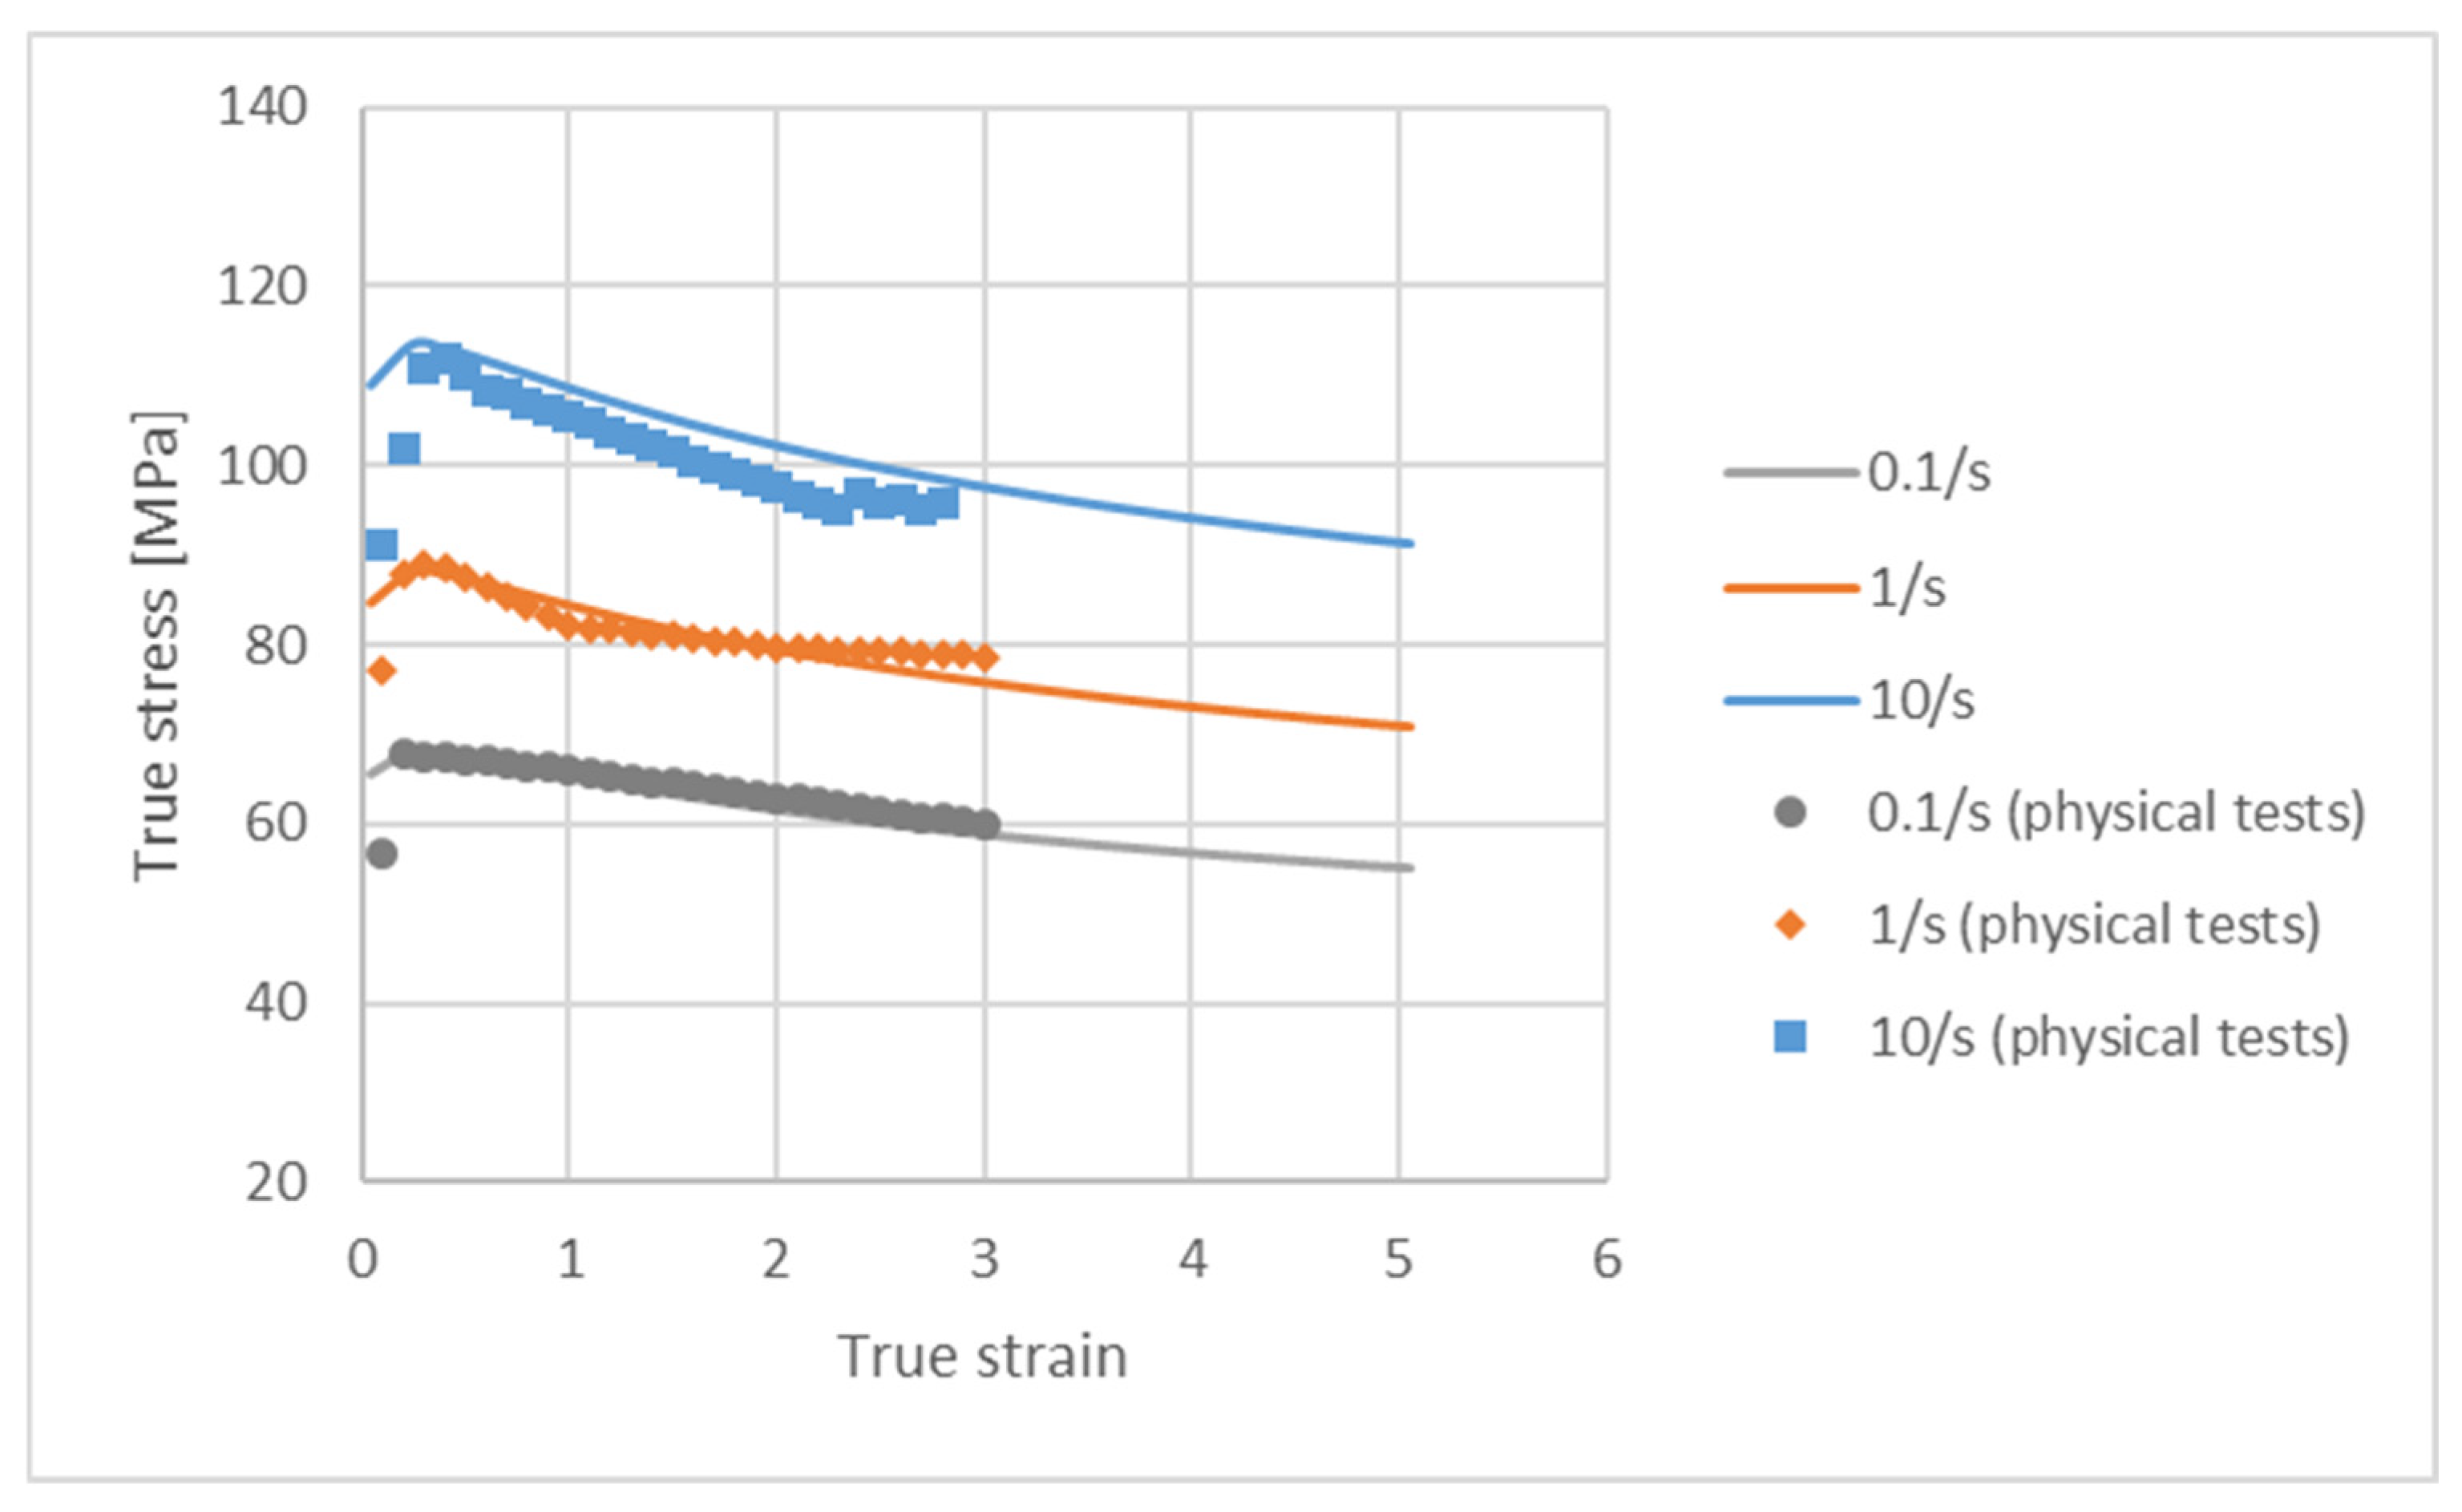
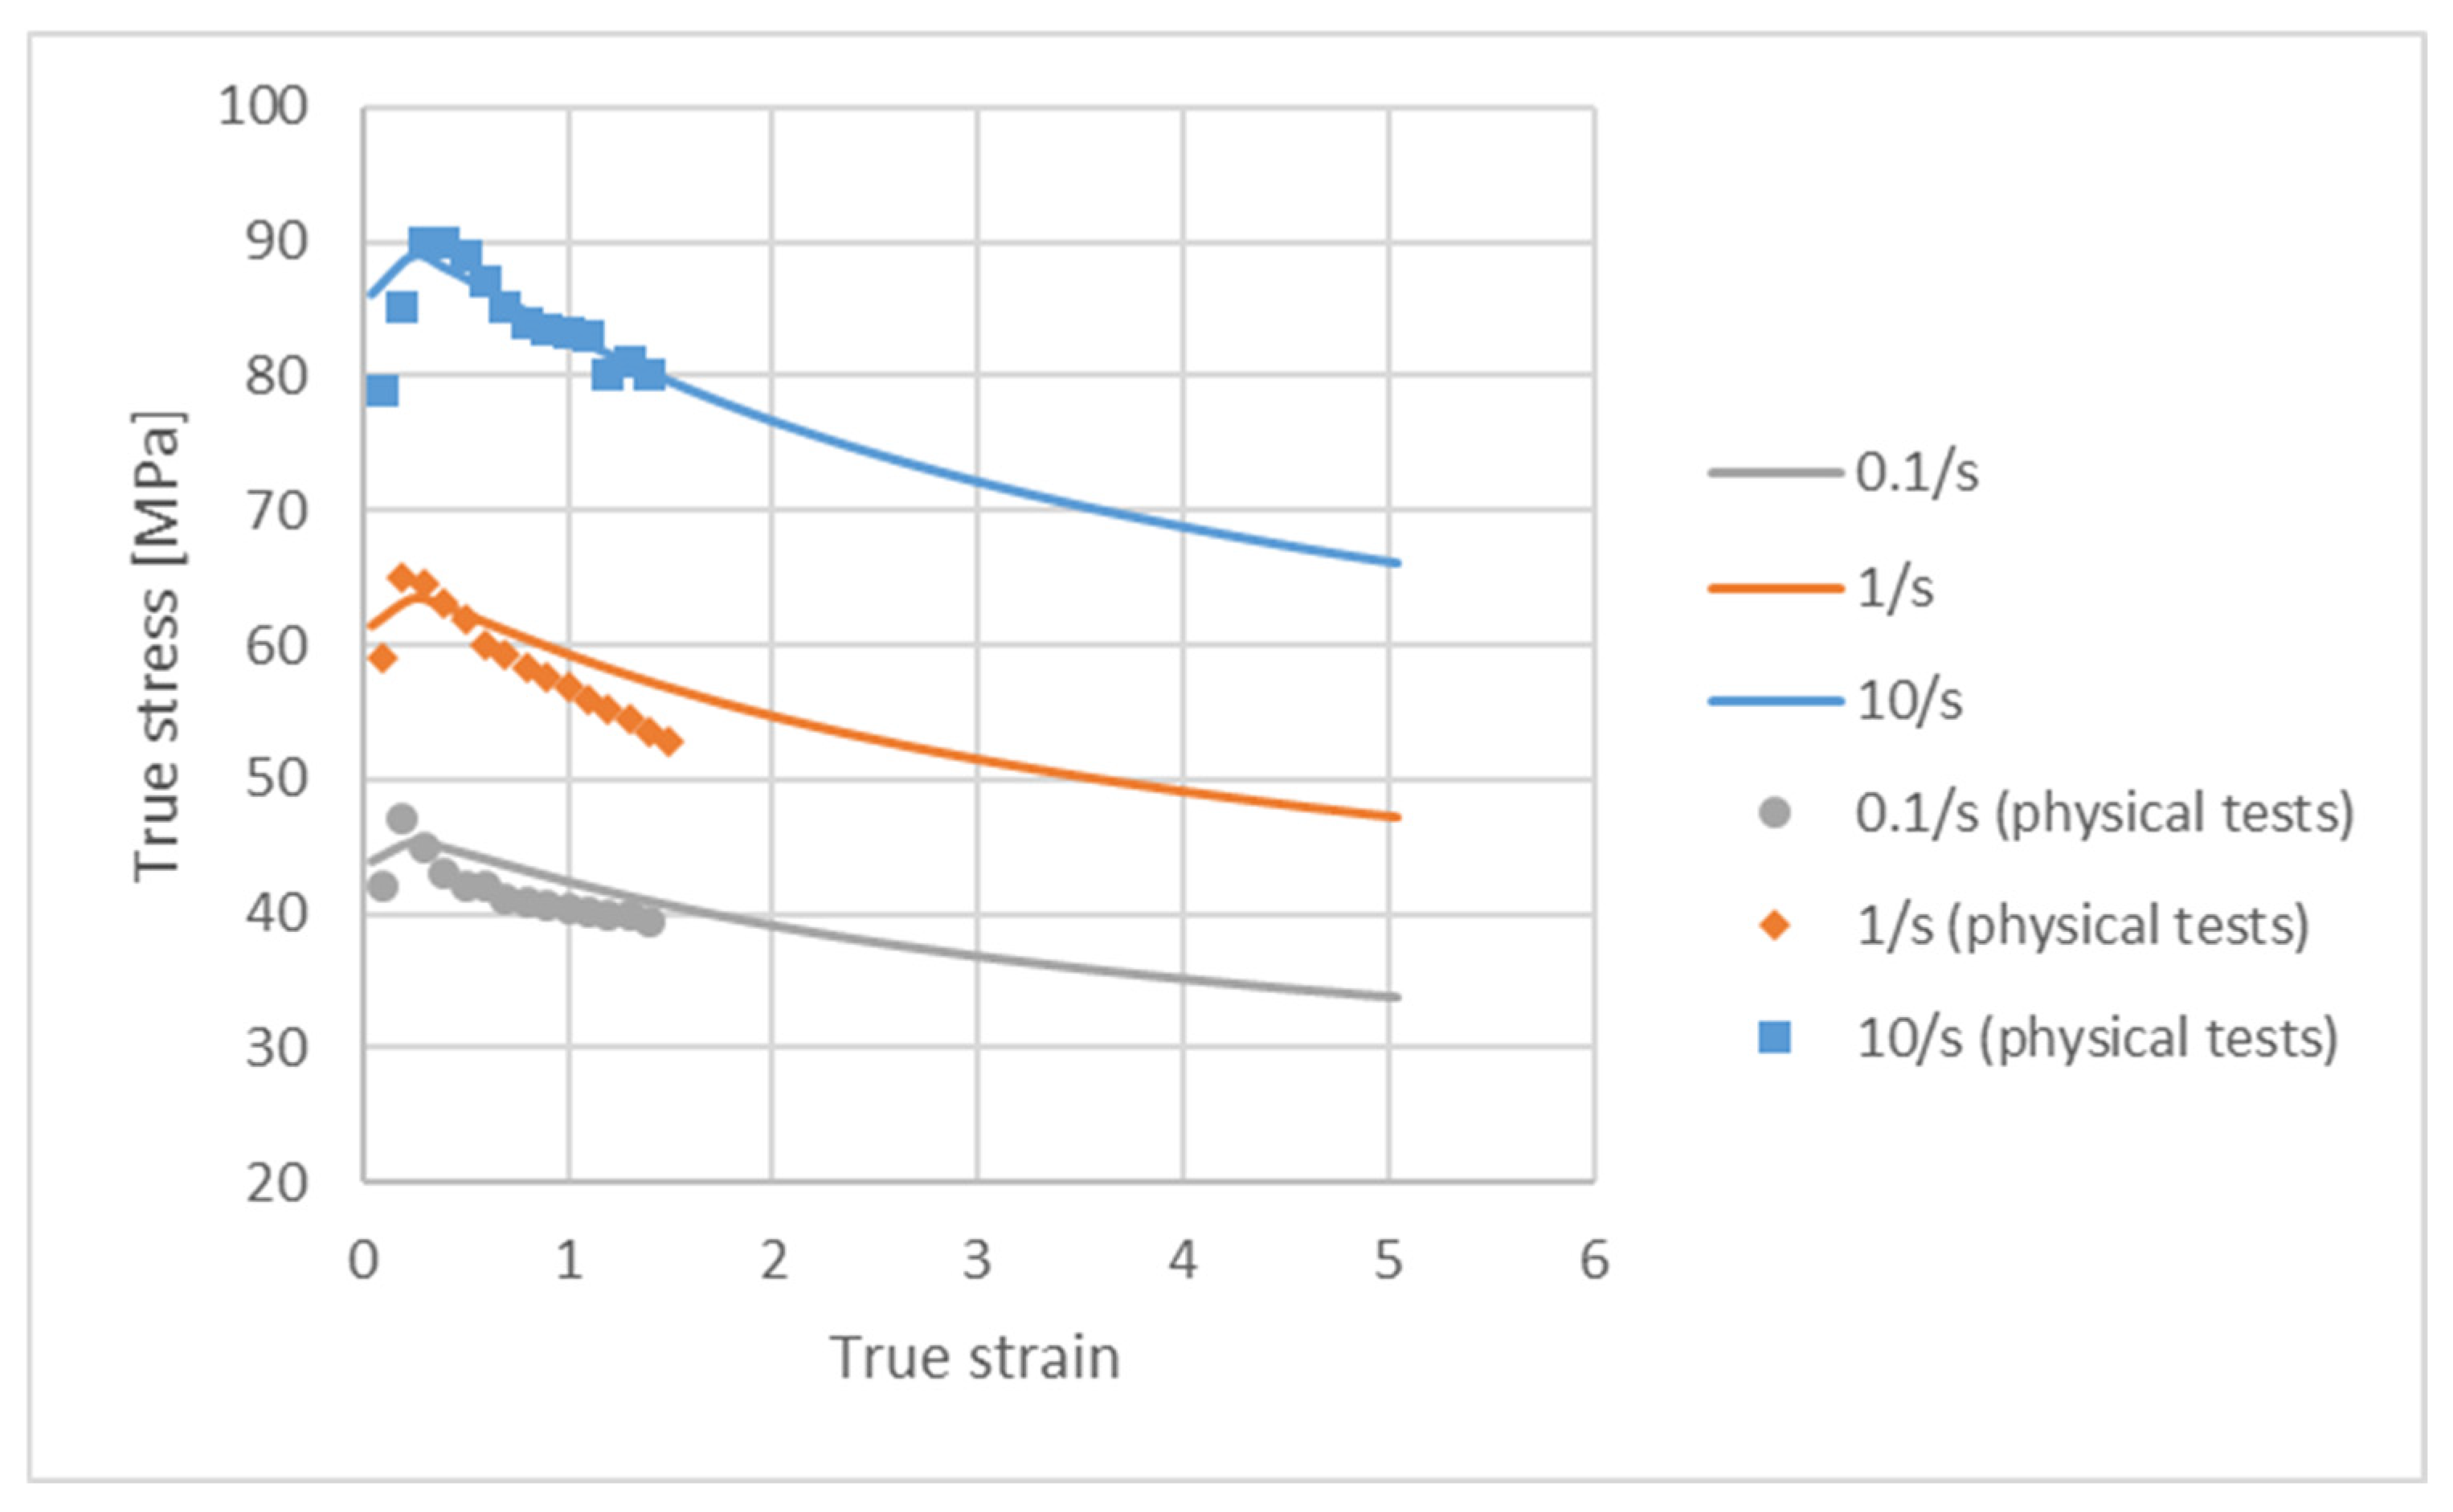
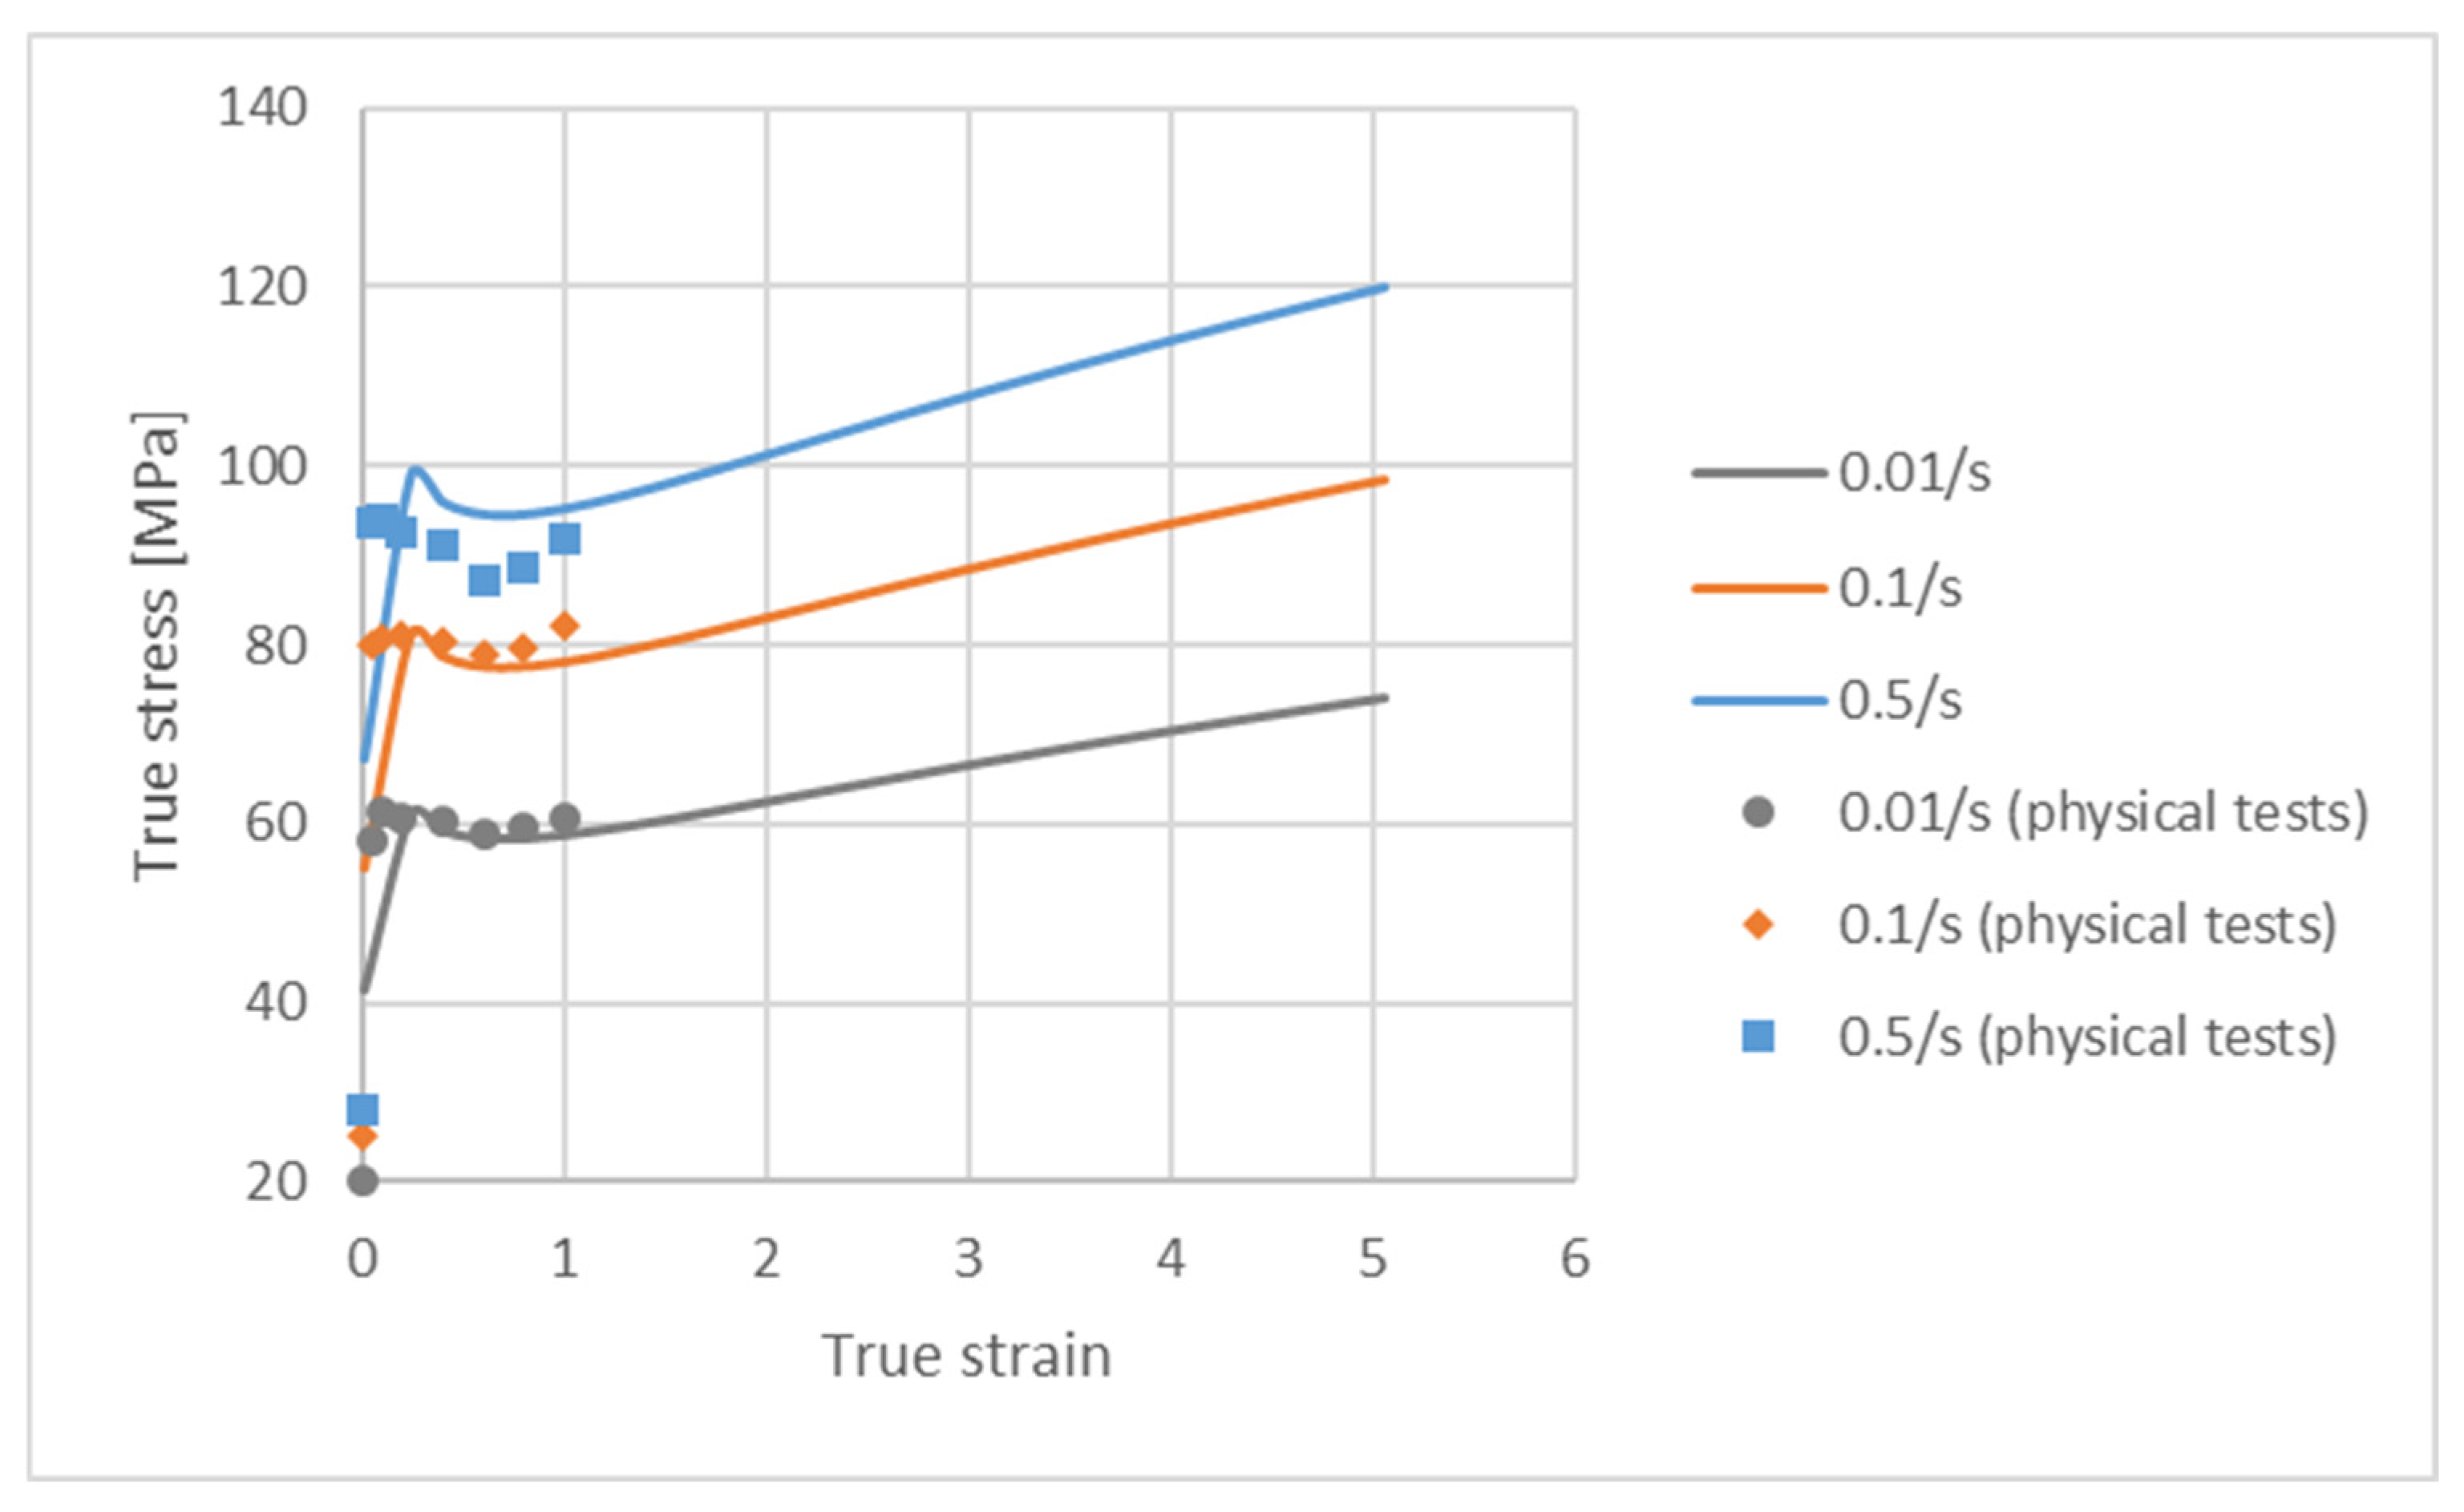
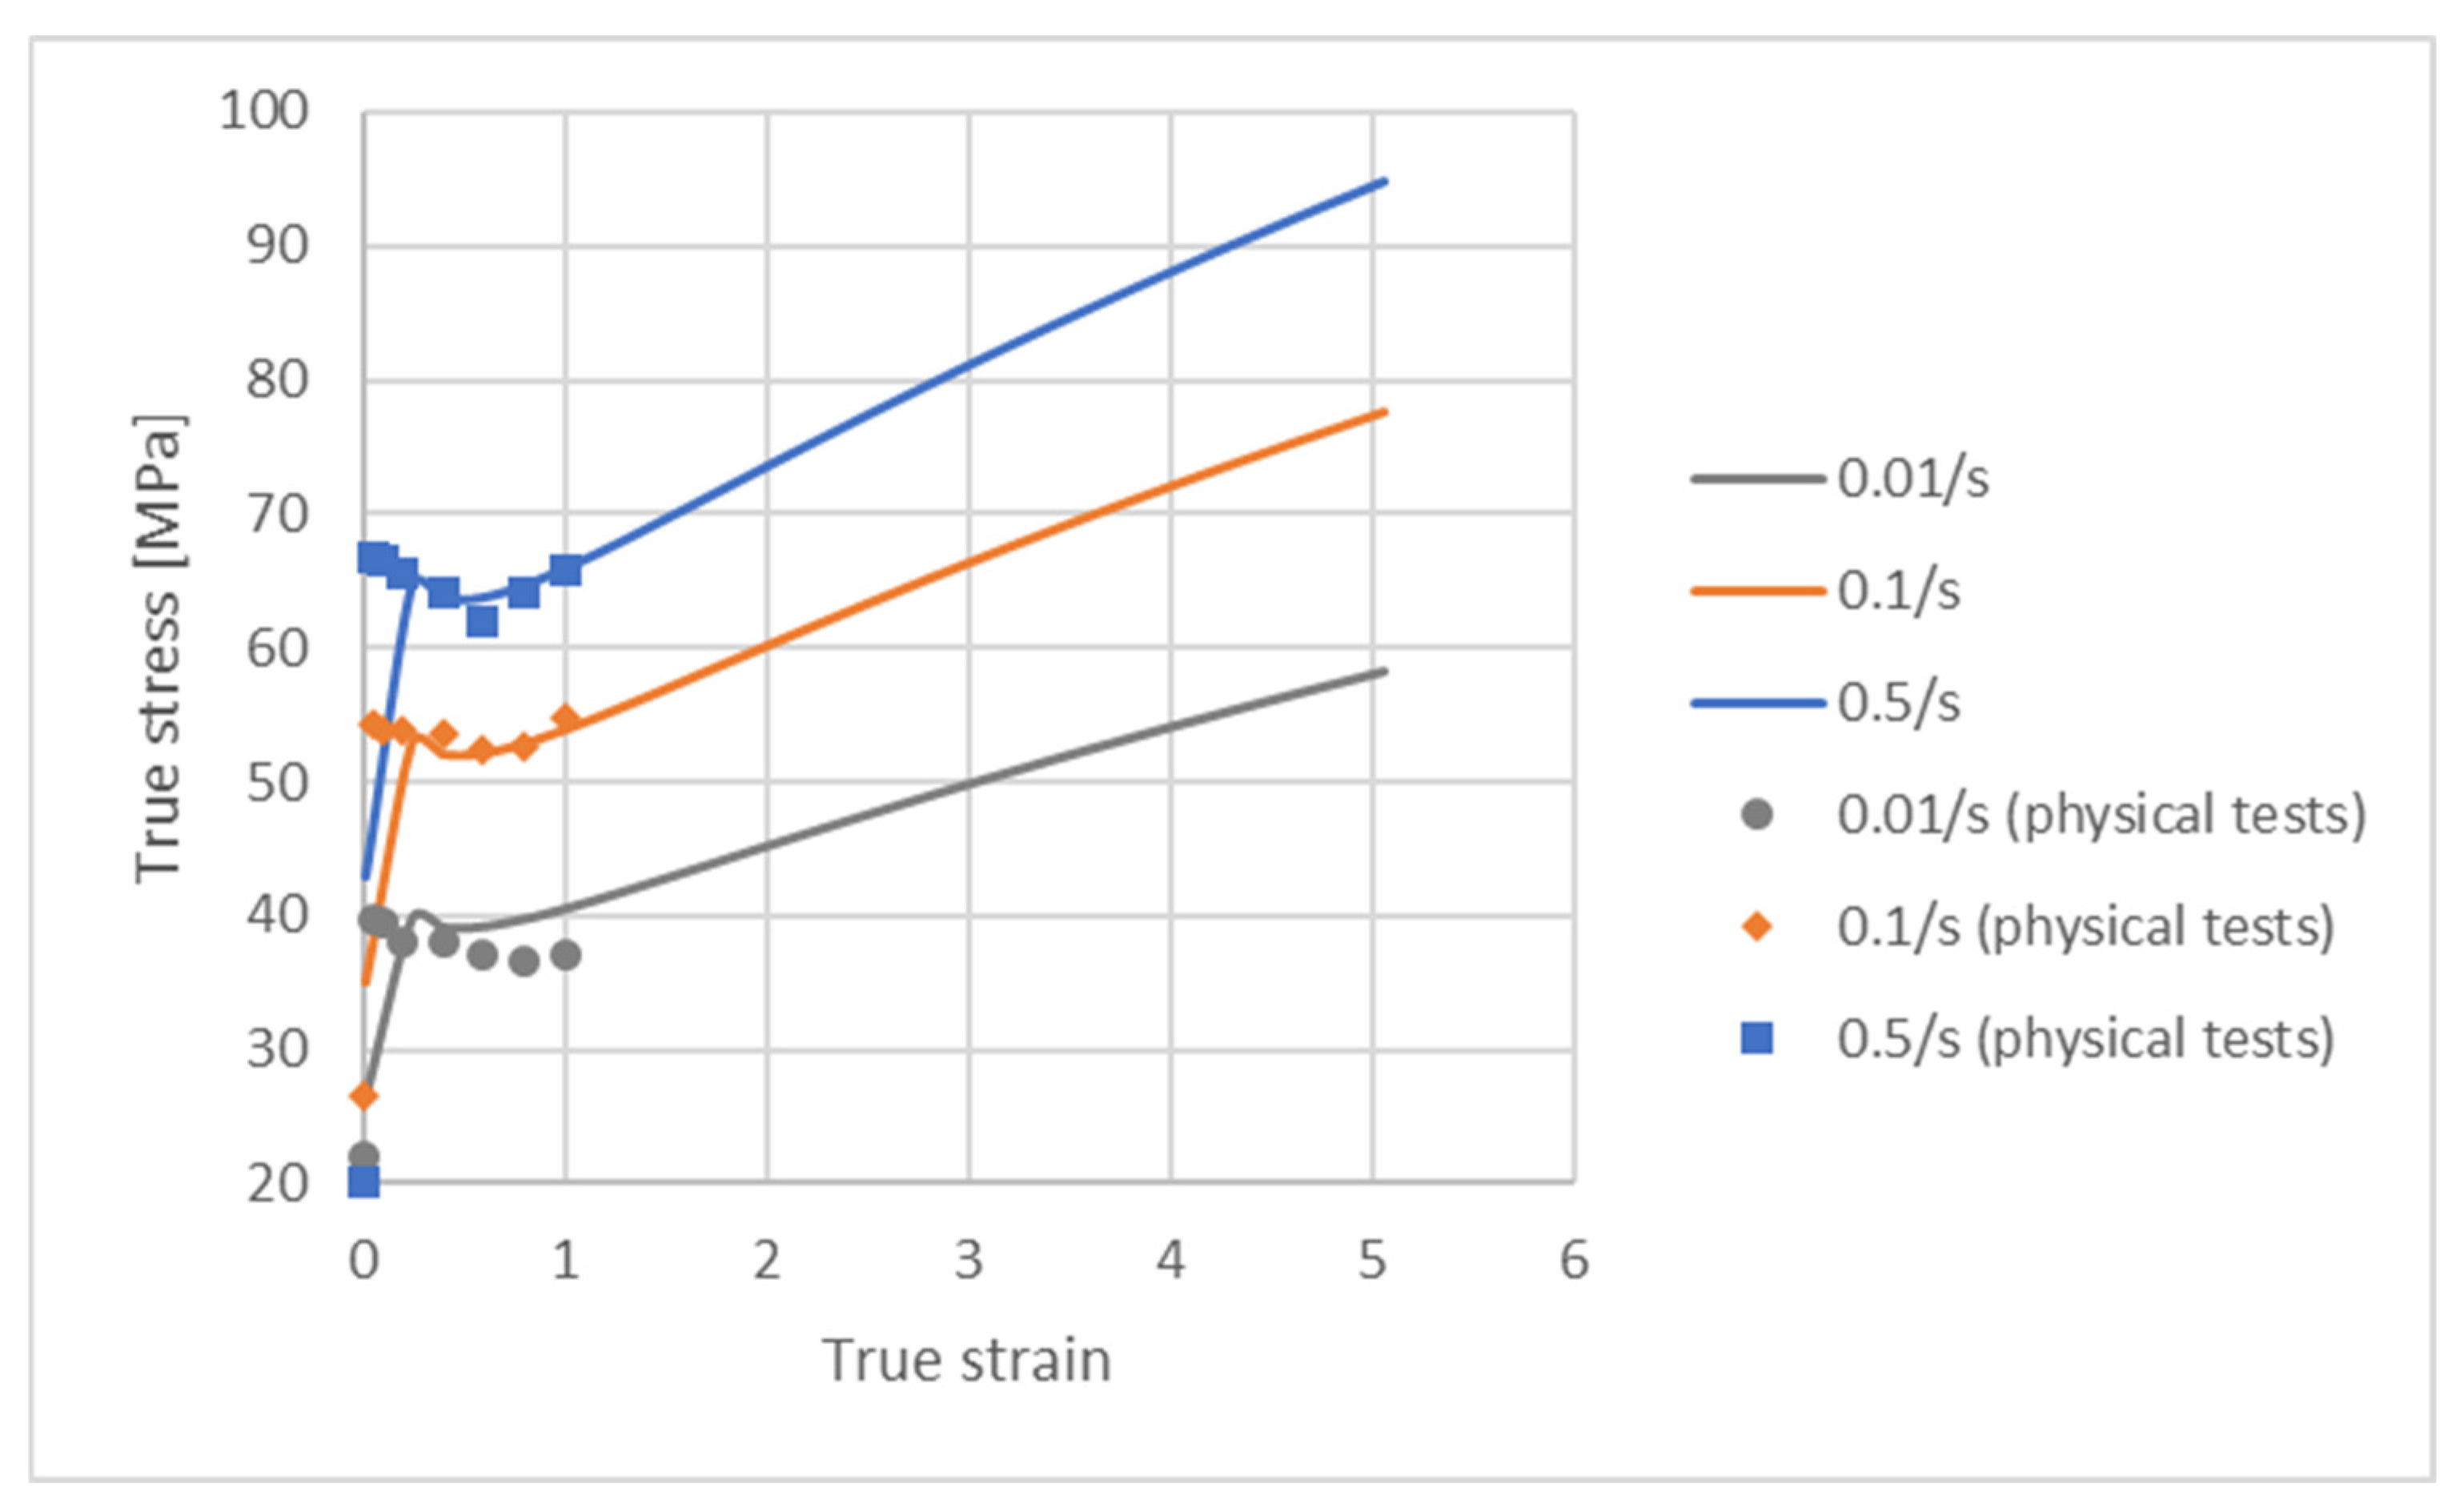
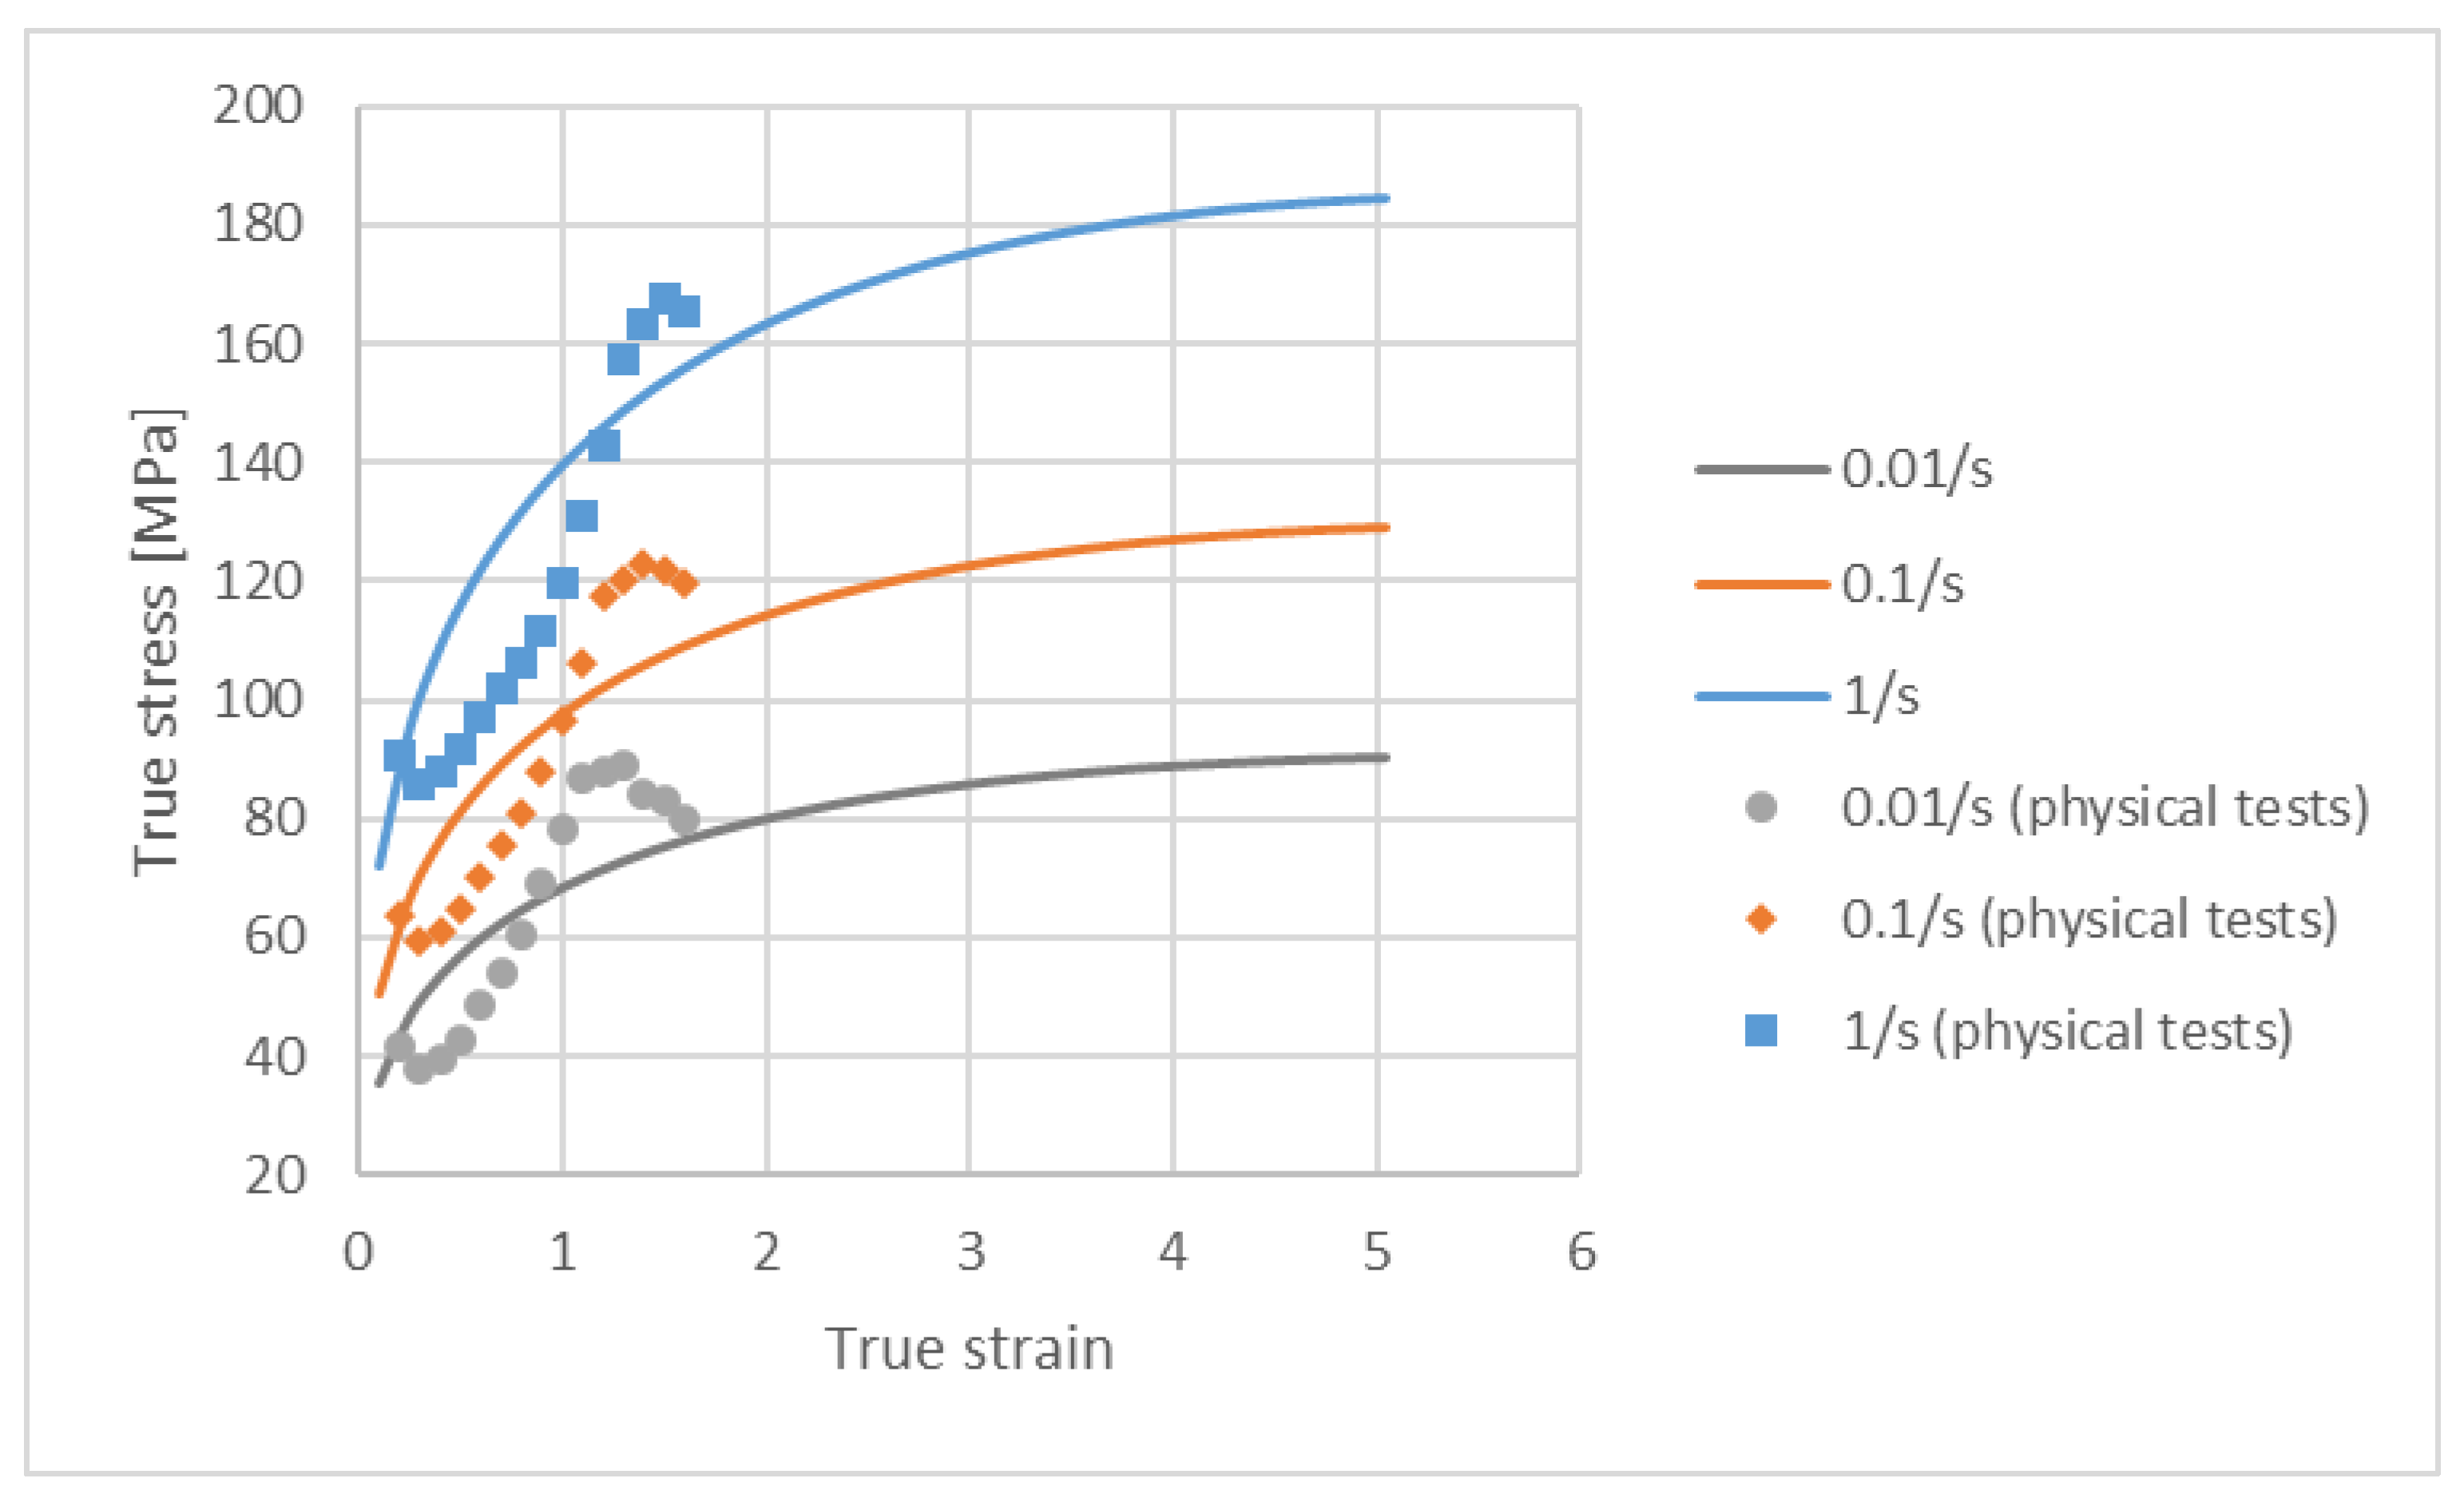
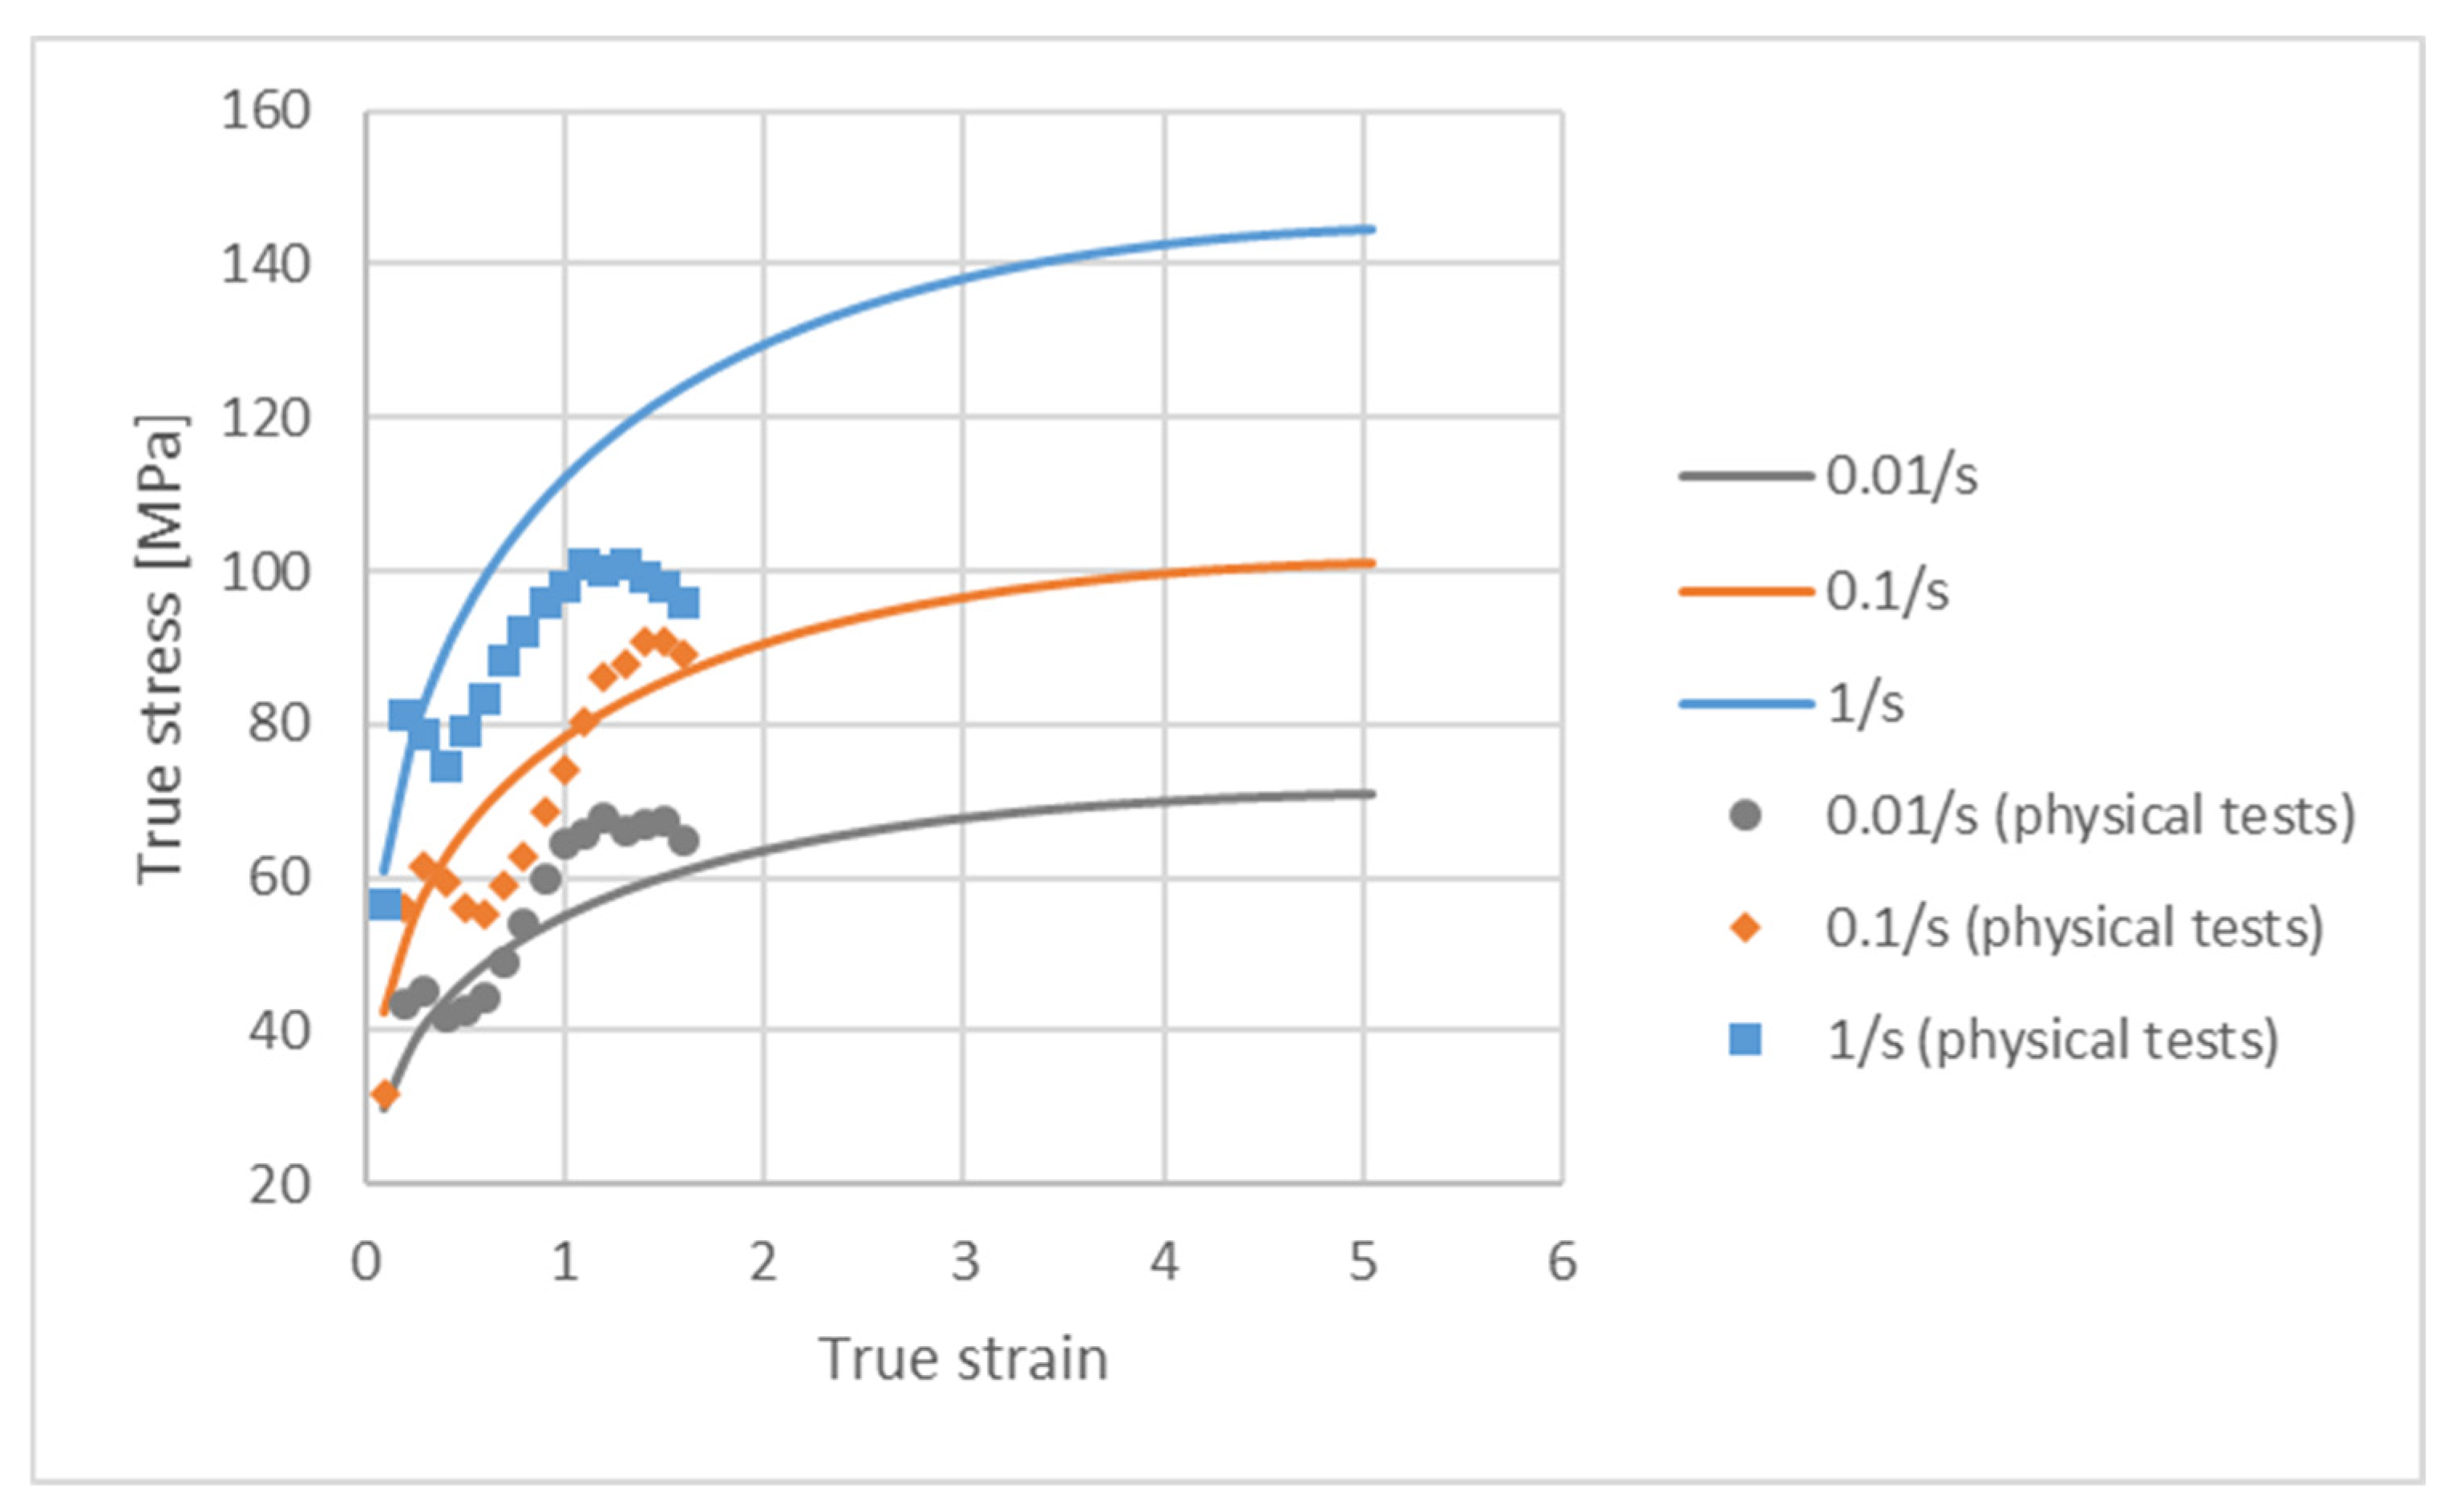
To better illustrate the results, Figure 14, Figure 15, Figure 16, Figure 17, Figure 18 and Figure 19 present flow stress curves obtained directly from experiments together with curves calculated using the corresponding Hensel–Spittel parameters. The quality of the Hensel–Spittel parameter identification was evaluated using the built-in inverse solver error metrics provided by Q-Form Extrusion v. 11.0.2, namely the mean error and the maximum local error between experimental and FEM-predicted force–displacement curves. For torsion testing, the mean error was 1.8%, with a maximum error of 26.5%, indicating very good agreement. For compression testing, the mean and maximum errors were 5.6% and 30.7%, respectively, while for spherical probe pressing, they increased to 9.8% and 33.0%. These results confirm that torsion testing provides the most reliable identification of constitutive parameters. Nevertheless, all three methods provide engineering-level accuracy sufficient for specific industrial FEM applications. For visualization purposes, the true strain range in the plots was extended to a value of five. This scaling allows a direct comparison of curve shapes within deformation ranges relevant to industrial forging and the extrusion processes of EN AW-7075. In the present study, the Hensel–Spittel model is treated as an effective engineering constitutive formulation for FEM applications, rather than as a physical description of steady-state deformation mechanisms.
Due to the clearly visible increase in friction effects observed in the compression test curves at true strain levels above approximately 0.8, data obtained at higher deformations were excluded from the analysis. As shown in Figure 8, friction significantly affects the flow stress response at higher strains. Consequently, a maximum true strain of 0.9 was selected for further analysis based on previous experience with this type of alloy. In internal studies, it was presented that this limit provides the most accurate and stable results. A similar tendency related to frictional effects was also observed in the spherical probe pressing tests, where increased friction influenced the shape of the obtained flow stress curves and affected the quality of model fitting. Consequently, the deformation range and calculation limits adopted for this method were determined based on preliminary analyses and the authors’ prior experience, ensuring consistent and reliable input data for the constitutive modeling.

4. Extrusion FEM Simulations and Physical Tests

The developed material models were used for numerical simulations of the extrusion process performed with the Q-Form Extrusion software. Q-Form Extrusion was selected due to its dedicated implementation for metal-forming processes, including built-in extrusion modules and industrially material models, as well as its routine use by the authors and their industrial partners in practical extrusion process design. The primary objective of these simulations was to verify the material parameters obtained from the three experimental characterization methods by comparing numerical predictions with results from physical extrusion trials conducted on a 5 MN horizontal press. The comparison focused on key technological parameters such as extrusion force and profile temperature, which can be directly measured during industrial extrusion.
For the FEM analyses, three flat dies were selected:
  • Flat die for an 80 × 5 mm profile (extrusion ratio ≈ 18);
  • Flat die for a 45 × 5 mm profile (extrusion ratio ≈ 34);
  • Flat die for an 80 × 3 mm profile (extrusion ratio ≈ 33).
The remaining process parameters were as follows:
  • Ram speed: 0.5–1.5 mm/s;
  • Billet and tool temperatures: 470–480 °C;
  • Container diameter: 100 mm;
  • Billet length: 150–170 mm.
For FEM simulation, standard (developed based on previous tests and projects) material parameters were used, all presented in Table 3. Friction at the billet–tool interface was described using the Levanov friction model, with a friction factor equal to 1 and a Levanov coefficient of 1.25.
The Q-From Extrusion software is based on a numerical model with finite element method usage and a material flow formula developed by Zienkiewicz and Pittman [20,21,22], where material under deformation processes is treated as an incompressible and rigid viscoplastic continuum, while elastic strains are neglected. Calculations are based on the Euler–Lagrange model, which uses finite elements to simultaneously relate material flow to the deformation and temperature distribution of the tool. This means that the elastic deformation of the die influences the metal flow pattern, while the deformation of the tool itself is determined by the pressure of the metal on its surface [23]. The software uses two discrete models for simulation. One is the Lagrange model, which is designed to simulate the initial transient phase of the process as billets are compressed in the container and the metal fills the die (prechambers, portholes, welding chambers, etc.). The second, is a combined Eulerian–Lagrange model that simulates the steady-state phase. In the first stage, the finite element mesh moves with the flowing metal to accurately represent the die filling process. In the steady-state of the extrusion process, where material fills the die and starts to go through the die bearings, a combined Lagrange–Euler model is used, based on the assumption of complete and invariant filling of the interior of the die.
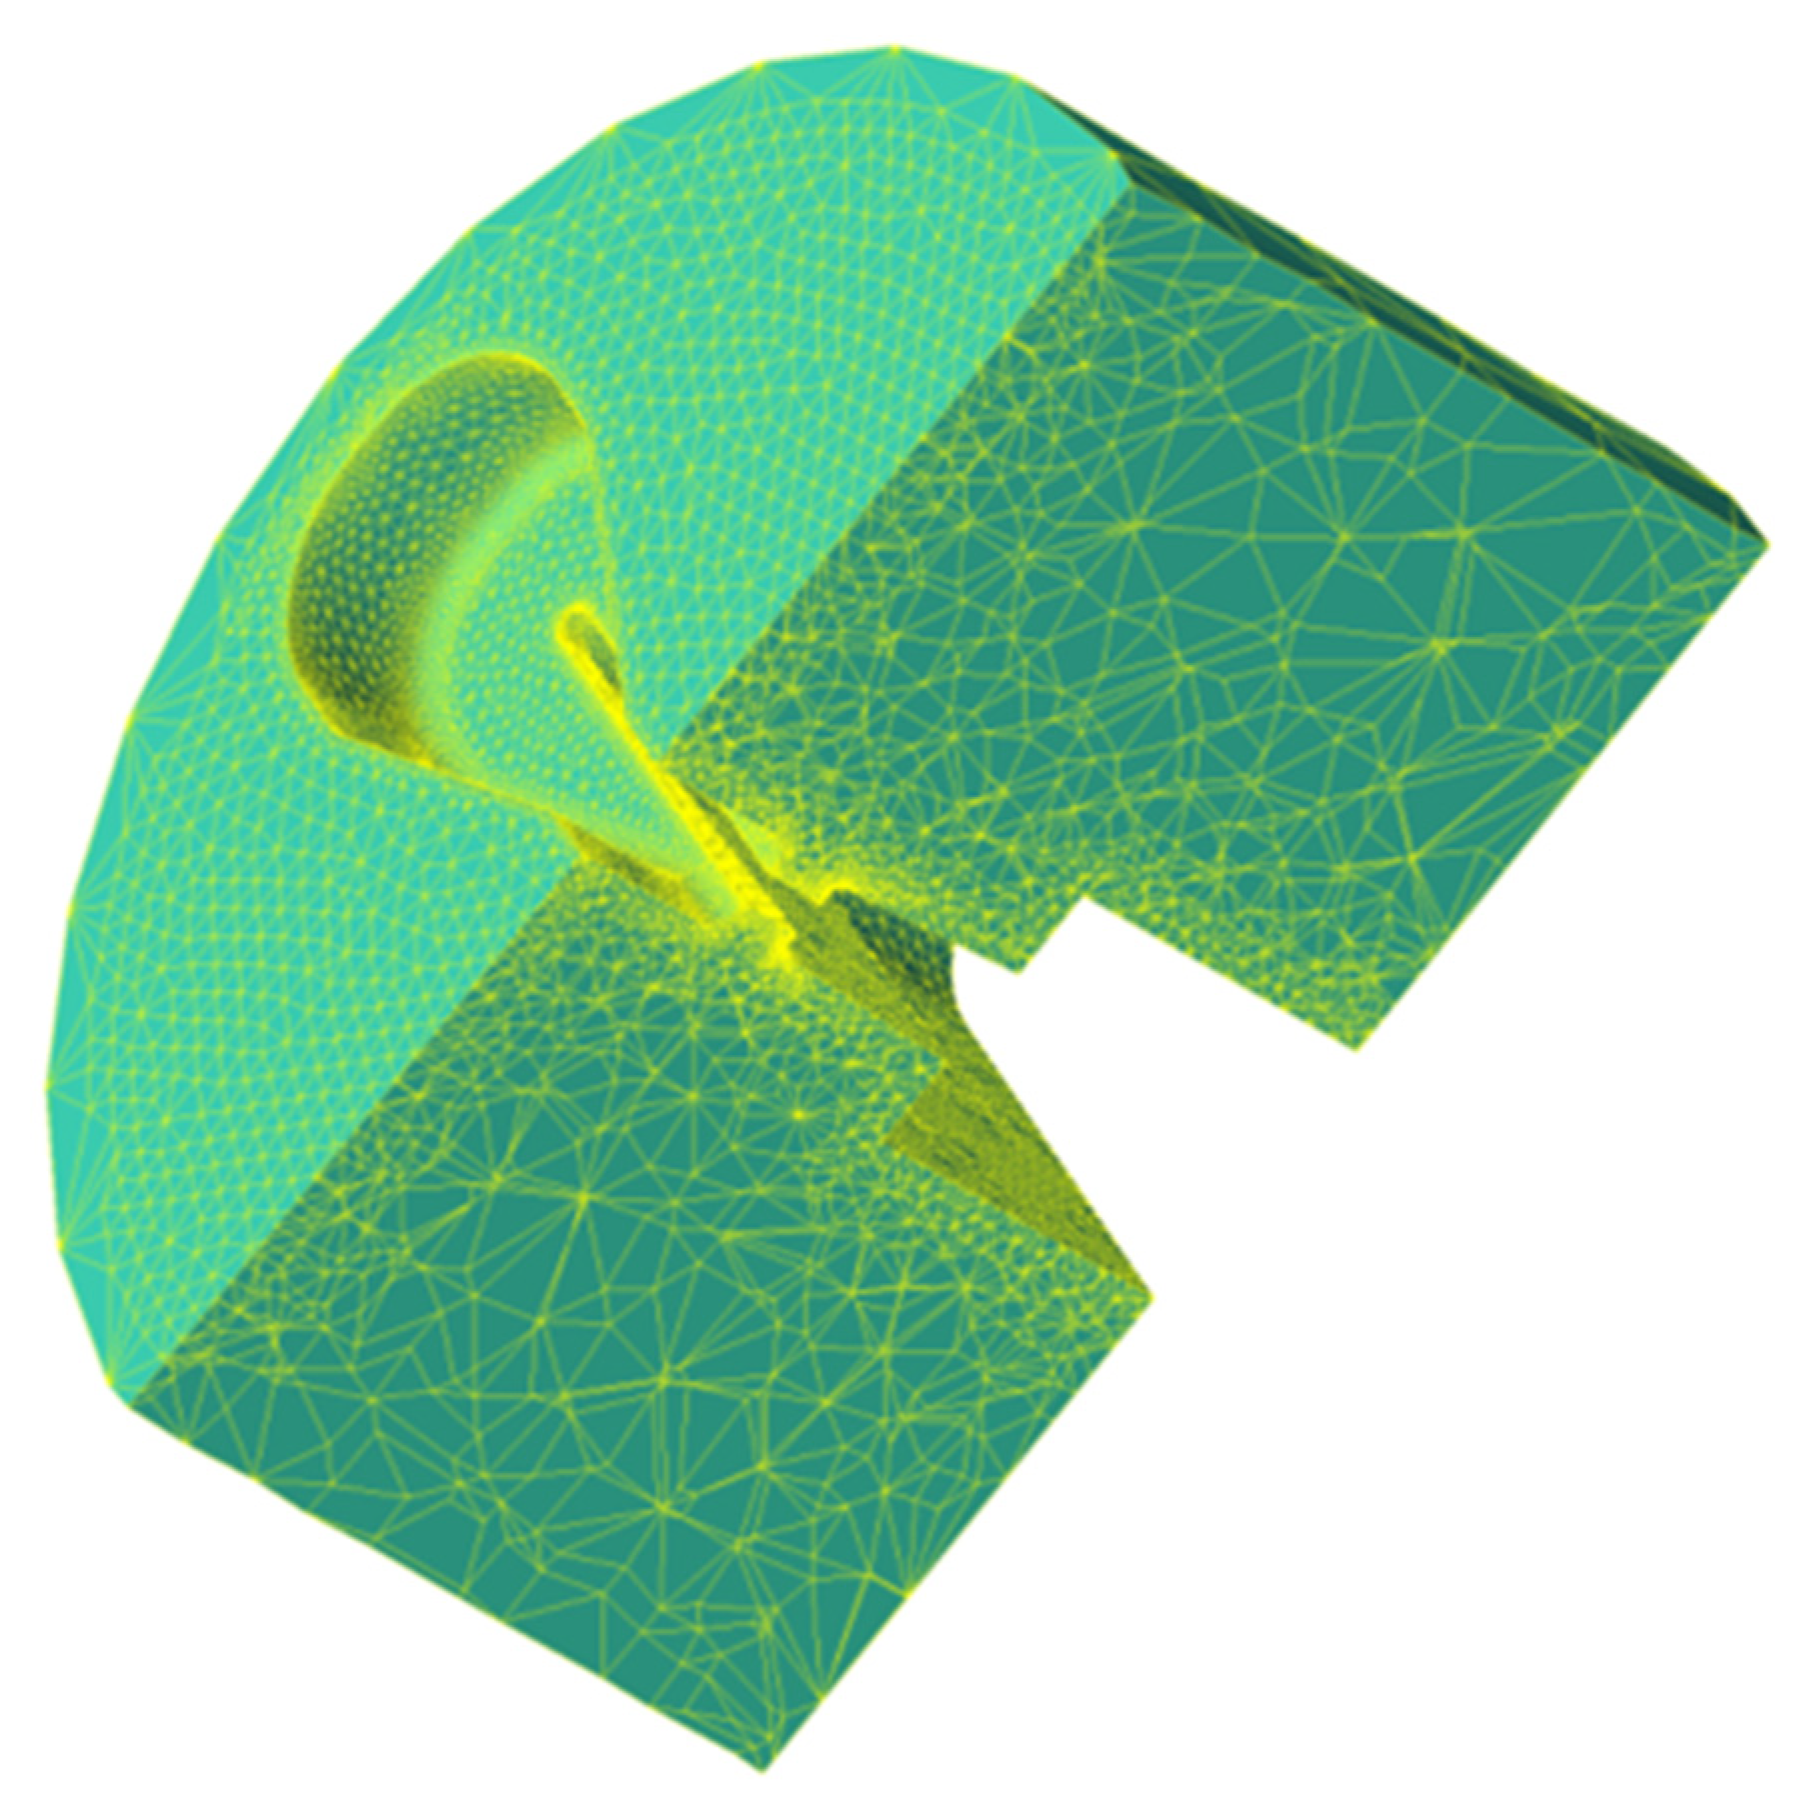
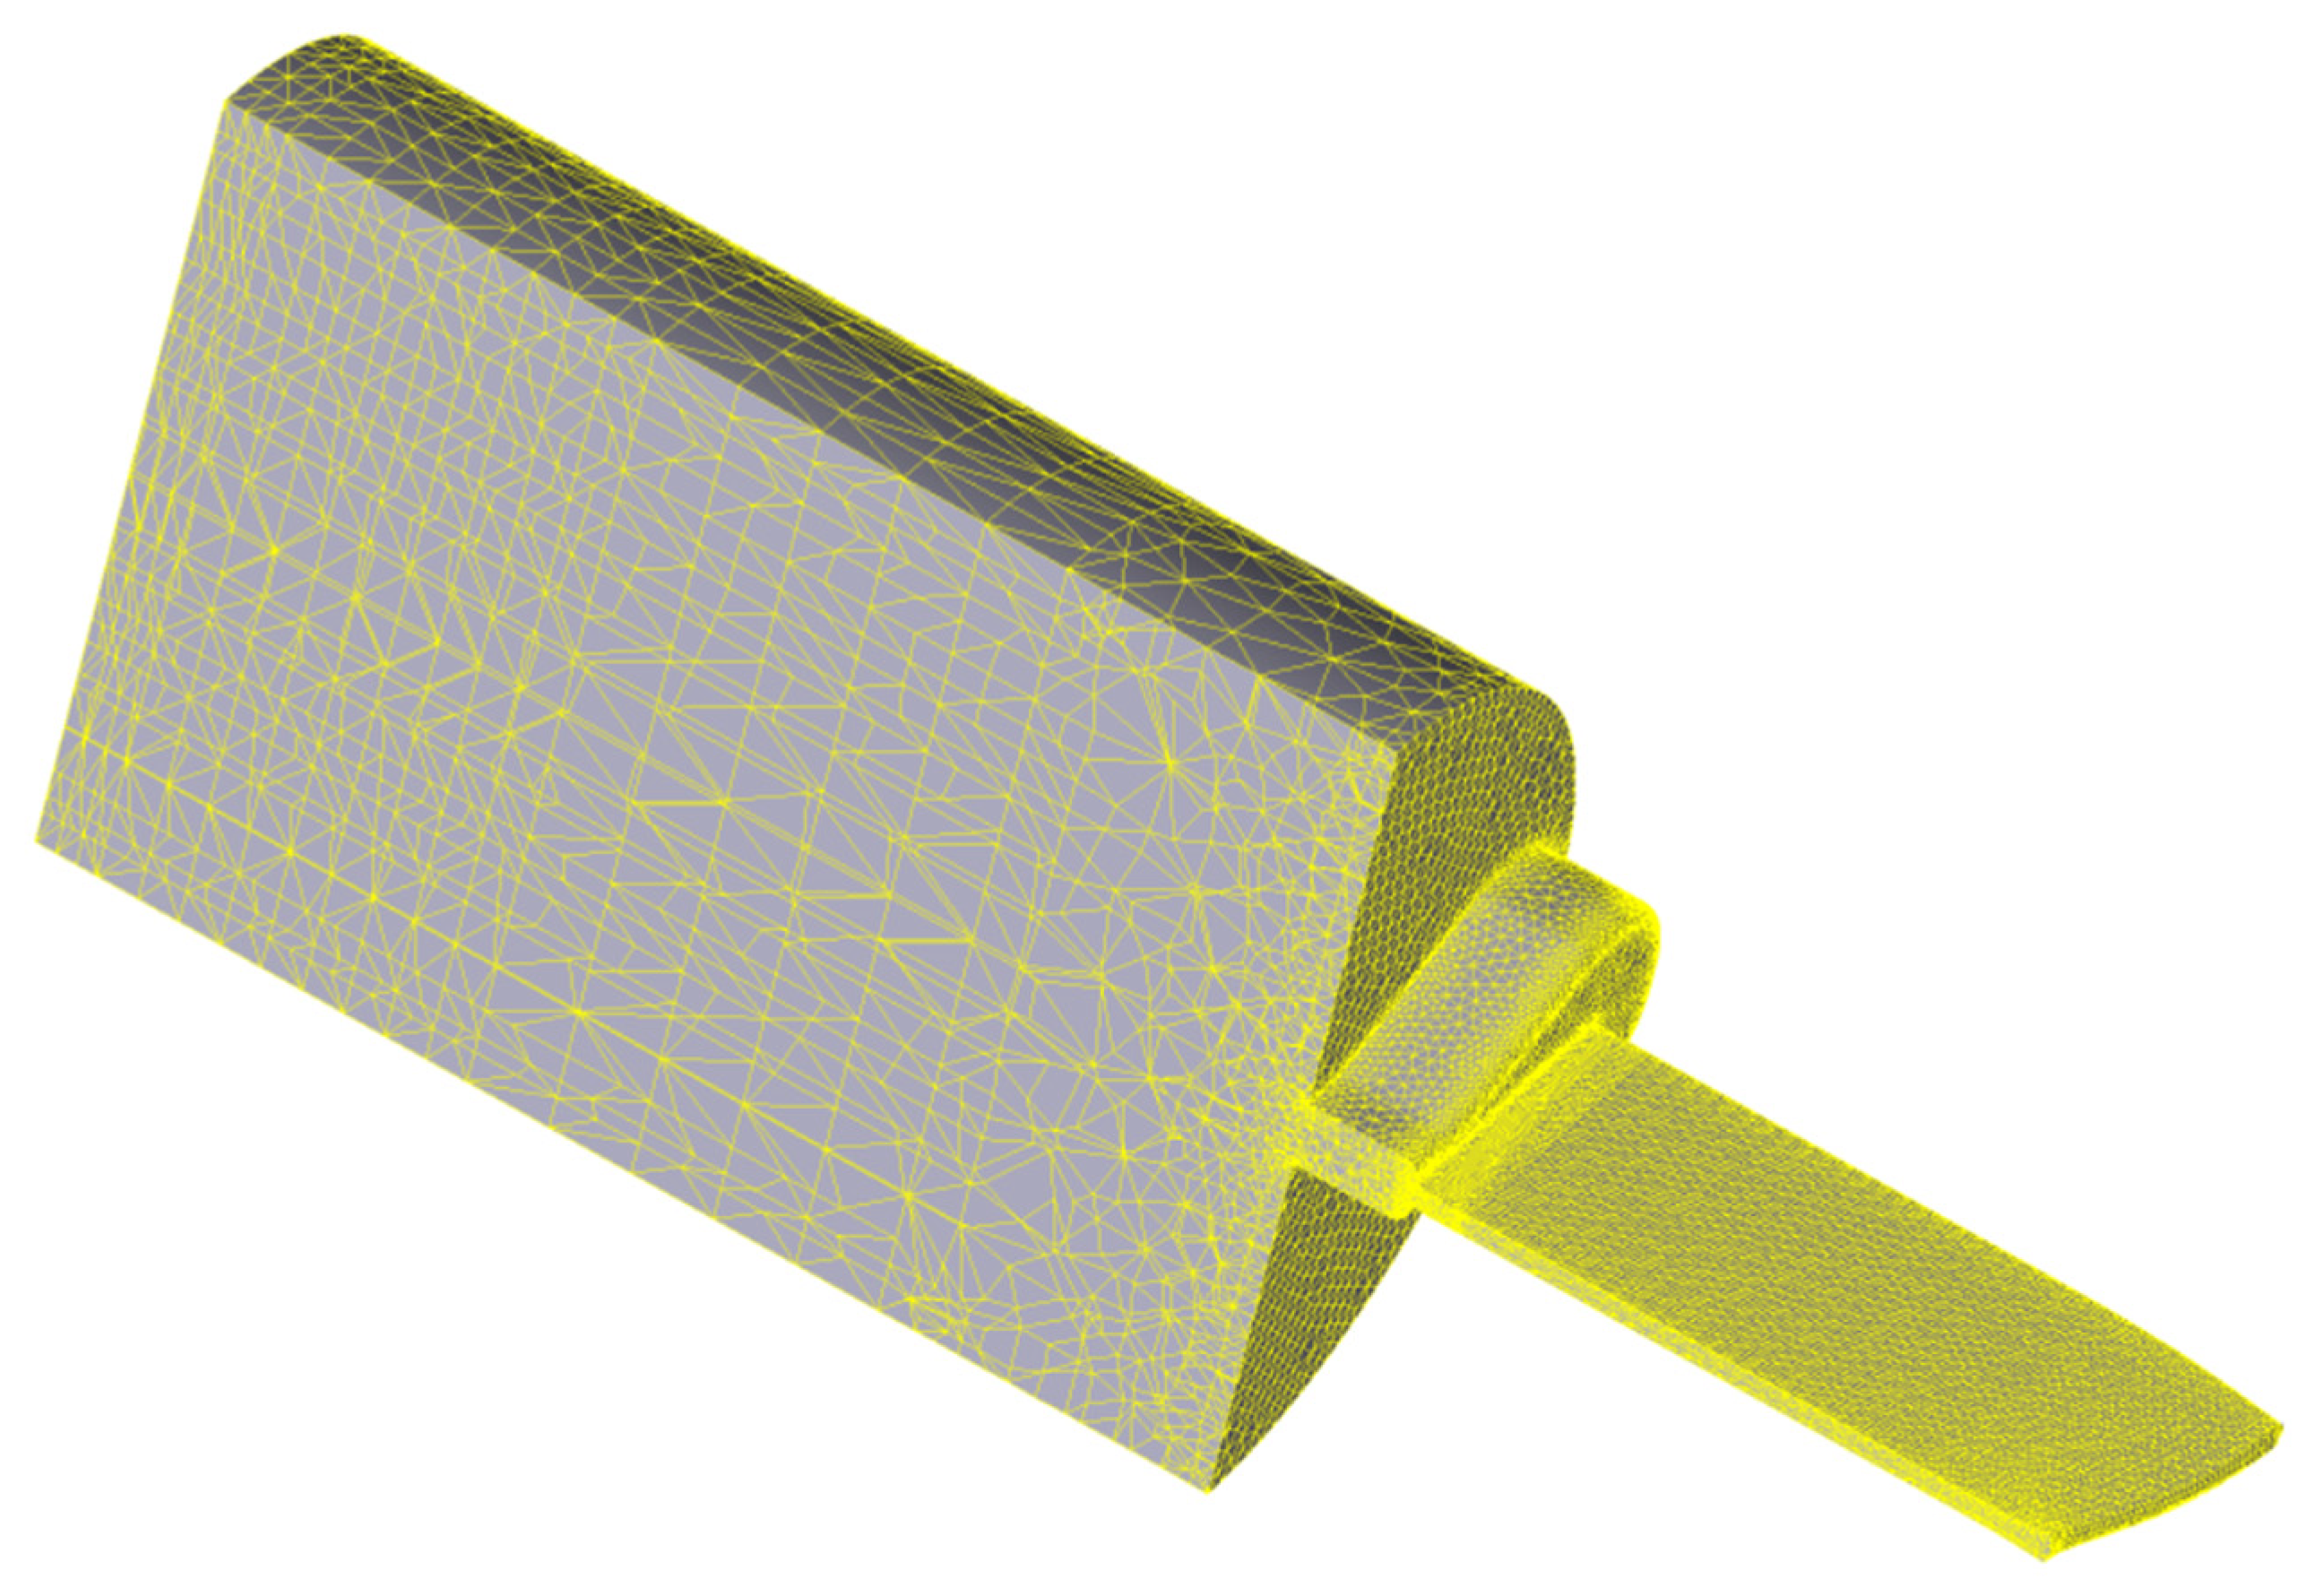
The initial finite element mesh was generated using the automatic meshing procedure implemented in Q-Form Extrusion. Depending on the profile geometry and simulation type, the billet was discretized using approximately 200,000–650,000 volumetric elements, while the extrusion dies were meshed using approximately 200,000–320,000 elements. During the simulations, automatic adaptive remeshing was applied by the solver in regions of high deformation, particularly in the die land and bearing zones, to maintain mesh quality and numerical stability.
A formal mesh convergence study was not performed, as the objective of the present work is a comparative assessment of different constitutive models under identical numerical conditions. All simulations were therefore conducted using the same mesh-generation strategy and comparable mesh densities, ensuring that the observed differences in extrusion force and temperature originate from the material models rather than from discretization effects.
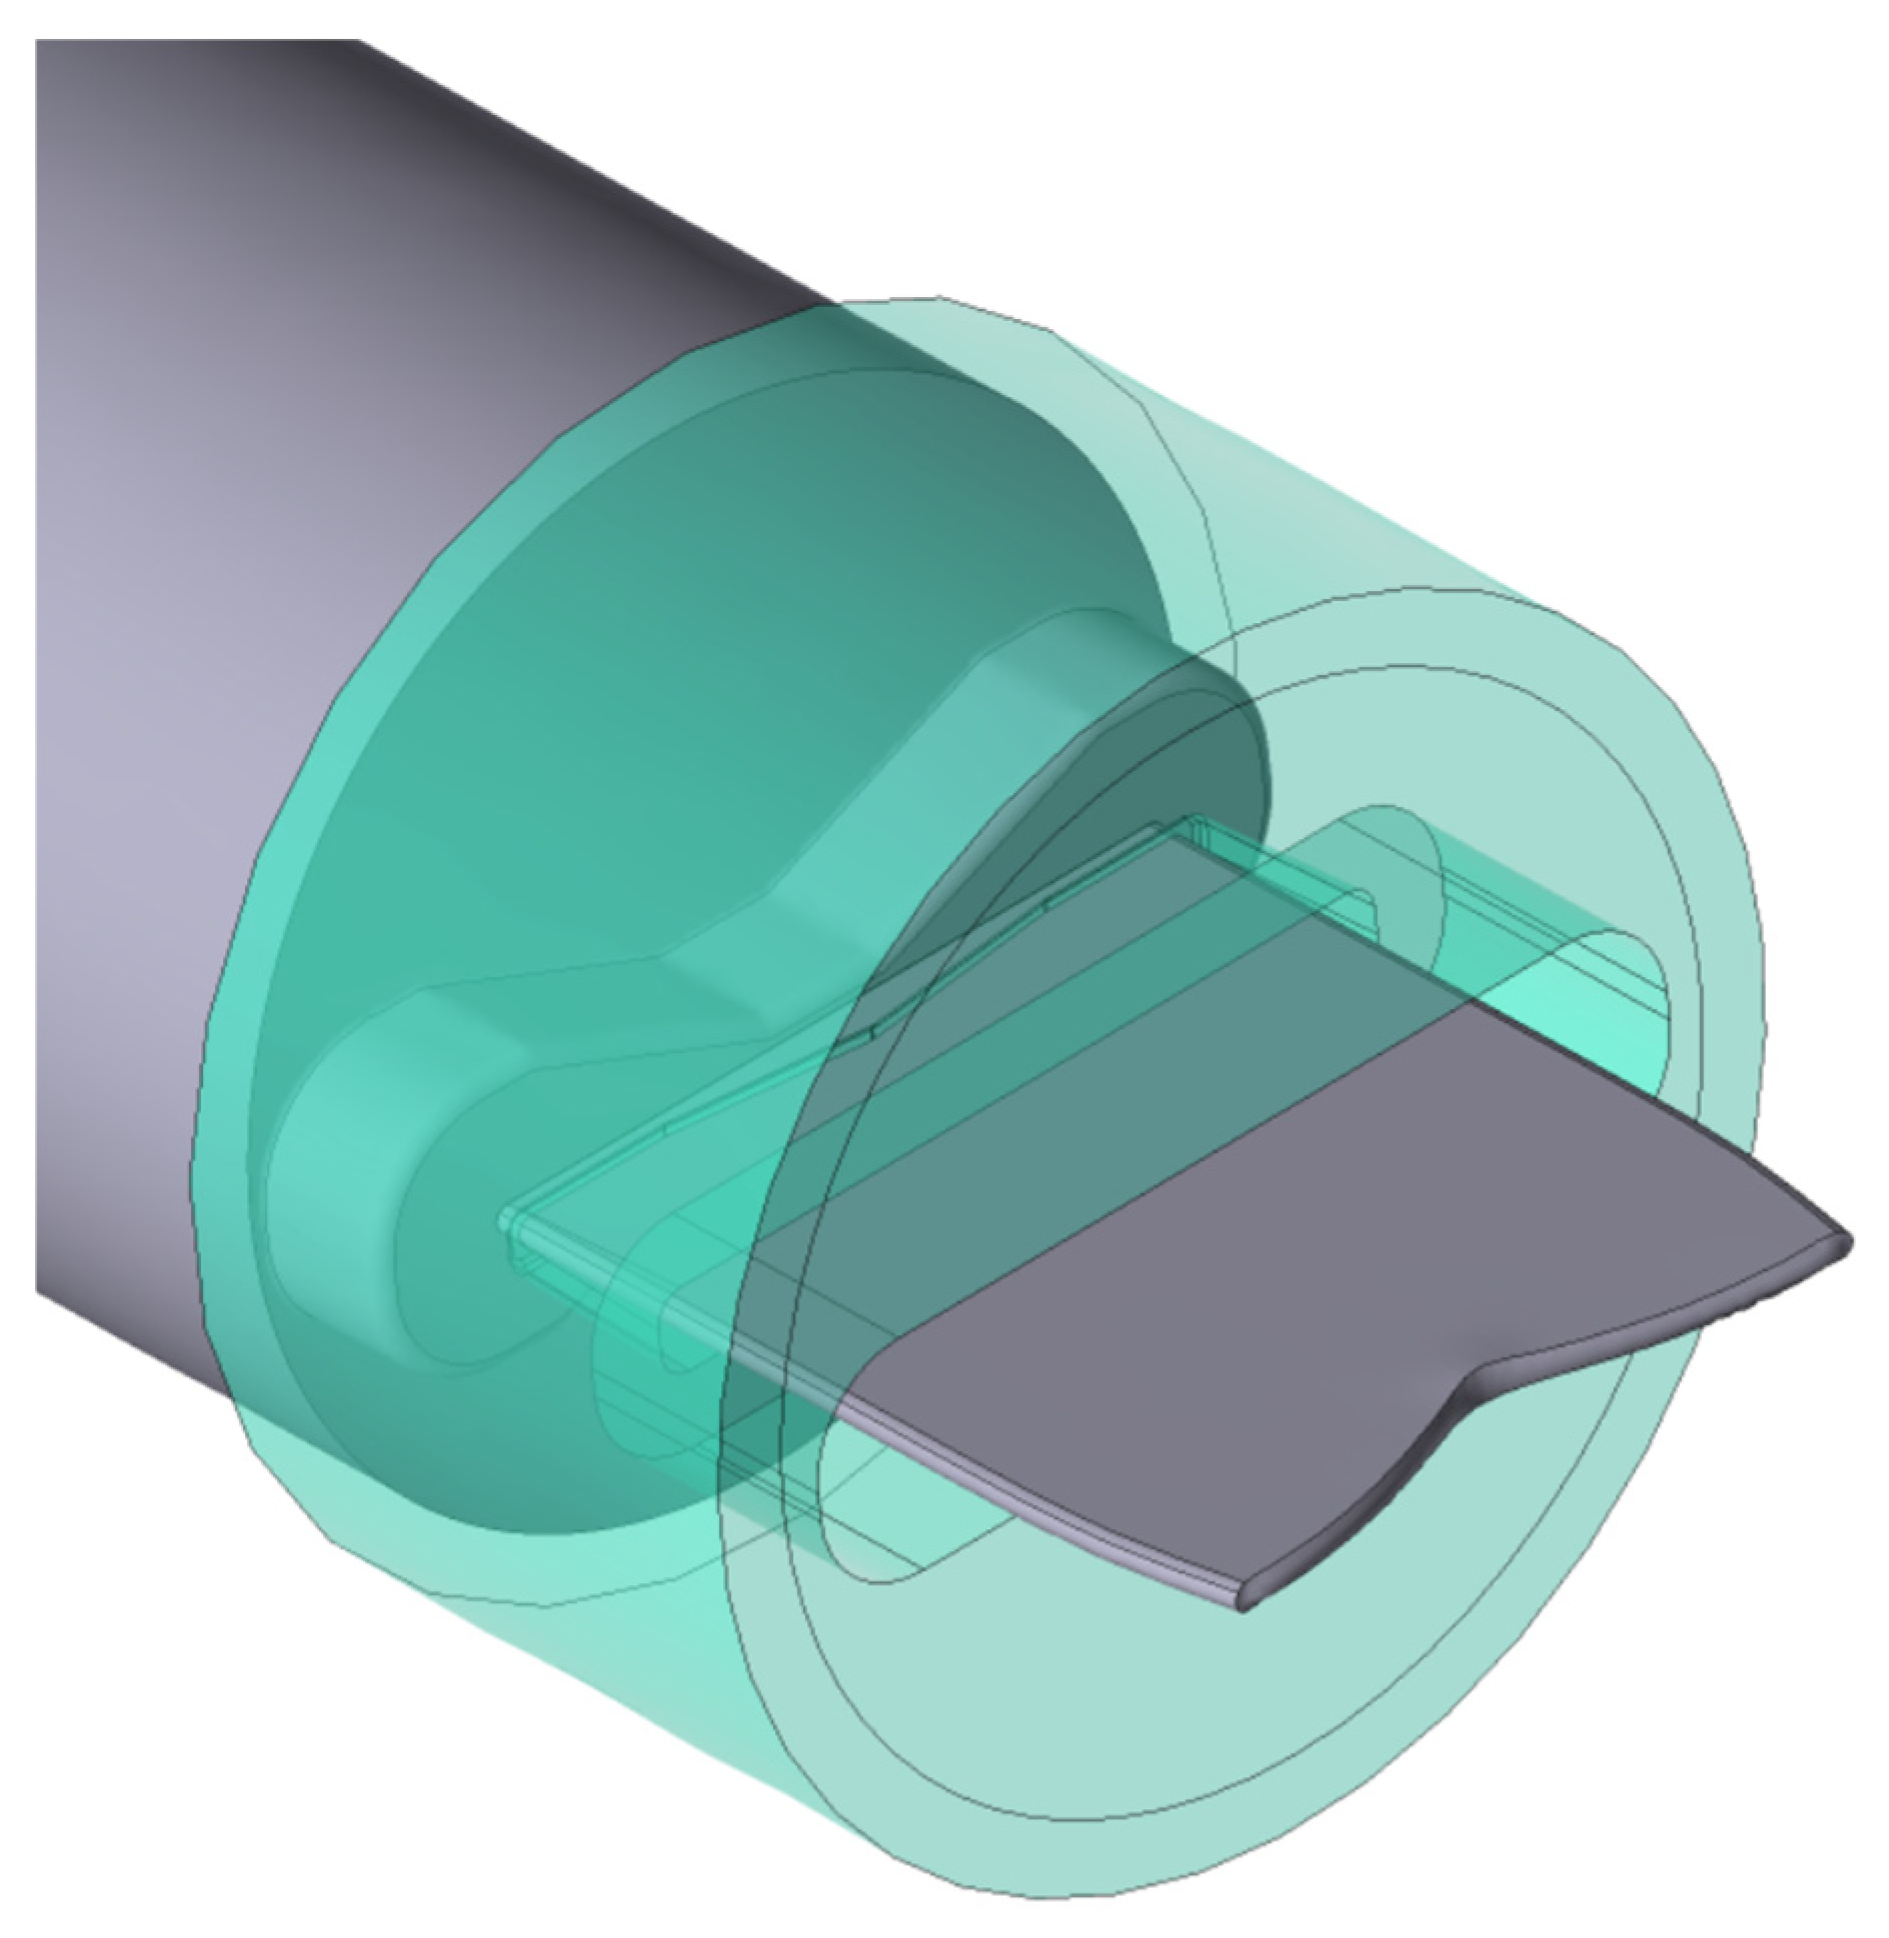
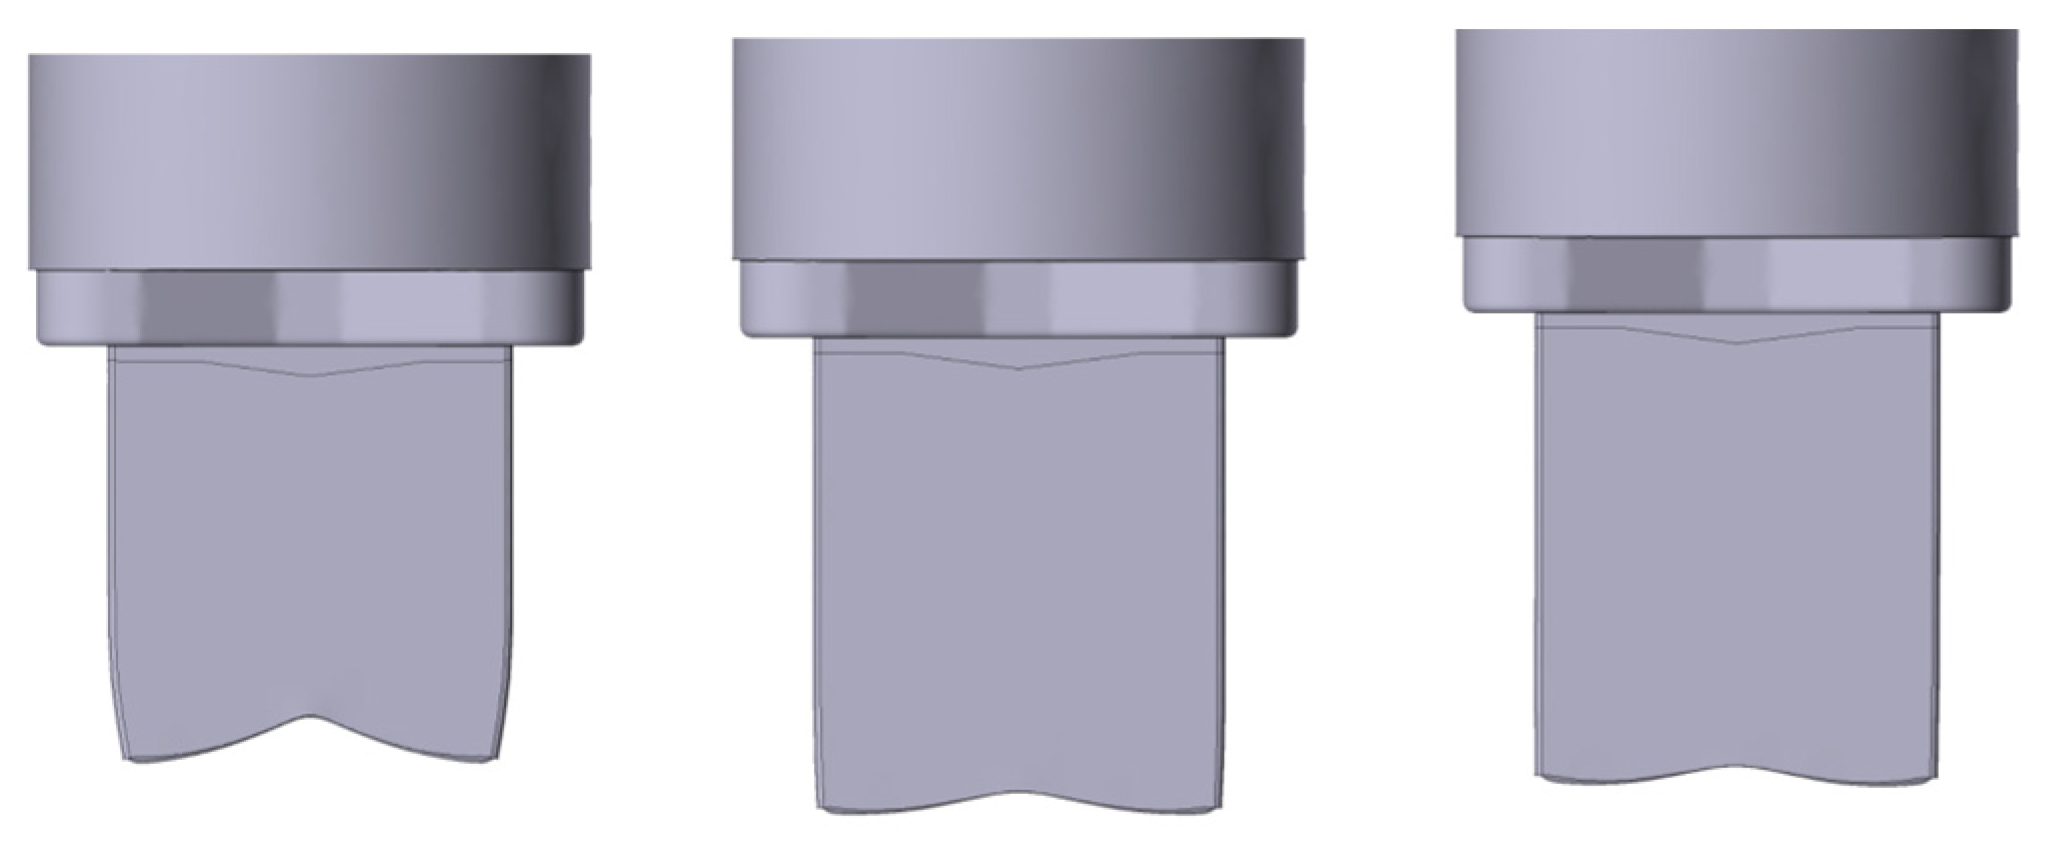
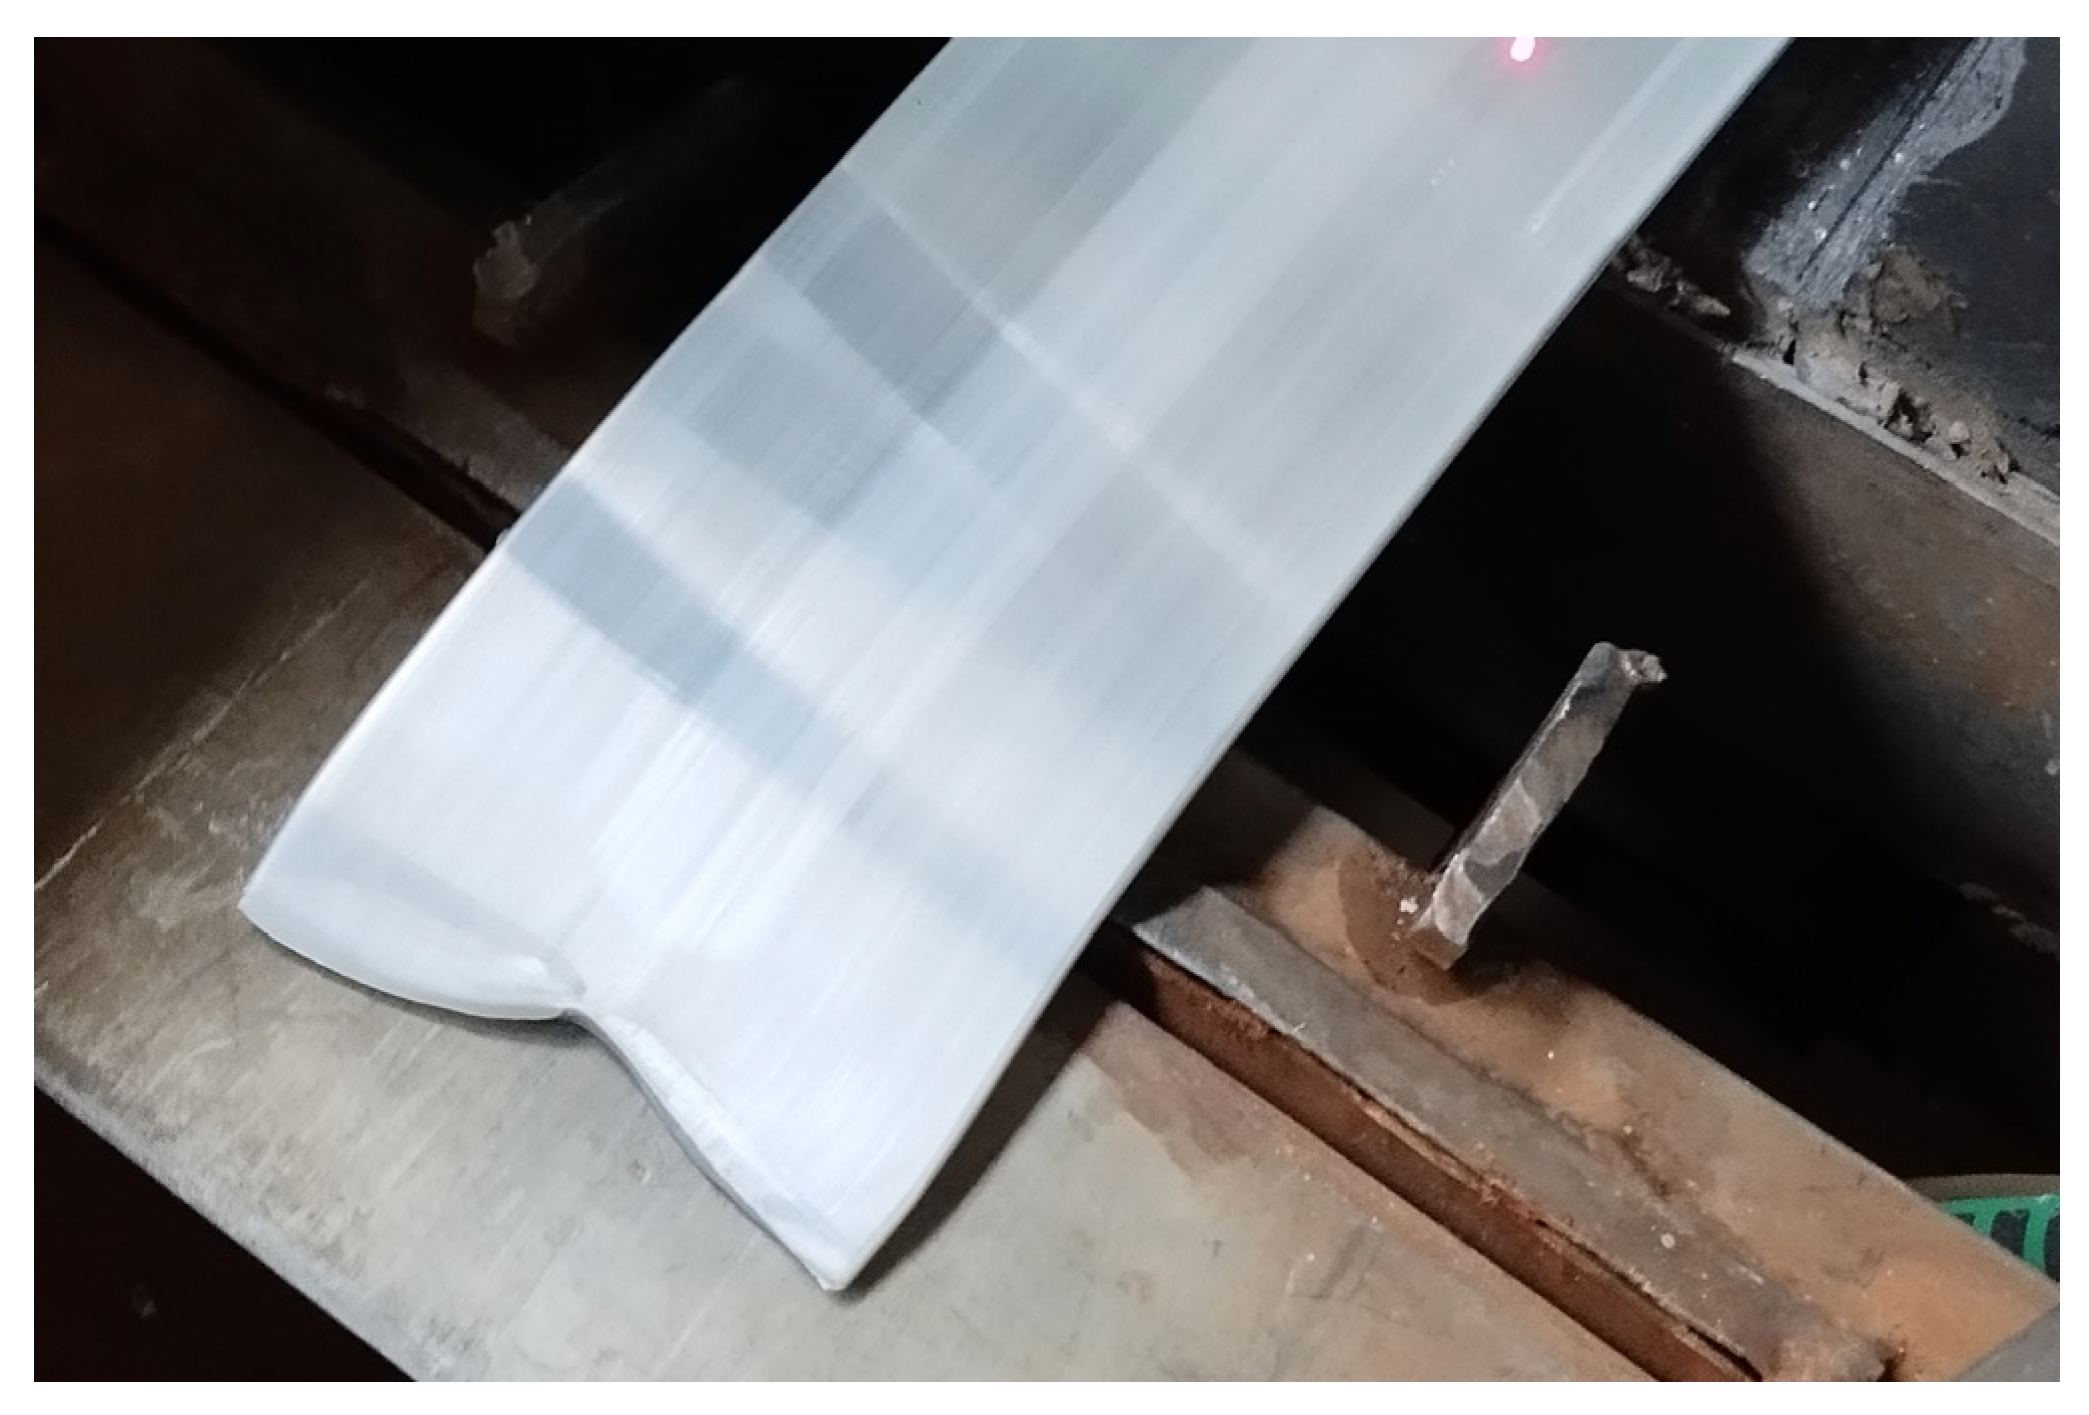
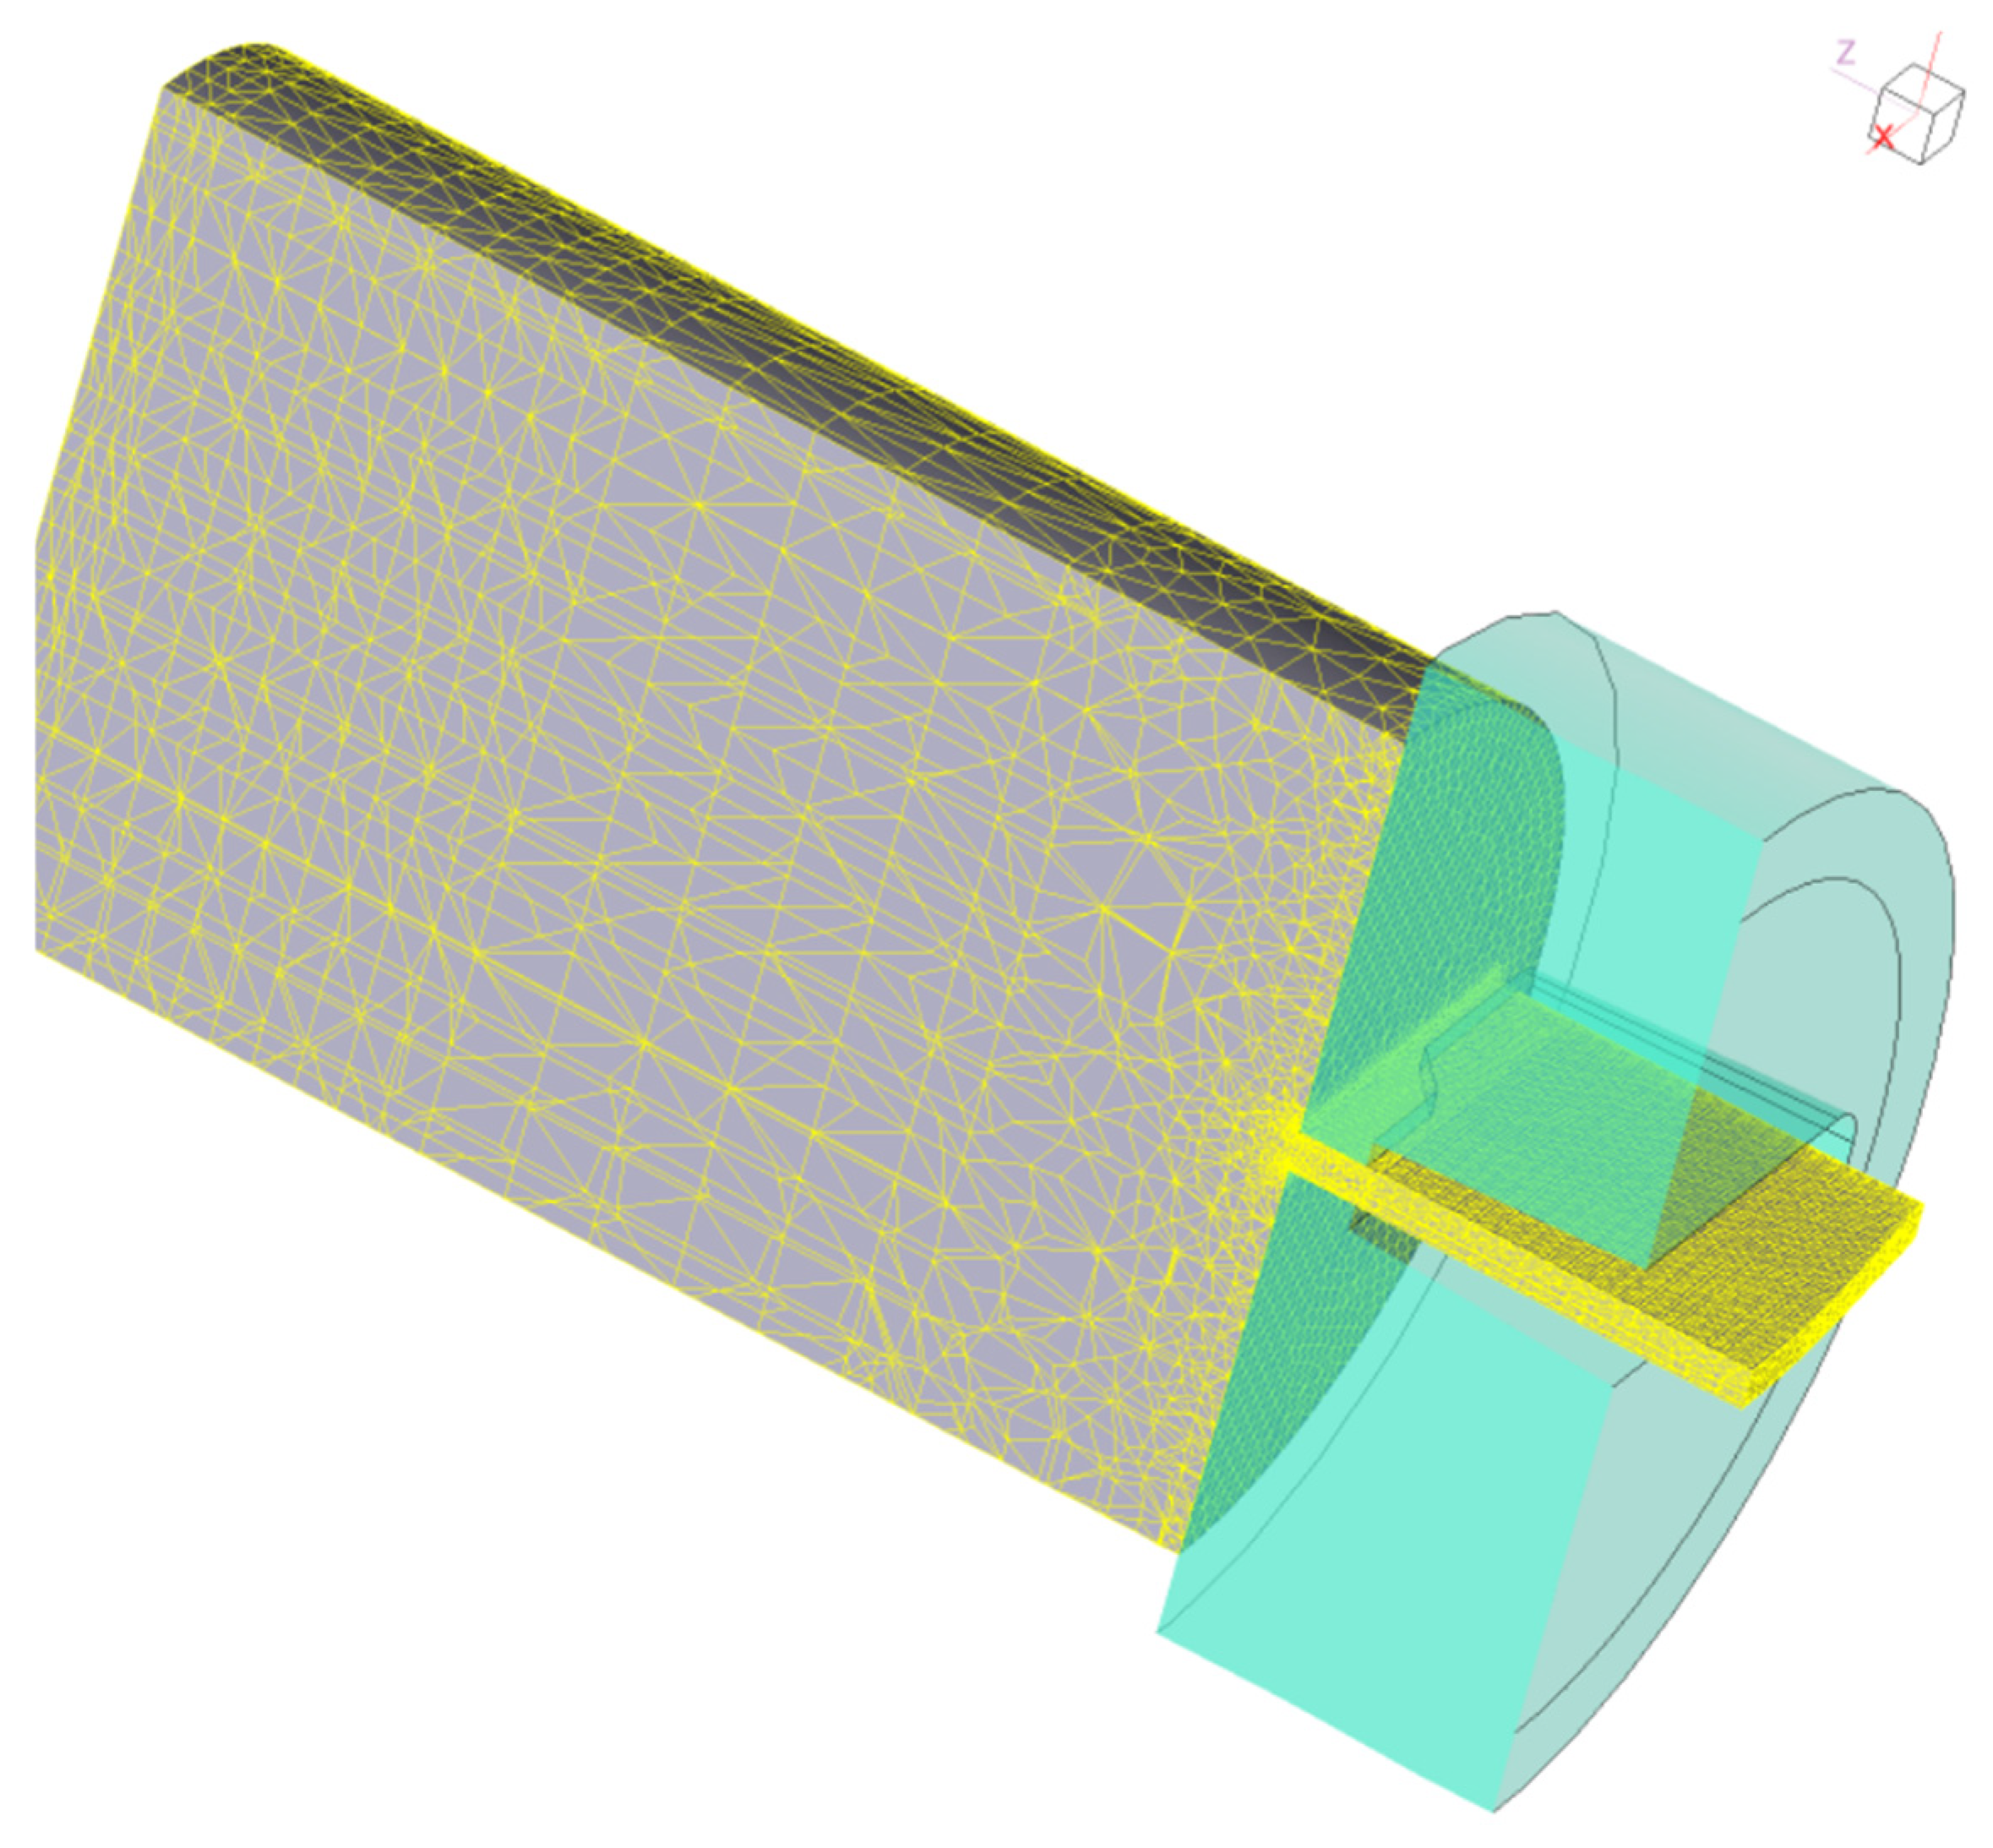
The simulations were initiated by analyzing the material flow during the extrusion of a flat profile with dimensions of 80 × 3 mm. FEM simulations were performed using the die geometry presented in Figure 20, Figure 21 and Figure 22 and the Q-Form module, which allows the prediction of the front shape of the extruded profile and the determination of velocity variations along the extrusion axis. In these simulations, both the material and the tool temperatures were set to 460 °C, and the ram speed was 0.5 mm/s. Although the three material models exhibited noticeable differences in flow behavior during the initial stage of extrusion. Figure 23 and Figure 24 present a comparison of the simulated results with the experimental profile obtained under the same extrusion parameters used in the calculations.
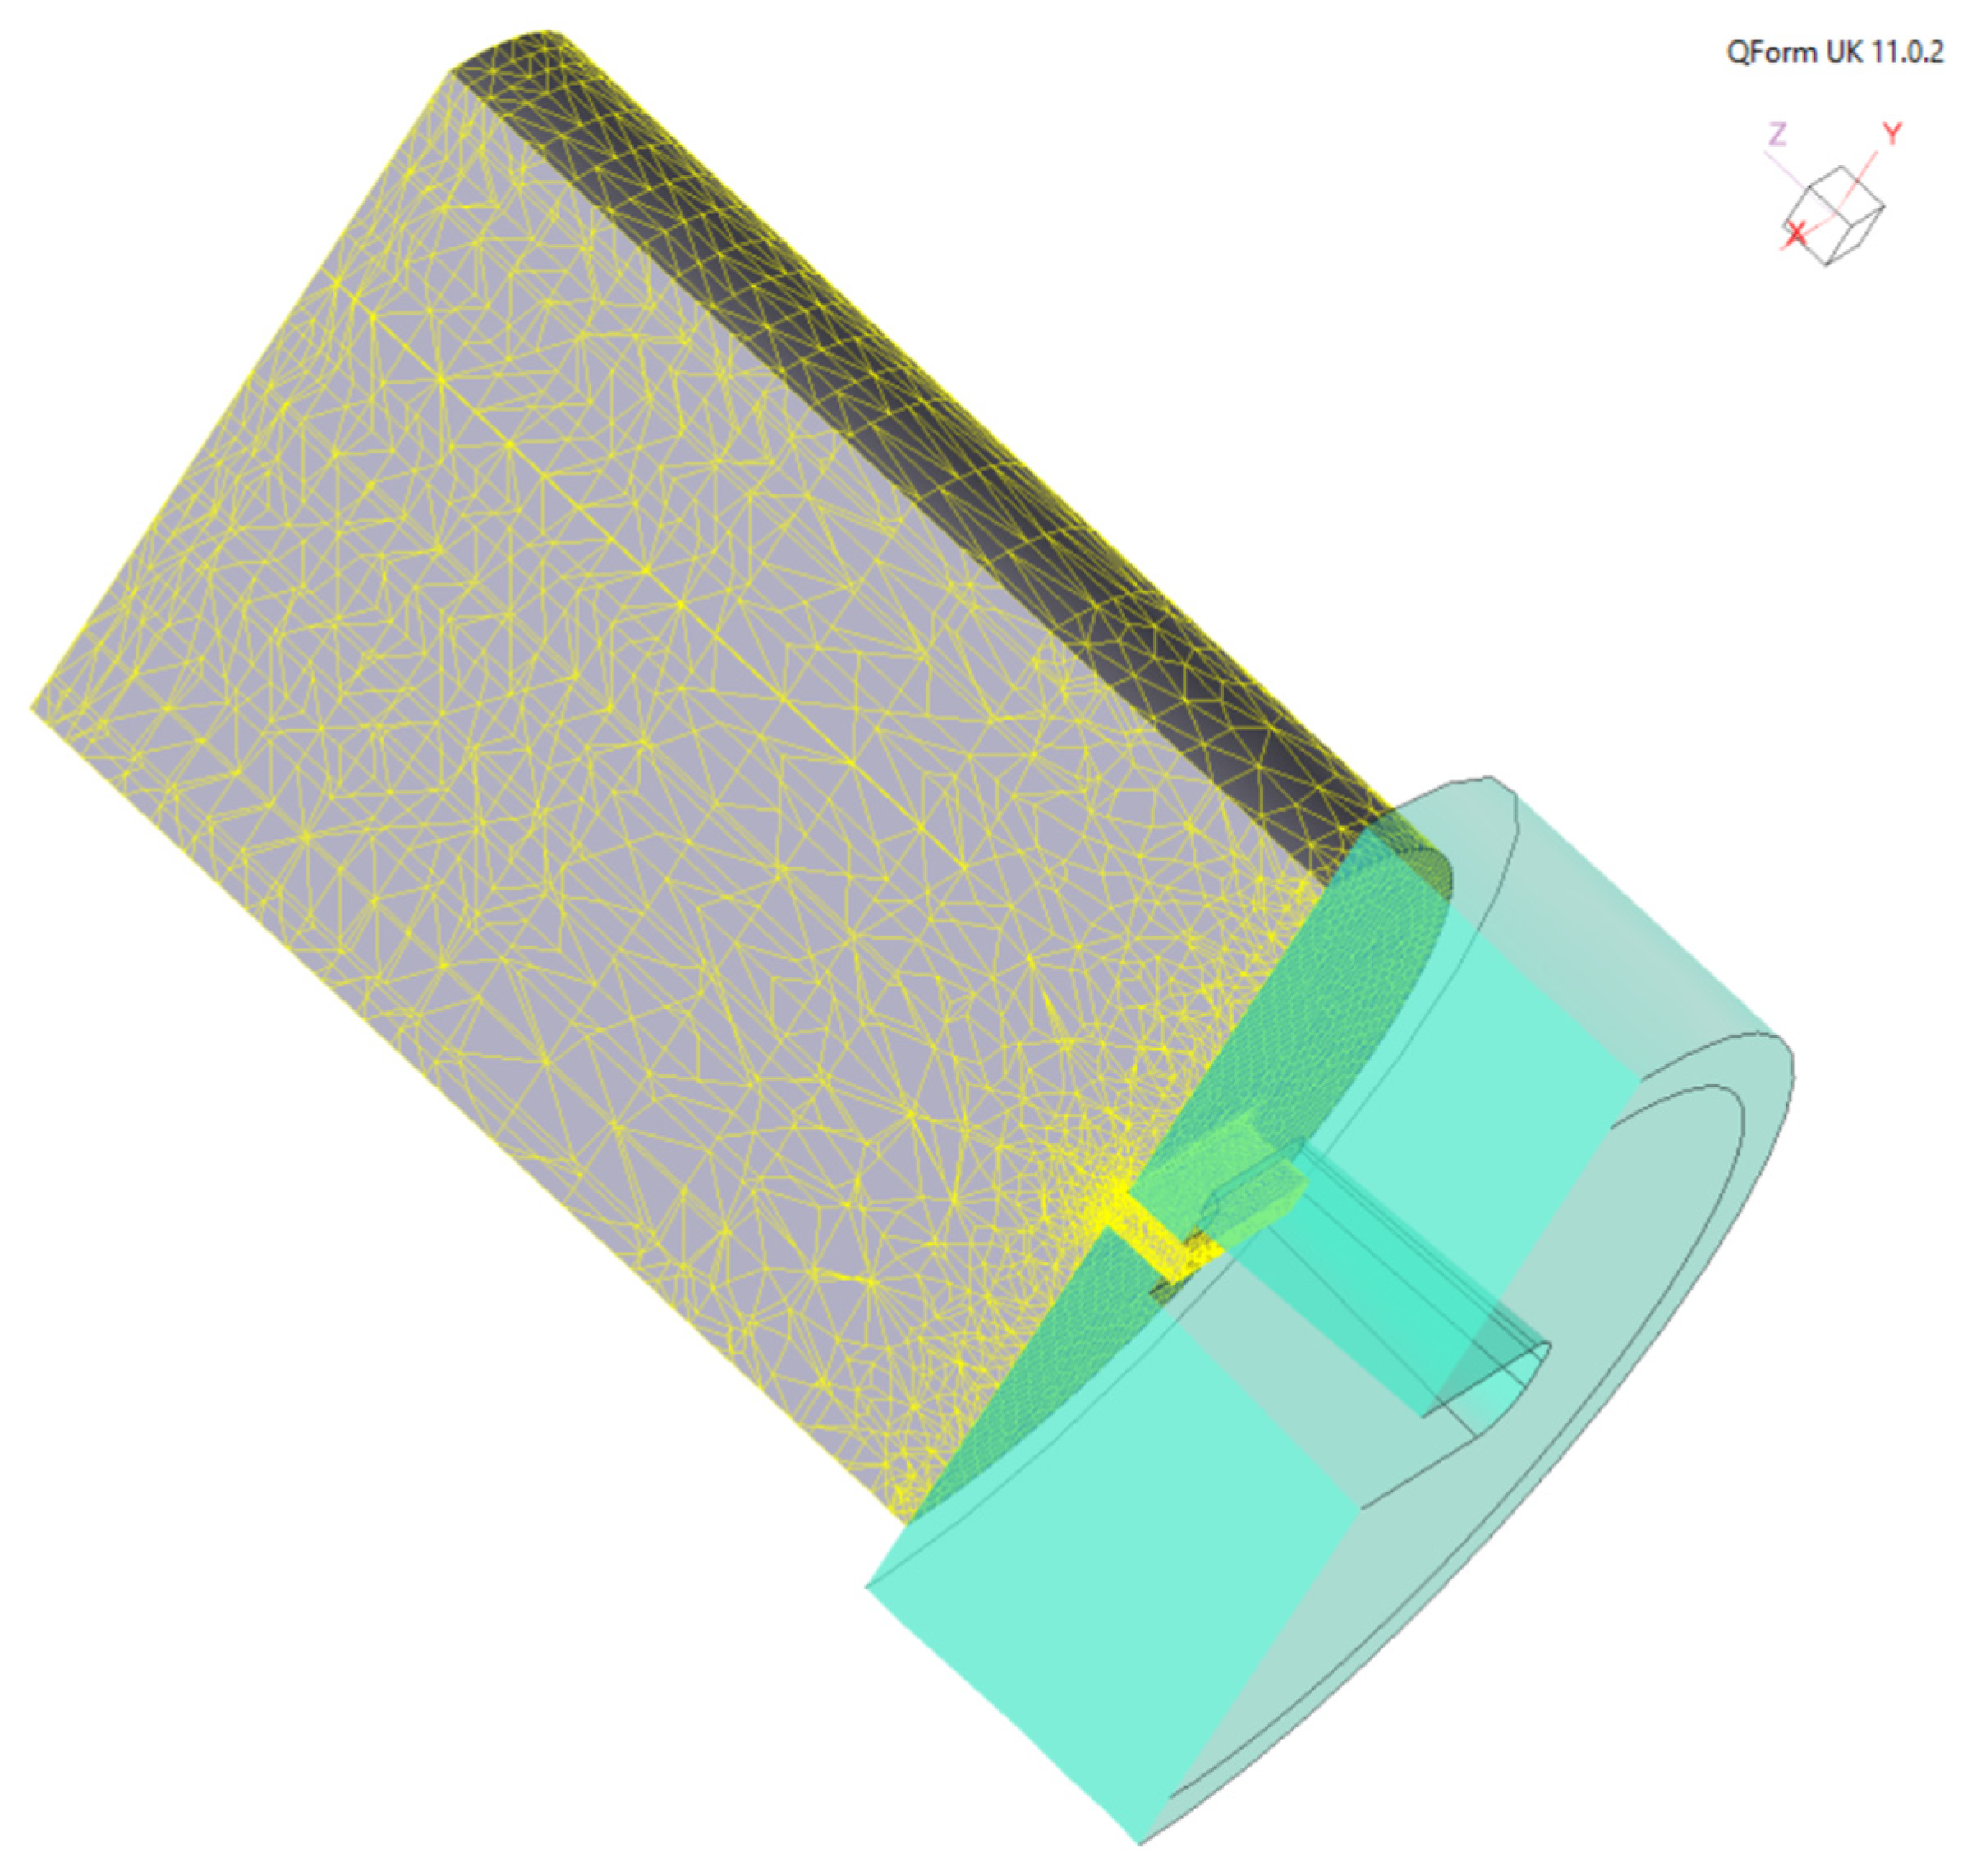
The second phase of the FEM analyses involved calculations for 80 × 5 mm and 45 × 5 mm profiles, which was dedicated to obtaining two crucial parameters: max. extrusion force and max. profile temperature during the process. In Figure 25 and Figure 26 cross-sections of tools and materials with finite elements mesh are presented (figures were taken during calculations to show different mesh densities dependent on stress and strain conditions).
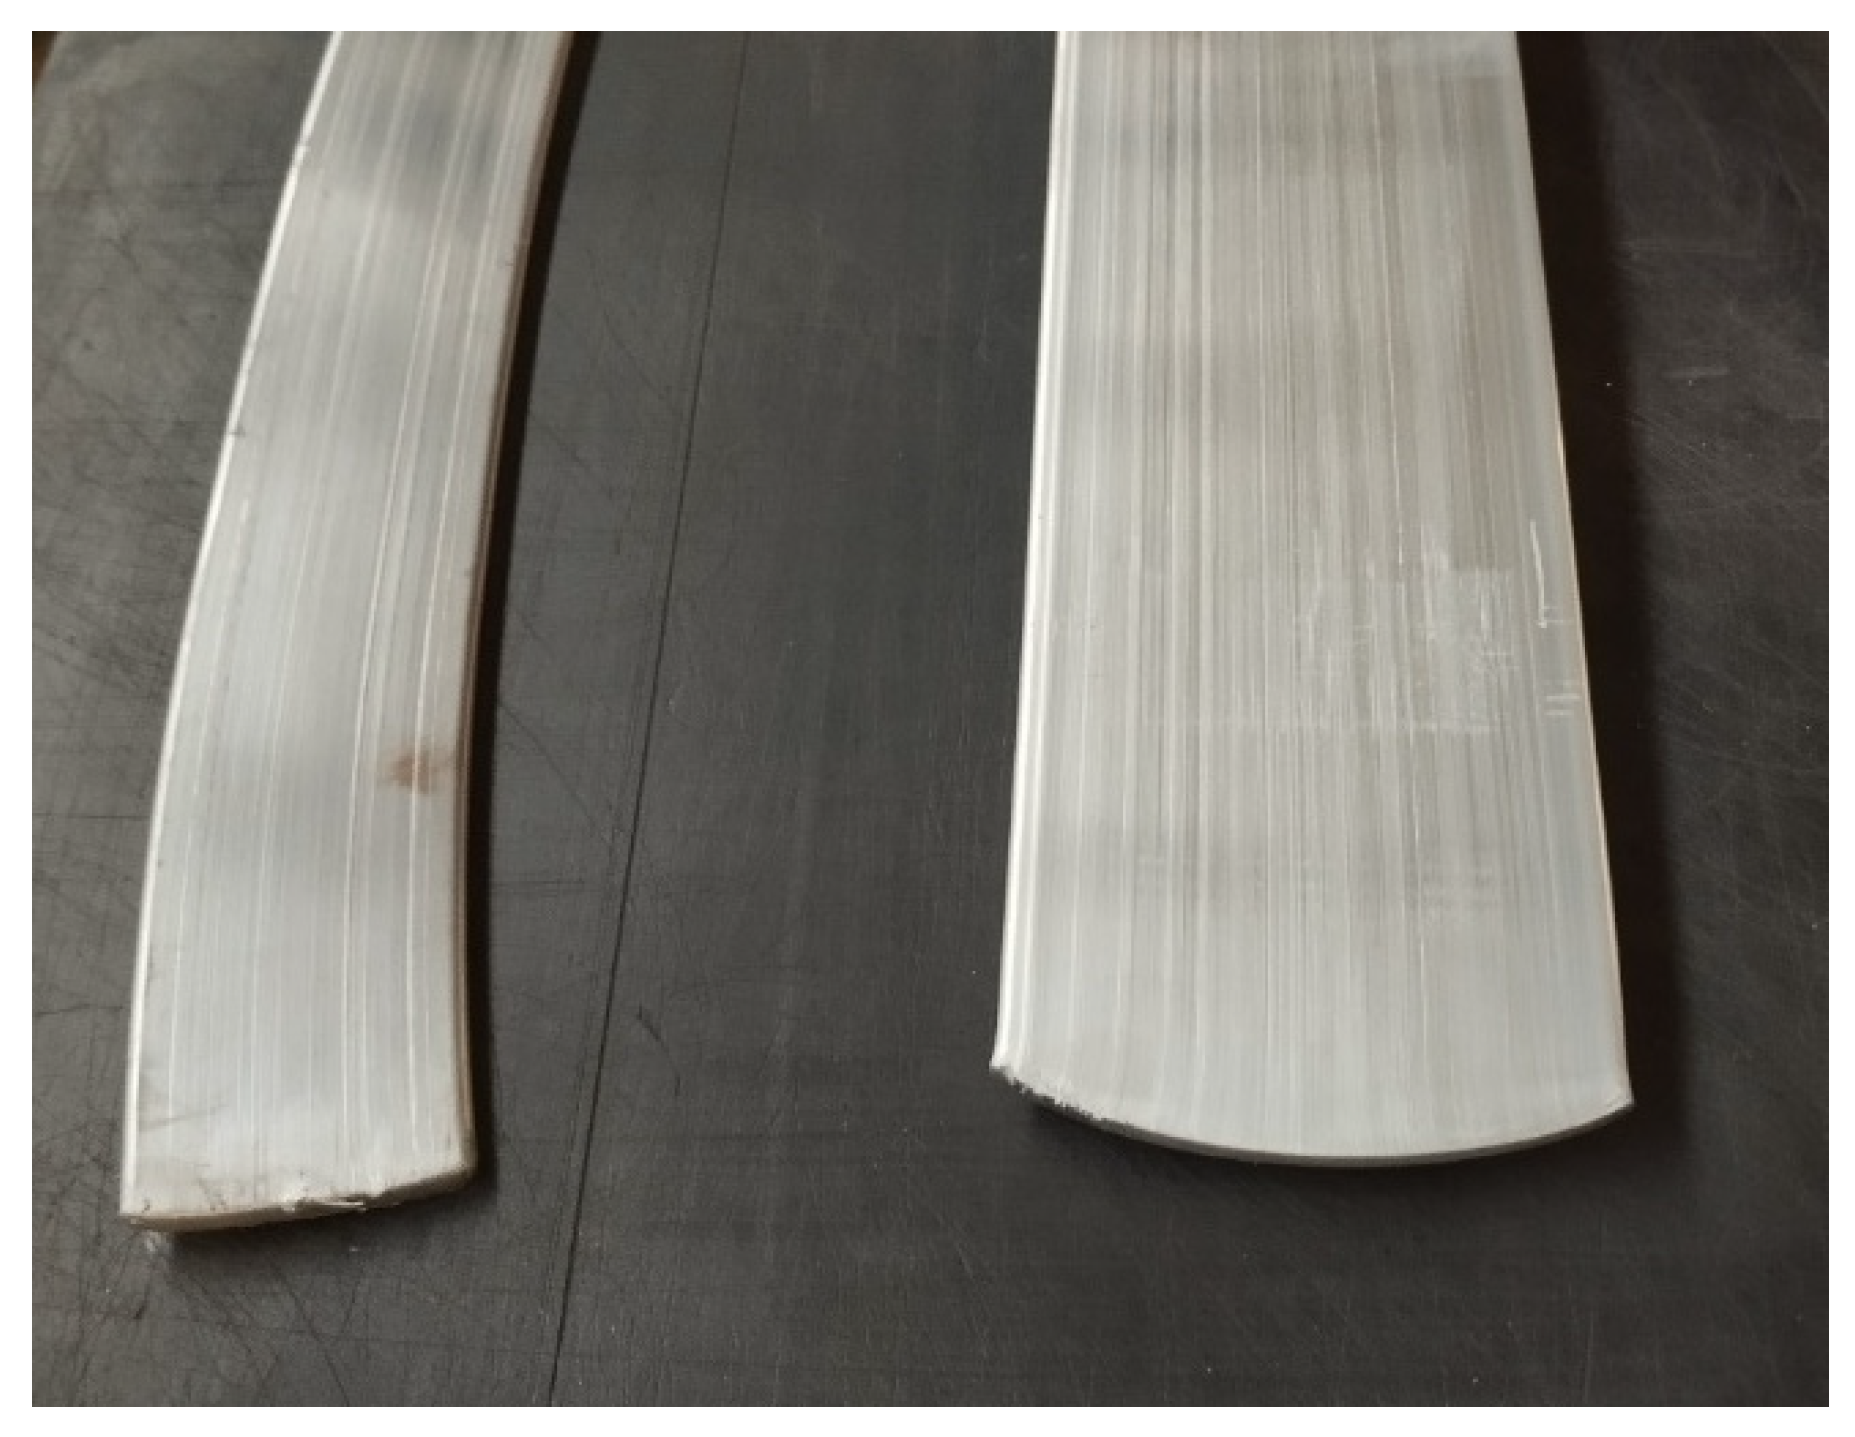
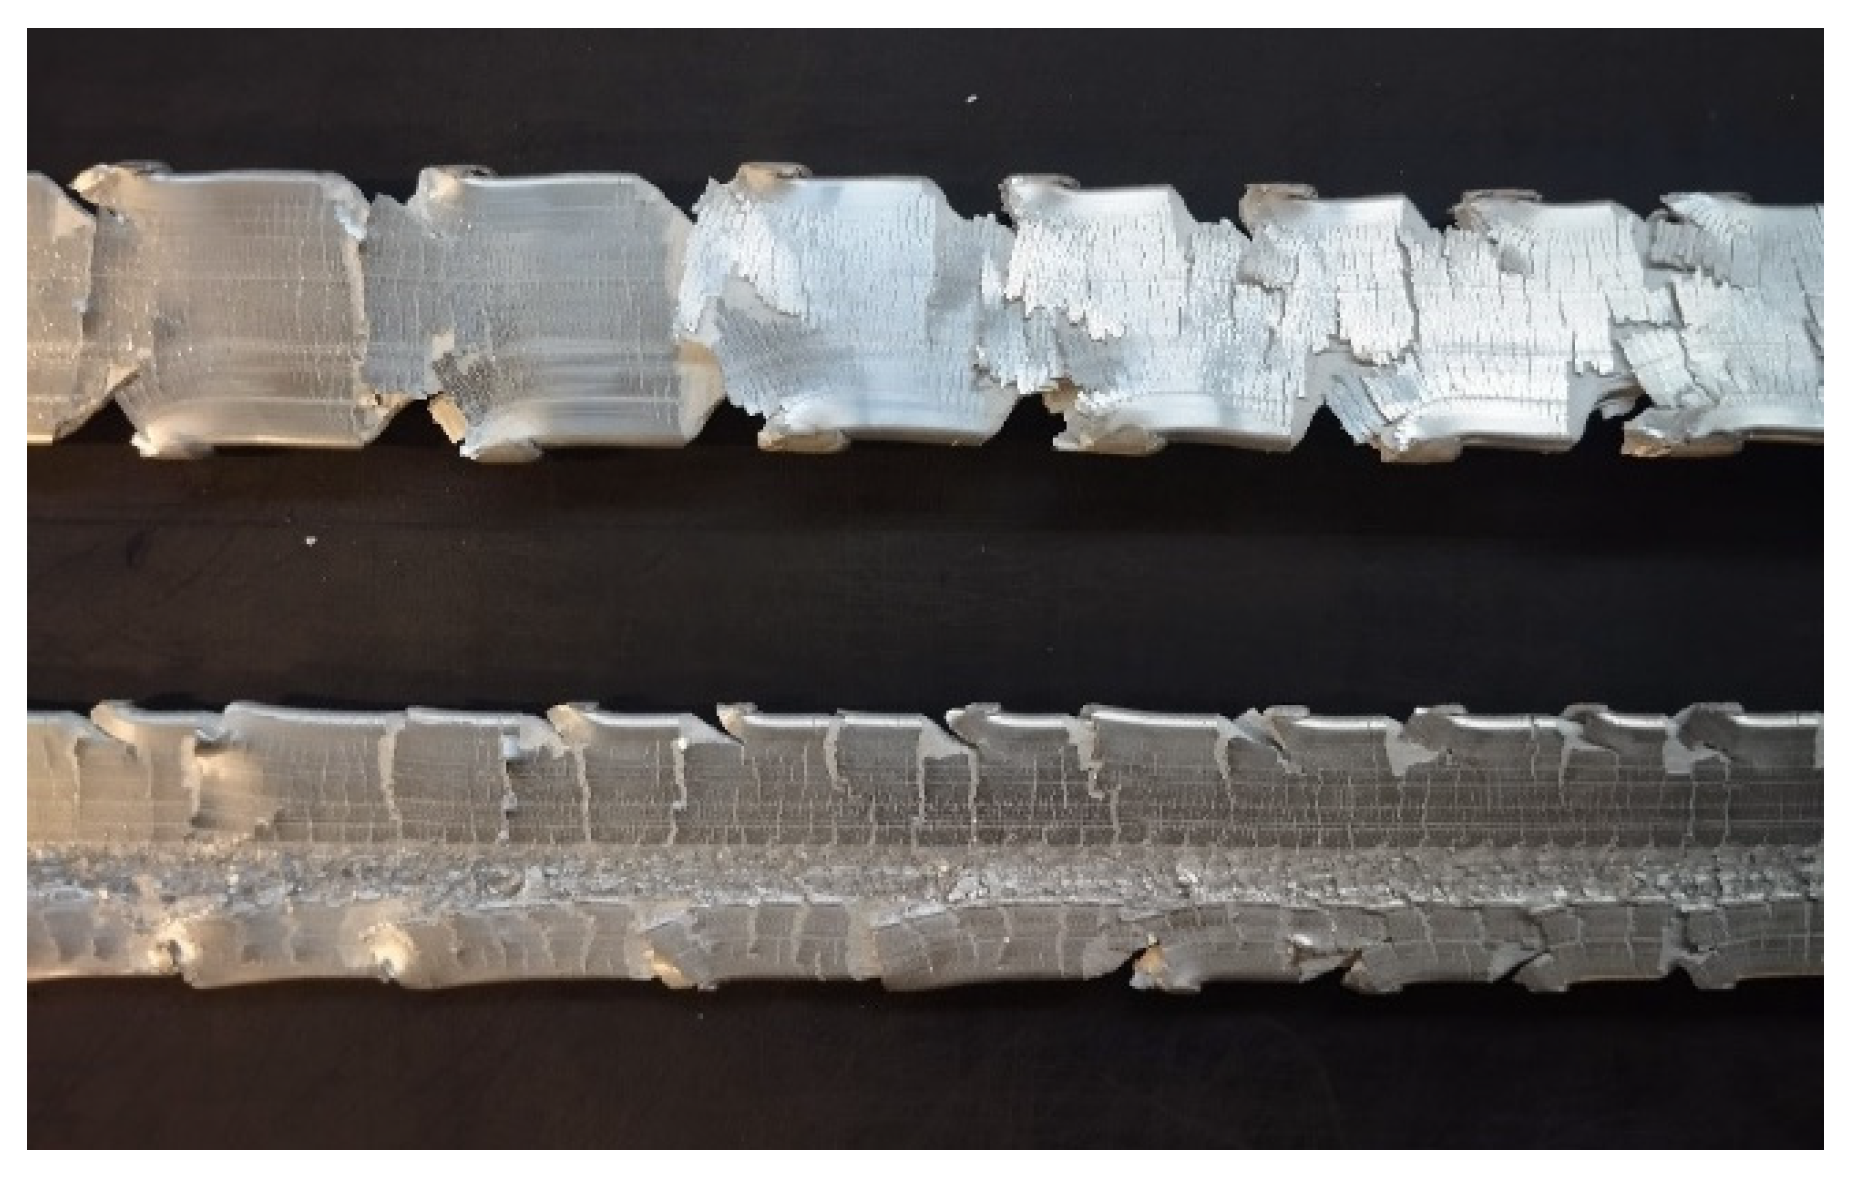
Based on the analysis of FEM simulation data, the authors prepared several extrusion tests conducted on a horizontal 5 MN press. The parameters of the mentioned tests were the same as for the FEM calculations to make comparison of the experimental and calculated parameters easier. During extrusion, two main parameters were recorded: extrusion force and temperature of the profile on the press exit. To simplify the comparison of the results, only max. temperature of profile and max. force during the process were considered. The results are presented in Table 4. The extruded profiles are presented in Figure 27; it should be noted that, for the 45 × 5 mm profile, 0.5 mm/s of ram speed was the absolute limit, as higher speeds caused hot cracking phenomena, presented in Figure 28. Therefore, the parameters obtained during this speed can be considered as physical limitation of this alloy at a high extrusion ratio (more than 19).

5. Results and Discussion

Figure 12, Figure 13, Figure 14, Figure 15, Figure 16 and Figure 17 demonstrate that all three investigated experimental methods can be used to derive constitutive flow stress models based on the Hensel–Spittel formulation with nine material parameters. However, each method exhibits specific limitations related to the achievable strain, strain-rate range, and sensitivity to frictional effects. In particular, the maximum strain rates were limited to approximately 1 s−1 for the spherical probe pressing test and 0.5 s−1 for the compression test. The maximum achievable true strains were approximately 1.6 for the spherical probe pressing test and 0.9 for the compression test. The limitation of the compression test to a true strain of 0.9 was intentionally adopted to avoid excessive frictional effects and pronounced non-uniform deformation, which strongly affect the physical interpretation of flow stress at higher deformation levels. These constraints are primarily associated with the capabilities of the testing equipment, such as maximum cross-head speed and load capacity, and could potentially be extended when using higher-capacity testing systems. Similar limitations of phenomenological constitutive models and the sensitivity of identified parameters to experimental conditions have been widely reported in the literature [24,25,26,27,28,29,30,31,32,33,34,35].
The differences observed between the experimental and calculated curves in Figure 18 and Figure 19 are mainly related to the simplified assumptions adopted in the constitutive model and the FEM simulation, including the use of an equivalent averaged strain rate, simplified evaluation of strain and strain rate, and unavoidable friction effects at the probe–specimen interface. In particular, friction cannot be eliminated, which leads to non-uniform deformation and increasing discrepancies at higher strain levels. Similarly to the compression test, the spherical probe pressing data were therefore intentionally limited to a maximum true strain level of approximately ε ≤ 0.9, beyond which frictional and contact effects significantly influence the shape of the force–displacement curves.
Furthermore, the numerical model assumes uniform material behavior and idealized contact conditions, while in the physical test, local variations in deformation conditions inevitably occur. These effects lead not only to deviations in the absolute values of force, but also to differences in the curvature of the experimental and simulated characteristics.
Therefore, the spherical probe pressing method is primarily intended as a comparative engineering validation tool, rather than a source of exact quantitative material data. In this context, FEM simulations of the probe test can be effectively used for rapid and cost-efficient verification of constitutive models by comparing numerical predictions with experimental trends, without the need for time-consuming and expensive full-scale industrial extrusion trials.
To assess the applicability of the developed material models in FEM simulations, two key technological parameters of the extrusion process, maximum extrusion force and maximum profile temperature, were compared with results from physical extrusion trials. The corresponding values for all three characterization methods are summarized in Table 4. Comparative analysis indicates that compression testing, torsion testing, and spherical probe pressing can all be used to develop constitutive models for FEM simulations; however, their accuracy and practical suitability differ significantly.
The compression test provided the least reliable results, with deviations in predicted extrusion force reaching up to ~24% compared to physical extrusion trials. This limitation is largely attributable to friction effects at the plate–sample interface and to the relatively small range of achievable strain (typically below one). While compression testing is simple and can be performed on standard equipment, its restricted accuracy makes it less suitable for modeling alloys with reduced hot workability, such as EN AW-7075.
The torsion test, in contrast, remains the benchmark method for high-temperature deformation studies. By minimizing friction and enabling large, uniform strains, torsion testing delivered the most consistent stress–strain data and provided model predictions within ~11% of experimental results. However, the need for specialized plastometers, complex sample geometries, and high cost limit its use outside advanced research laboratories. Despite these drawbacks, torsion remains the most accurate method and a valuable reference for validating alternative techniques.
The spherical probe pressing method offered a promising compromise between accuracy and accessibility. Although inherently affected by friction and strain-rate variations, the deviations in extrusion force were typically below 15%, which is considered to be acceptable for many industrial applications. The use of simple geometries and standard testing machines makes this method cost-effective and attractive for early stage process design or when torsion equipment is unavailable. The present results therefore confirm its potential as a complementary approach to torsion testing, particularly in industrial settings where resources are limited.
When analyzing the data from torsion, compression, and spherical probe pressing tests, it is evident that the spherical probe pressing method exhibits approximately 20% higher resistance to deformation compared to the compression-based predictions. The flow stress measured in this test is considerably higher than that observed in torsion experiments. This is due to the more complex material flow path involved (it can be considered that this test simulates the extrusion of a tube from a cylindrical rod). Constrained and non-uniform deformation, combined with friction between the probe and the specimen, contributes to the increased apparent flow stress. As a result, while the method can be useful for industrial tests and calculations, it tends to overestimate the true flow stress and is less reliable than torsion tests for quantitative analysis.
A critical finding of this study is the high strain-rate sensitivity of the EN AW-7075 alloy. For extrusion with high ratios, the maximum feasible ram speed was limited to approximately 0.5 mm/s, which is considerably lower than values reported for medium-strength 6XXX alloys (often exceeding 15 mm/s). This observation is consistent with earlier reports on the reduced formability of Zn–Mg–Cu alloys. Such behavior highlights the importance of providing precise constitutive data for 7XXX alloys, as even small deviations can lead to erroneous FEM predictions of extrusion force, temperature, or cracking tendency.
From an industrial perspective, the results demonstrate that torsion and spherical probe pressing can both be applied to generate material models for FEM analysis, with prediction errors reduced to within 10–15%. This level of accuracy is sufficient for some process optimization studies, enabling the design of extrusion conditions that minimize energy consumption and defect formation. Compression testing, while easy to implement, should be used with caution or limited to preliminary investigations.
It should be noted that deviations in the range of 11–23% are generally considered acceptable for engineering FEM simulations at the early design and process optimization stages. Under typical industrial conditions, higher agreement between FEM simulations and experimental results is often achieved. This is mainly due to the more stable operating conditions of industrial extrusion presses. In contrast, the semi-industrial 5 MN press used in the present study exhibits certain characteristics that limit the stability of process control, particularly due to the application of pressure accumulators. This resulted in relatively larger discrepancies between the numerical predictions and the experimentally measured values. Nevertheless, meaningful and consistent comparisons between the investigated methods remain valid as long as all experimental and numerical results are obtained using the same press and identical boundary conditions.
In summary, while torsion testing remains the reference standard, the spherical probe pressing method has demonstrated strong potential as an industrially viable alternative. Both techniques provide sufficiently accurate input data for FEM simulations of EN AW-7075 extrusion, thereby addressing a key gap in the material databases of commercial FEM software and supporting the further optimization of lightweight, high-strength aluminum alloys in demanding engineering applications. For clarity, a comparative summary of the three investigated experimental methods and their suitability for constitutive model identification is provided in Table 5.

6. Conclusions

In this study, the hot deformation behavior of the EN AW-7075 aluminum alloy was characterized using three experimental methods: compression testing, torsion testing, and spherical probe pressing. The experiments were conducted over a temperature range of 400–480 °C and strain rates between 0.1 and 10 s−1, depending on the limitations of each method. At least two tests were performed for each condition to ensure repeatability of the results.
The experimental data were used to determine the parameters of the Hensel–Spittel constitutive model, which were subsequently implemented in FEM simulations of the direct extrusion process using Q-Form Extrusion software. Physical extrusion trials were conducted on a 5 MN horizontal press for flat bar profiles with dimensions of 80 × 5 mm 80 × 3 mm and 45 × 5 mm, and the numerical predictions were validated against experimental measurements.
The comparison of maximum extrusion force and maximum profile temperature revealed that material models derived from torsion testing and spherical probe pressing presented the closest values to compare with the experimental results. Deviations were generally within 11–15% for these two methods, whereas compression testing resulted in significantly larger discrepancies, exceeding 23% in terms of predicted extrusion force.
The applicability of compression testing was limited by the achievable deformation range, which in the present study was intentionally restricted to a true strain of 0.9 to ensure reliable and physically meaningful flow stress data. Torsion testing remains the most accurate method for characterizing the hot deformation behavior of EN AW-7075; however, spherical probe pressing has demonstrated strong potential as an industrially viable alternative, offering a favorable balance between experimental simplicity and modeling accuracy. Both methods can provide sufficiently accurate input data for FEM simulations of hot extrusion processes, thereby addressing a key gap in material databases for high-strength aluminum alloys.
Based on the FEM analysis of the front end of the extruded 80 × 3 mm profile, it can be concluded that both torsion testing and spherical probe pressing provide material flow characteristics consistent with physical extrusion trials. The calculations based on compression test were inaccurate. This effect may be caused mainly by the relatively low deformation level that can be achieved in this test.
As presented in manuscript, despite the use of lubrication pockets in compression tests, and boron nitride powder in the spherical probe pressing test, a certain effect of friction was observed. The mentioned effect was reduced compared to unlubricated tests but could not be completely eliminated. High friction affects the apparent hardening observed at high strain levels in FEM analyses (which was not observed in physical tests) and it is hard to avoid, which is why authors see applications of these methods in alloys where relatively low degrees of deformation are used. Probably, there is the possibility to reduce and compensate friction by separating the component responsible for friction and then eliminating it in the calculations, but this requires advanced work and significantly complicates obtaining material data.
The proposed comparative methodology provides a practical and industrially applicable framework for selecting experimental approaches for constitutive model identification in FEM-based metal-forming simulations.

7. Future Works

Future research should extend the present findings in several important directions. First, while the current study focused primarily on mechanical characterization through compression, torsion, and spherical probe pressing tests, there is a clear need for microstructural investigations to complement these results. Detailed analyses of grain evolution, recrystallisation phenomena, and phase transformations during hot deformation would provide a deeper understanding of the mechanisms controlling the flow behavior of the EN AW-7075 alloy. Coupling microstructural data with constitutive modeling would significantly improve the predictive capabilities of FEM simulations.
Second, further experimental verification is necessary, especially under industrially relevant conditions. The extrusion trials reported here focused on flat bar profiles; however, many industrial applications involve closed or complex profiles, where deformation paths and strain states differ significantly. Systematic validation of constitutive models against the extrusion of closed-section profiles would therefore represent an important step towards broader applicability.
Finally, future work should focus on improved treatment of frictional effects in alternative characterization methods, particularly spherical probe pressing and compression testing. The development of advanced correction or compensation approaches for friction-induced artifacts could significantly enhance the quantitative reliability of these methods without sacrificing their experimental simplicity.

Author Contributions

Conceptualization, P.K.; methodology, P.K.; software, P.K.; validation, P.K., B.P., D.L., K.R. and K.Ż.; formal analysis, P.K., B.P. and D.L.; investigation, P.K.; resources, P.K.; data curation, P.K., B.P. and D.L.; writing—original draft preparation, P.K.; writing—review and editing, P.K., B.P., D.L., K.R. and K.Ż.; visualization, P.K.; supervision, P.K. and D.L.; project administration, P.K.; funding acquisition, P.K. All authors have read and agreed to the published version of the manuscript.

Funding

This paper covers the research funded by the Polish Ministry of Science and Higher Education (MNiSW): “Implementation Doctorate” program no. 251 DWD/6/0245/2022.

Data Availability Statement

The data presented in this study are available from the corresponding author due to privacy.

Conflicts of Interest

The authors declare no conflicts of interest.

References

  1. Ye, T.; Xiong, Y.; Zhao, L.; Chen, H.; Zhang, X. Deformation Behavior of an Extruded 7075 Aluminum Alloy at Elevated Temperatures. Materials 2024, 17, 1210. [Google Scholar] [CrossRef]
  2. Liu, Y.; Li, H.; Zhang, J.; Wang, L. Mechanical Property and Microstructure of Rolled 7075 Alloy under Hot Compression with Different Original Grains. Metals 2023, 13, 1456. [Google Scholar] [CrossRef]
  3. Li, G.; Quan, G.; Chen, X.; Sun, L.; Zhang, J. A Characterization for the Flow Behavior of As-Extruded 7075 Aluminum Alloy by the Improved Arrhenius Model with Variable Parameters. Mater. Res. 2014, 17, 494–503. [Google Scholar] [CrossRef]
  4. Li, G.J.; Zhang, Z.M.; Yang, Y.B. Flow Stress Behavior Anisotropy of Extruded 7075 Aluminum Alloy Bar at Elevated Temperatures. Adv. Mater. Res. 2011, 190–191, 478–483. [Google Scholar] [CrossRef]
  5. Zhou, M.; Clode, M.P. Hot Torsion Tests to Model the Deformation Behavior of Aluminium Alloys at Hot Working Temperatures. J. Mater. Process. Technol. 1997, 72, 78–85. [Google Scholar] [CrossRef]
  6. Donato, S.; Pelaccia, R.; Negozio, M.; El Mehtedi, M.; Reggiani, B.; Donati, L. Hot Torsion Tests of AA6082 Alloy. Key Eng. Mater. 2024, 988, 21–29. [Google Scholar] [CrossRef]
  7. Wang, H.; Lee, H.-W.; Kang, S.-H.; Kim, D.-K. Crystal Plasticity Finite Element Analyses on the Formability of AA6061 AluminumAlloy with Different Ageing Treatments. Metals 2024, 14, 503. [Google Scholar] [CrossRef]
  8. Mishra, R.; Singh, A. FEM and Machine Learning Approaches for Predicting Mechanical Properties of AFSD Aluminum Alloys. arXiv 2024, arXiv:2408.05237. [Google Scholar]
  9. Chan, K.S.; Bodner, S.R.; Lindhom, U.S. Phenomenological Modeling of Hardening and Thermal Recovery in Metals. J. Eng. Mater. Technol. 1988, 110, 1–8. [Google Scholar] [CrossRef]
  10. Alimov, A.; Kniazkin, I.; Biba, N. Development and Implementation of Static Recrystallization Model of 6XXX Aluminum Alloy Using Industrial Experiments. In Forming the Future; Springer: Cham, Switzerland, 2021. [Google Scholar] [CrossRef]
  11. Bandini, C.; Reggiani, B.; Donati, L.; Tomesani, L. Development and Validation of a Dynamic and Static Recrystallization Model for Microstructural Prediction of AA6060 Aluminum Alloy with QForm. In Proceedings of the Eleventh International Aluminum Extrusion Technology Seminar (ET2016), Chicago, IL, USA, 3–6 May 2016. [Google Scholar]
  12. Zajkowska, A.; Derpeński, Ł.; Seweryn, A. Metody wyznaczania rzeczywistej krzywej umocnienia materiału. Cz. I: Test rozciągania próbki. Acta Mech. Autom. 2011, 5, 137–142. [Google Scholar]
  13. Petrov, M.A.; Petrov, A.N.; Petrov, P.A. Numerical Investigation of the Material Behaviour during Compression Tests for Samples with Rough Surfaces. Key Eng. Mater. 2016, 716, 736–752. [Google Scholar] [CrossRef]
  14. Chen, Z.; Mo, Y.; Ni, Z. Effect of Zn Content on the Microstructure and Properties of Super-High Strength Al–Zn–Mg–Cu Alloys. Metall. Mater. Trans. A 2013, 44, 3910–3920. [Google Scholar] [CrossRef]
  15. Li, Y.; Wang, Y.; Lu, B.; Yu, W.; Wang, H.; Xu, G.; Wang, Z. Effect of Cu Content and Zn/Mg Ratio on Microstructure and Mechanical Properties of Al–Zn–Mg–Cu Alloys. J. Mater. Res. Technol. 2022, 19, 3451–3460. [Google Scholar] [CrossRef]
  16. Hensel, A.; Spittel, T. Kraft- und Arbeitsbedarf Bildsamer Formgebungsverfahren; Deutscher Verlag für Grundstoffindustrie: Leipzig, Germany, 1978. [Google Scholar]
  17. Sheppard, T. Extrusion of Aluminium Alloys; Springer: Dordrecht, The Netherlands, 1999. [Google Scholar]
  18. Polmear, I.J.; StJohn, D.; Nie, J.-F.; Qian, M. Light Alloys: Metallurgy of the Light Metals, 5th ed.; Butterworth-Heinemann: Oxford, UK, 2017; pp. 120–165. [Google Scholar]
  19. Ding, S.; Shi, Q.; Chen, G. Flow Stress of 6061 Aluminum Alloy at Typical Temperatures during Friction Stir Welding Based on Hot Compression Tests. Metals 2021, 11, 804. [Google Scholar] [CrossRef]
  20. Zienkiewicz, O.C.; Taylor, R.L.; Zhu, J.Z. The Finite Element Method: Its Basis and Fundamentals, 7th ed.; Elsevier: Oxford, UK, 2013. [Google Scholar]
  21. Zienkiewicz, O.C.; Godbole, P.N. Flow of Plastic and Viscoplastic Solids with Special Reference to Extrusion and Forming Processes. Int. J. Numer. Methods Eng. 1974, 8, 3–16. [Google Scholar] [CrossRef]
  22. Laber, K.B.; Madura, J.; Leśniak, D.; Balcerzak, M.; Bogusz, M. Dedicated Material Models of EN AW-7021 Alloy for Numerical Modeling of Industrial Extrusion of Profiles. Materials 2025, 18, 3166. [Google Scholar] [CrossRef] [PubMed]
  23. Biba, N.; Stebunov, S.; Vlasov, A. Application of QForm Program for Improvement of the Die Design and Profile Extrusion 600 Technology. In Proceedings of the Ninth International Aluminum Extrusion Technology Seminar & Exposition, Orlando, FL, USA, 30 April–2 May 2008. [Google Scholar]
  24. Ji, K.; Li, G.; Sun, Y.; Xu, J.; Chen, H.; Chen, K.; Zhu, Y.; Li, Y. A Constitutive Model for Yield Strength and Work Hardening Behaviour of Aluminium Alloys during Artificial Ageing. Metals 2020, 10, 1094. [Google Scholar] [CrossRef]
  25. Chen, X.; Lin, Y.C.; Wen, D.; Zhou, H. Parameters Identification of High-Temperature Constitutive Models for Aluminum Alloys. Materials 2021, 14, 1123. [Google Scholar] [CrossRef]
  26. Guo, R.; Liang, D.; Qin, G. The Flow Stress Behavior and Physical-Based Constitutive Model for As-Quenched Al-Zn-Mg-Cu Alloy. Materials 2023, 16, 4982. [Google Scholar] [CrossRef]
  27. Lin, Y.C.; Chen, X.M.; Wen, D.X. Dynamic Recrystallization Behavior and Constitutive Modeling of Aluminum Alloys during Hot Deformation: A Review. Materials 2020, 13, 3050. [Google Scholar] [CrossRef]
  28. Lou, S.; Zhao, G.; Wang, R.; Wu, X. Modeling of Aluminum Alloy Profile Extrusion Process Using Finite Volume Method. J. Mater. Process. Technol. 2008, 206, 481–490. [Google Scholar] [CrossRef]
  29. Steinhoff, K.; Niendorf, T.; Heller, T.; Ventzke, V. Performance of Thermo-Mechanically Processed AA7075 Alloy at Elevated Temperatures—From Microstructure to Mechanical Properties. Metals 2020, 10, 884. [Google Scholar] [CrossRef]
  30. Wang, H.; Qin, G.; Li, C. A Modified Arrhenius Constitutive Model of 2219-O Aluminum Alloy Based on Hot Compression with Simulation Verification. J. Mater. Res. Technol. 2022, 18, 1725–1738. [Google Scholar] [CrossRef]
  31. Li, K.; Pan, Q.; Li, R.; Liu, S.; Huang, Z.; He, X. Constitutive Modeling of the Hot Deformation Behavior in 6082 Aluminum Alloy. J. Mater. Eng. Perform. 2019, 28, 981–994. [Google Scholar] [CrossRef]
  32. Leśniak, D.; Libura, W.; Leszczyńska-Madej, B.; Bogusz, M. FEM Numerical Calculations and Experimental Verification of Extrusion of Ø50 × 3 mm 7075 Aluminium Alloy Tubes Using Chamber Dies. Materials 2025, 19, 75. [Google Scholar] [CrossRef]
  33. Aghbalyan, S.G.; Bagdasaryan, V.; Vasilyan, G.A.; Wyczółkowski, R. Investigations of Stress and Strain State of Aluminum Alloys during Hot Extrusion and Patterns of Structure and Feature Formation. Sci. Rev. Eng. Environ. Sci. 2024, 33, 3–16. [Google Scholar] [CrossRef]
  34. Guo, X.; Zong, S.; Zhang, J.; Fang, Y. Modified Plasticity Constitutive Model for Extruded Aluminum Alloys under Complicated Stress States. J. Build. Eng. 2023, 73, 106717. [Google Scholar] [CrossRef]
  35. Alzahrani, B.; Ahmed, F.; Khan, M.; Alshammari, A.; Mohammed, H. Constitutive Analysis of the Deformation Behavior of Al-Mg-Si Alloy under Hot Deformation Conditions. Materials 2025, 18, 1121. [Google Scholar] [CrossRef]
Figure 1. Monometer resistance furnace and semi-continuous casting line.
Metals 16 00219 g001
Figure 2. Surface of casted billets.
Metals 16 00219 g002
Figure 3. The distribution of chemical elements content (mass %) presented along the diameter of the ingots (a) Mg distridution; (b) Cu distridution and (c) Zn distribution.
Metals 16 00219 g003
Figure 4. Structure of the billets—samples taken from the edge (a) and the center of the ingot (b).
Metals 16 00219 g004
Figure 5. Grain comparison of the billets—samples taken from the edge (left) and center (right) of the ingot microstructure revealed by Barker etching; colors correspond to crystallographic orientation contrast.
Metals 16 00219 g005
Figure 6. Comparison of microstructure of the EN AW-7075 aluminum alloy before (a) and after (b) homogenization, observed using scanning electron microscopy (SEM).
Metals 16 00219 g006
Figure 7. Geometry of samples for hot torsion tests (all values in mm).
Metals 16 00219 g007
Figure 8. Thermocouple location on the surface of samples (left) and sample after the test (right).
Metals 16 00219 g008
Figure 9. Temperature evolution measured by thermocouples as a function of true strain during hot torsion testing of EN AW-7075 aluminum alloy at a strain rate of 0.1 s−1.
Metals 16 00219 g009
Figure 10. View of samples prepared for compression tests (visible grease pockets), and an example photo exhibiting different degrees of deformation after the tests.
Metals 16 00219 g010
Figure 11. Tooling scheme and design.
Metals 16 00219 g011
Figure 12. Tooling for spherical probe pressing tests.
Metals 16 00219 g012
Figure 13. Cross-section of the sample after the spherical probe pressing test.
Metals 16 00219 g013
Figure 14. Data collected and calculated based on torsion test—experimental stress–strain curves (symbols) and values predicted by Hensel–Spittel law (solid lines) for temperature 400 °C.
Metals 16 00219 g014
Figure 15. Data collected and calculated based on torsion test—experimental stress–strain curves (symbols) and values predicted by Hensel–Spittel law (solid lines) for temperature 480 °C.
Metals 16 00219 g015
Figure 16. Data collected and calculated based on compression test—experimental stress–strain curves (symbols) and values predicted by Hensel–Spittel law (solid lines) for temperature 400 °C.
Metals 16 00219 g016
Figure 17. Data collected and calculated based on compression test—experimental stress–strain curves (symbols) and values predicted by Hensel–Spittel law (solid lines) for temperature 480 °C.
Metals 16 00219 g017
Figure 18. Data collected and calculated based on spherical probe pressing test-experimental stress–strain curves (symbols) and values predicted by Hensel–Spittel law (solid lines) for temperature 400 °C.
Metals 16 00219 g018
Figure 19. Data collected and calculated based on spherical probe pressing test—experimental stress–strain curves (symbols) and values predicted by Hensel–Spittel law (solid lines) for temperature 480 °C.
Metals 16 00219 g019
Figure 20. The 80 × 3 die geometry with material flow example taken during FEM analysis of extrusion process.
Metals 16 00219 g020
Figure 21. Cross-section of 80 × 3 die geometry with finite element mesh. Cross-section was captured to better show pre-chambers and bearings.
Metals 16 00219 g021
Figure 22. Finite element mesh on the material.
Metals 16 00219 g022
Figure 23. Results of front-end simulations of 80 × 3 bar with different material flow models based on the different material tests. From the left: compression test, torsion test and spherical probe pressing test.
Metals 16 00219 g023
Figure 24. Front end of 80 × 3 mm extruded bar taken during physical extrusion tests.
Metals 16 00219 g024
Figure 25. The 80 × 5 die geometry finite element mesh on the material. Picture taken during FEM analysis of extrusion process.
Metals 16 00219 g025
Figure 26. The 45 × 5 die geometry finite element mesh on the material. Picture taken during FEM analysis of extrusion process.
Metals 16 00219 g026
Figure 27. Front ends of 45 × 5 mm bar (on left) and 80 × 5 bar (on right).
Metals 16 00219 g027
Figure 28. Example of “hot cracking” phenomena on 45 × 5 mm bars.
Metals 16 00219 g028
Table 1. Chemical composition of casted billets.
Chemical Composition (Weight %)
AlloySiFeCuMnMgCrNiZnTiZrAl
70750.140.121.490.052.150.20.005.870.020.182bal.
Table 2. Values of the Hensel–Spittel equation coefficients obtained for EN AW-7075 alloy using various material tests.
Compression TestTorsion TestSpherical Probe Pres. Test
A [MPa]111.3
m1−0.00845−0.00671−0.0054
m2−0.2810.04820.3128
m30.124−0.142510.155
m4−0.021−0.00032−0.0112
m50.0015−0.000610
m700.0041−0.0557
m800.00060
m91.271.2161.15
Table 3. Material parameters used for FEM analysis.
Temp.
[°C]
Density [kg/m3]Thermal Conductivity [W/(m⋅K)]Specific Heat
[J/(kg⋅K)]
Young Module
[MPa]
PoissonThermal Expansion [10−6/°C]
20281016285772,0000.3322.4
500269418097346,0000.3626.9
Table 4. Results of experimental extrusion tests compared with FEM analysis.
Extrusion RatioExtruded Bar Dimensions
[mm]
Ram Speed
[mm/s]
Tools and Container Temperature
[°C]
Material Temperature
[°C]
Max. Extrusion Force [MN]Max. Temperature
[°C]
Test Type (FEM Analysis and Physical Extrusion Trials)
19.680 × 50.54704704.16504Spherical probe press.
4.34498Compression test
3.21483Torsion test
3.82498Physical tests
1.54.66535Spherical probe press.
5.10499Compression test
3.90530Torsion test
4.20516Physical tests
3545 × 50.254704704.23496Spherical probe press.
4.30494Compression test
3.30480Torsion test
3.70498Physical tests
0.54.60525Spherical probe press.
4.81522Compression test
3.50505Torsion test
3.90510Physical tests
Table 5. Comparative summary of experimental methods for constitutive model identification.
FeatureCompression TestHot Torsion TestSpherical Probe Pressing
Stress–strain statePredominantly compressive, friction-affectedNearly pure shear, uniformComplex contact deformation
Maximum achievable strainLow to medium (ε ≈ 0.9)Very high (ε > 3)Low to medium (ε ≤ 1)
Strain rate controlNominal, variableDirect and constantNon-constant, FEM-based equivalent
Friction sensitivityHigh (barreling)Very lowHigh
Temperature controlModerateGoodModerate
Cost and availabilityLow, standard machinesHigh, specialized plastometerLow, standard machines
Suitability for H-S identificationModerateHighModerate
Suitability for industrial FEMGoodExcellentGood for comparative
validation
Cost and experimental effortMedium/lowHighMedium/low
Disclaimer/Publisher’s Note: The statements, opinions and data contained in all publications are solely those of the individual author(s) and contributor(s) and not of MDPI and/or the editor(s). MDPI and/or the editor(s) disclaim responsibility for any injury to people or property resulting from any ideas, methods, instructions or products referred to in the content.