Article

Evolution of Microstructure and the Influence of Carbides on Hardness Properties in Martensitic Stainless Steel 90Cr18MoV During Heat Treatment

1
School of Materials and Energy, Guangdong University of Technology, Guangzhou 510006, China
2
Yangjiang Branch, Guangdong Laboratory for Materials Science and Technology (Yangjiang Advanced Alloys Laboratory), Yangjiang 529500, China
3
Collaborative Innovation Center of Steel Technology, University of Science and Technology Beijing, Beijing 100083, China
4
State Key Laboratory for Advanced Metals and Materials, University of Science and Technology Beijing, Beijing 100083, China
*
Author to whom correspondence should be addressed.
Metals 2025, 15(9), 999; https://doi.org/10.3390/met15090999
Submission received: 5 March 2025 / Revised: 25 March 2025 / Accepted: 26 March 2025 / Published: 9 September 2025
(This article belongs to the Special Issue Design, Preparation and Properties of High Performance Steels)

Abstract

In this study, we utilized Thermo-Calc software (2023a) to optimize the heat treatment process of martensitic stainless steel 90Cr18MoV through phase diagram calculations. The microhardness of 90Cr18MoV was characterized using a nanoindentation instrument. The microstructural morphology of the samples was analyzed using scanning electron microscopy (SEM). The composition of the samples was characterized through scanning electron backscatter diffraction (EBSD) and X-ray diffraction (XRD). Additionally, laser confocal microscopy (FIB) and transmission electron microscopy (TEM) were employed to characterize the precipitate phase composition and size before and after heat treatment, while also observing the dislocation structure within the samples. The relationship between the quenching temperature and the percentage of residual austenite content in the material was established. The influence of the dislocation structure and precipitate size on the hardness of the samples was investigated. The research findings confirm that the observed secondary hardening phenomenon in tempered samples is attributed to the co-precipitation of two types of carbides, M23C6 and MC, within the matrix. The study investigated the effects of the tempering temperature and duration on the size of secondary precipitates, indicating that M23C6 and MC particles with sizes less than or equal to 20 nm contribute to enhancing the matrix, while particles larger than 30 nm lead to a reduction in hardness after tempering. Notably, during the tempering process, M23C6 precipitated from the matrix nucleates on MC.

1. Introduction

The high-carbon, high-chromium martensitic stainless steel 90Cr18 is widely used in the production of high-end bearings, surgical instruments, and valves due to its exceptional hardness and wear resistance [1]. The addition of alloying elements in high-carbon martensitic stainless steels can obstruct slip planes, thereby enhancing their mechanical properties [2]. Furthermore, an increase in the chromium content present significantly improves the material’s corrosion resistance [3,4]. Due to the strong reducibility of chromium (Cr), it is widely used in stainless steel formulations [5]. Similarly, the addition of a small proportion of molybdenum (Mo) has been shown to improve the resistance of stainless steel against pitting and crevice corrosion in chloride environments [6].
The alloy 90Cr18MoV is classified as a high-carbon, high-chromium martensitic stainless steel. Martensite forms as a supersaturated solid solution of carbon (C) within alpha iron (ɑ-Fe), making it easier for high-carbon steels to develop a robust martensitic structure [7]. During the melting and solidification stages of 90Cr18 martensitic stainless steel, there is a tendency for the formation of difficult-to-remove network or plate-like carbides such as M7C3 and M23C6; “M” mainly refers to Cr [8]. The formation of large-sized carbides like Cr7C3 and Cr23C6 inevitably leads to regions deficient in chromium surrounding these carbides, which significantly diminishes the localized corrosion resistance of 90Cr18 martensitic stainless steel. Moreover, atoms such as manganese (M) or vanadium (V) can substitute chromium atoms at positions within Cr23C6. This substitution releases Cr from the carbides into the matrix material, which greatly enhances localized corrosion resistance while also facilitating dislocation accumulation that contributes positively to increasing the material strength [9].
Early studies have indicated that the size and composition of MxCy carbides are related to the cooling rate, and an excessively large carbide size significantly affects material properties [10,11]. It is well known that heat treatment methods can facilitate the phase transformation from M7C3 to M23C6 [10]. The phase transformation may initiate either from the center of primary carbide M7C3 [12] or from the peripheral regions of M7C3 [10,13,14]. Wang et al. [15] discovered that in high-performance microalloyed (HP-MA) steels, the transition from M7C3 to M23C6 at a heat treatment temperature of 1000 °C (Quenching) is controlled by the diffusion of carbon from the shell of M23C6 into the matrix. Yu et al. [16] investigated carbide evolution in high-carbon 8Cr13MoV stainless steel and found it challenging to eliminate the formed network carbides during solidification under conventional heat treatment and thermal deformation techniques. However, thermal deformation proves to be effective in fragmenting network carbides to smaller sizes by controlling deformation temperatures [16]. The thermal deformation at lower temperatures than Ac1 yields better fragmentation results [17]. Nevertheless, the higher concentrations of C and Cr in 90Cr18 make it more feasible for the formation of coarse network carbides, leading to an increased hardness that could not to be worked cold. Consequently, the current processing of 90Cr18MoV martensitic stainless steel predominantly employs hot rolling techniques. Currently, the temperature of hot rolling processes is lower than 800 °C for energy saving, which could not completely dissolve and fragment these network carbides. Cracking inevitably occurs, requiring further toughening treatments. To investigate suitable heat treatment processes, Qian et al. [18] carried out spheroidizing annealing and quenching-tempering processes on 60Cr16MoMA martensitic stainless steels and found that the coarse, fragmented M7C3 carbides transformed into M23C6 carbides.
However, it was found that post-heat-treated 60Cr16MoMA did not eliminate the detrimental effects of coarse M23C6 on the material; instead, an increase in the size of M23C6 was observed after tempering, indicating a lack of precise control over carbide dimensions. The carbide is inevitably formed in high-carbon martensitic stainless steels. Large-sized carbides lead to decreased corrosion resistance and increased brittleness in materials. In comparison, fine carbides tend to enhance material properties such as the presence of nanoscale chromium-rich M23C6 carbides that enhance the hardness of the microstructure [19].
In recent years, there has been growing interest among researchers regarding the size and type of secondary precipitated carbides due to their beneficial role in strengthening the matrix [20]. Li et al. [21] indicated that large-sized M23C6 carbides with sizes ranging from 0.3 µm to 1.5 µm significantly improve low-temperature toughness in martensitic heat-resistant steels. Bonagani et al. [22] conducted a tempering process on the steels containing 13%wt. Cr at temperatures above 550 °C and found that the Cr-depleted zones with the sizes of approximately 7–9 nm appeared around the secondary precipitated carbides, resulting in a decline in the pitting corrosion resistance of the materials.
Currently, research on high-carbon martensitic stainless-steel carbides primarily focuses on the types of primary carbides formed in the martensitic matrix after heat treatment. However, there remains a lack of comprehensive studies regarding the types of secondary carbides and the size variations of these carbides at different temperatures. In this study, the influence of different quenching temperatures on the phase transformation of 90Cr18MoV was investigated, as well as the effect of the residual austenite content resulting from quenching on the hardness of the matrix and the whole materials. After quenching and tempering treatment, the mechanism of secondary hardening in 90Cr18MoV during the tempering process was investigated. By analyzing the size of secondary phase precipitates generated during tempering, we studied the influence of carbide dimensions on the hardness of the 90Cr18MoV microstructure. Additionally, we examined the relationship between the size of secondary precipitates and the tempering temperature. Furthermore, an analysis was conducted on the precipitation and formation mechanisms of M23C6.

2. Materials and Methods

2.1. Materials

The material utilized in this study is martensitic stainless-steel plate 90Cr18MoV, which has undergone hot rolling and annealing processes(This material has been independently smelted and rolled by our research institution.). The chemical composition of the steels is shown in Table 1. The sample size is 10 mm × 8 mm × 4 mm (length × width × height). The heat treatment process for 90Cr18MoV stainless steel is illustrated in Figure 1. As shown in Figure 1, this experiment investigates the quenching treatment of 90Cr18MoV within a temperature range of 1020 °C to 1100 °C, with increments of 20 °C as individual research subjects. The quenching duration is set at 20 min, and oil is utilized for cooling the samples. To explore the effects of different tempering temperatures on the internal structure and properties of the material, we examine a temperature range from 150 °C to 700 °C, stepping in increments of 50 °C as separate research subjects. The tempering time is established at 180 min. We designate the material after quenching as Q-W, where Q represents the quenching process and W denotes the quenching temperature. We designated the samples that underwent tempering as QT-X/Y, where QT denotes quenching followed by tempering, X represents the tempering temperature, and Y indicates the duration of tempering.
To investigate the microstructure of the obtained samples, the samples after heat treatment were polished and then etched with a mixture of 90 mL of 4% ferric chloride solution and 10 mL of hydrochloric acid for 5 s. After that, an electrolyte polishing process was performed on the samples at a voltage of 30 V and a current of 1 mA for electron backscatter diffraction analysis. The electrolyte solution contained 10% perchloric acid and 90% alcohol to obtain specimens suitable for EBSD analysis.

2.2. Characterization

The microstructure of 90Cr18MoV was observed using Leica-DMI8C optical microscopy (OM) (Wetzlar, Germany) and a TESCAN/CLARA GMH (Brno, Czech Republic) field emission scanning electron microscope (FESEM). An Oxford Symmetry S2 electron backscatter diffraction system (EBSD) and Oxford UltimMax65x energy-dispersive X-ray spectroscopy (EDS) (Abingdon, UK), in conjunction with a Thermo Scientific Talos F200X S/TEM (Waltham, MA, USA) transmission electron microscope (STEM), were used for electron microscopy observation. Transmission specimens were prepared utilizing a dual-beam thinning instrument and Helios 5UX focused ion beam (FIB) (Waltham, MA, USA) technology.
Nano-hardness and elastic modulus characterization of the samples were performed using a Bruker Nano Inc. (Billerica, MA, USA). TI Premier nanoindentation tester, applying a load of 10 mN.

3. Results

3.1. Quenching Treatment

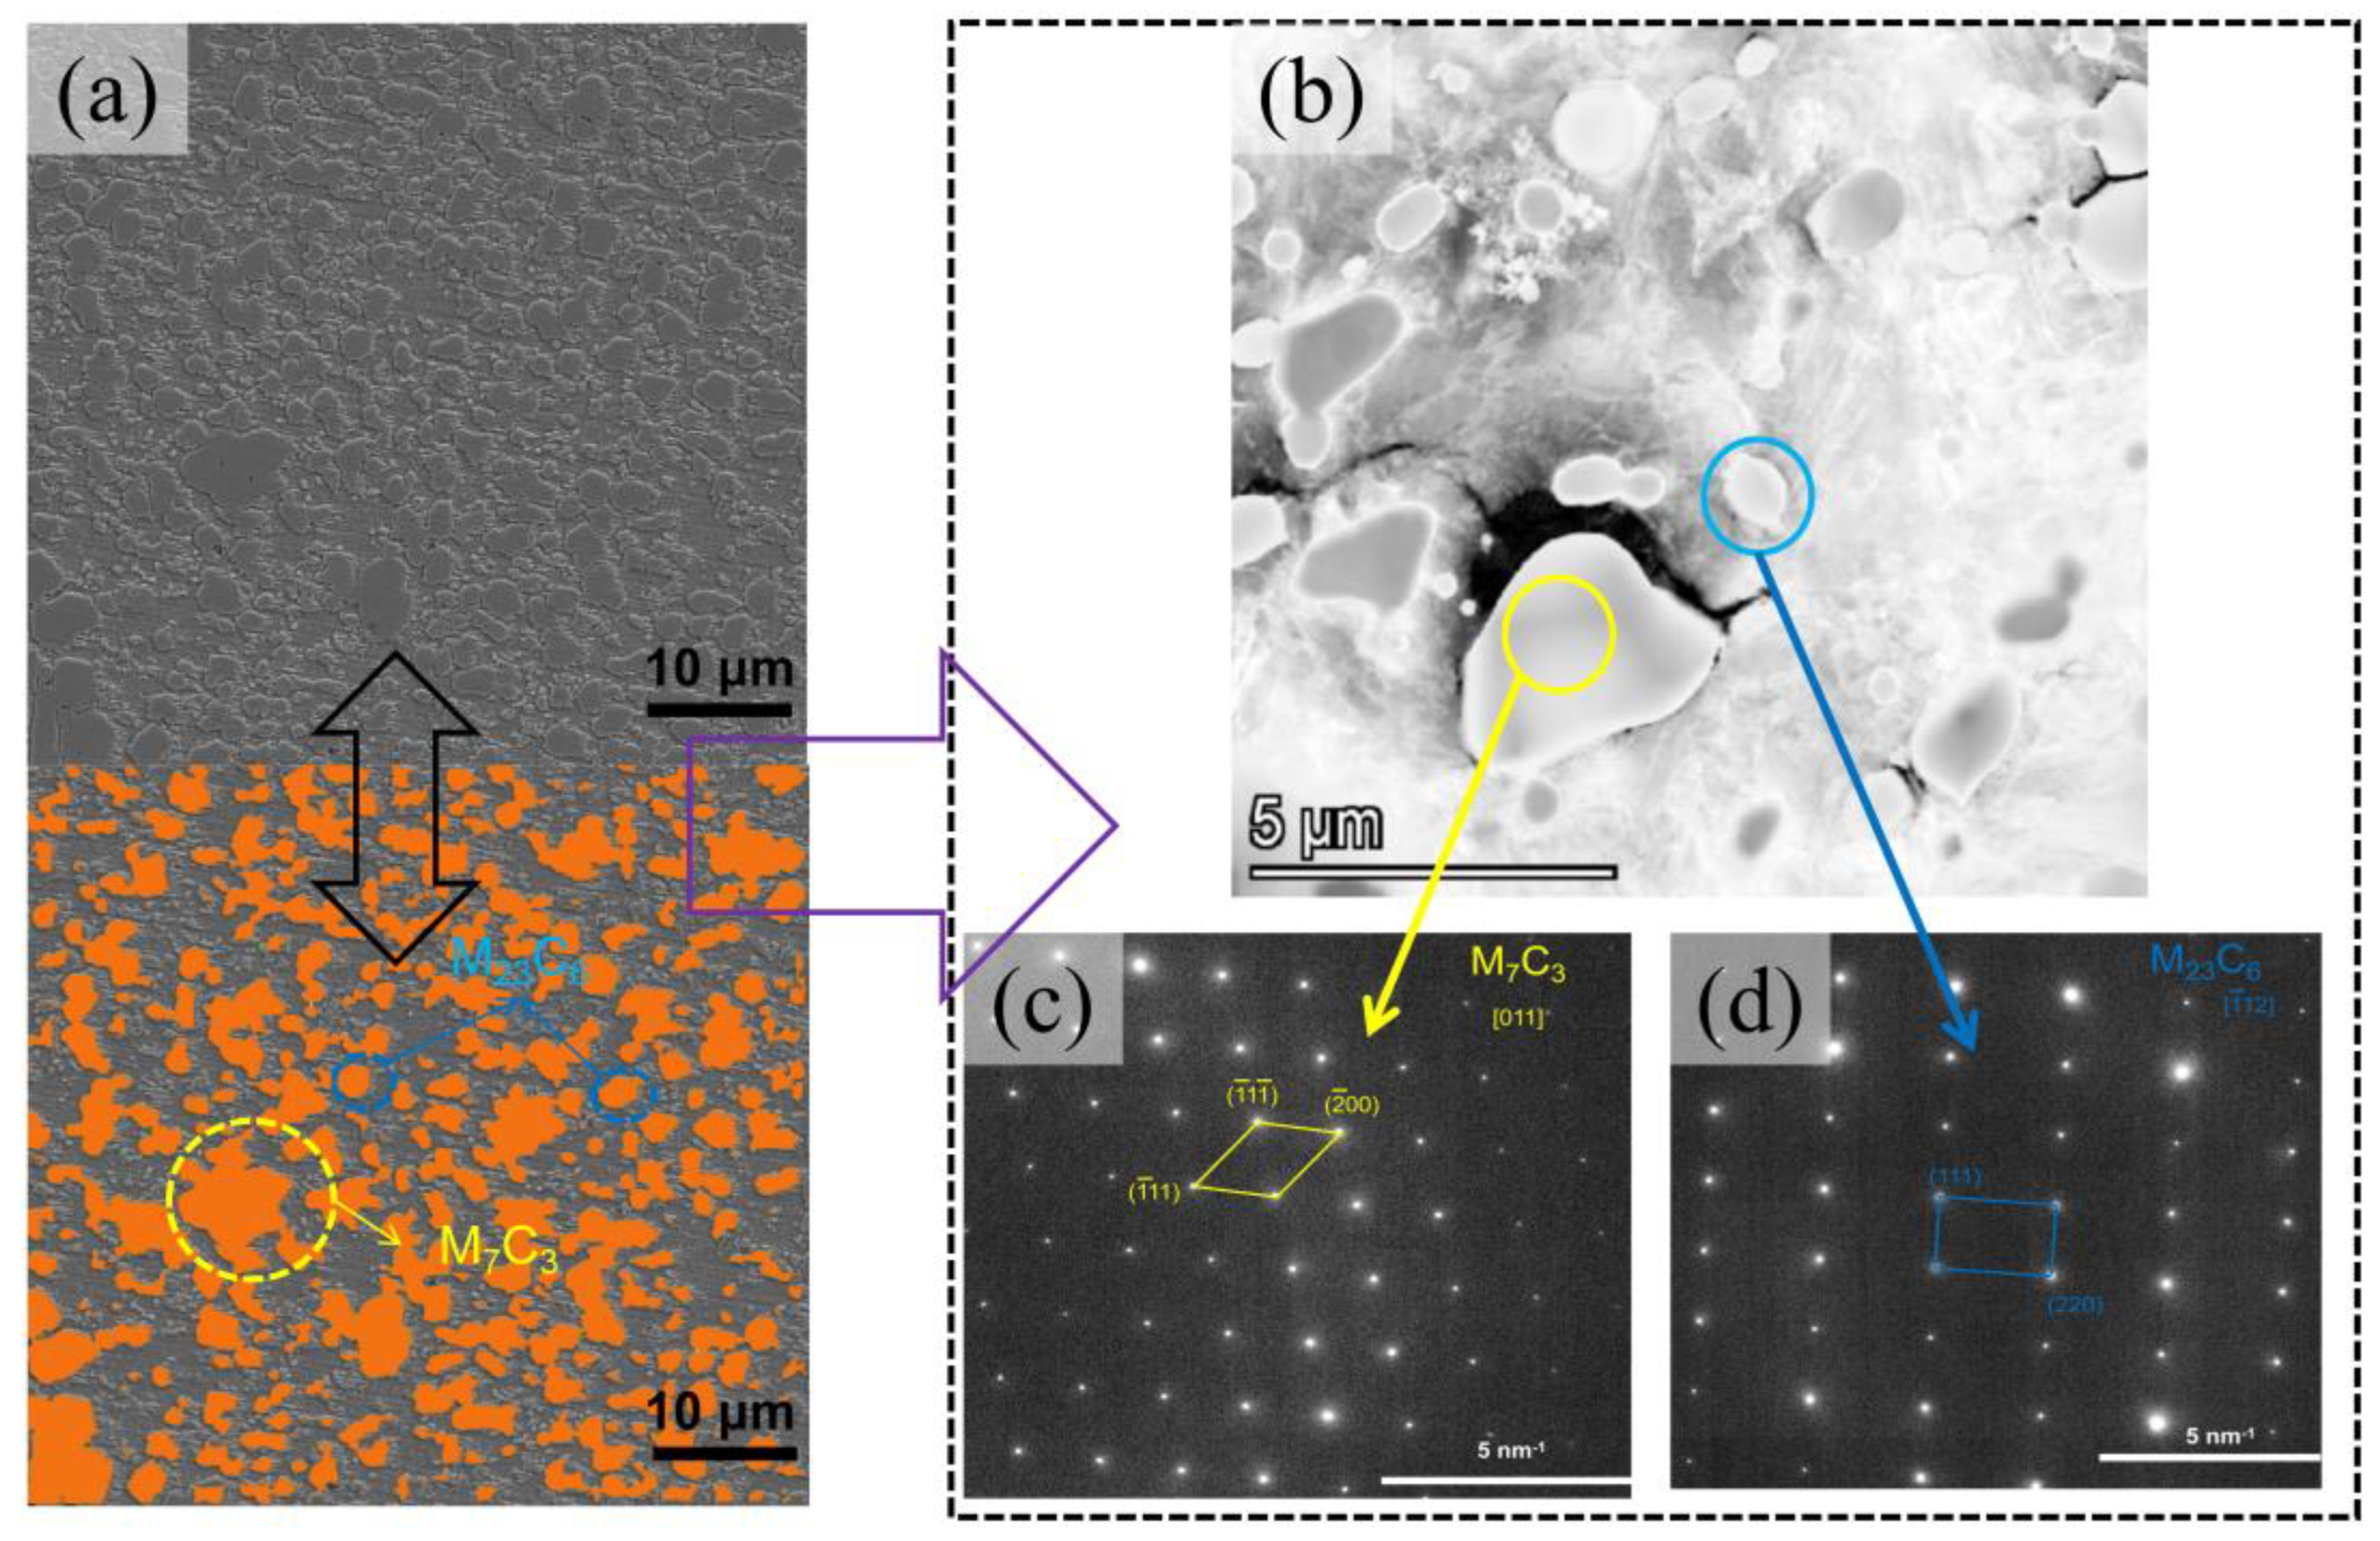
Figure 2a shows the morphology of the microstructure of the 90Cr18MoV samples as received. The carbides (orange marker) occupied a large portion of the 90Cr18MoV matrix. The corresponding TEM images of carbides are shown in Figure 2b–d. The diffraction patterns indicate that these large carbides are composed mainly of M7C3 inside grains (marked in yellow) while the small carbides are composed mainly of M23C6 (marked in blue).
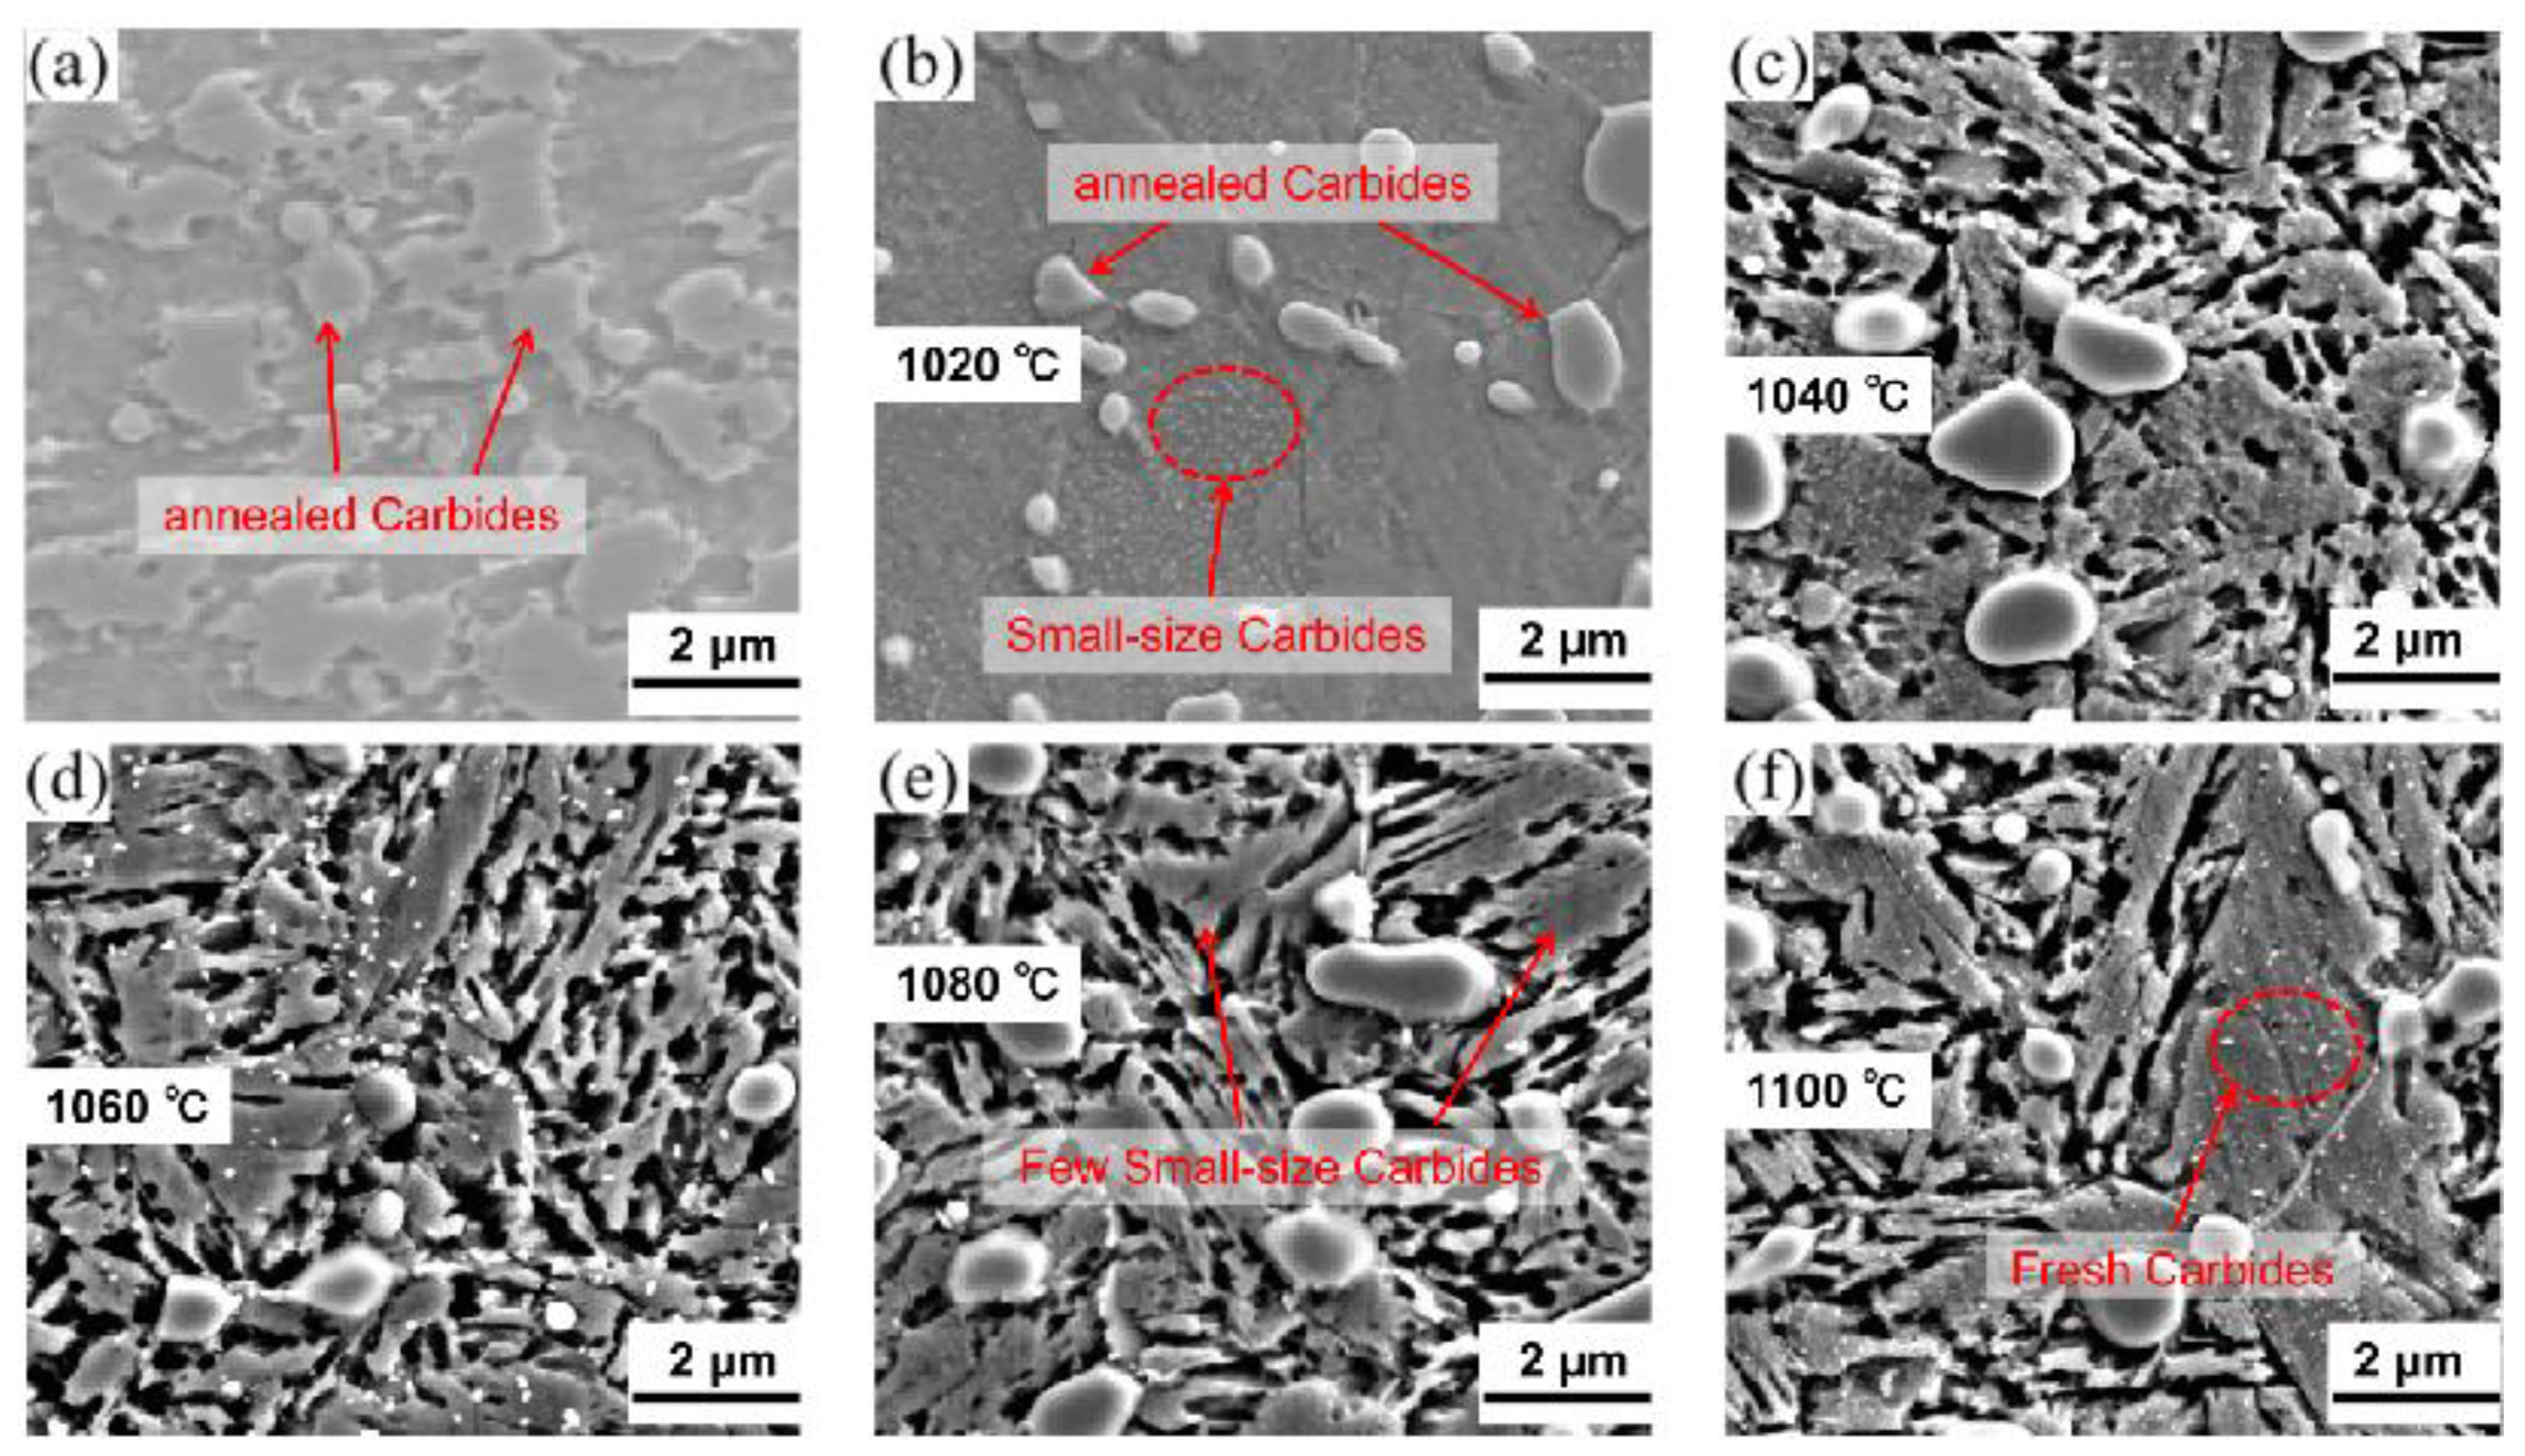
Martensite formed due to the post-quenching processes, as a supersaturated solid solution of carbon, has been believed to present high hardness [23]. To obtain high hardness, the 90Cr18MoV were quenched at different temperatures of 1020 °C, 1040 °C, 1060 °C, 1080 °C, and 1100 °C. We designated these samples as Q-1020, Q-1040, Q-1060, Q-1080, and Q-1100, respectively. The microstructure of 90Cr18MoV before and after different quenching temperatures are shown in Figure 3. The presence of a large area of precipitated carbides in the original sample, as shown in Figure 3a, is attributed to the annealing process that facilitates the precipitation within the carbide matrix, thereby softening the material and making it easier to process.
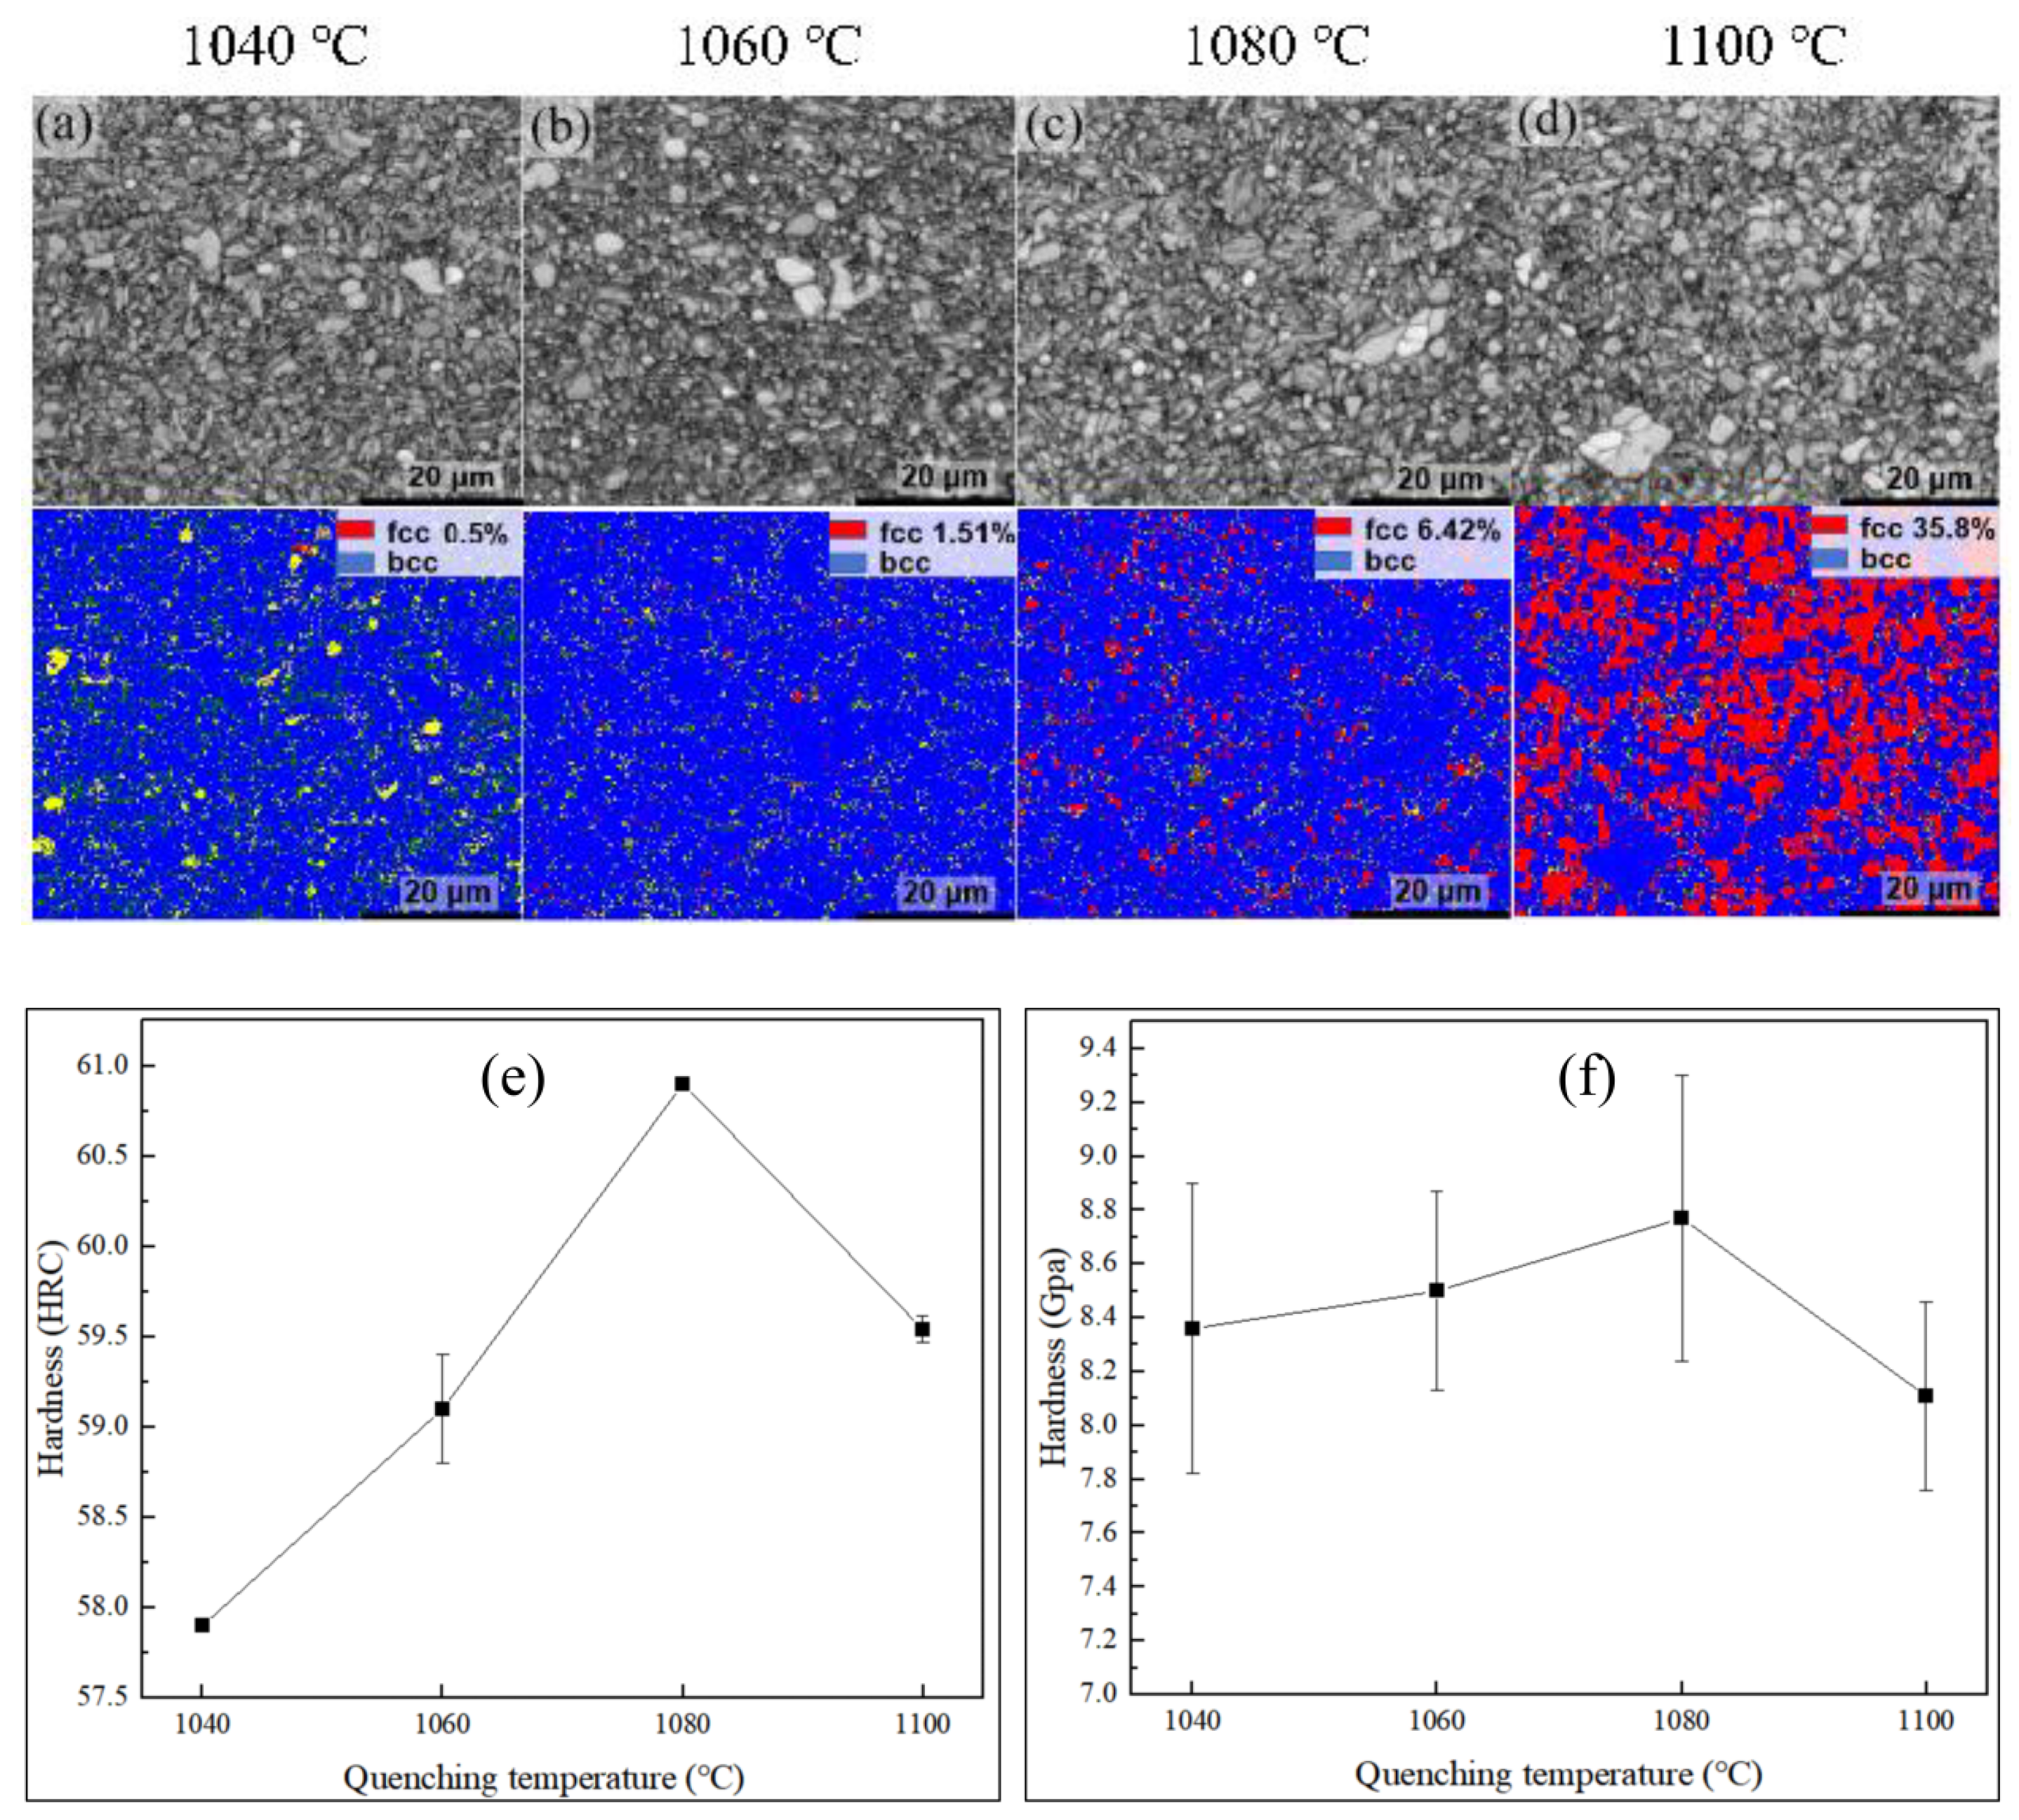
As the temperature increases, the carbides in the matrix gradually diminish. Larger carbides decrease in size, while smaller carbides completely dissolve back into the matrix. In Figure 3e, it can be observed that no minute carbides are present in the matrix of the Q-1080 sample. However, as shown in Figure 3f, with a further elevation of the temperature, carbides begin to reappear in the matrix of the Q-1100 sample. At the same time, an increase in carbon concentration of the matrix resulted in a decrease in the martensitic transformation temperature. This phenomenon leads to an incomplete austenite to martensite transformation under different quenching conditions. The phase structure analysis was conducted on the samples subjected to quenching using EBSD, and the results are presented in Figure 4. At a quenching temperature of 1040 °C, the retained austenite having an fcc structure is labeled in red and its area fraction is 0.5% as shown in Figure 4a–d. The fraction of the fcc structure increased to 1.15% after quenching at a temperature of 1060 °C. The fraction of the fcc structure increased to 6.42% after quenching at a temperature of 1080 °C. After quenching at 1100 °C, the fraction of the fcc structure reached up to 35.8%. Therefore, as the quenching temperature increases, the content of austenite in the matrix also rises. Concurrently, fine carbides gradually dissolve back into the matrix with increasing quenching temperatures, leading to an increase in carbon content within the matrix. Since carbon (C) is a stabilizing element for austenite [24], a higher carbon content enhances the stability of austenite during heat treatment. Consequently, residual austenite becomes more prevalent with rising quenching temperatures, which aligns with findings from other studies [25,26]. In this research, we determined that the critical quenching temperature for carbon dissolution is 1060 °C.
To investigate the effect of an increasing quenching temperature on the microstructure and hardness of 90Cr18MoV, we conducted hardness characterization on samples quenched at different temperatures, as illustrated in Figure 4d,e. Under identical quenching times, the macroscopic hardness of 90Cr18MoV initially increases with a rising quenching temperature before subsequently decreasing. A similar trend is observed in the microscopic organizational hardness, which also shows an initial increase followed by a decline. Notably, samples quenched at 1080 °C exhibit maximum hardness values of 61 HRC and 8.8 GPa. The hardness of 440C martensitic stainless steel obtained through deep cryogenic treatment, as reported by A. Idayan et al., is approximately 60 HRC [27]. To validate that the measured microscopic hardness reflects the material’s structural integrity, we performed SEM scanning analysis on samples post-nanoindentation testing, as shown in Figure 4f.

3.2. Tempering Treatment

To eliminate the internal structural defects of samples after rolling and quenching, it is necessary to perform tempering treatment on the quenched samples. As shown in Figure 4, the hardness of samples quenched at a temperature of 1060 °C is the highest. Additionally, from the EBSD results of the quenched samples, it can be observed that there is minimal residual austenite present when quenched at this temperature. Therefore, we will perform wire cutting on the Q-1060 samples to divide them into multiple smaller specimens for subsequent tempering treatment.
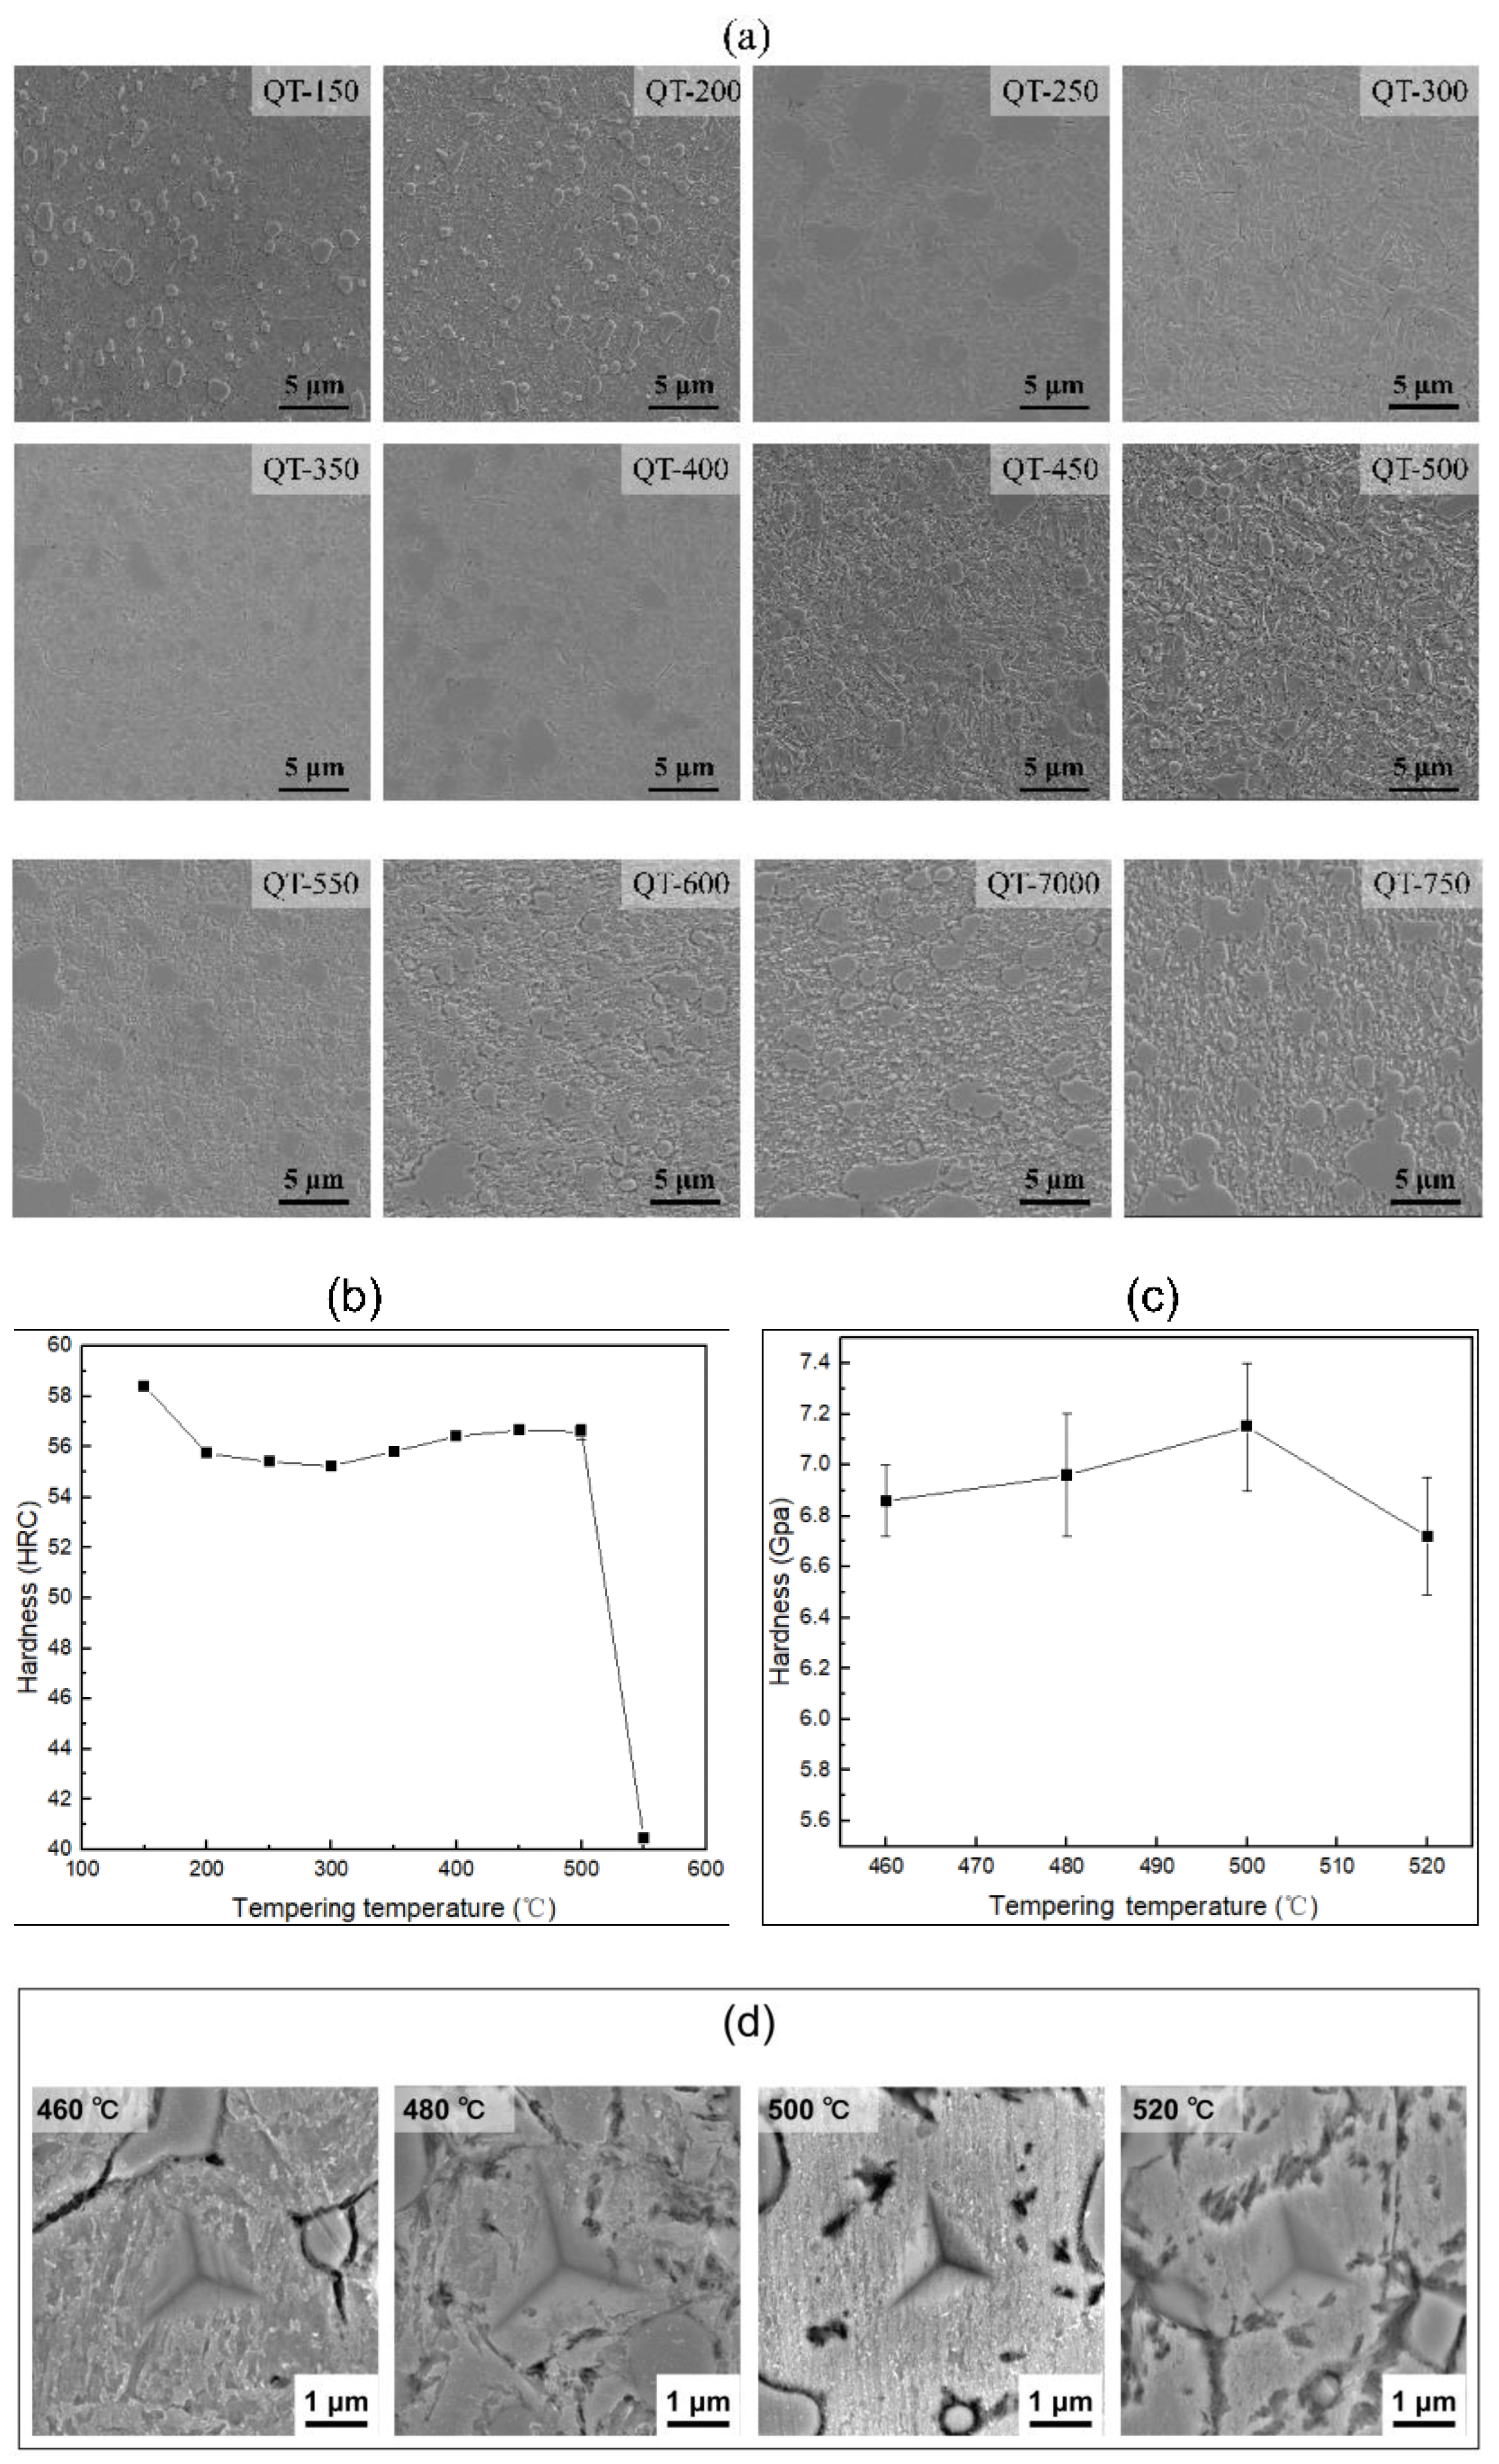
As illustrated in Figure 5, SEM scanning images of tempered samples at different temperatures reveal that the microstructure primarily consists of martensite and some dispersed carbides. Furthermore, with an increase in the tempering temperature, a significant number of precipitates appears within the matrix structure. Specifically, as depicted in Figure 5a, numerous precipitates are observed in the matrices of samples tempered at temperatures of 550 °C and 600 °C, respectively. Zhenfeng Xu et al. [28] conducted a study on the precipitation behavior of M23C6 under various boundary conditions, confirming that M23C6 precipitates at a temperature of 600 °C.
To investigate the relationship between the hardness of tempered samples and tempering temperature, we conducted a macro-hardness analysis on samples tempered at different temperatures, as illustrated in Figure 5b. The hardness of the samples exhibited an initial increase followed by a decrease with rising tempering temperatures. Additionally, to examine the secondary hardening characteristics of the matrix in tempered samples, we performed nanoindentation hardness analysis on specimens tempered at 460 °C, 480 °C, 500 °C, and 520 °C. By combining nanoindentation techniques with scanning electron microscopy (SEM), we assessed the hardness of the matrix for these specific tempering temperatures. As shown in Figure 5c,d the maximum nanoindentation hardness achieved during secondary hardening of the tempered samples was found to be 7.2 GPa. The maximum macrohardness is 57 HRC.

4. Discussion

4.1. Phase Diagram Calculation

The phase diagram was calculated using Thermo-Calc software, as illustrated in Figure 6a. The high-temperature liquid phase exists above 1250 °C, while the austenite phase is present within the temperature range of 800 °C to 1380 °C. In this study, the quenching temperatures employed are 1020 °C, 1040 °C, 1060 °C, 1080 °C, and 1100 °C; Thus, these quenching temperatures fall within the austenite phase region. Furthermore, with an increase in the quenching temperature, the relative content of the austenite phase also gradually increases, which is consistent with the EBSD results presented in Figure 4. The bcc structure appears between temperatures of 1350 °C and 1420 °C, as well as below temperatures of 830 °C. The two-phase region comprising fcc and bcc structures exists within the temperature range of 800 °C to 850 °C. Therefore, all tempering processes conducted in this study occur outside this two-phase region. M23C6 can be found at temperatures below 1180 °C while M7C3 may appear within a temperature range from 1150 °C to 1270 °C.
Figure 6b presents the phase composition diagram of M23C6 at equilibrium, simulated using Thermo-Calc. It is evident that there is a significant increase in the presence of M23C6 within the temperature range of 330 °C to 385 °C, after which it begins to re-dissolve into the matrix at temperatures exceeding 800 °C. Although the processing methods employed in this study do not allow for the samples to achieve complete equilibrium at identical temperatures, the overall trend remains consistent. Consequently, during the tempering process, precipitation of M23C6 will occur. In order to investigate the precipitation conditions of the M23C6 phase that are compatible with industrial production, we will employ transmission electron microscopy for a more detailed analysis of the samples.
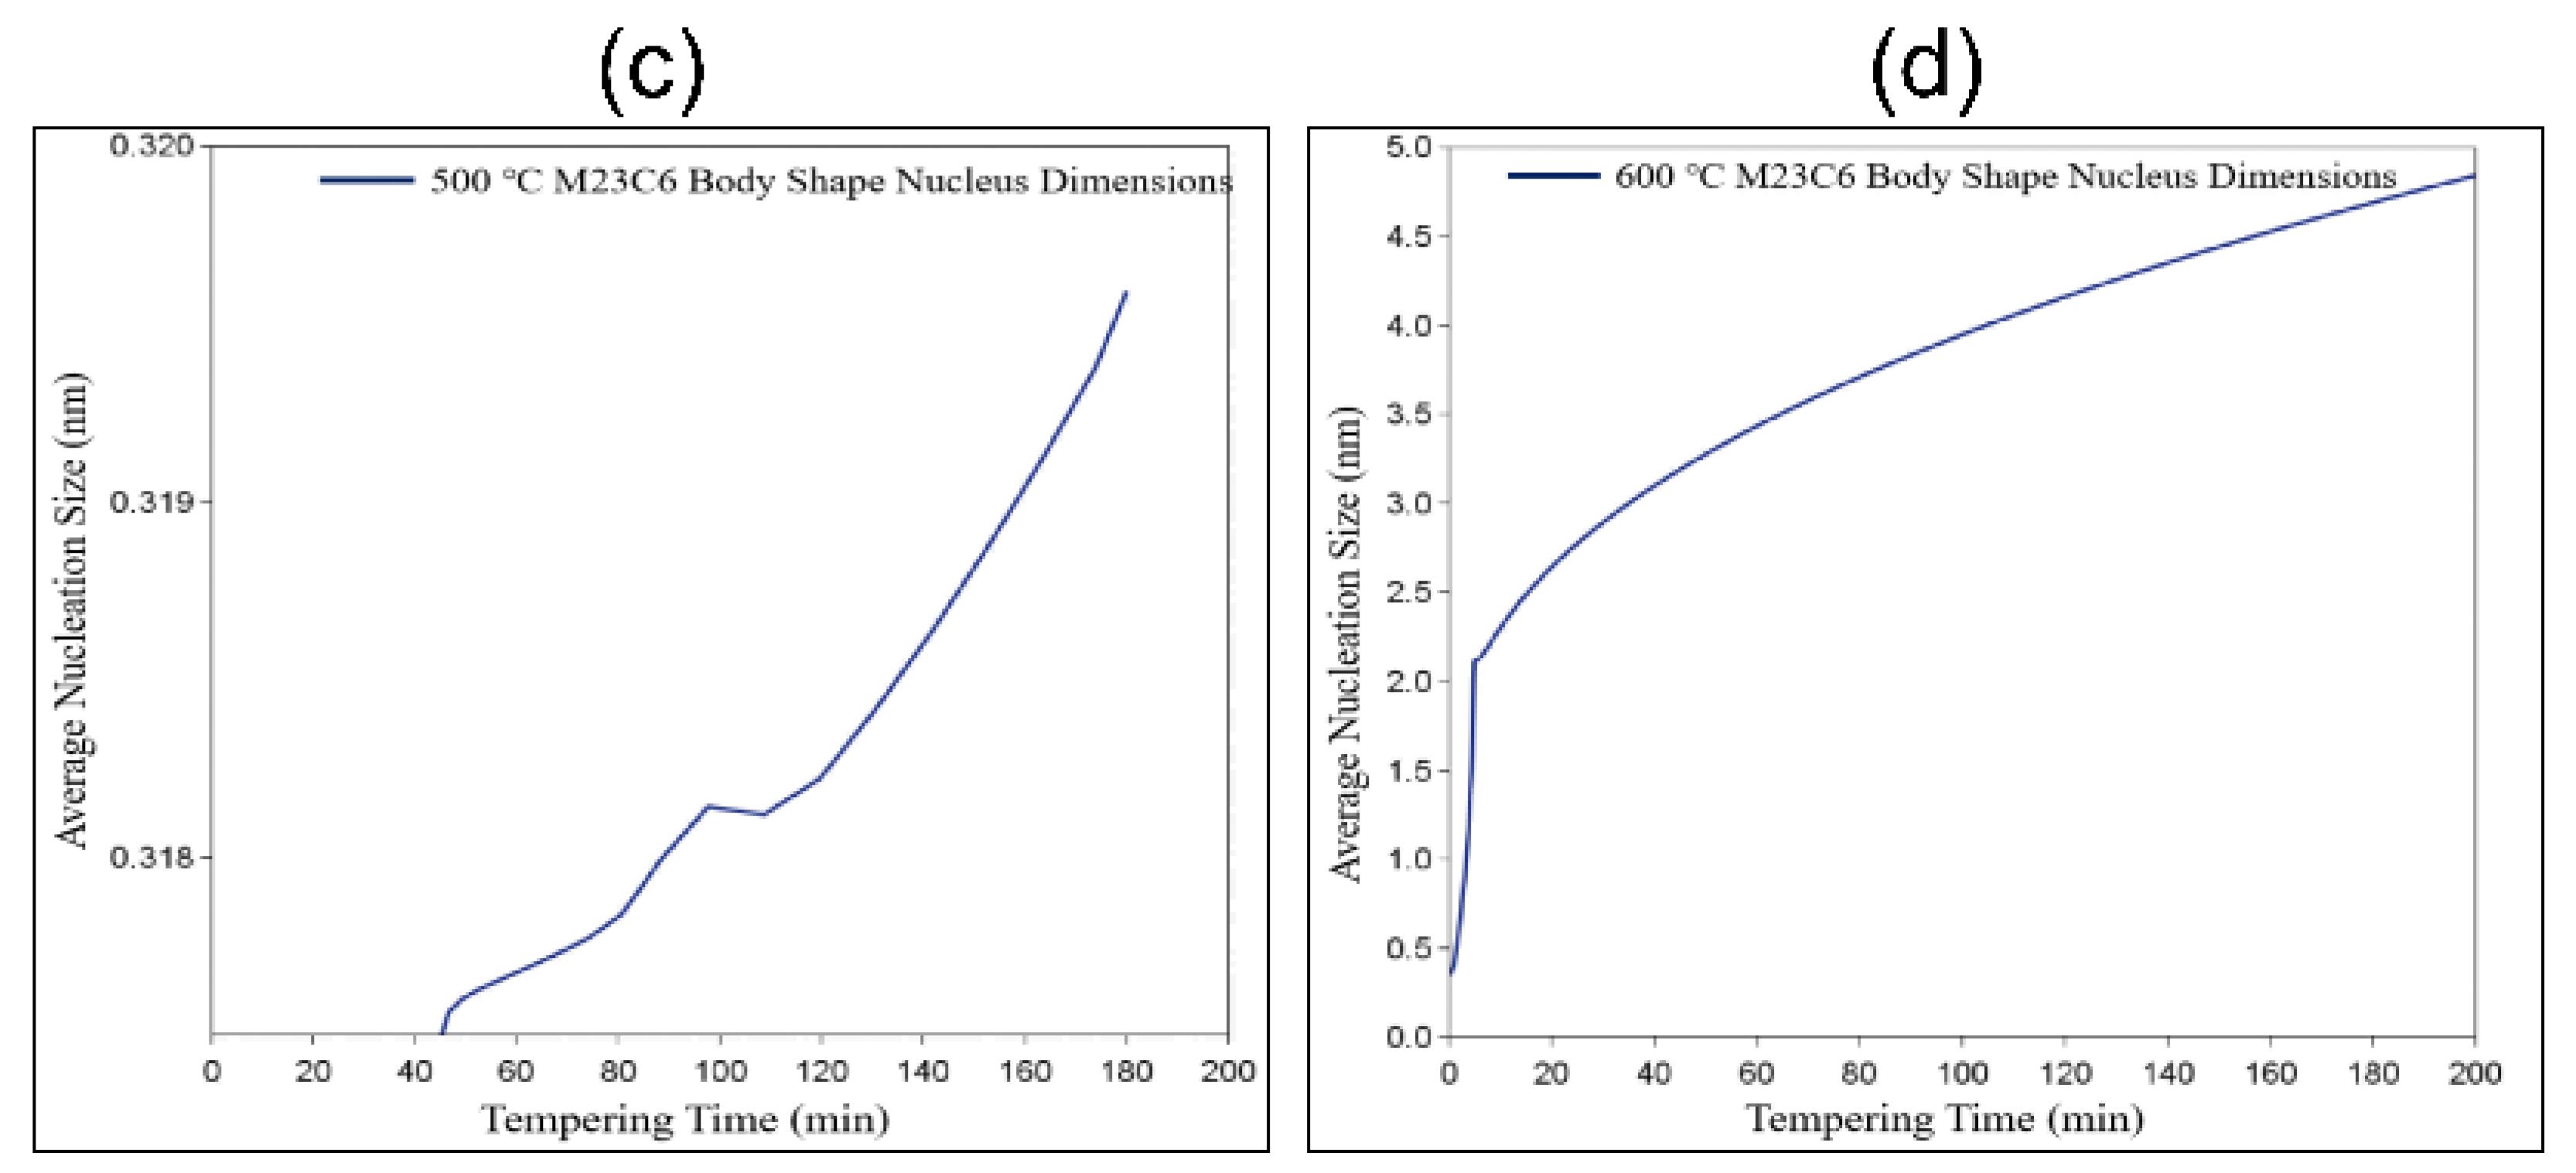
To investigate the precipitation models of M23C6 and MC at different temperatures, this study employs Thermo-Calc to analyze and simulate the nucleation and growth of M23C6 and MC in samples using both bulk nucleation and grain boundary nucleation models. As shown in Figure 6c, under isothermal conditions at 500 °C, simulations were conducted to assess the nucleation and growth of M23C6 over varying holding times in a fully equilibrated state. Similarly, Figure 6d presents simulations for the same parameters at 600 °C.
It can be observed that at a temperature of 500 °C, as the holding time increases, both M23C6 exhibit continuous growth in their nucleation sizes. Likewise, at a temperature of 600 °C, an increase in the holding time also leads to an enhancement in the size of M23C6 nuclei. However, it is noteworthy that the sizes of precipitated carbides (M23C6) formed at 600 °C are significantly greater than those formed at 500 °C.

4.2. Microstructural Characterization

In order to investigate the reasons for the changes in hardness of samples under different tempering conditions, we conducted STEM analysis on samples tempered at various temperatures, as illustrated in Figure 7. Figure 7a–c represent the tempered samples at temperatures of 150 °C, 250 °C, and 350 °C, respectively. It can be seen that the number of dislocations formed after quenching significantly decreased with an increase in the tempering temperature. Zhang et al. [29] investigated the toughening mechanisms during the tempering process of high chromium steel, revealing that as the tempering temperature increases, the dislocation structure within the experimental steel significantly diminishes. Combining this observation with the relationship curve between the sample hardness and tempering temperature shown in Figure 5, we conclude that higher tempering temperatures effectively reduce structural defects; consequently, as these organizational defects diminish, the material hardness also tends to decrease. It is evident that as the tempering temperature increases, the number of residual structural defects (dislocations) remaining after quenching significantly decreases. This microstructural morphology corroborates the relationship curve between sample hardness and tempering temperature presented in Figure 5.
However, a continuous increase in the tempering temperature resulted in the formation of nanoscale precipitates within the matrix of the 90Cr18MoV alloy as shown in Figure 8a–c. Wang et al. [30] conducted a study on the aging strengthening of high-carbon high-Cr steel and found that the carbides precipitated during the tempering process have a certain reinforcing effect on the matrix. Furthermore, accumulation of dislocations around these fine carbides was observed, leading to a secondary hardening effect observed in the tempered samples. To gain a deeper understanding of the specific characteristics of these precipitates, further detailed analyses are required.
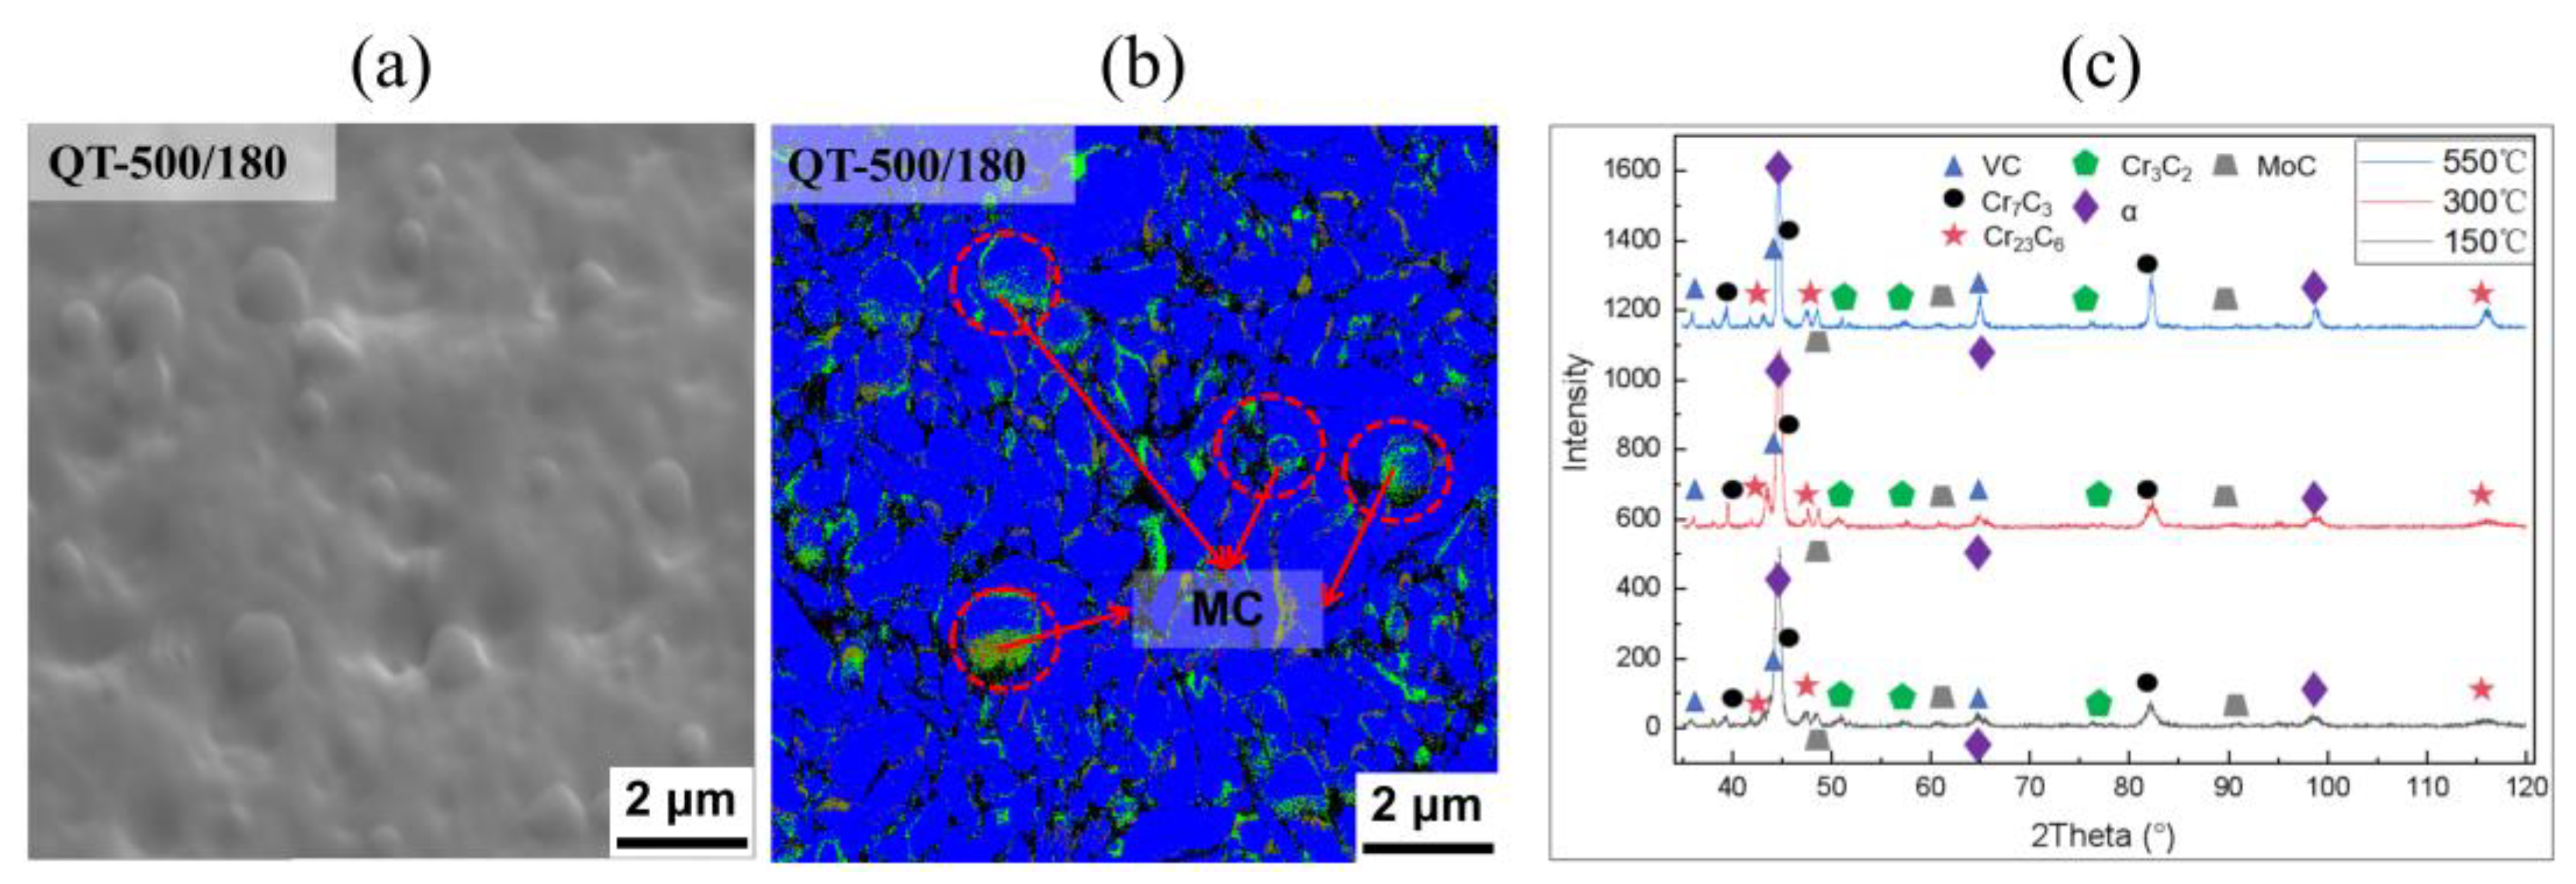
To further investigate the lattice structures of the above samples, we initially employed Electron Backscatter Diffraction (EBSD) to study the lattice structure of the samples post-tempering; the results are shown in Figure 9. Figure 9a presents the QT-500/180. The results indicate the presence of smaller carbides surrounding larger carbides. These are small carbides, specifically MoC and VC; some researchers have experimentally verified that carbides such as VC precipitate during the tempering process [31,32]. They are observed to precipitate exclusively around the particles of the larger carbides. The tempered samples were scanned by XRD and are shown in Figure 9c. The results again verified the existence of MoC and VC in the matrix after quenching. Furthermore, it was noted that the content of M23C6 and MC increased continuously with rising tempering temperatures.
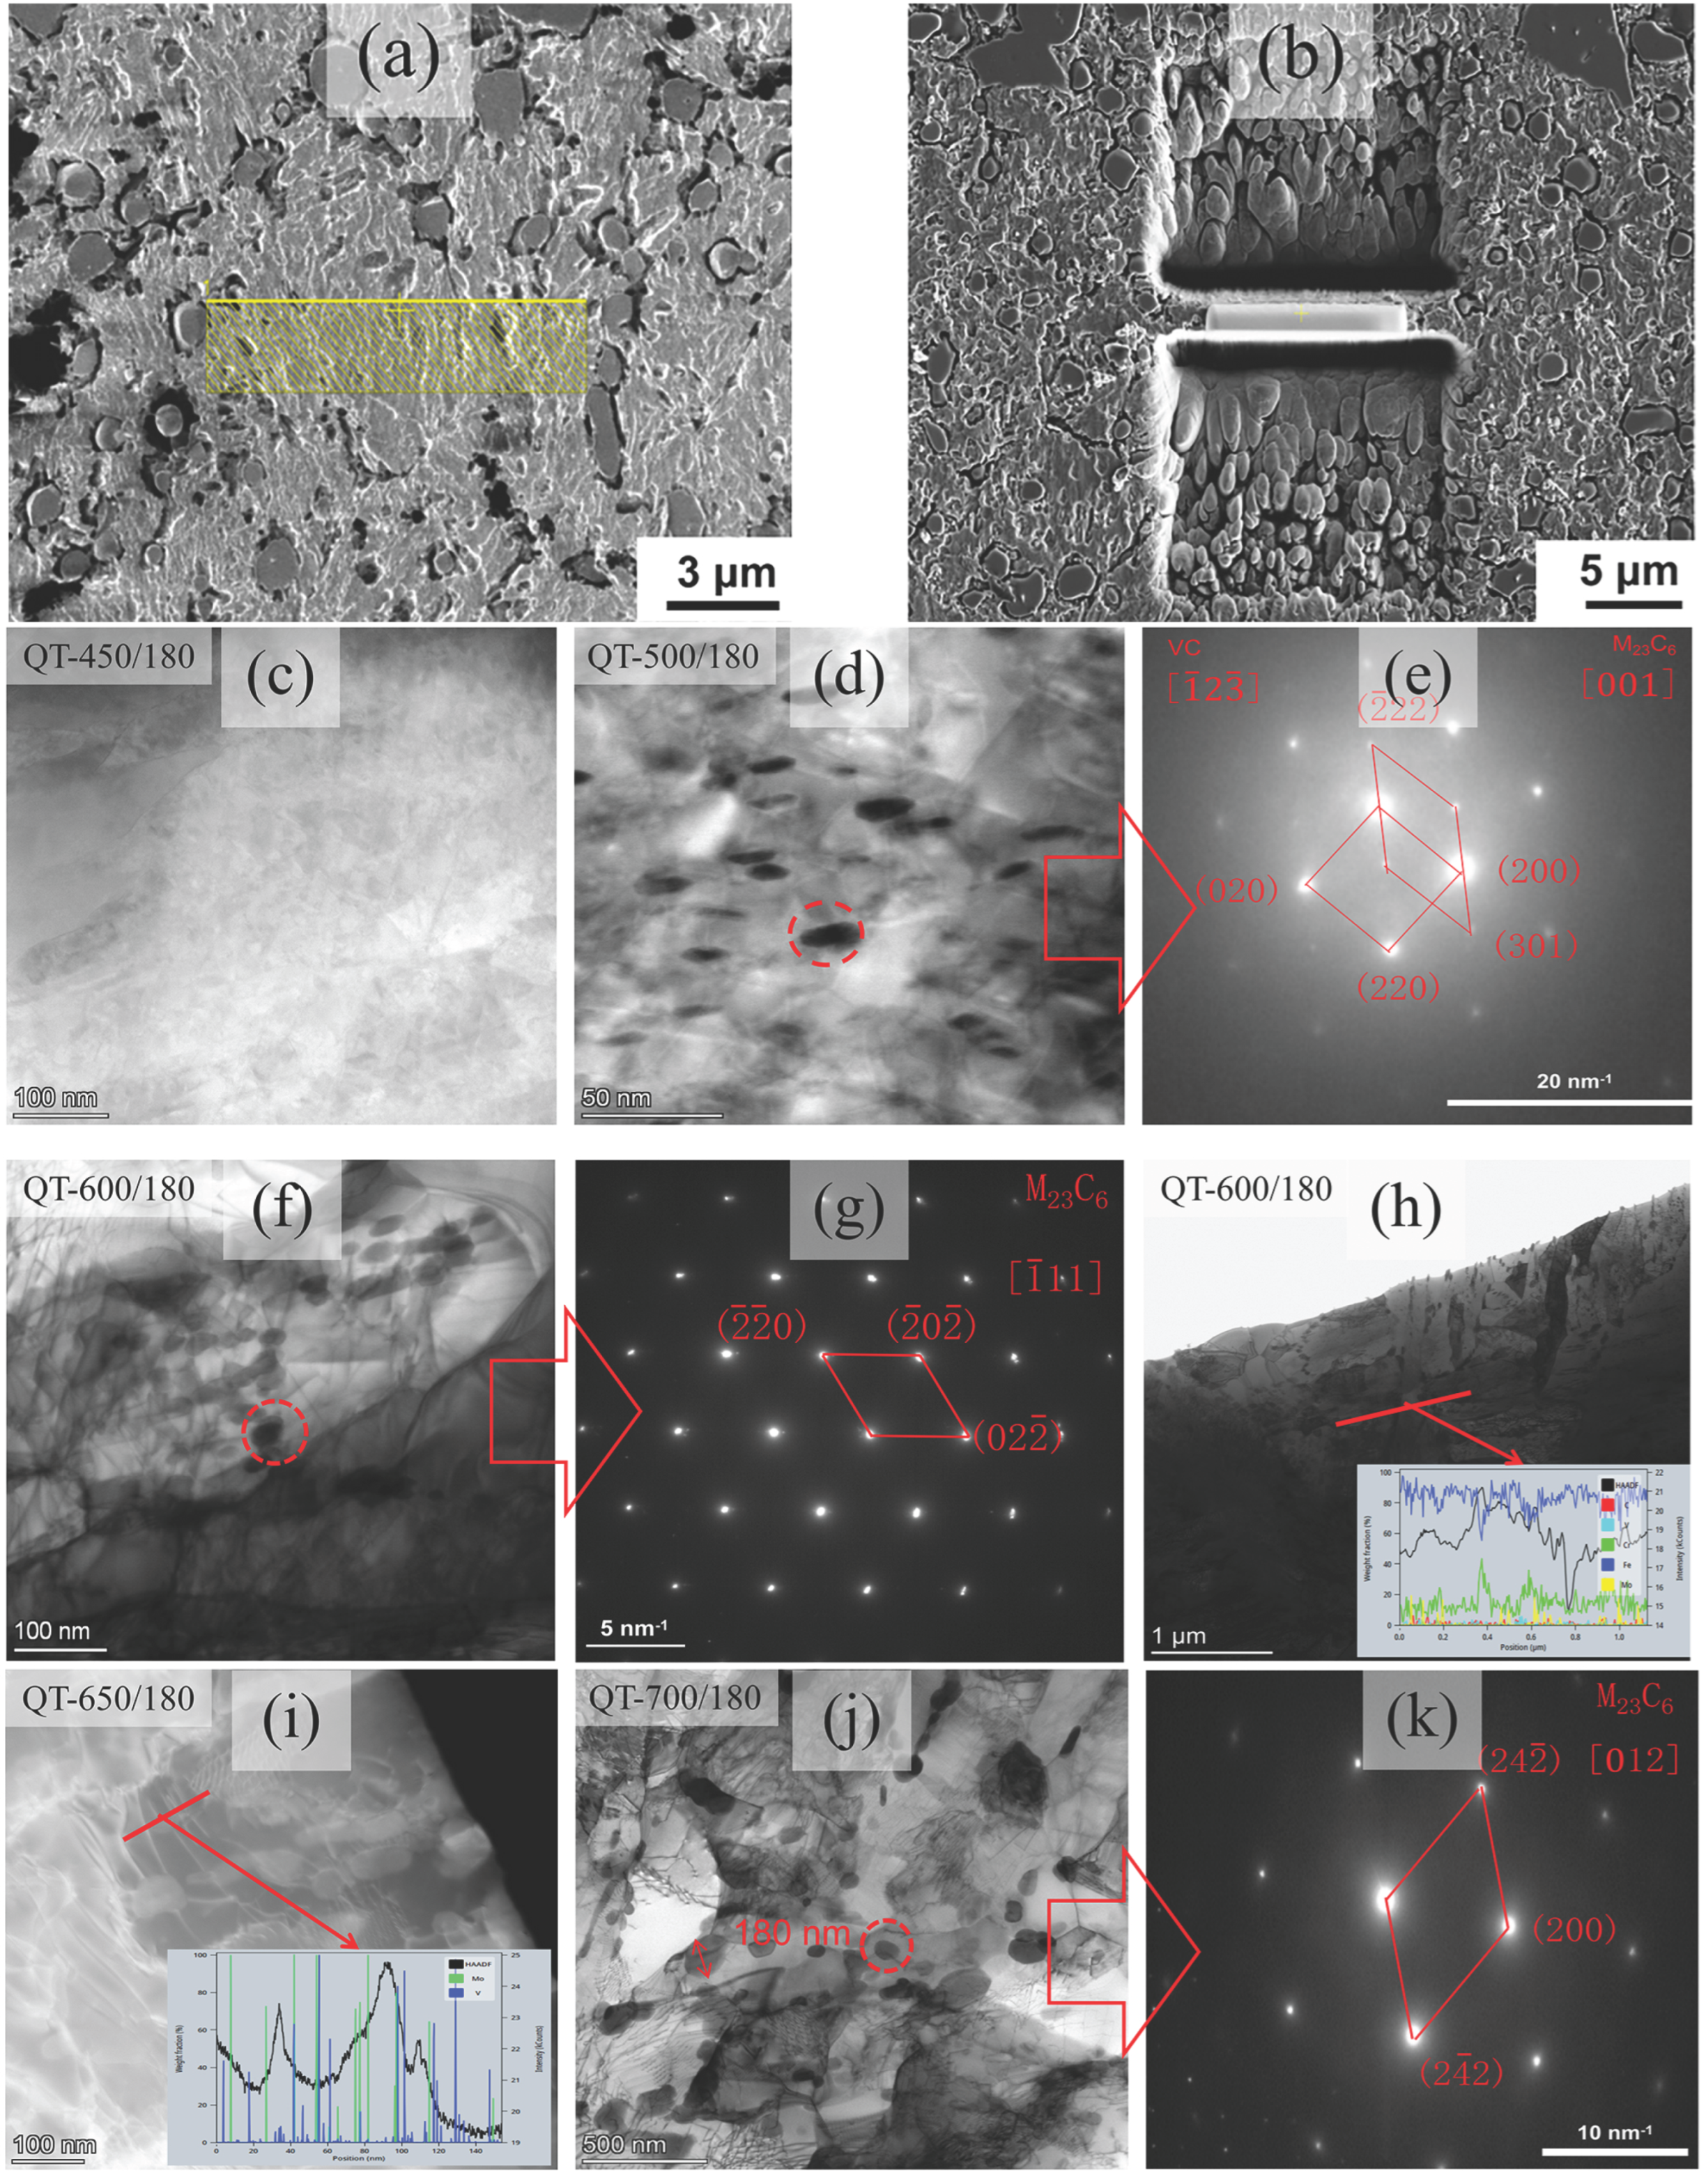
To verify the specific structure and composition of carbides precipitated during high-temperature tempering, TEM diffraction analysis was conducted on the carbide precipitation regions. FIB was employed to cut and thin the tempered samples as shown in Figure 10a,b. Figure 10c presents the QT-450/180 in which no fine carbides were observed within the matrix. In contrast, Figure 10d illustrates QT-500/180 where the average size of the precipitated carbides is approximately 20 nm. The corresponding diffraction pattern is shown in Figure 10e. It indicates that the carbides are VC and M23C6. The positional correlation of the diffraction spots indicates that M23C6 is nucleated on MC. Figure 10f illustrates the transmission dark field image of the precipitates in the QT-600/180 sample. The corresponding diffraction pattern is shown in Figure 10g, and the carbides were verified to be M23C6 and the average size of the precipitated carbides is 50 nm as shown in Figure 10f. Figure 10j shows QT-700/180 with the transmission dark field image. The corresponding diffraction pattern is shown in Figure 10k, and the carbides were verified to be M23C6 while the average size larger than 100 nm is shown in Figure 10j. These small M23C6 directly precipitate from the matrix during post-tempering and grow gradually with the increasing tempering temperature.

4.3. Refinement of Precipitate Size Statistics

The carbides precipitated during tempering are randomly dispersed within the matrix, contributing to dispersion strengthening. From Figure 10, it can be observed that the precipitated carbides exhibit an fcc structure corresponding to M23C6. To quantitatively investigate the effect of carbide size on the hardness performance of 90Cr18MoV due to tempering, we employed transmission electron microscopy (TEM) to statistically analyze the sizes of precipitates in samples tempered at different temperatures, as illustrated in Figure 10j, Figure 11b and Figure 12d,f. As the tempering temperature increases, the average size of the carbides gradually rises. Specifically, after tempering for 180 min at a temperature of 500 °C, the average size of precipitates is measured at 19.9 nm. At a temperature of 600 °C, the average size of carbides in tempered samples reaches 54.7 nm; while at a temperature of 700 °C, this value further increases to an average size of 152.86 nm. The overall trend is consistent with the simulation calculation illustrated in Figure 6.
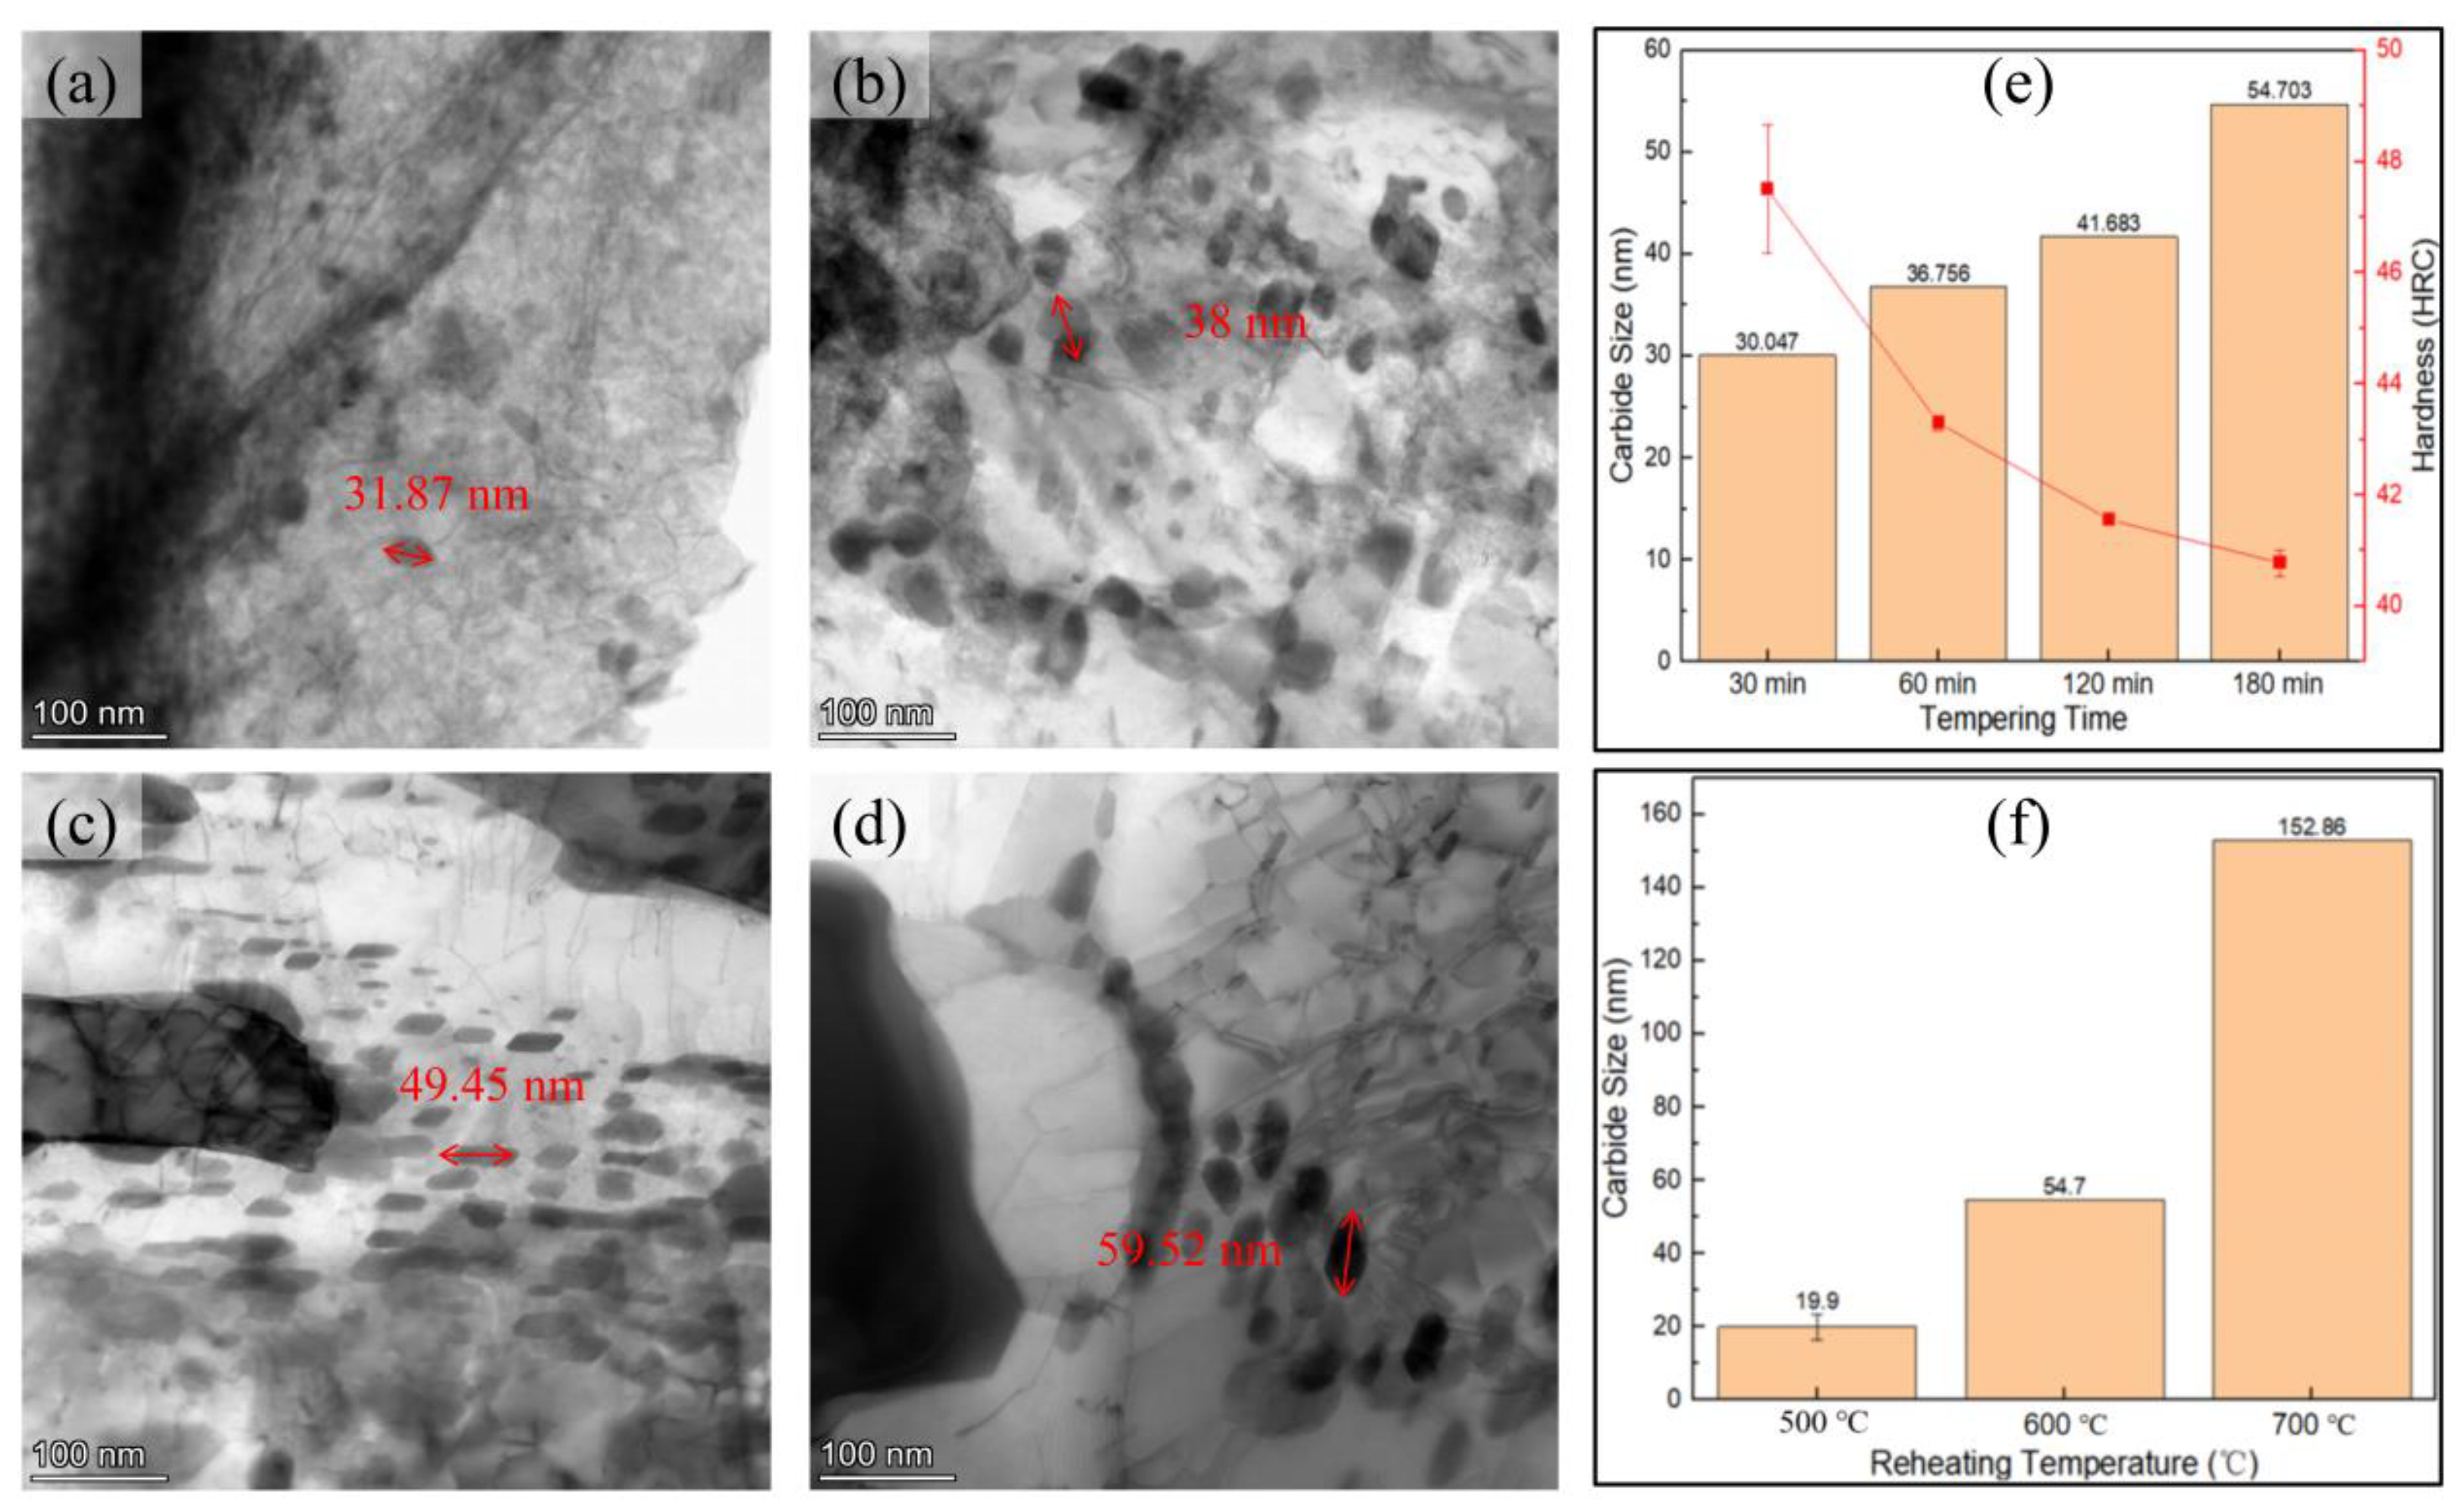
At the same time, to investigate the effect of different tempering durations on the size of secondary precipitated carbides at a constant temperature, we conducted tempering experiments on samples that were quenched at 1080 °C for various durations (30 min, 60 min, 120 min, and 180 min) at a temperature of 600 °C. The results are illustrated in Figure 12a–e. The average size of the precipitates after tempering for 30 min at 600 °C was approximately 30 nm. After tempering for 60 min, the average size increased to about 38 nm; following a duration of 120 min, it reached around 41 nm; and after tempering for an extended period of 180 min, the average size further increased to approximately 54 nm. As shown in Figure 12e it is evident that with an increasing tempering time, there is a corresponding decrease in the sample hardness.
In the process of studying the effect of different tempering times at the same temperature on the size of precipitated carbides in samples, we observed that at a tempering temperature of 500 °C, the sizes of precipitates varied with different tempering durations, as illustrated in Figure 11a,b. The size of precipitates after 60 min of tempering was approximately 10 nm, while after 180 min it increased to around 20 nm. However, despite the increase in tempering time, there was no significant change in sample hardness within the margin of error; as shown in Figure 11c, all samples maintained a hardness level around 59 HRC. By correlating Figure 10j, Figure 11b and Figure 12d, we conclude that when the tempering temperature exceeds 500 °C, an increase in this temperature leads to continuous growth of secondary precipitate M23C6 within the sample matrix. When M23C6 is sized at or below approximately 20 nm, it contributes positively to enhancing the sample hardness. Conversely, once M23C6 exceeds a size greater than 30 nm, its further growth results in a declining trend in the sample hardness.

4.4. The Formation Mechanism of M23C6

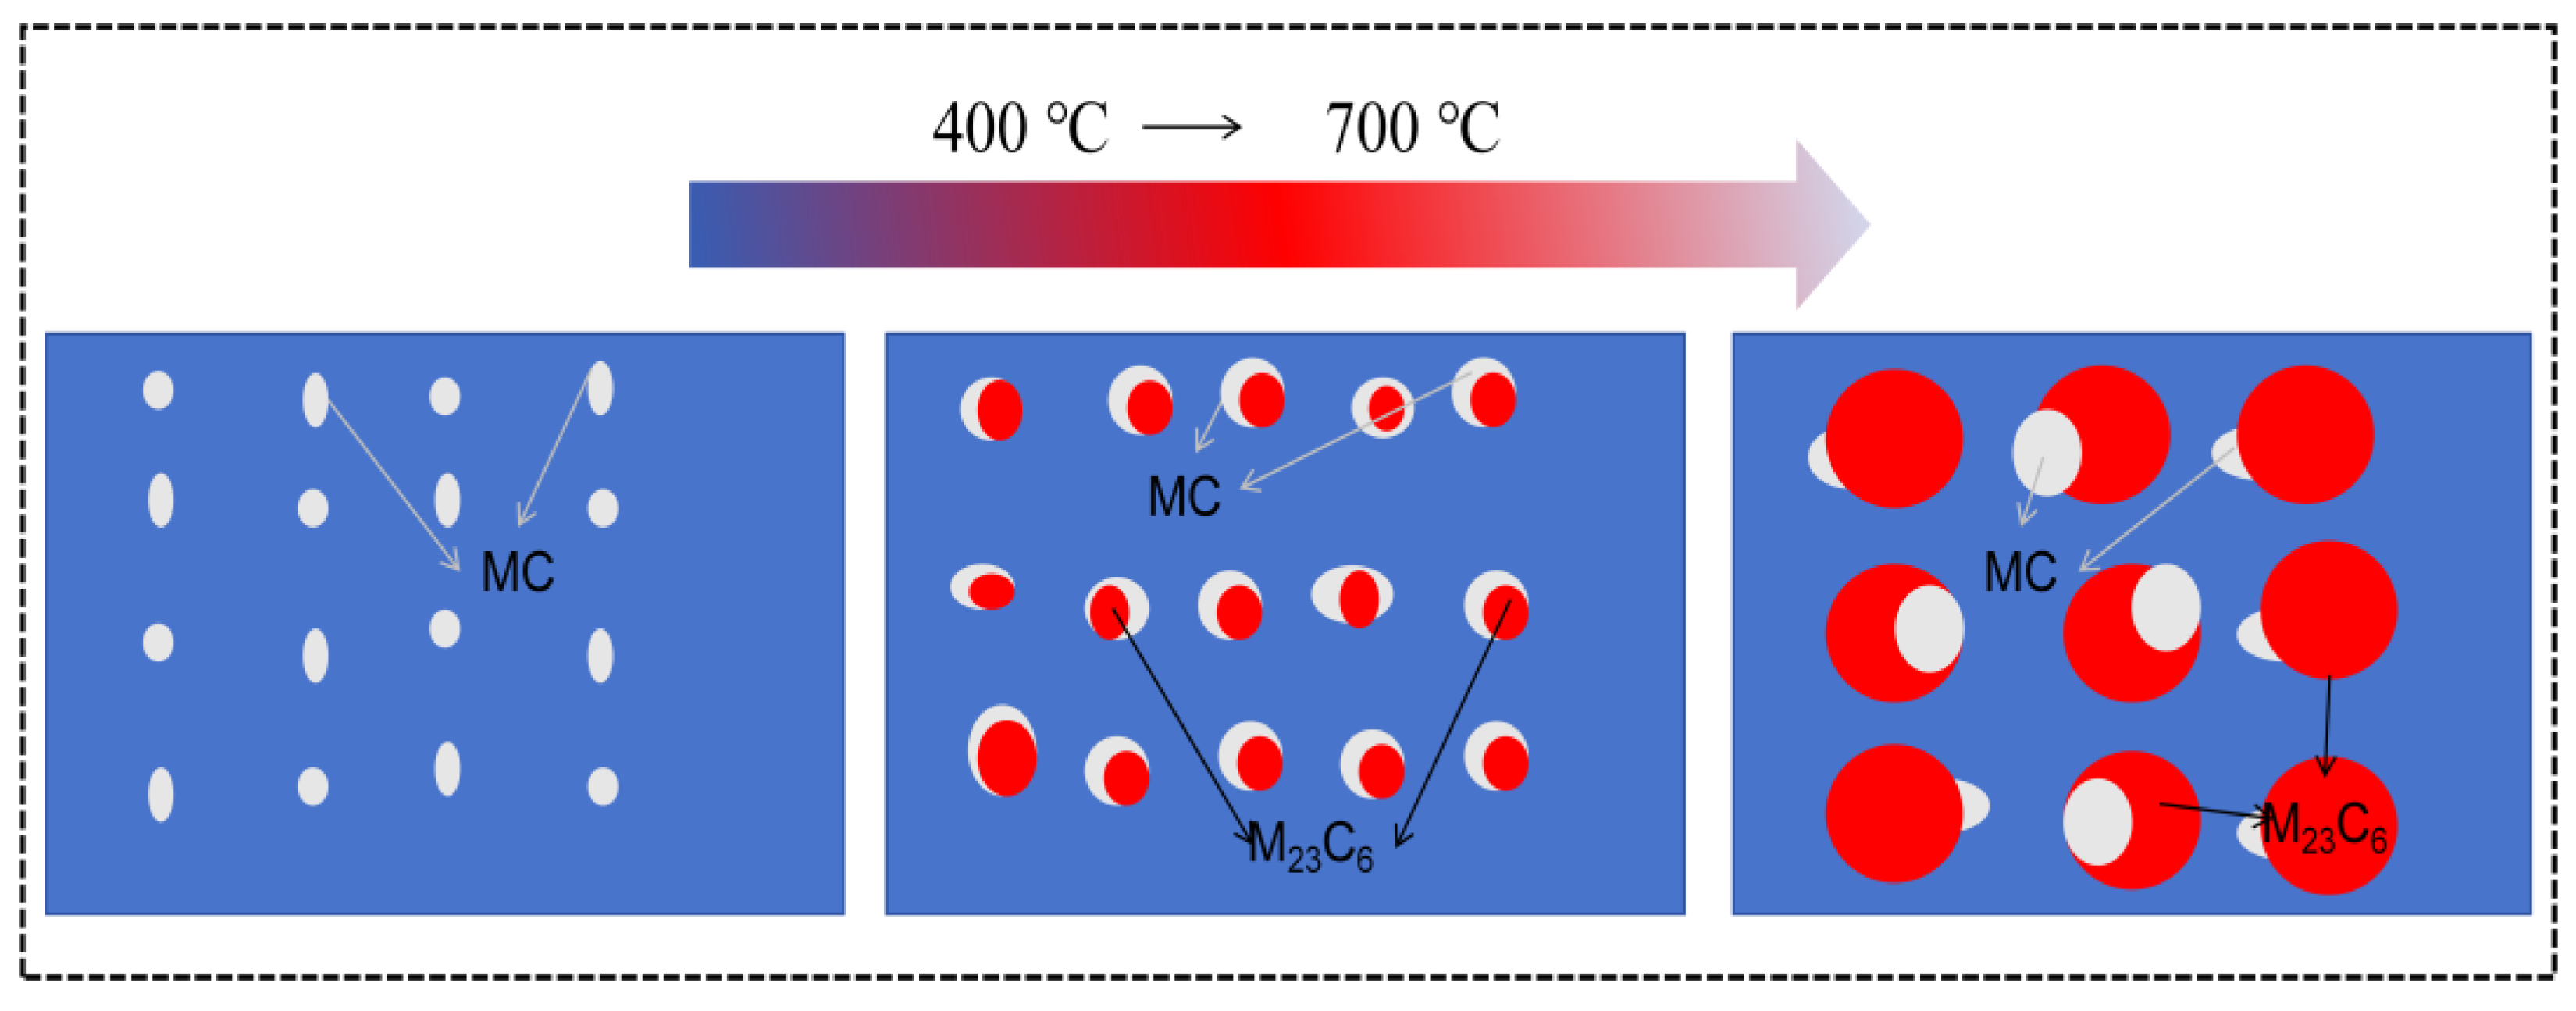
The presence of M23C6 in the tempered samples leads us to conclude that, in the samples tempered at 500 °C, we observed the formation of carbides with sizes of 20 nm and below. The TEM images of the QT-450/180 samples revealed that such fine carbides were not present in the matrix (see Figure 10d), Therefore, it is certain that the fine carbides precipitated at 500 °C are formed because of the diffusion of C and Cr elements within the matrix. Additionally, the presence of VC was identified within these small carbides as shown in Figure 9. The XRD and EBSD analyses conducted on different tempering samples indicate that MC is present in the tempered samples, with its quantity increasing alongside the rise in the tempering temperature. Furthermore, the analysis of diffraction spots presented in Figure 10e demonstrates that the secondary precipitation of M23C6 during tempering occurs at MC as a nucleation point. The schematic diagram illustrating the nucleation of M23C6 on MC is shown in Figure 13. Furthermore, this precipitate phase is beneficial for facilitating the nucleation of the fine carbides within the matrix [33]. The combination of V with C occupies the sites that were originally held by Cr and C pairs. The released Cr elements deceased the amount of precipitated chromium-containing carbides and affected the corrosion resistance of samples. Moreover, the growth behavior of these carbide precipitates is influenced by elemental diffusion.

5. Conclusions

This study investigated the effects of quenching and tempering temperatures and durations on the microstructure and mechanical properties of 90Cr18MoV, leading to the following conclusions.
(1) The 90Cr18MoV alloy, quenched at a temperature of 1080 °C, presented a small amount of retained austenites. The increase in the carbon content within the matrix contributes to the increase in hardness. The measured microhardness and nano-hardness were 61 HRC and 8.8 GPa, respectively.
(2) The effect of the tempering temperature on the quenched 90Cr18MoV samples at a temperature of 1080 °C was investigated. A maximum microhardness and nanohardness of 57 HRC and 7.2 GPa were achieved at the tempering temperature of 500 °C due to the secondary hardening.
(3) The phenomenon of secondary hardening during tempering is attributed to the combined effects of the precipitation of MC and M23C6 carbides, which are smaller than 20 nm in size, within the matrix. The M23C6 that precipitates during tempering serves as a nucleation site for further nucleation processes occurring in the matrix, originating from MC.
(4) At a tempering temperature of 500 °C, maintaining the process for 180 min can result in the formation of secondary precipitates approximately 20 nm in size, which enhances the hardness of the microstructure. In contrast, secondary precipitates larger than 30 nm tend to reduce the hardness of the microstructural features.

Author Contributions

Conceptualization, S.Y. and X.W. (Xinghua Wu); methodology, S.Y. and X.W. (Xuelin Wang); software, F.J.; validation, R.W., F.J. and C.S.; formal analysis, S.Y., R.W. and X.W. (Xinghua Wu); investigation, R.W., X.W. (Xuelin Wang) and X.W. (Xinghua Wu); resources, C.S.; data curation, S.Y., R.W., F.J. and X.W. (Xinghua Wu); writing—original draft preparation, R.W.; writing—review and editing, S.Y. and X.W. (Xinghua Wu); visualization, F.J. and C.S.; supervision, X.W. (Xuelin Wang) and C.S.; funding acquisition, X.W. (Xuelin Wang) and C.S. All authors have read and agreed to the published version of the manuscript.

Funding

This research was funded by the program “Research of Warm Rolling Process for High Carbon Martensitic Stainless Steel and Powder Steel Used in High end Knife and Scissors, and Promotion and Application of New Materials” (SDZX202204), and this work was supported by the Yangjiang Advanced Alloys Laboratory through its Independent Research Project (Grant No. YJAAKY2025-001).

Data Availability Statement

The original contributions presented in this study are included in the article. Further inquiries can be directed to the corresponding authors.

Conflicts of Interest

The authors declare no conflicts of interest.

References

  1. Wang, X.L.; Huang, A.R.; Shang, C.J.; Xie, Z.J. Characterization of the cladding layer by laser cladding of 9Cr18Mo powder on 3Cr14 martensitic stainless steel and the impact of martensite obtained through post heat treatment on hardness. Mater. Today Commun. 2022, 32, 104057. [Google Scholar] [CrossRef]
  2. Mul, D.O.; Bushueva, E.G.; Lazurenko, D.V.; Lozhkina, E.A.; Domarov, E.V. Structure and tribological properties of “carbon steel-VC containing coating” compositions formed by non-vacuum electron-beam surfacing of vanadium-containing powder mixtures. Surf. Coat. Technol. 2023, 474, 130107. [Google Scholar] [CrossRef]
  3. Chen, T.; Hao, L.; Liu, T.; Zhong, Y.; Wang, Z.; Liu, C.; Cheng, X.; Li, X. Insights into the role of the Cr and rare element in improving the corrosion resistance of HRB400 rebars in simulated SO2-polluted marine environment. J. Build. Eng. 2024, 97, 110807. [Google Scholar] [CrossRef]
  4. Liu, L.; Lu, K.; Jing, Z.; Zhang, Z.; Xue, L.; Yuan, J.; Li, X.; Zhang, B.; Liang, X.; Cheng, J. Simultaneously improving strength and corrosion resistance of CoCrNi-based multi-principal element alloys via alloying with Mo content. J. Alloys Compd. 2025, 1010, 177119. [Google Scholar] [CrossRef]
  5. Hao, Y.; Xu, R.; Bi, H.; Zhang, Z.; Chen, Z.; Li, M.; Chen, B. The corrosion properties of ferritic stainless steel with varying Cr and Mo contents in the early stages of a simulated proton exchange membrane fuel cell environment investigated using experimental and joint calculation method HKD. Corros. Sci. 2024, 239, 112389. [Google Scholar] [CrossRef]
  6. Liu, Z.B.; Ling, J.-X.; Yang, Z.Y. Effect and application of Mo in martensitic precipitation hardening stainless steel. Contin. Cast. 2015, 34, 44–48. [Google Scholar]
  7. Krauss, G. Martensite in steel: Strength and structure. Mater. Sci. Eng. A 1999, 273–275, 40–57. [Google Scholar]
  8. Halfa, H.; Mattar, T.; Eissa, M. Precipitation behavior of modified as cast high nitrogen super hard high-speed tool steel. Steel Res. 2012, 83, 1071–1078. [Google Scholar] [CrossRef]
  9. Yue, X.; Chen, D.; Krishnan, A.; Lazar, I.; Niu, Y.; Golias, E.; Wiemann, C.; Gloskovskii, A.; Schlueter, C.; Jeromin, A.; et al. Unveiling nano-scale chemical inhomogeneity in surface oxide films formed on V- and N-containing martensite stainless steel by synchrotron X-ray photoelectron emission spectroscopy/microscopy and microscopic X-ray absorption spectroscopy. J. Mater. Sci. Technol. 2025, 205, 191–203. [Google Scholar] [CrossRef]
  10. Wieczerzak, K.; Bala, P.; Dziurka, R.; Tokarski, T.; Cios, G.; Koziel, T.; Gondek, L. The effect of temperature on the evolution of eutectic carbides and M7C3→M23C6 carbides reaction in the rapidly solidified Fe-Cr-C alloy. J. Alloys Compd. 2017, 698, 673–684. [Google Scholar] [CrossRef]
  11. Kong, F.; Zhao, W.; Li, H.; He, N. Effect of grain size and cobalt content on machining performance during milling tungsten carbide with PCD tool. Int. J. Refract. Met. Hard Mater. 2024, 123, 106780. [Google Scholar] [CrossRef]
  12. Kondrat’ev, S.Y.; Kraposhin, V.S.; Anastasiadi, G.P.; Talis, A.L. Experimental observation and crystallographic description of M7C3 carbide transformation in Fe-Cr-Ni-C HP type alloy. Acta Mater. 2015, 100, 275–281. [Google Scholar] [CrossRef]
  13. Wang, K.; Li, D. Formation of core (M7C3)-shell (M23C6) structured carbides in white cast irons: A thermo-kinetic analysis. Comput. Mater. Sci. 2018, 154, 111–121. [Google Scholar]
  14. Wiengmoon, A.; Chairuangsri, T.; Brown, A.; Brydson, R.; Edmonds, D.V.; Pearce, J.T.H. Microstructural and crystallographical study of carbides in 30wt.%Cr cast irons. Acta Mater. 2005, 53, 4143–4154. [Google Scholar]
  15. Wang, M.; Flahaut, D.; Zhang, Z.; Jones, I.P.; Chiu, Y.L. Primary carbide transformation in a high performance micro-alloy at 1000 °C. J. Alloys Compd. 2019, 781, 751–760. [Google Scholar]
  16. Yu, W.T. Study on Control Technology of Carbides in High-Carbon Martensitic Stainless Steel 8Cr13MoV Used as Knives and Shears. Ph.D. Thesis, University of Science and Technology Beijing, Beijing, China, 2017. [Google Scholar]
  17. Zuo, J.Z.; He, X.; Zhao, Y.; Zhou, Y.; Chen, T.J. Influence of hot deformation process on network carbide of 100Cr6 bearing steel wire. Spec. Steel 2022, 43, 60–65. [Google Scholar] [CrossRef]
  18. Qian, S.; Teng, H.; Zhao, H.; Hu, P.; Man, T.; Dong, H. Microstructural evolution of secondary carbides during spheroidized annealing and quenching and tempering in 60Cr16MoMA martensitic stainless steel. J. Mater. Res. Technol. 2024, 28, 3207–3216. [Google Scholar] [CrossRef]
  19. Lu, S.Y.; Yao, K.F.; Chen, Y.B.; Wang, M.H.; Ge, X.Y. Influence of heat treatment on the microstructure and corrosion resistance of 13 Wt Pct Cr-type martensitic stainless steel. Metall. Mater. Trans. A 2015, 46, 6090–6102. [Google Scholar] [CrossRef]
  20. Muchiri, P.W.; Mwalukuku, V.M.; Korir, K.K.; Amolo, G.O.; Makau, N.W. Hardness characterization parameters of niobium carbide and niobium nitride: A first principles study. Mater. Chem. Phys. 2019, 229, 489–494. [Google Scholar] [CrossRef]
  21. Li, J.; Zhang, C.; Jiang, B.; Zhou, L.; Liu, Y. Effect of large-size M23C6-type carbides on the low-temperature toughness of martensitic heat-resistant steels. J. Alloys Compd. 2016, 685, 248–257. [Google Scholar] [CrossRef]
  22. Bonagania, S.K.; Bathulab, V.; Kain, V. Influence of tempering treatment on microstructure and pitting corrosion of 13 wt.% Cr martensitic stainless steel. Corros. Sci. 2018, 131, 340–354. [Google Scholar] [CrossRef]
  23. Lu, Y.; Yu, H.; Sisson, R.D., Jr. The effect of carbon content on the c/a ratio of as-quenched martensite in Fe-C alloys. Mater. Sci. Eng. A 2017, 700, 592–597. [Google Scholar] [CrossRef]
  24. Zhang, J.; Xia, D.X.; Xu, R.C.; Sun, Z.H.; Wu, S.S.; Zhang, X.T.; Chen, T. The Genetic Influence of Carbon Segregation in GCr15 Cast Billets on Microstructure and Friction-Wear Properties. Steel 2025, 1–14. [Google Scholar] [CrossRef]
  25. Luo, Q.; Chen, H.; Chen, W.; Wang, C.; Xu, W.; Li, Q. Thermodynamic prediction of martensitic transformation temperature in Fe-Ni-C system. Scr. Mater. 2020, 187, 413–417. [Google Scholar] [CrossRef]
  26. Navarrete-Cuadrado, J.; Soria-Biurrun, T.; Lozada-Cabezas, L.; Isasti, N.; Ibarreta-López, F.; Martínez-Pampliega, R.; Sánchez-Moreno, J.M. Effect of carbon content and cooling rate on the microstructure and hardness of TiC-Fe-Cr-Mo cermets. Int. J. Refract. Met. Hard Mater. 2024, 119, 106552. [Google Scholar] [CrossRef]
  27. Idayan, A.; Gnanavelbabu, A.; Rajkumar, K. Influence of deep cryogenic treatment on the mechanical properties of AISI 440C bearing steel. Procedia Eng. 2014, 97, 1683–1691. [Google Scholar]
  28. Xu, Z.; Xia, Z.; Xiong, Y.; Lu, J.; Guo, Z. Multiple morphologies and twin structure generated by a definite growth behavior of grain boundary M23C6 in tempered Fe–15Mn–3Al-0.7C steel. J. Mater. Res. Technol. 2024, 28, 774–781. [Google Scholar]
  29. Zhang, J.; Yu, L.; Liu, C.; Ding, R.; Liu, Y. Synergistic Strengthening Mechanisms and Deformation Heat Treatment Applications of High Chromium Martensitic Heat-Resistant Steel. Acta Metall. Sin. 2024, 60, 713–730. [Google Scholar]
  30. Wang, X.; Xu, L.; Jiao, L.; Li, W.; Mei, J.; Zhao, Y.; Qiao, L. Inhibition of the intergranular brittleness of HR3C heat-resistant steel by strain-aging induced nano-M23C6 dispersion precipitation. J. Mater. Sci. Technol. 2025, 213, 288–299. [Google Scholar]
  31. Wang, X.; Li, C.; Zhang, Z.; Zhao, X.; Tong, D.; Yan, G.; Han, L.; Gu, J. Tailoring the microstructure and mechanical properties of H13 steel by controlling the pre-precipitation of VC carbides from austenite. J. Mater. Res. Technol. 2024, 33, 9614–9621. [Google Scholar]
  32. Wang, Q.; Kong, D.; Li, X.; Zhou, S.; Zhang, Z. Additive manufacturing Cr-Mo-Si-V steel: Systematic parameter assessments, precipitation behavior of in-situ VC-M23C6 and strengthening mechanisms. Mater. Sci. Eng. A 2025, 919, 147504. [Google Scholar] [CrossRef]
  33. Jiao, Y.; Dan, W.J.; Zhang, W.G. The strain-induced martensitic phase transformation of Fe–C alloys considering C addition: A molecular dynamics study. J. Mater. Res. 2020, 35, 1803–1816. [Google Scholar] [CrossRef]
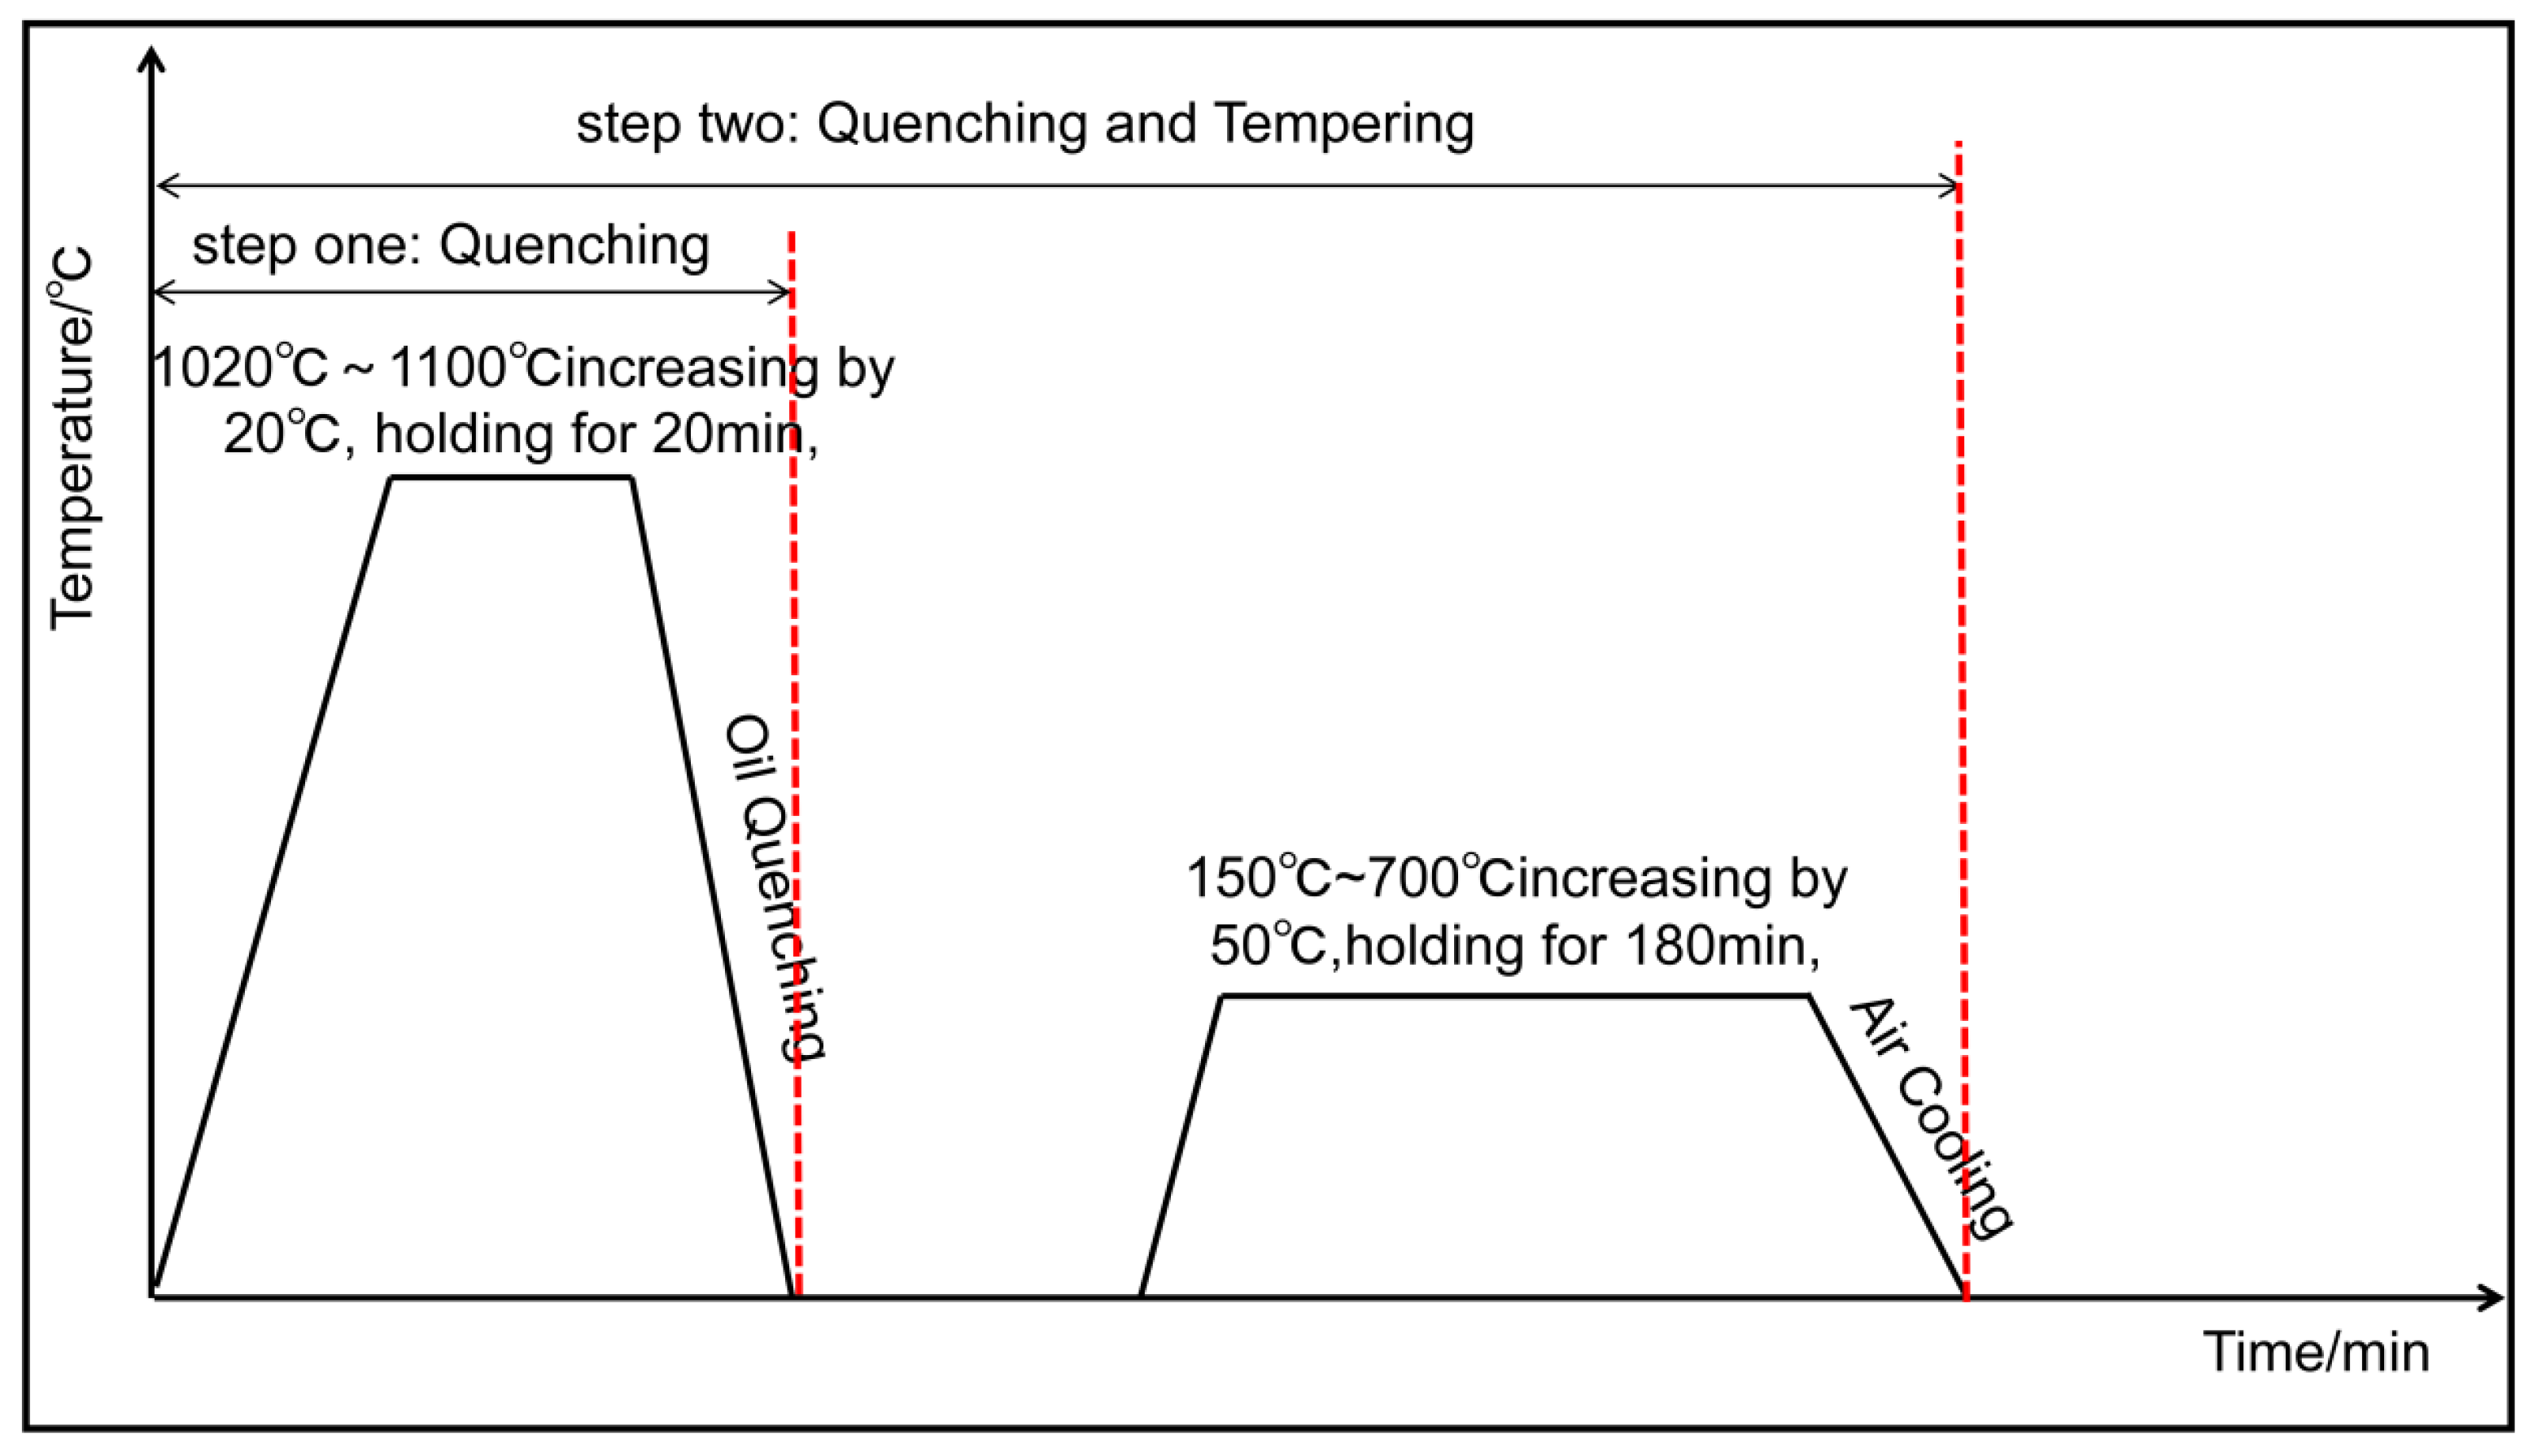
Figure 1. The optimized heat treatment process of 90Cr18MoV.
Metals 15 00999 g001
Figure 2. (a) The morphology of the microstructure the 90Cr18MoV samples as received.; (bd) The corresponding TEM image and diffraction patterns of carbides.
Metals 15 00999 g002
Figure 3. SEM images of 90Cr18MoV after quenching. Panels (af) represent the microstructural morphology at quenching temperatures of Untreated, Q-1020, Q-1040, Q-1060, Q-1080, and Q-1100, respectively.
Metals 15 00999 g003
Figure 4. EBSD analysis of 90Cr18MoV samples quenched at different temperatures and their corresponding hardness: (a) EBSD image of the Q-1060; (b) EBSD image of the Q-1080; (c) EBSD image of the Q-1100; (d) Macrohardness of samples quenched at various temperatures; (e) Nanoindentation hardness of samples subjected to quenching at different temperatures; (f) SEM scanning images showing hardness points from nanoindentation on the matrix for samples quenched at varying temperatures; (g) Nano Hardness Position Scanning Image.
Metals 15 00999 g004aMetals 15 00999 g004b
Figure 5. Analysis of the microstructure and hardness characterization of experimental steel; (a) Scanning images of samples at different tempering temperatures, (b,c) Trends in hardness variation of samples at different tempering temperatures, (d) Scanning images of selected regions for nanoindentation.
Metals 15 00999 g005
Figure 6. (a) The volume fractions of various phases in 90Cr18MoV steel; (b) Simulation calculation of M23C6 phase content; (c) Precipitation model of M23C6 in 90Cr18MoV at complete equilibrium state of 500 °C; (d) Precipitation model of M23C6 in 90Cr18MoV at complete equilibrium state of 600 °C.
Metals 15 00999 g006aMetals 15 00999 g006b
Figure 7. Transmission electron microscopy analysis of samples QT-150, QT-250, and QT-350: (a) Dark field image of the QT-150 sample; (b) Dark field image of the QT-250 sample; (c) Dark field image of the QT-350 sample.
Metals 15 00999 g007
Figure 8. (a) Transmission image of the QT-450/180 sample; (b) Transmission image of the QT-500/180 sample; (c) Transmission image of the QT-600/180 sample.
Metals 15 00999 g008
Figure 9. EBSD and XRD analyses of the tempered samples: (a,b) present the EBSD images of the QT-500/180 sample; (c) illustrates the XRD analysis for QT-150/180, QT-300/180, and QT-550/180 samples.
Metals 15 00999 g009
Figure 10. (a,b) illustrate transmission samples prepared using a focused ion beam (FIB); (c) presents the transmission image of the QT-450/180 sample; (d) shows the transmission image of the QT-500/180 sample; (e) displays the diffraction pattern corresponding to the QT-500/180 sample at a specific location; (f) depicts the transmission image of the QT-600/180 sample; (g) provides the diffraction pattern for a specific location in the QT-600/180 sample; (h) offers an energy-dispersive spectroscopy (EDS) line scan for the QT-600/180 sample; (i) presents an EDS line scan for the QT-650/180 sample; (j) illustrates the transmission image of the QT-700/180 sample; and finally, (k) shows the diffraction pattern corresponding to a specific location in the QT-700/180 sample.
Metals 15 00999 g010
Figure 11. (a) Statistical analysis of precipitate sizes for the QT-500/60 sample; (b) Statistical analysis of precipitate sizes for the QT-500/180 sample; (c) Correlation between tempering hardness and tempering time for the Q-1080 sample at a temperature of 500 °C.
Metals 15 00999 g011
Figure 12. (a) Size distribution statistics of precipitates in the QT-600/30 sample; (b) Size distribution statistics of precipitates in the QT-600/60 sample; (c) Size distribution statistics of precipitates in the QT-600/120 sample; (d) Size distribution statistics of precipitates in the QT-600/180 sample; (e) Statistical analysis of the average size of precipitates and its relationship with tempering time, as well as the correlation between sample hardness and tempering time for the QT-600 samples; (f) Size distribution statistics of precipitates for samples QT-500/180, QT-600/180, and QT-700/180.
Metals 15 00999 g012
Figure 13. The precipitation process of M23C6 in the matrix during tempering.
Metals 15 00999 g013
Table 1. Chemical composition of the 90Cr18MoV steel (=wt. %).
CSiMnPSCrNiMoV
0.9030.5120.4200.0260.00417.190.3291.0690.161
Disclaimer/Publisher’s Note: The statements, opinions and data contained in all publications are solely those of the individual author(s) and contributor(s) and not of MDPI and/or the editor(s). MDPI and/or the editor(s) disclaim responsibility for any injury to people or property resulting from any ideas, methods, instructions or products referred to in the content.