1. Introduction
Permanent magnets have become indispensable in modern technologies due to their ability to generate and maintain magnetic fields without the need for external power sources. Their uses span many applications, including energy generation, transportation, healthcare, and data storage. In renewable energy systems, permanent magnets have a key role in wind turbines and electric motors [
1].
Since their discovery in 1984 [
2,
3], neodymium magnets have become the dominant type due to their high maximum energy product, leading to rapid technological developments and new applications in several industrial areas. Among the several methods developed to produce Nd-Fe-B magnets, sintered magnets exhibit the highest magnetic properties, with a maximum energy product of BH
(max) = 473 kJ/m
3 [
4]. However, the cost and accessibility of rare earth elements used in high-performing permanent magnets, are negatively impacted by environmentally intensive mining processes and a volatile supply chain [
5,
6].
Low-cost, rare earth-free permanent magnets such as ferrites like (Sr,Ba)Fe
12O
19− have been known since the 1950s. However, their performance is much lower than rare earth-containing permanent magnets (BH
(max) < 40 kJ/m
3), and their use is therefore restricted to applications that do not require high energy densities [
7]. There is a continuous research effort aimed at increasing the performance of ferrites [
8,
9]. At the same time, other rare earth-free materials with potentially higher energy products have been considered to fill the performance gap between the ferrites and rare earth-based permanent magnets, as discussed by Coey [
10].
Several candidates are considered possible “gap magnets,” such as MnAl, MnBi, YCo
5, YCo, and FeNi, as long as the value of the hardness parameter (κ) is greater than 1, where
. Here,
K is the material anisotropy constant,
is the permeability of free space, and M
S is the saturation magnetization. In addition to their magnetic properties, developing a rare earth-free permanent magnet has the potential to reduce production environmental impact and costs, and consequently decentralize the permanent magnet market [
11].
Among such candidates, one of the most promising is the ordered equiatomic phase of iron and nickel called tetrataenite, which was discovered in the 1960s by Néel using neutron bombardment in FeNi alloys [
12]. Tetrataenite, or L1
0 Structurbericht designation, is an iron–nickel body-centered tetragonal ordered phase (space group
P4/
mmm) with an AuCu-type structure and a layered Fe and Ni arrangement in the
c-axis direction [
13]. The ordered phase was also found in stony-iron and iron meteorites, first reported by Albertsen et al. [
14] and later named Tetrataenite by Clarke et al. [
15].
The interest in using tetrataenite as a permanent magnet is due to its intrinsic magnetic properties, such as high magnetocrystalline anisotropy (K
1 = 1.3 × 10
6 J/m) and large saturation magnetization (M
S = 1300 kA/m), giving a theoretical maximum energy product of 335 kJ/m and Curie temperature of 823 K [
12,
16,
17]. However, the structural order-disorder temperature (T
OD), estimated at 593 K, is a limiting factor for both applications and the successful synthesis of tetrataenite. At this temperature, atomic mobility is estimated to be one atomic jump per 10,000 years, and thus the main challenge in obtaining a single-phase material. Bordeaux et al. [
18] calculated the enthalpy of formation of tetrataenite
kJ/mol of atoms, showing the stability of the phase below the order-disorder temperature, using the equation:
where
is the enthalpy of formation of the disordered fcc A1 phase, and
is the enthalpy change associated with the L1
0 → A1 temperature-independent phase transformation.
Enhancing atomic mobility to promote the transformation from A1 to L1
0 is the primary goal when studying the bulk synthesis of tetrataenite. Non-equilibrium processes that promote the increase in the density of defects, such as vacancies and dislocations, have been applied for iron–nickel alloys using different deformation methods. For example, Lee et al. reported the feasibility of the formation of tetrataenite by using a High-Pressure-Torsion method [
19]. Pena Rodriguez et al. achieved an ordering parameter of 0.12 by producing alloys using high-energy ball milling [
20]. Makino et al. observed the L1
0 phase when alloys containing Si, B, P, and Cu were melt-spun and subsequently annealed [
21].
Tuning the chemical composition with the addition of another alloying element (B, N, Pd, Al, Ti, Cr, and Co) also influences the formation of tetrataenite and its magnetic properties, as indicated in several first-principle studies [
22,
23,
24,
25]. The addition of substitutional elements in near equiatomic iron–nickel alloys could increase the order-disorder temperature and enthalpy of formation, accelerating the transformation from the cubic disordered phase to the ordered tetrataenite [
26].
Cold-rolled FeNi alloys have been studied for decades due to their soft magnetic properties, low coercivity, high permeability, saturation magnetization, and very low thermal expansion (invar alloys) [
27]. Walker et al. investigated the texture and magnetic properties of equiatomic iron and nickel-sintered alloys since the 1950s [
28]. More recently, Maât et al. reported enhanced tetragonality in Fe
49Ni
49Mo
2 alloys prepared by cold rolling, followed by the application of a novel magnetic field-assisted method for annealing [
29]. Melt-spun ribbons and cold-rolled FeNi samples containing Ti promoted the formation of the recently discovered disordered A6-type phase with a tetragonal structure [
30].
Structural identification of the L10 phase is very challenging. In bulk materials, either lab-processed or naturally occurring in meteorites, L10 coexists with the A1 phase, and distinguishing them is problematic due to the structural similarities between the two phases. Additionally, small quantities of Fe, Ni, and Fe-Ni oxides overlap with the superlattice peak characteristics of the ordered phase.
The ordering can be quantified by the Long-Range Order parameter (
S) following the equation [
31]:
where
and
are the integrated intensities of a superlattice and fundamental peaks, respectively. However, for L1
0, the intensity ratio between the superlattice and fundamental peaks is 0.3% and 0.28% for X-ray and neutron diffraction, respectively. Hence, it is challenging and uncertain to quantify the L1
0 phase with diffraction methods.
In the present work, we have studied FeNi alloys containing 5 at.% of aluminum or molybdenum produced by rapid cooling, either by melt spinning or die casting. In addition, the samples were cold-rolled and cryomilled to promote severe plastic deformation to the material, followed by subsequent annealing below the order-disorder temperature. Structural and magnetic characterization were performed to identify the presence of ordered and secondary phases. The combination of composition tuning and high mechanical activation could potentially accelerate the formation of the L10 phase during annealing.
2. Materials and Methods
FeNi alloys (Fe50Ni50, Fe45Ni45Mo5, and Fe45Ni45Al5) were prepared by melt spinning and die casting using equipment developed in-house at the Institute of Physics of the Slovak Academy of Sciences (IP SAS), Karlova Ves, Slovakia. All starting materials were pure elements (>99.9% purity) supplied by CAMEX Ltd., Ahmedabad, India. Pre-alloys were prepared by arc melting the pure elements. The pre-alloys were then melted in a quartz crucible using induction heating under vacuum, and the molten alloys were cast in a controlled manner onto a fast-rotating copper wheel, producing the metallic ribbon. A similar quartz tube was used to melt the pre-alloyed ingots using an induction heating apparatus for the die-cast alloys. In this case, the molten alloys were cast into a copper die. Each alloy was cast in batches of 20 g.
Die-cast samples were cut into 500 mg pieces and cold-rolled using a Durston vertical cold roller. Cold rolling was performed in a non-lubricated and dry environment at room temperature with a roll diameter of 6.25 mm and with a rotating speed of 10 rpm. Three passes were applied for each deformation cycle. The cold working rate applied was 90%, according to the formula:
where
CW% is the percentage of cold work,
is the initial thickness and
is the final thickness.
Melt-spun alloys were mechanically milled at liquid nitrogen temperatures (cryomilling) using a Freezer Mill 6770 (Spex Sampleprep, Metuchen, NJ, USA) with a stainless-steel vial and rod operating with an oscillation frequency of 12 Hz. The samples were milled for 60 min, with a 3 min interval used to cool the powder after every 6 min of milling time.
Cold-rolled samples were vacuum-sealed in quartz tubes. They were then heat-treated for 800 h at 583 K (10 K below the TOD) in a muffle furnace (Carbolite Gero, Hope Valley, UK). After the heat treatment, the samples were stored in an Ar-filled glove box before characterization.
Powder X-ray Diffraction (PXD) was performed with a D2 Phaser (Bruker, Karlsruhe, Germany) using a Bragg–Brentano configuration and Cu-Kα radiation (λ = 1.5406 Å). Synchrotron radiation powder X-ray diffraction (SR-PXD) was performed at the Swiss-Norwegian beamlines (SNBL) BM01 [
32], at the European Synchrotron Radiation Facility (ESRF) in Grenoble, France, with a wavelength of λ = 0.720638 Å. In this case, samples were packed in quartz capillaries with a diameter of 3 mm, which were rotated by
φ = 30° during measurement. Selected samples were measured during heating at a rate of 5 K/min. using a furnace calibrated by measuring the thermal expansion of silver. One diffraction pattern was acquired per minute, resulting in one pattern every 5 K.
Rietveld refinement was carried out using Topas Academic v.6 [
33]. Crystallite size and strain were obtained from the refinements considering the Lorentzian and Gaussian components of the diffraction peaks, respectively. A LaB
6 reference was used to determine the instrument broadening.
Scanning electron microscopy (SEM) and energy-dispersive X-ray spectroscopy (EDS) were carried out with a SU8230 ultra-high resolution cold-field emission scanning electron microscope (Hitachi, Krefeld, Germany). The melt-spun samples were fixed in conductive double-sided carbon tape without coating, and both sides of the ribbons were analyzed. The die-cast samples were mounted in a conductive resin.
Detailed microstructural and chemical analysis of the prepared material was examined with Scanning Transmission Electron Microscopy (STEM) using a TFS Titan Themis 300 microscope (Thermo Fischer Scientific, Waltham, MA, USA) operated at 200 kV in the scanning probe mode. The detection system consisted of 3 on-axis centered annular detectors (High-Angle Annular Dark-Field (HAADF), Annular Dark-Field (ADF), and Annular Bright-Field (ABF)) with collection angles set to 200−101, 95−24, and 20−13 mrad, respectively. Selected area electron diffraction (SAED) data were acquired to identify possible superlattice diffraction signals of the tetrataenite phase. The energy dispersive X-ray spectroscopy (EDS) spatially resolved elemental maps were acquired using a four-quadrant TFS/Bruker Super-X detector system (Thermo Fischer Scientific, Waltham, MA, USA).
To better understand and visualize the defects of single-crystalline grains, the differential phase contrast (DPC) technique was carried out. Conventional DPC imaging uses a physical segmented STEM detector, in this case the 4-quadrant ADF detector, and measures the difference in intensity falling on the opposing segments to measure the beam shift. DPC relies on the displacement of the center-of-mass (COM) of the illumination intensity at the detector plane, also known as a convergent beam electron diffraction (CBED) pattern, by electric and magnetic fields in the specimen [
34,
35]. This causes an offset of the diffraction pattern relative to the detector’s center. This COM movement, representing a vector field, can be conveniently measured with the DPC STEM technique. However, if we assume that the studied crystalline sample is not significantly thicker than one crystalline grain (~50 nm) or the neighboring grains are not severely overlapping, the magnetic and electric components for the COM displacement are highly suppressed (saturation of the sample by the magnetic field in the objective lens 200 kV/~1.8 T, sample metallic and thus highly conductive). The COM displacement mainly relies on the crystal quality—quantity of intrinsic defects, and the crystal tilt with respect to the electron beam. With this theoretical experiment construction, it is thus possible to visualize the direction and magnitude of the COM displacement field arising from the crystalline orientation and crystal quality. It is worth noting that the displacement field yields only qualitative and indicative results. The acquired data were processed in TFS Velox sw suite. In situ heating experiment was conducted using a single-tilt bulk heating holder, Gatan model 628. Samples (Gatan, Pleasanton, CA, USA) for the STEM observations were produced using a conventional focused ion beam (FIB) preparation technique, resulting in a wedge-shaped lamella with an average thickness of ~20–100 nm. A Helios G4 UX dual-beam FIB (Thermo Fischer Scientific, Waltham, MA, USA) was used for the sample preparation.
Magnetization curves were measured in a vibrating sample magnetometer (VSM) (Lake Shore, Westerville, OH, USA). A full-loop measurement was performed using an 11.2 kOe maximum field with a 14 Oe step at room temperature. Each measurement consisted of approximately 20 mg of powder encapsulated in quartz sample holders.
3. Results
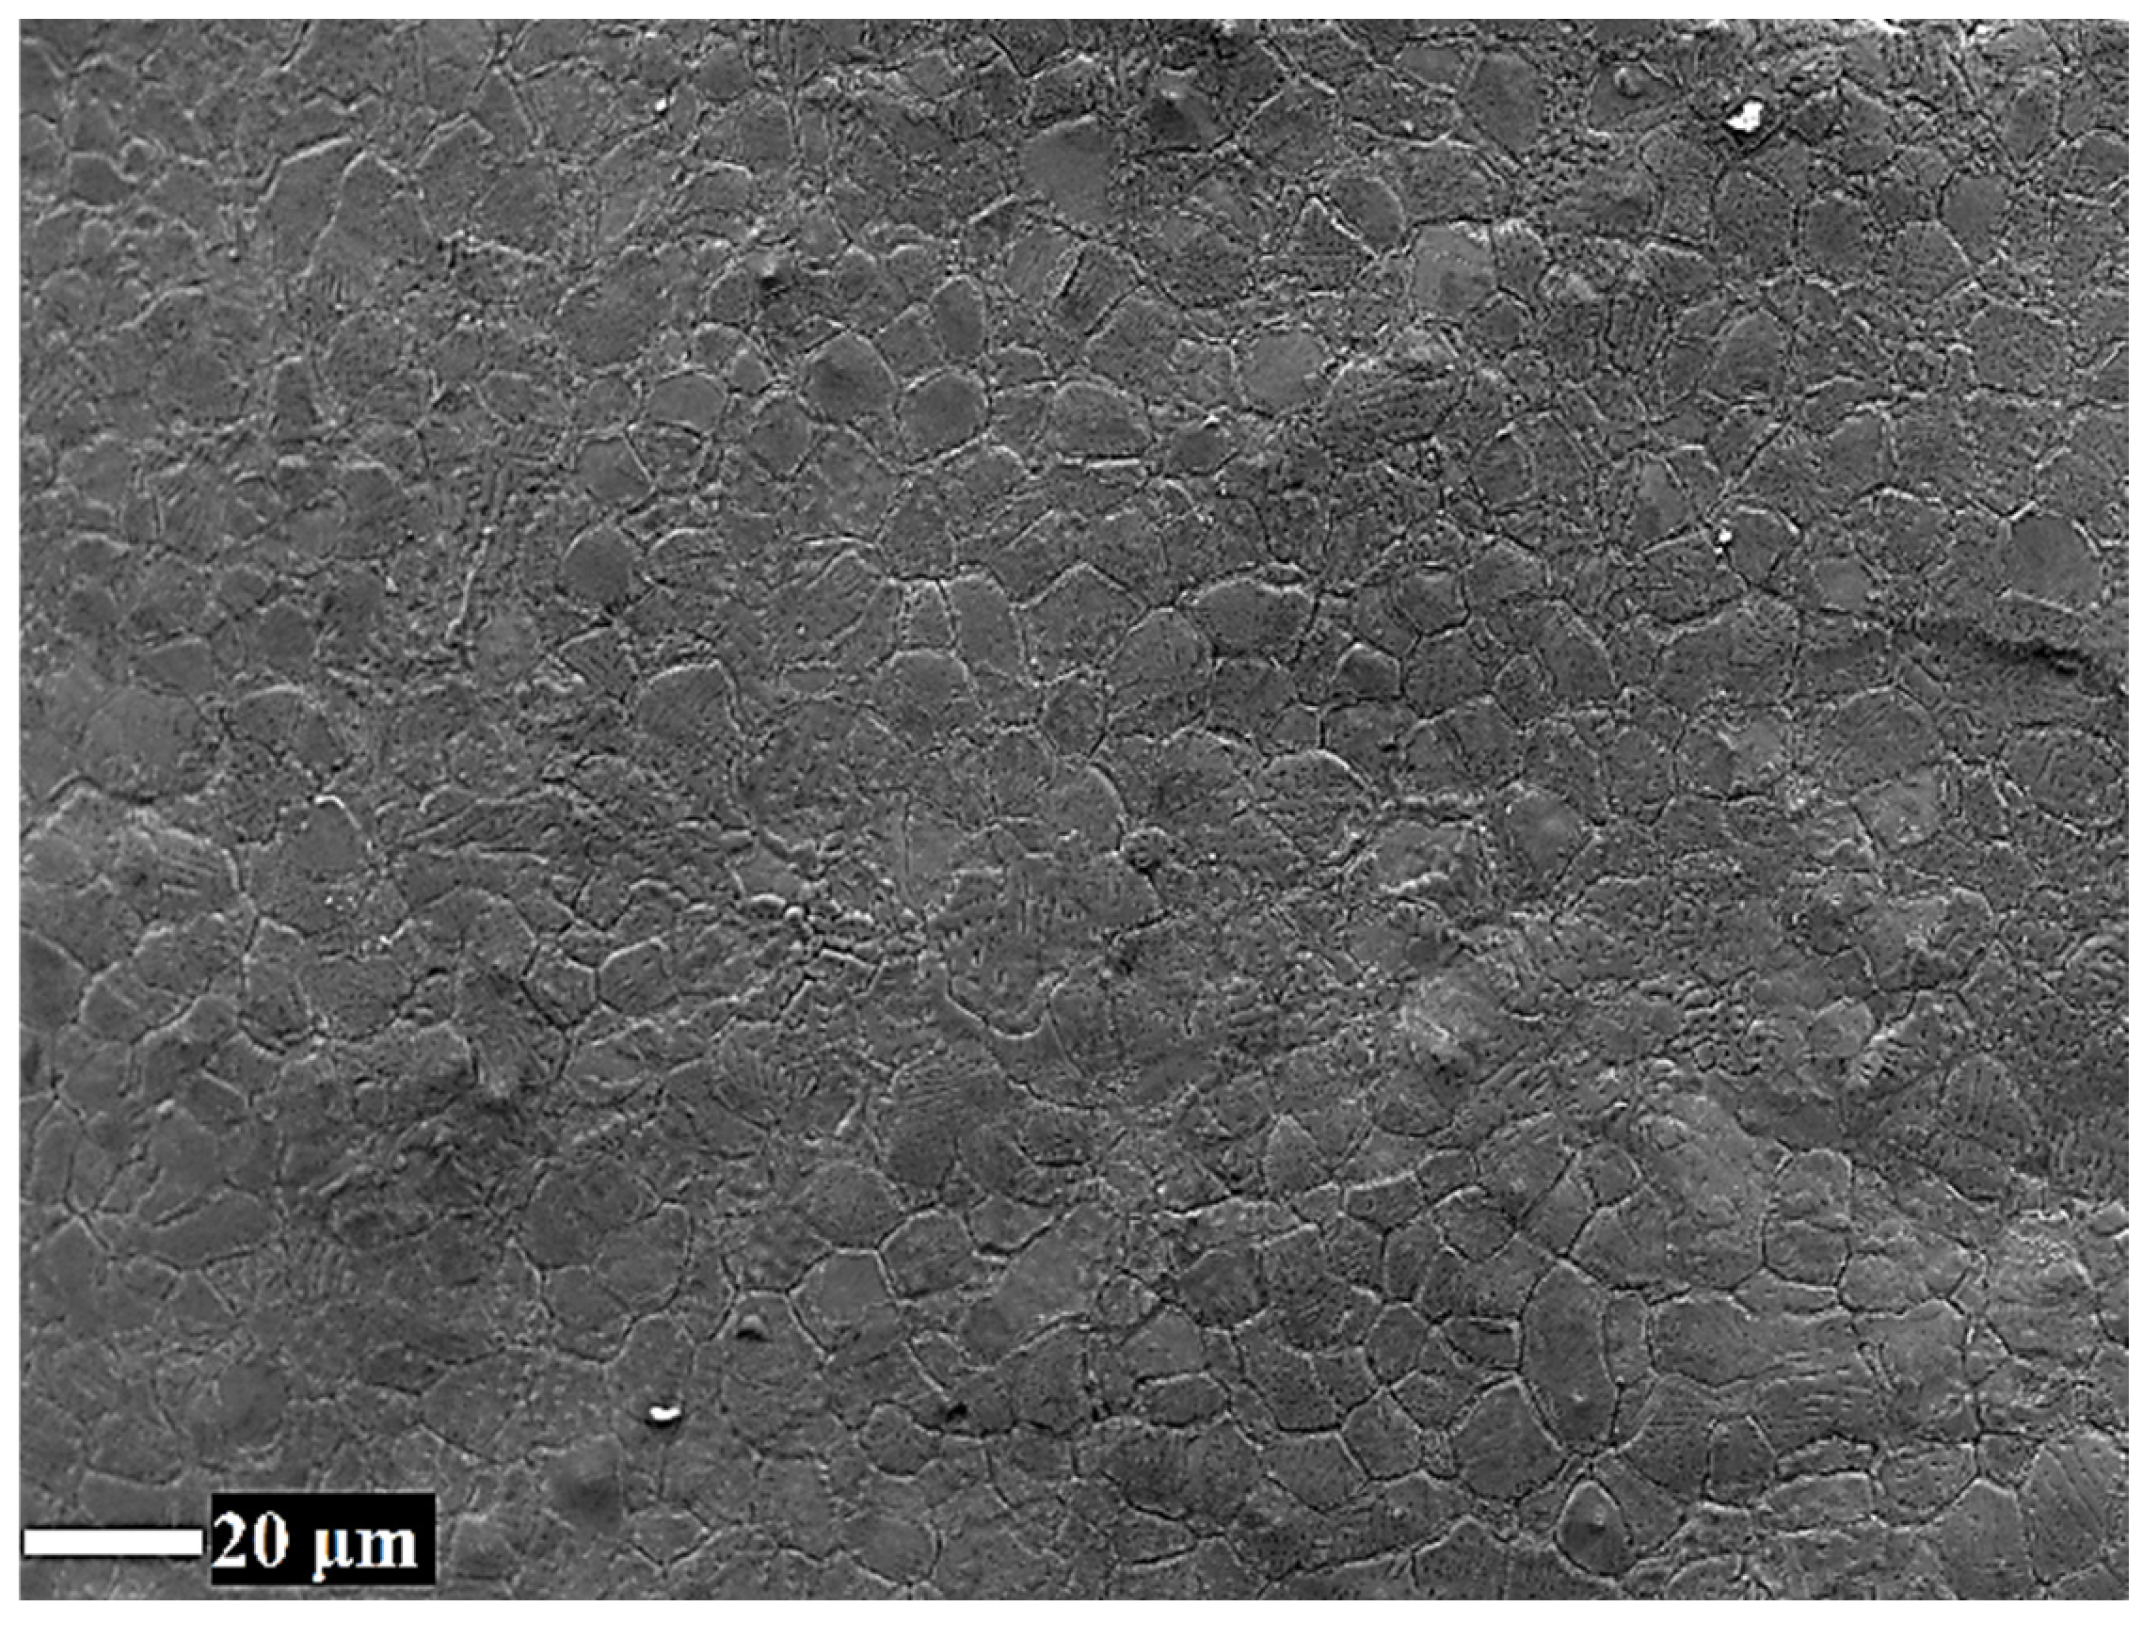
Figure 1 shows backscattered SEM micrographs of the free surface of a FeNi melt-spun ribbon. The apparent grain sizes were below 10 µm; while in some regions, the grain size was, on average, approximately 2 µm. Apart from the surface morphological features, no contrast can be observed in
Figure 1, suggesting the absence of any secondary phase segregation. No signs of a secondary phase segregation were observed.
Figure S1 in the Supporting Information (S.I.) shows the secondary electron images of the cross-section of the FeNi, (FeNi)
95Al
5, and (FeNi)
95Mo
5 die-cast samples. No signs of secondary phases are observed, indicating that no segregation occurred during the die-casting process. Scattered pores were observed throughout the samples, with diameters below 1 µm.
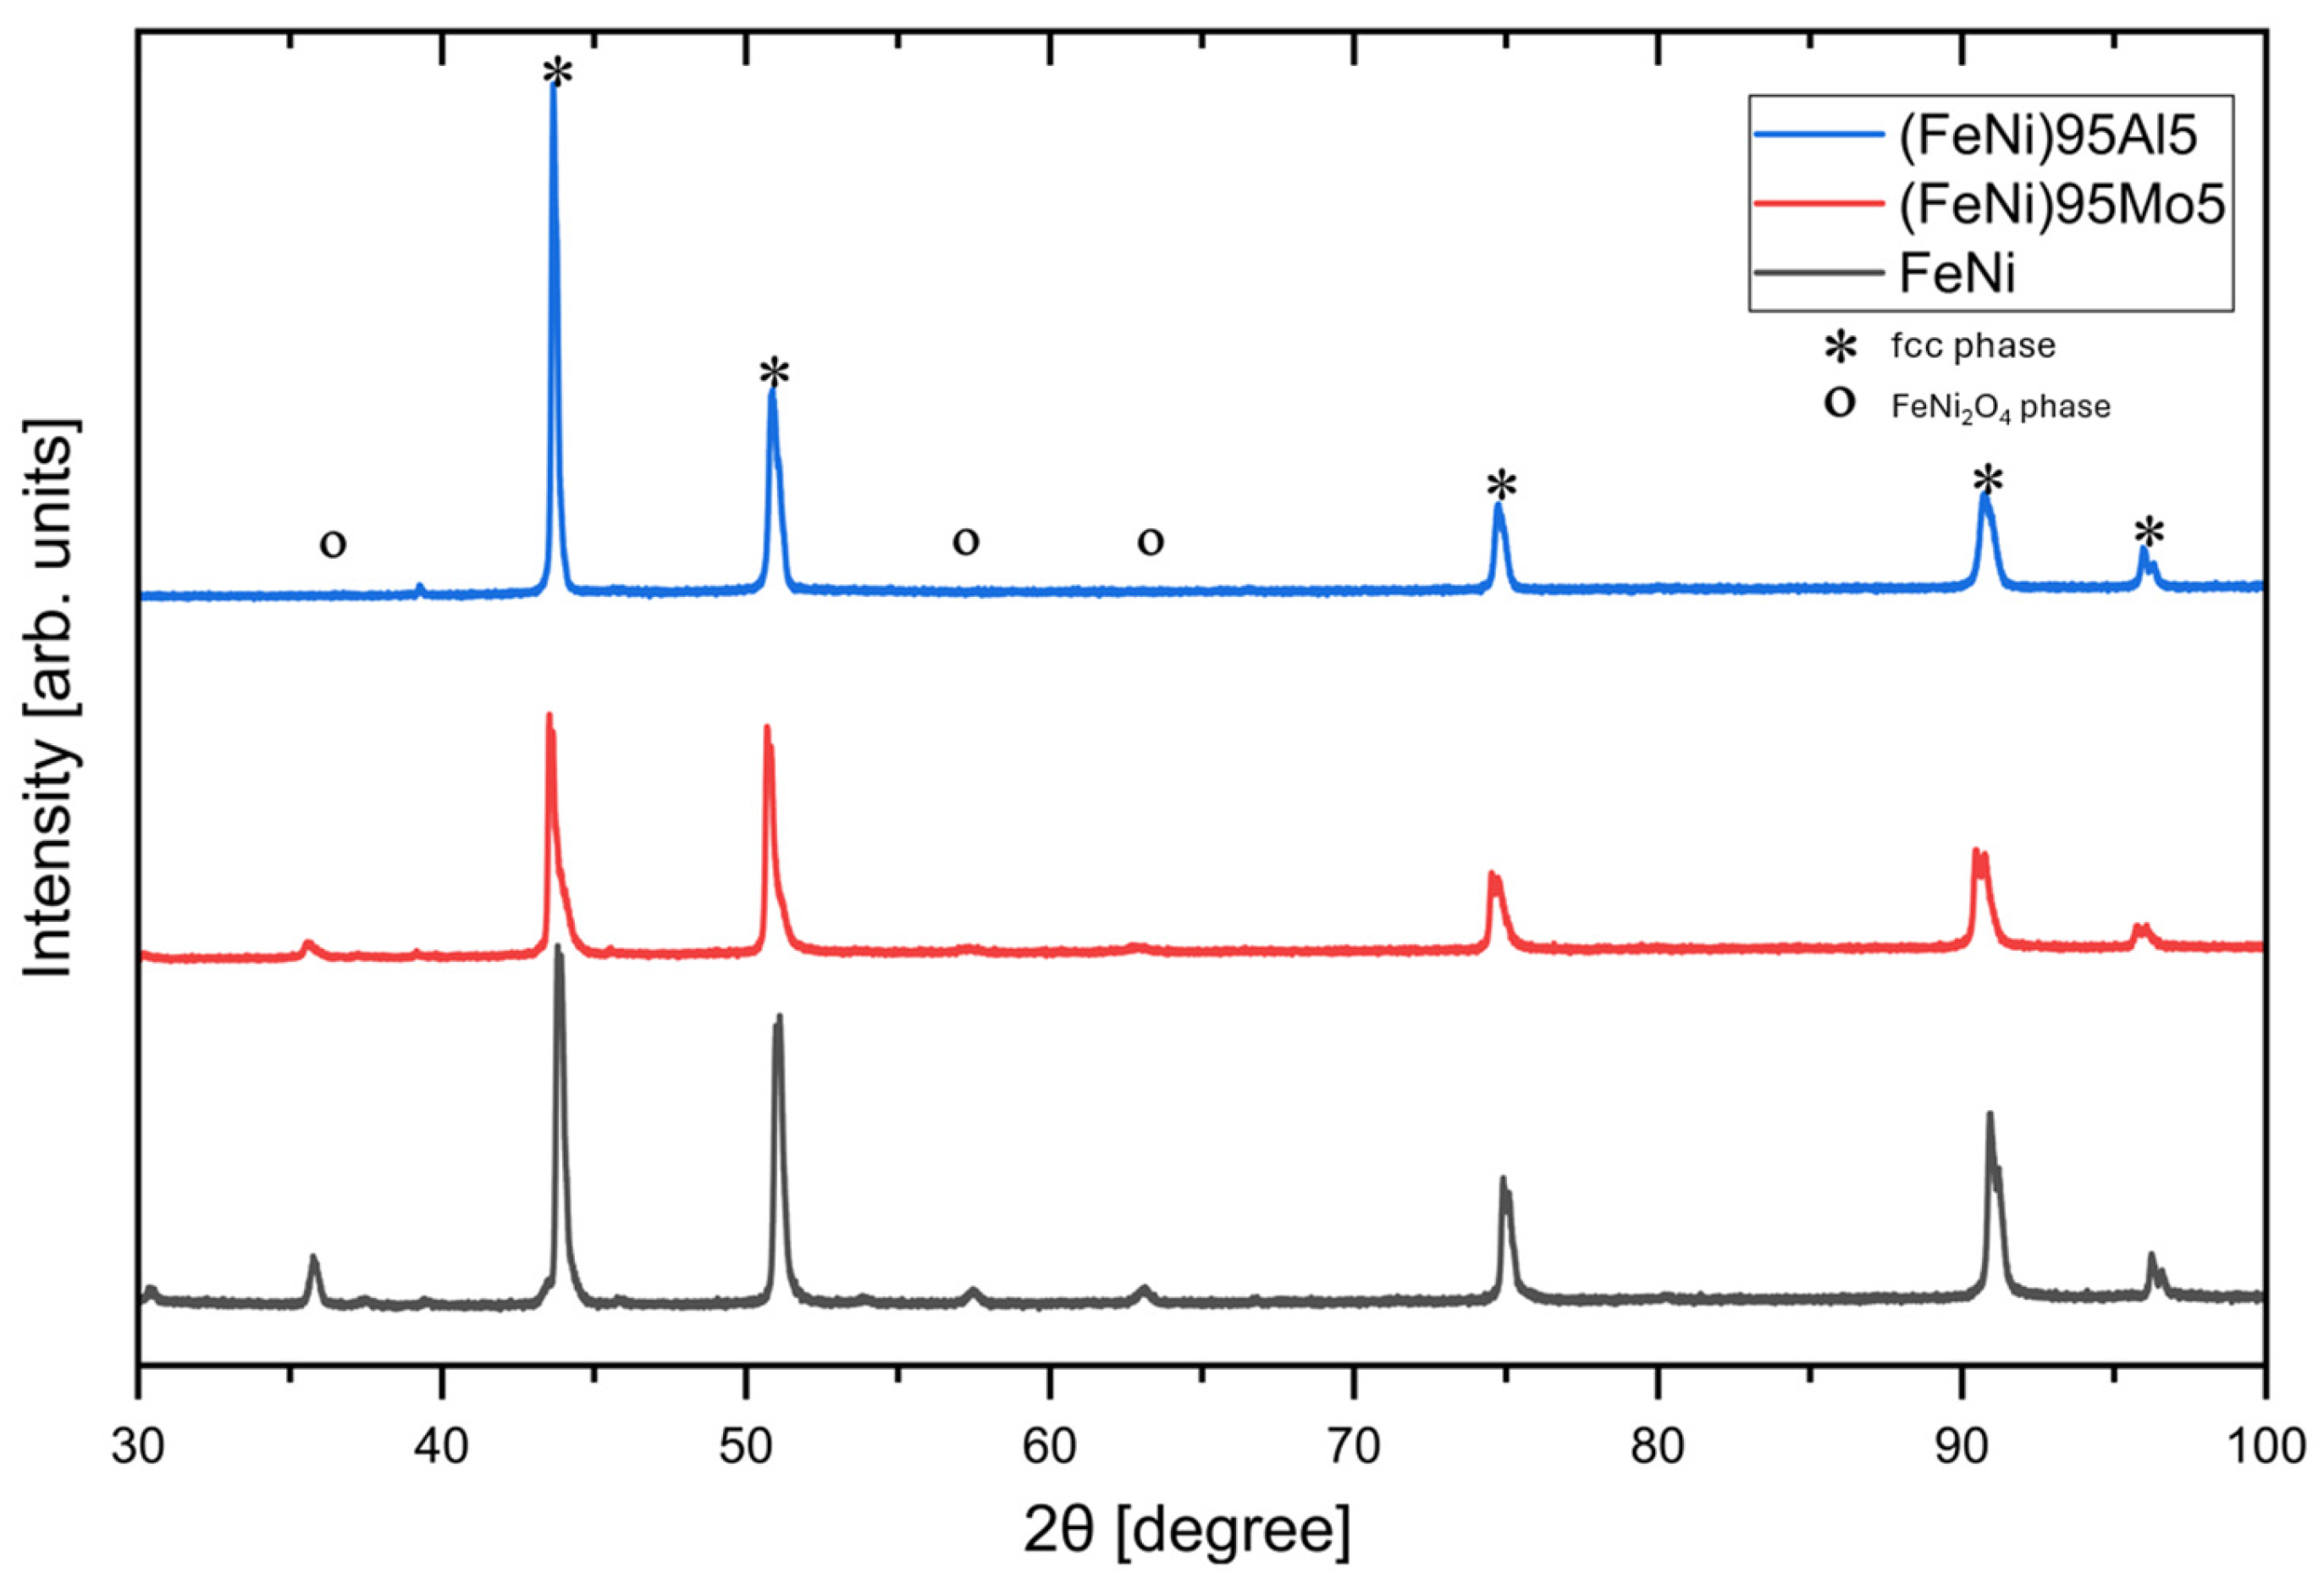
Figure 2 shows the Cu-Kα PXD data of the as-spun ribbons. The primary phase in all cases is an fcc FeNi phase solid solution (see peaks labeled with asterisks), with a preferred orientation along the [h00] direction for the FeNi and (FeNi)
0.95Mo
5 melt-spun alloys. A small quantity of a secondary cubic phase was also observed and identified as cubic FeNi
2O
4 formed during the production cast (peaks labeled with open circles). The data suggest that Al and Mo were dissolved entirely into the cubic FeNi phase. Similar single-phase fcc PXD data were also observed for the as-cast materials.
Rietveld refinements based on SR-PXD data of the samples after mechanical treatment and annealing indicate a disordered single-phase FeNi cubic system.
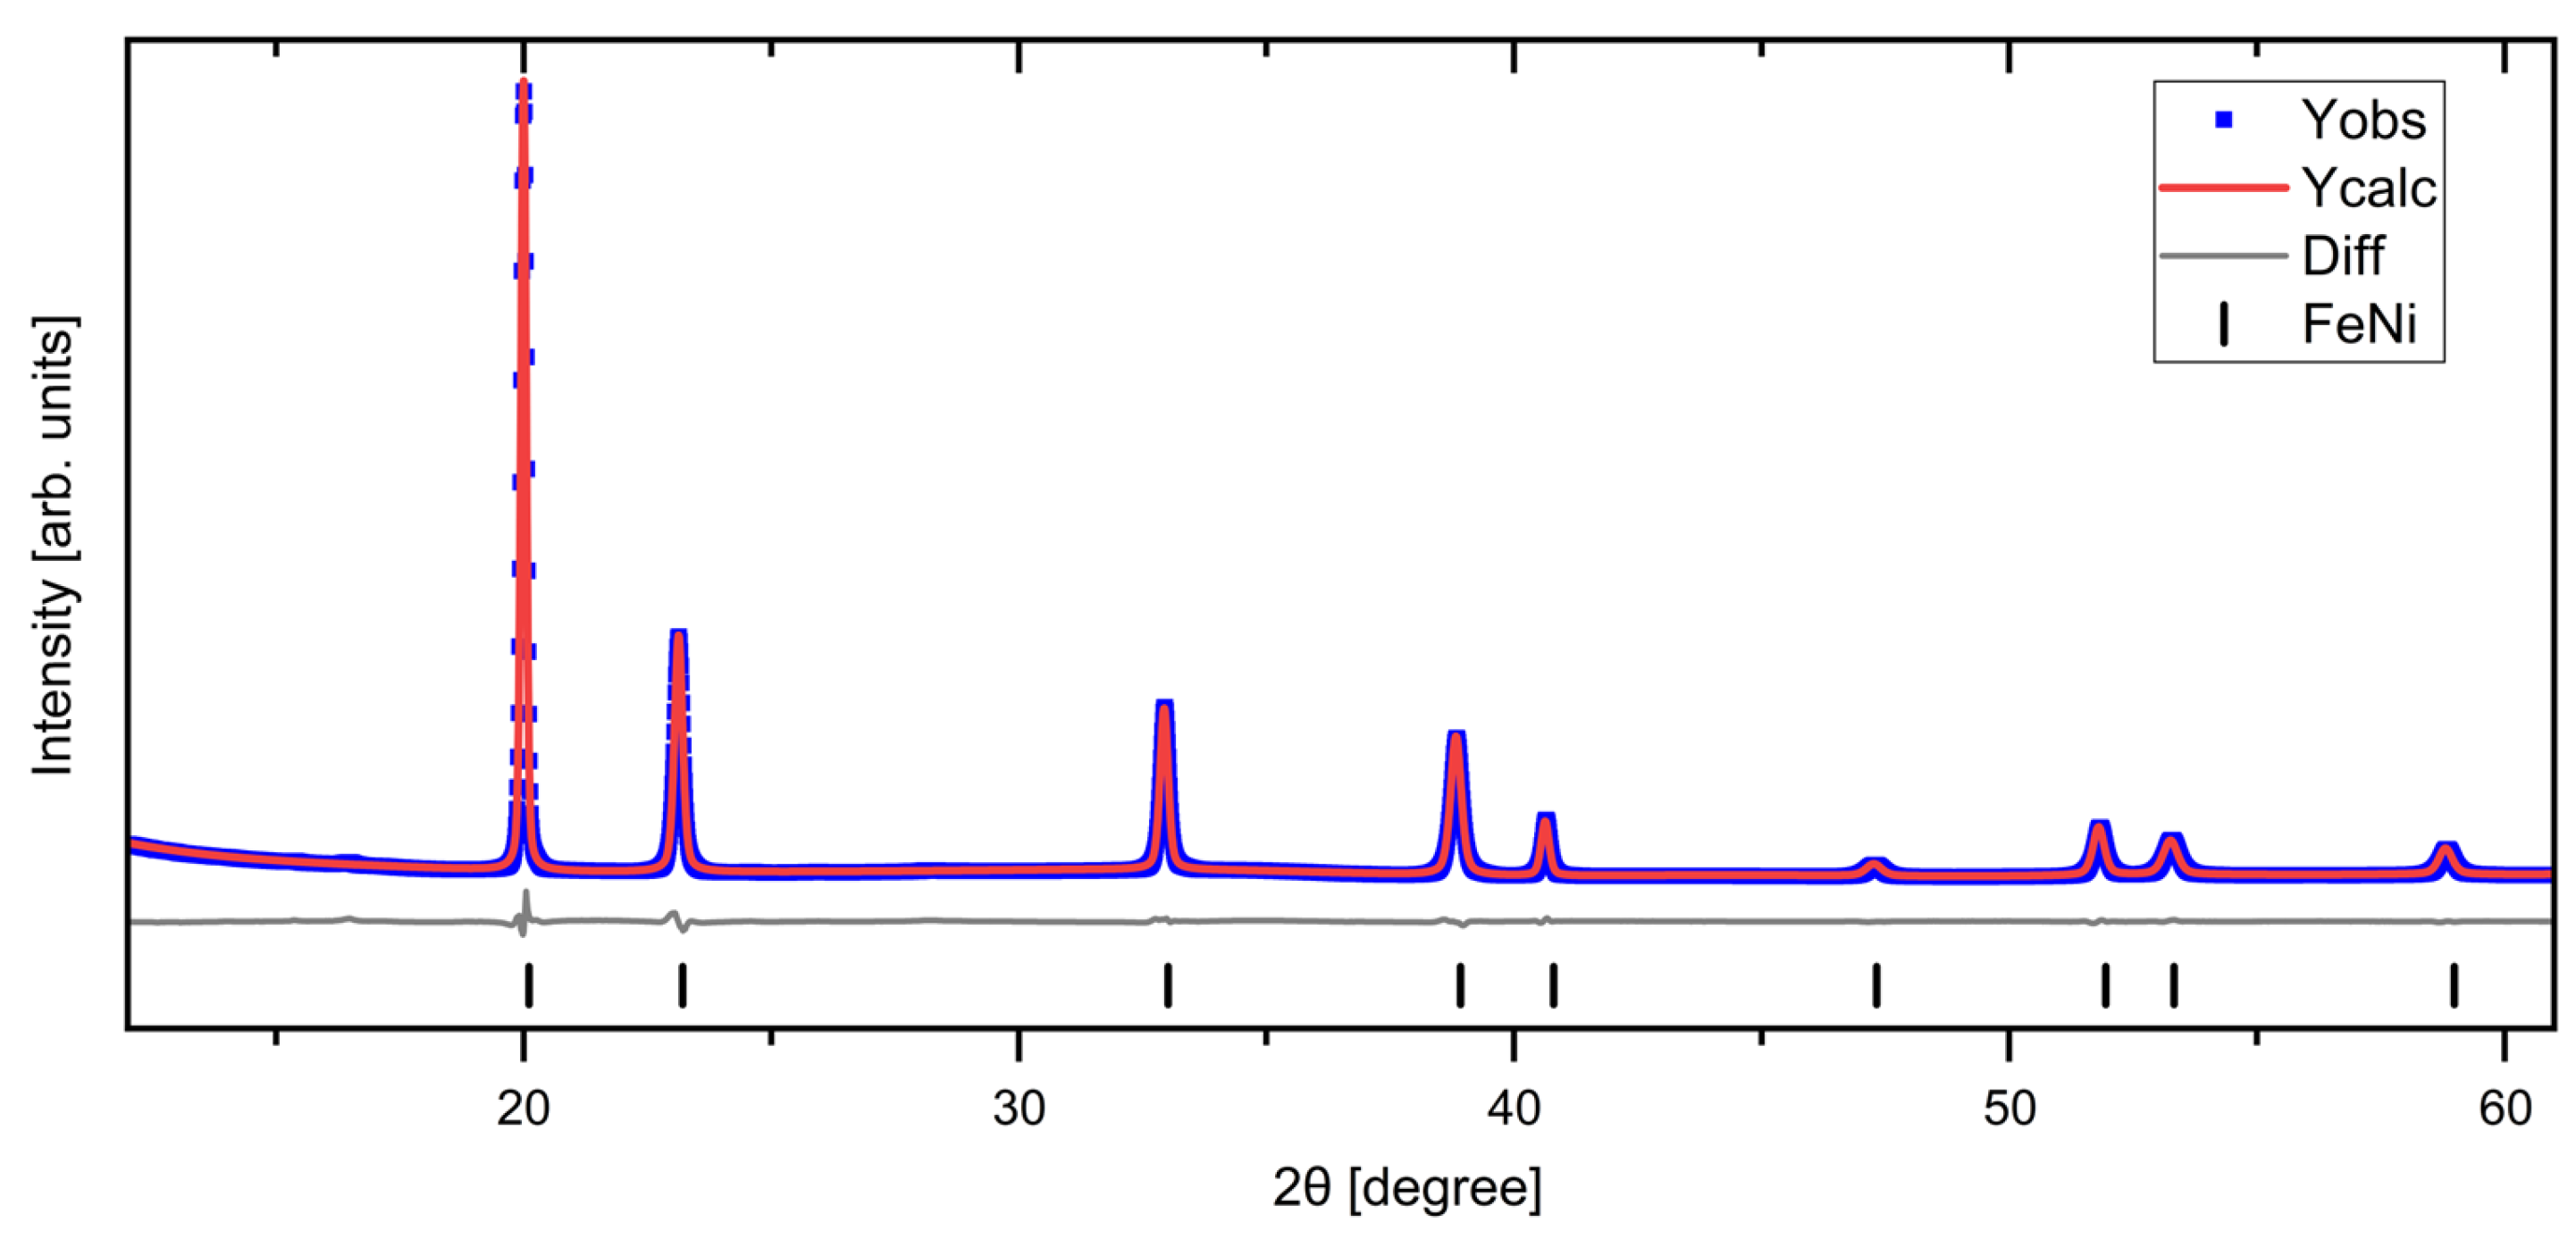
Figure 3 shows the final refinement for a melt-spun (FeNi)
95Al
5 sample after cold rolling and annealing. Superlattice peaks, characteristic of the ordered tetrataenite phase, should be observed at 2θ
11, 16, 26 and 28 degrees corresponding to (001), (100), (111), and (102) reflections, respectively. However, they were not detected in any post-annealed samples. The preferred orientation observed in the as-spun ribbons was eliminated during the cryomilling process (see
Figure S5 for (FeNi)
0.95Mo
5 alloy). On the other hand, cold rolling results in preferred orientation in the [h00] direction. The melt-spun ribbons showed a more pronounced preferred orientation after cold rolling. The plots from the refinements of the remainder of the samples are shown in the
Supporting Information (Figures S2–S5).
The Rietveld refinement results for the annealed samples are summarized in
Table 1. The lattice parameters varied between 3.5848 and 3.5994 Å with no evident variation according to composition or processing techniques. The crystallite size (cs) for the cryomilled samples was noticeably smaller than for the cold-rolled samples. For example, the die-cast and cold-rolled (FeNi)
95Al
5 sample resulted in cs = 199 nm, the melt-spun and cold-rolled sample with the same composition resulted in cs = 294 nm, and the melt-spun and cryomilled sample resulted in cs = 48 nm. The smaller crystallite sizes obtained with cryomilling result from the high-energy milling process responsible for the induction of planar defects, as observed in our previous study [
36].
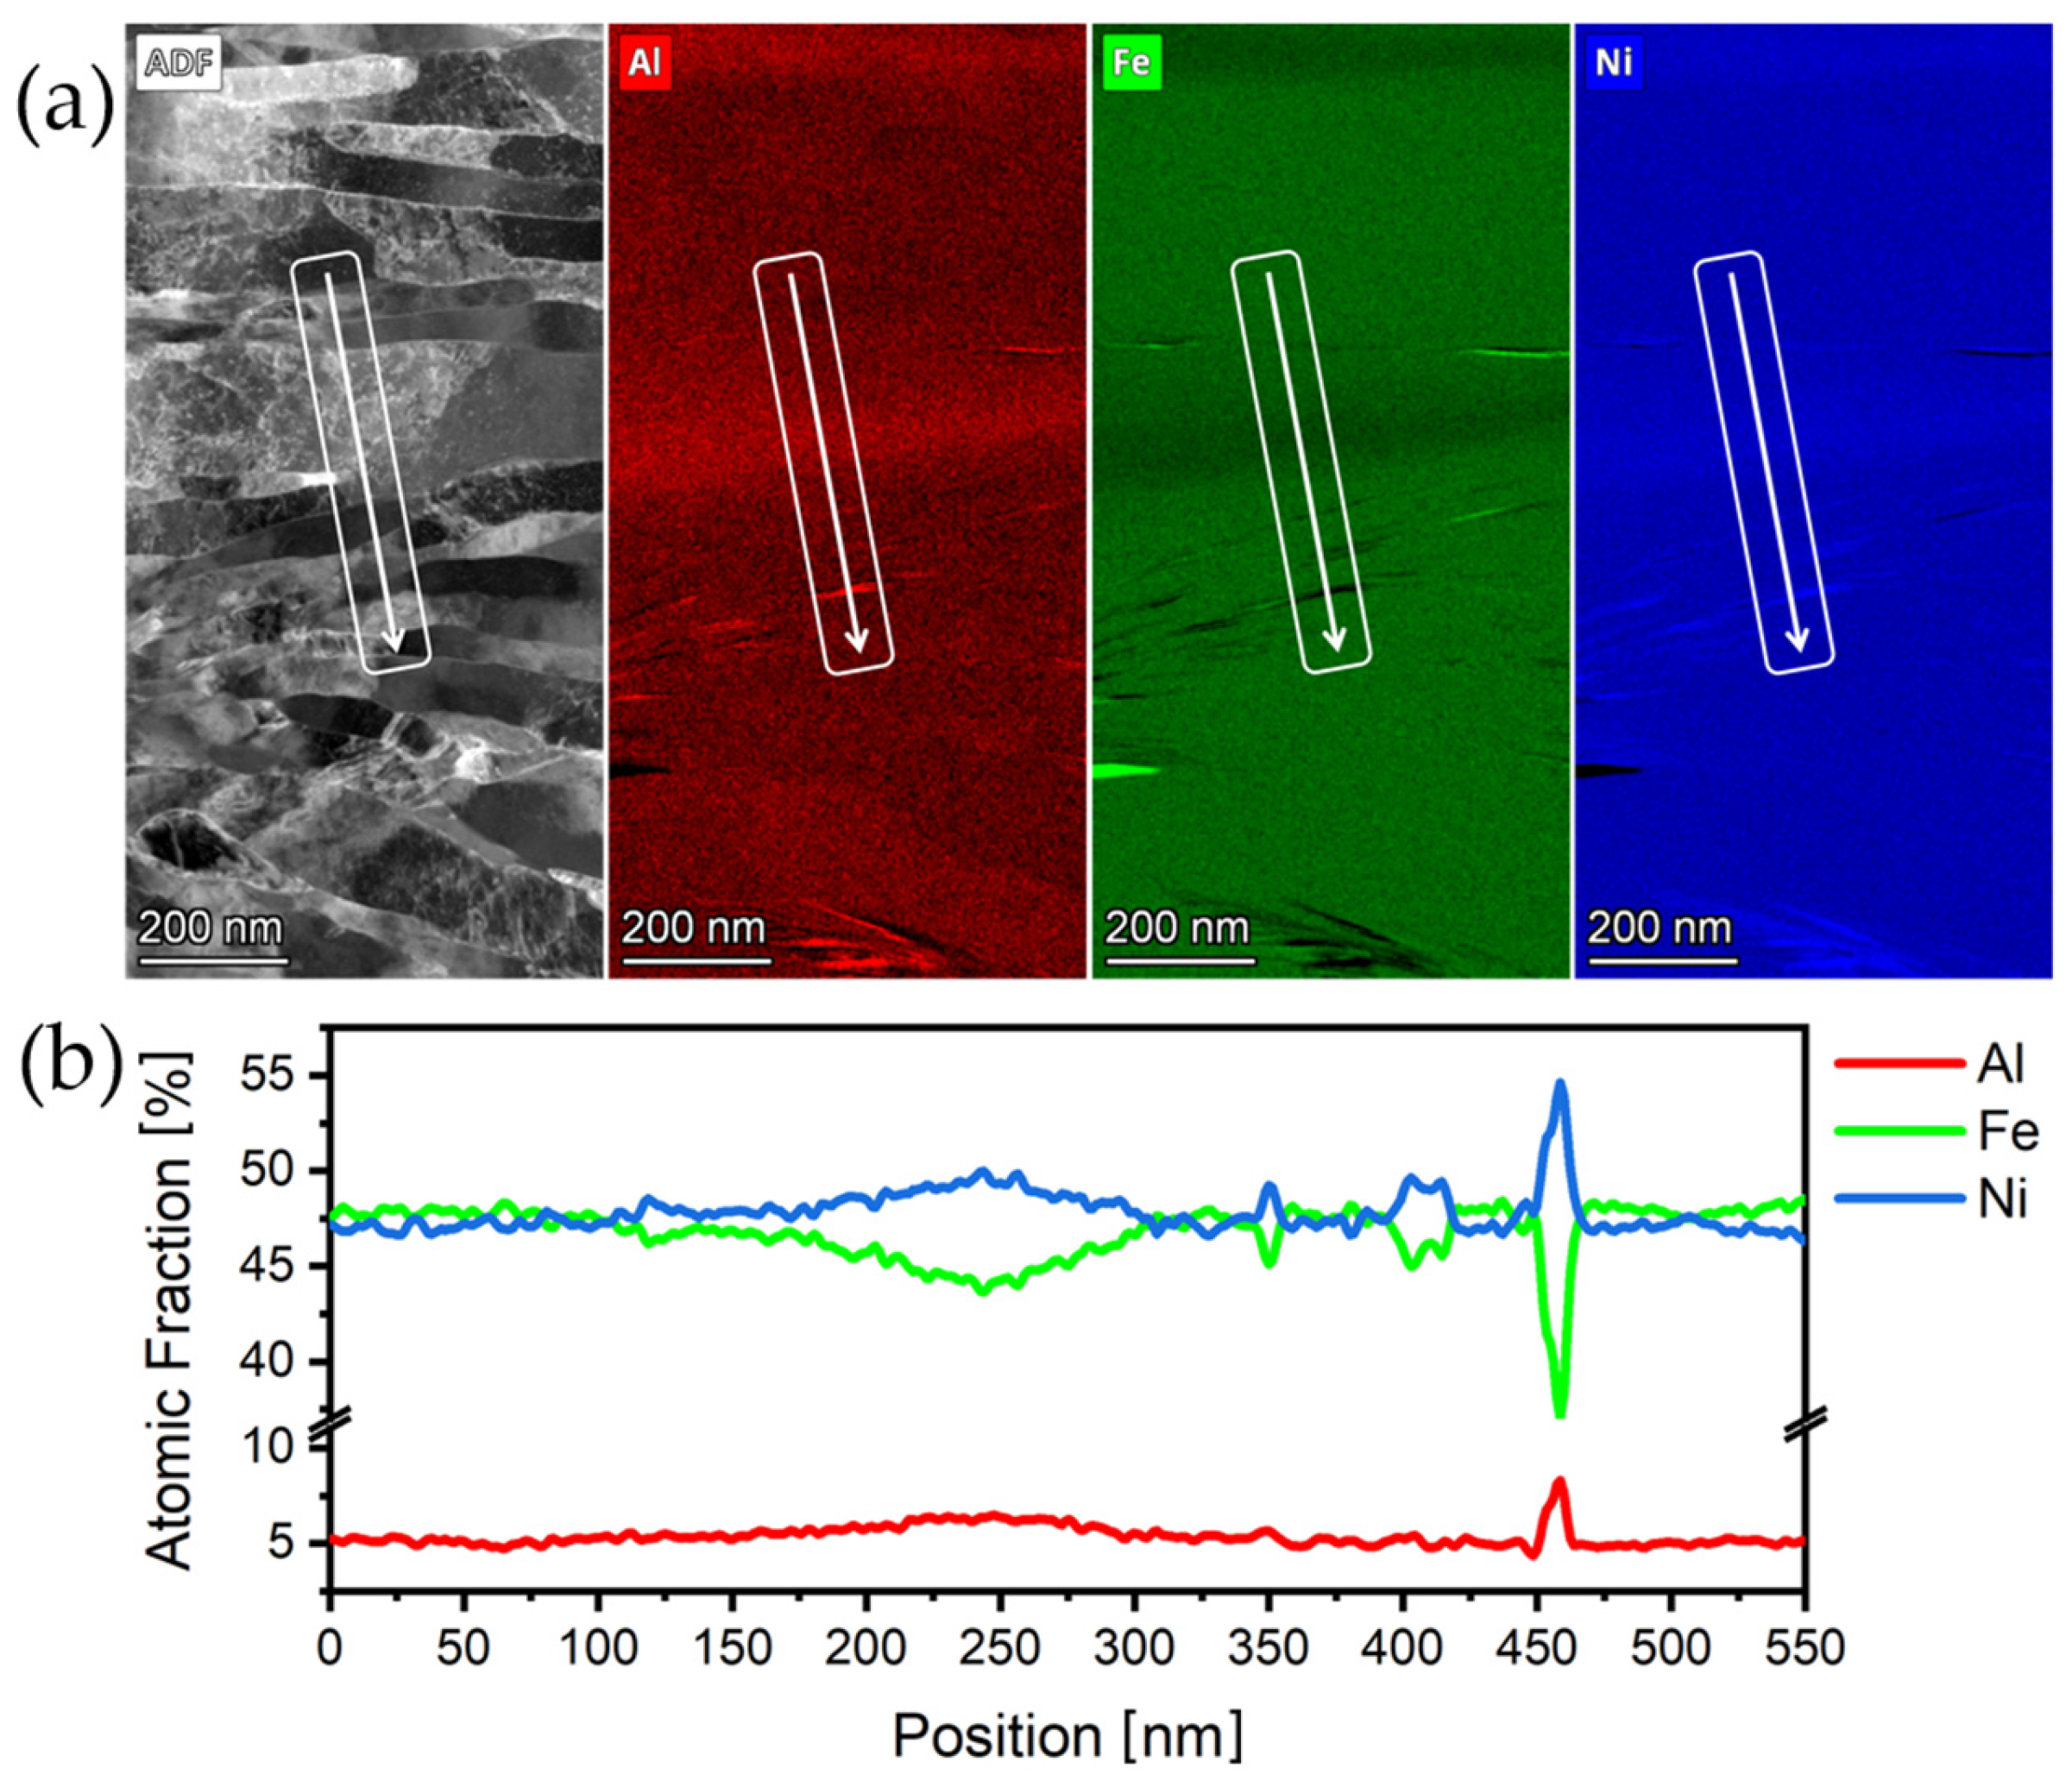
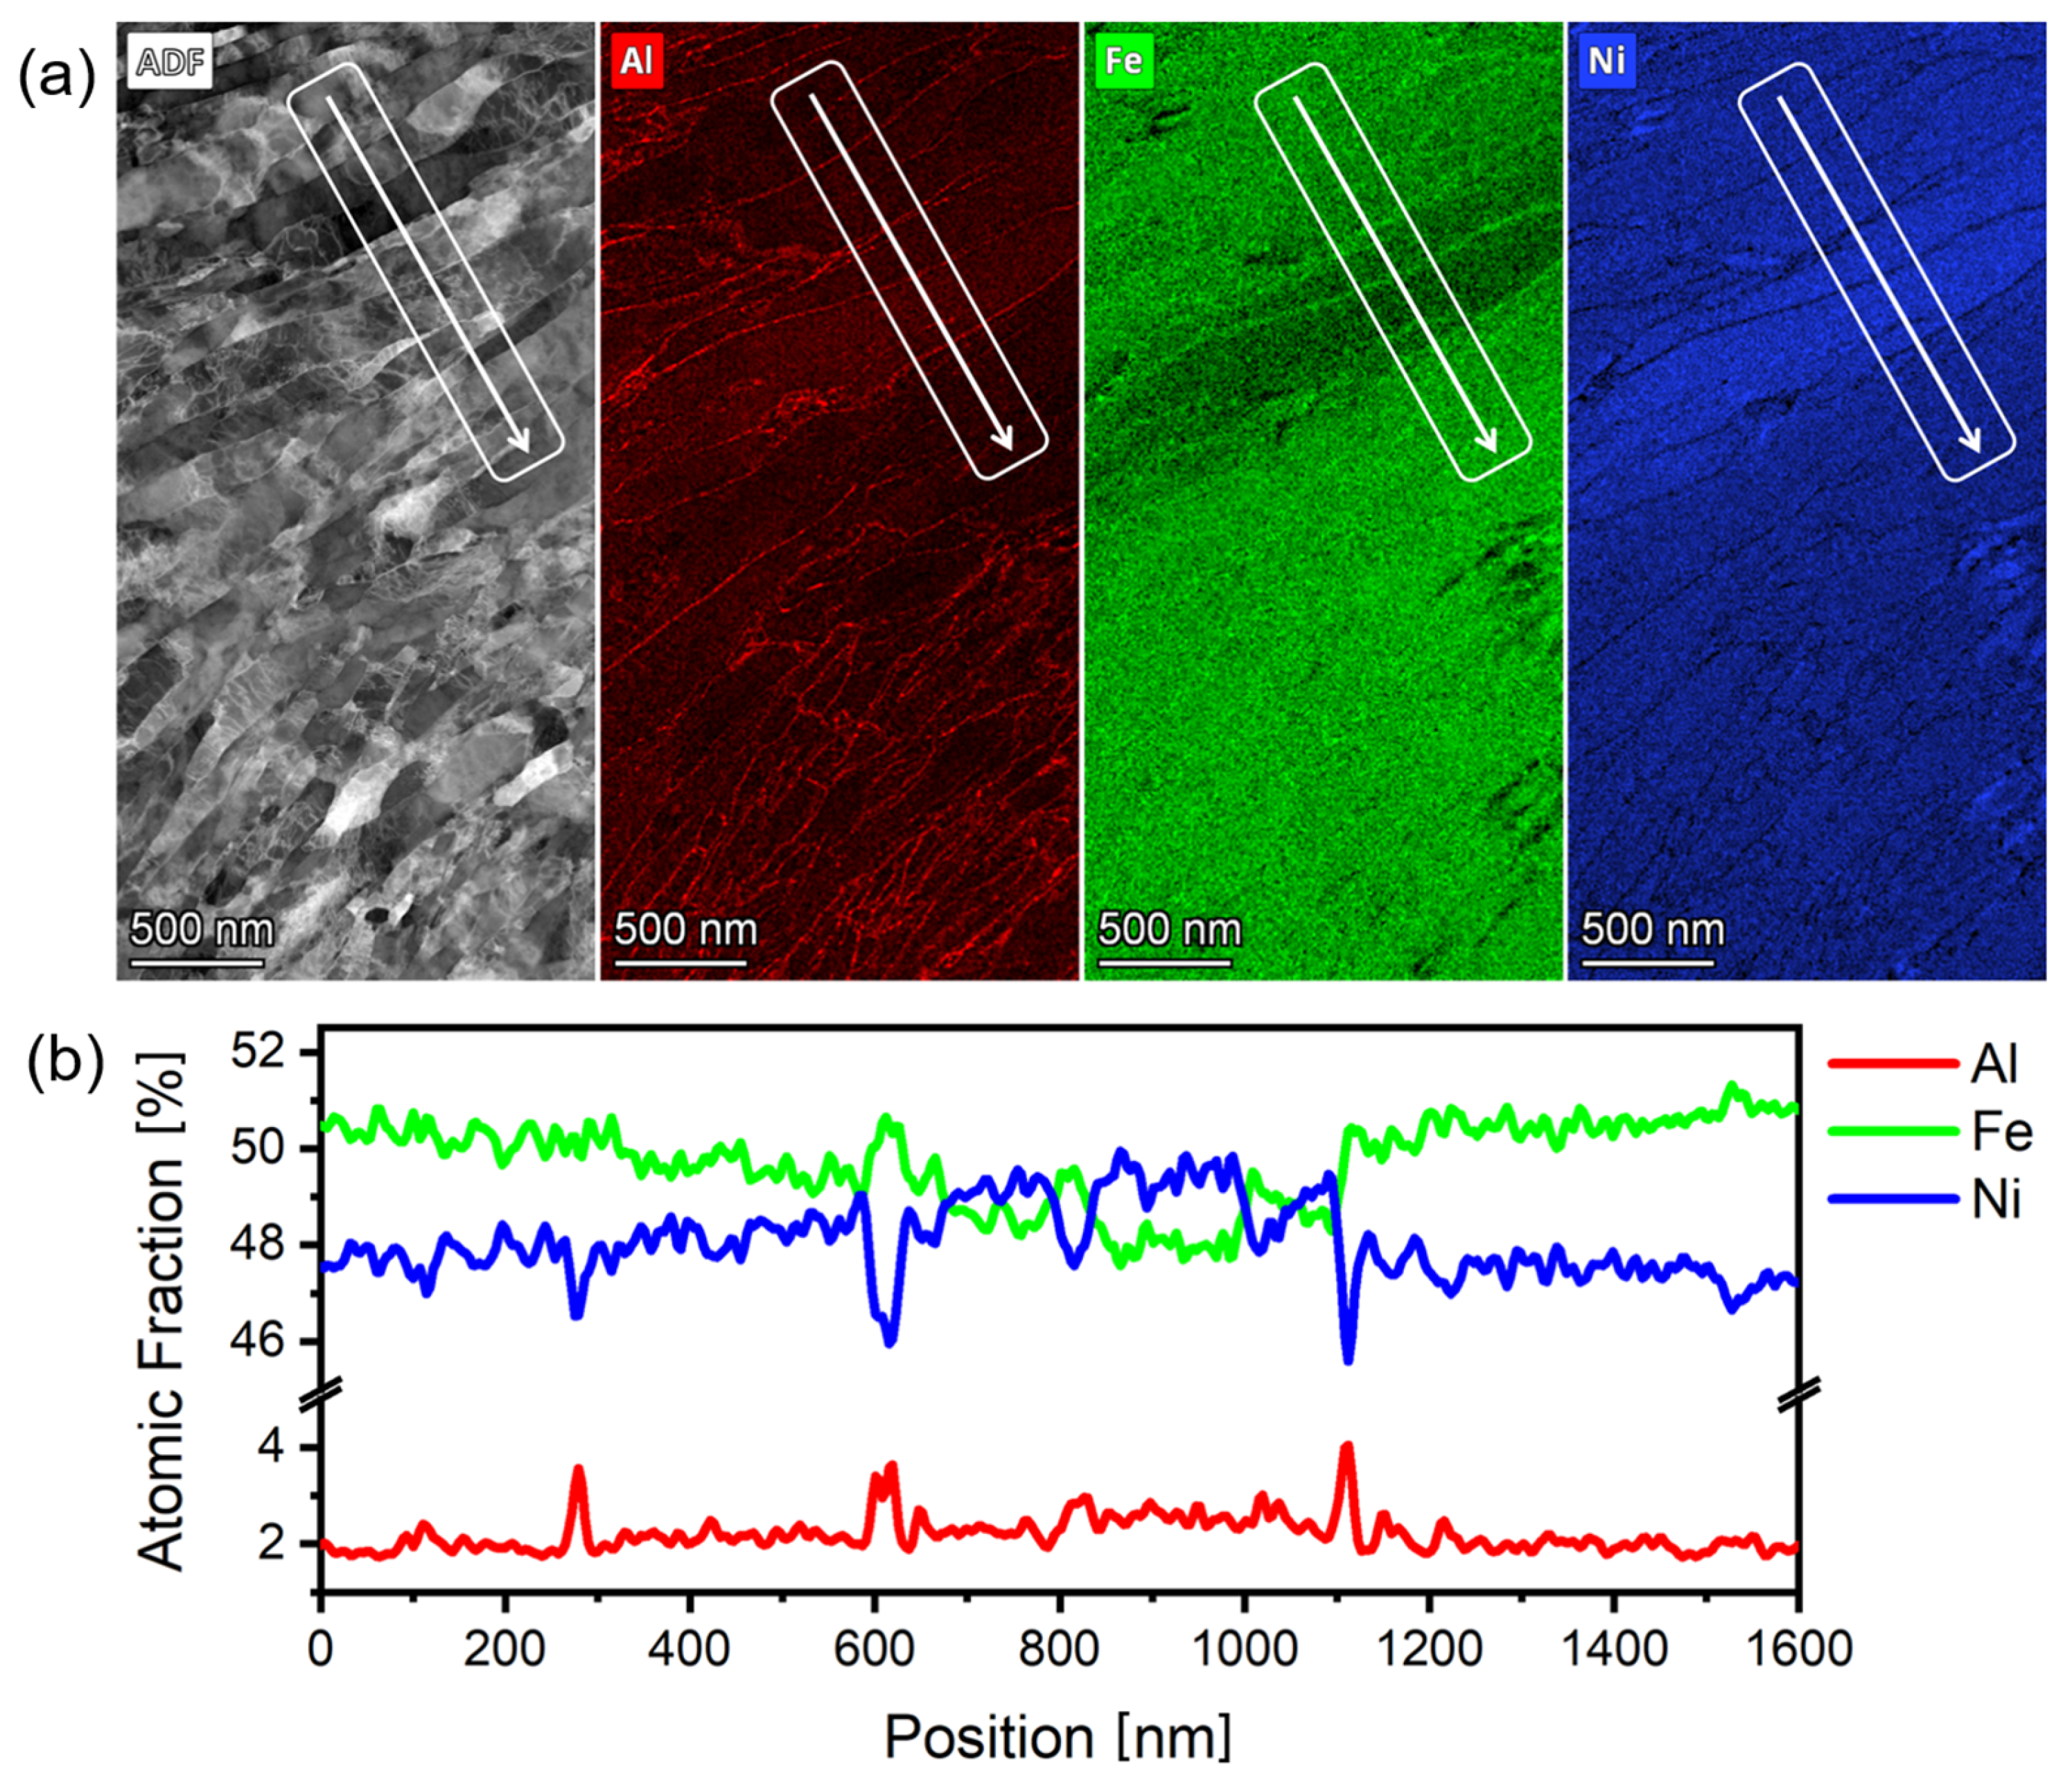
To analyze elemental distribution, EDS of the FIB prepared lamellae was performed,
Figure 4 shows the results for (FeNi)
95Al
5 alloy after cold rolling. In
Figure 4a, an ADF micrograph is overlaid with the alloying elements Fe, Ni, and Al. Elemental mapping reveals regions with minor heterogeneous distribution on the nanometric scale, mainly close to the grain boundary regions. Iron-rich areas of about 5 nm thick were sparsely distributed, resulting in Ni-rich regions, as seen in
Figure 4b. The latter shows the composition measured by line-scan integration of the ADF data in the area and along the line displayed in
Figure 4a.
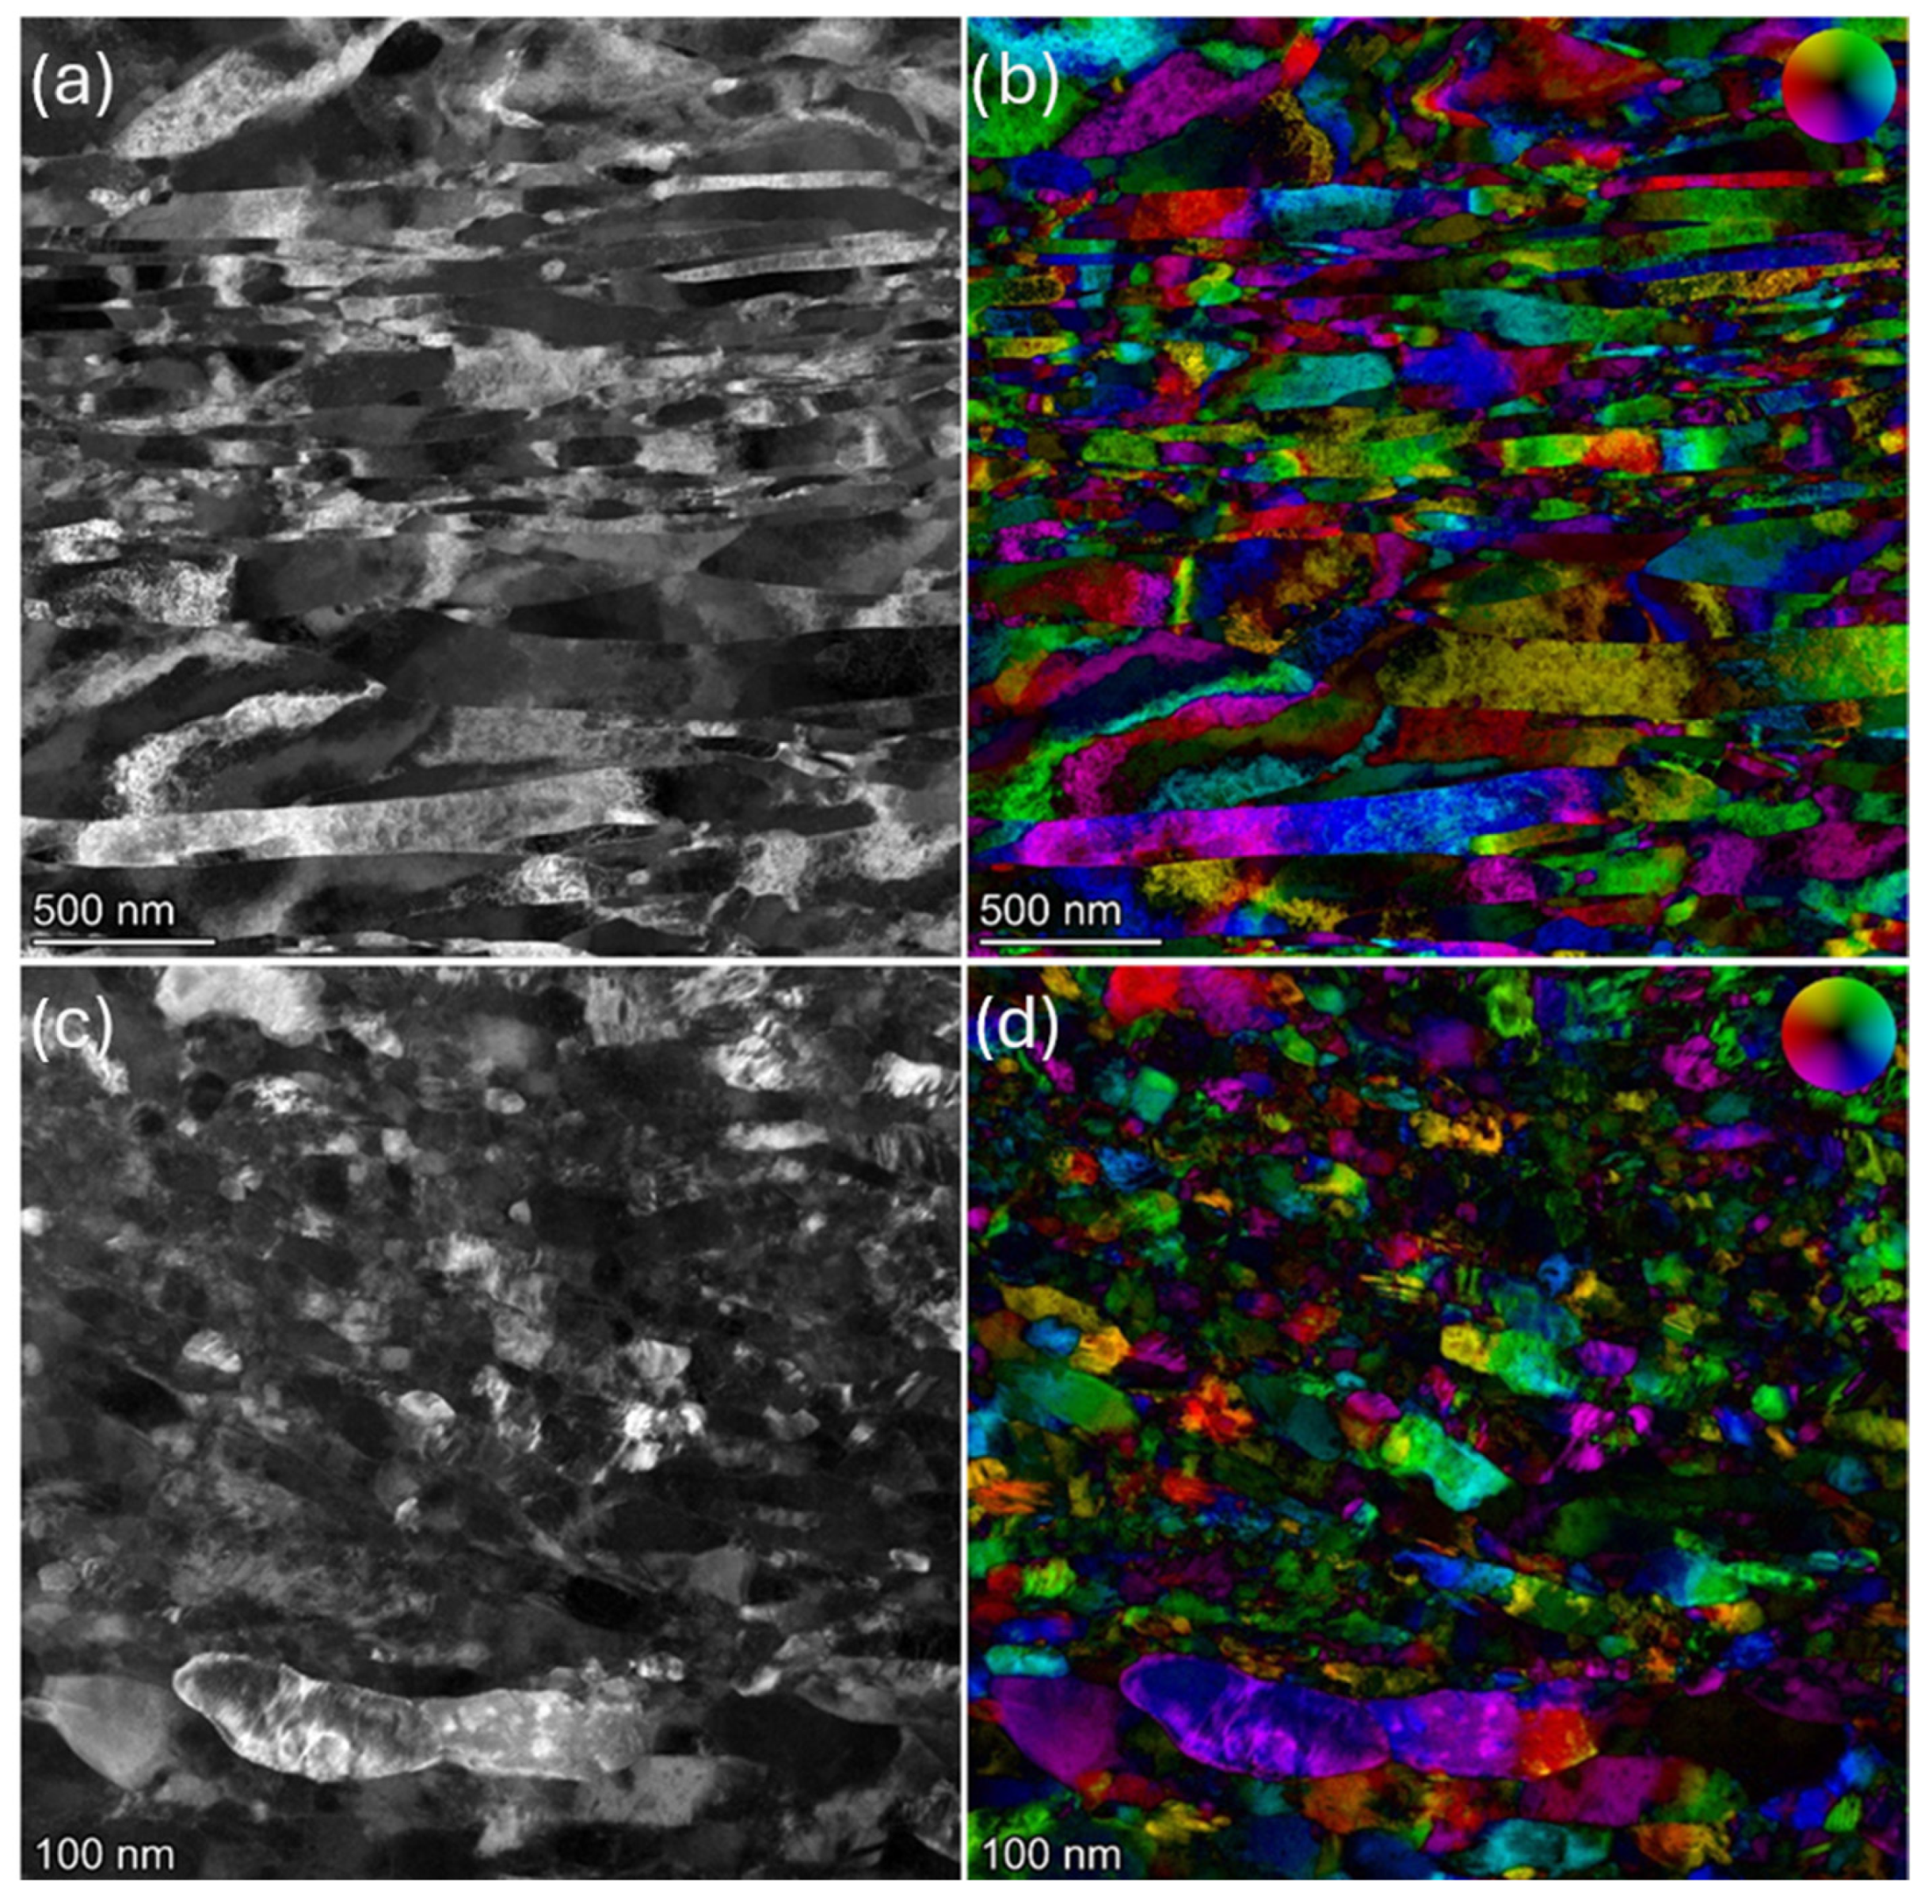
Cold rolling resulted in columnar grain formation with a high density of crystalline defects.
Figure 5a,b show ADF and DPC data for the (FeNi)
95Mo
5 die-cast sample after cold rolling and subsequent annealing. The microstructure exhibits the occurrence of elongated grains with a high concentration of crystalline defects caused by the severe plastic deformation generated by cold working, which is seen as a varying color gradient inside the single crystalline grains.
Figure 5c,d show the ADF and DPC data for the melt-spun (FeNi)
95Al
5, cryomilled, and subsequently annealed sample. The grain size is significantly smaller than for the die-cast samples. However, the cryomilling process resulted in a similarly high concentration of crystalline planar and line defects with both of the used processing techniques.
To confirm a possible disordering of the L1
0 phase, we evaluated the structural changes as a function of temperature for the die-cast (FeNi)
95Mo
5 alloy after cold rolling and annealing using in situ SR-PXD. The samples were heated isochronally to 500 °C at a 5 K/min. After reaching the desired temperature, a dwell time of 30 min was added while collecting diffraction data every 36 s.
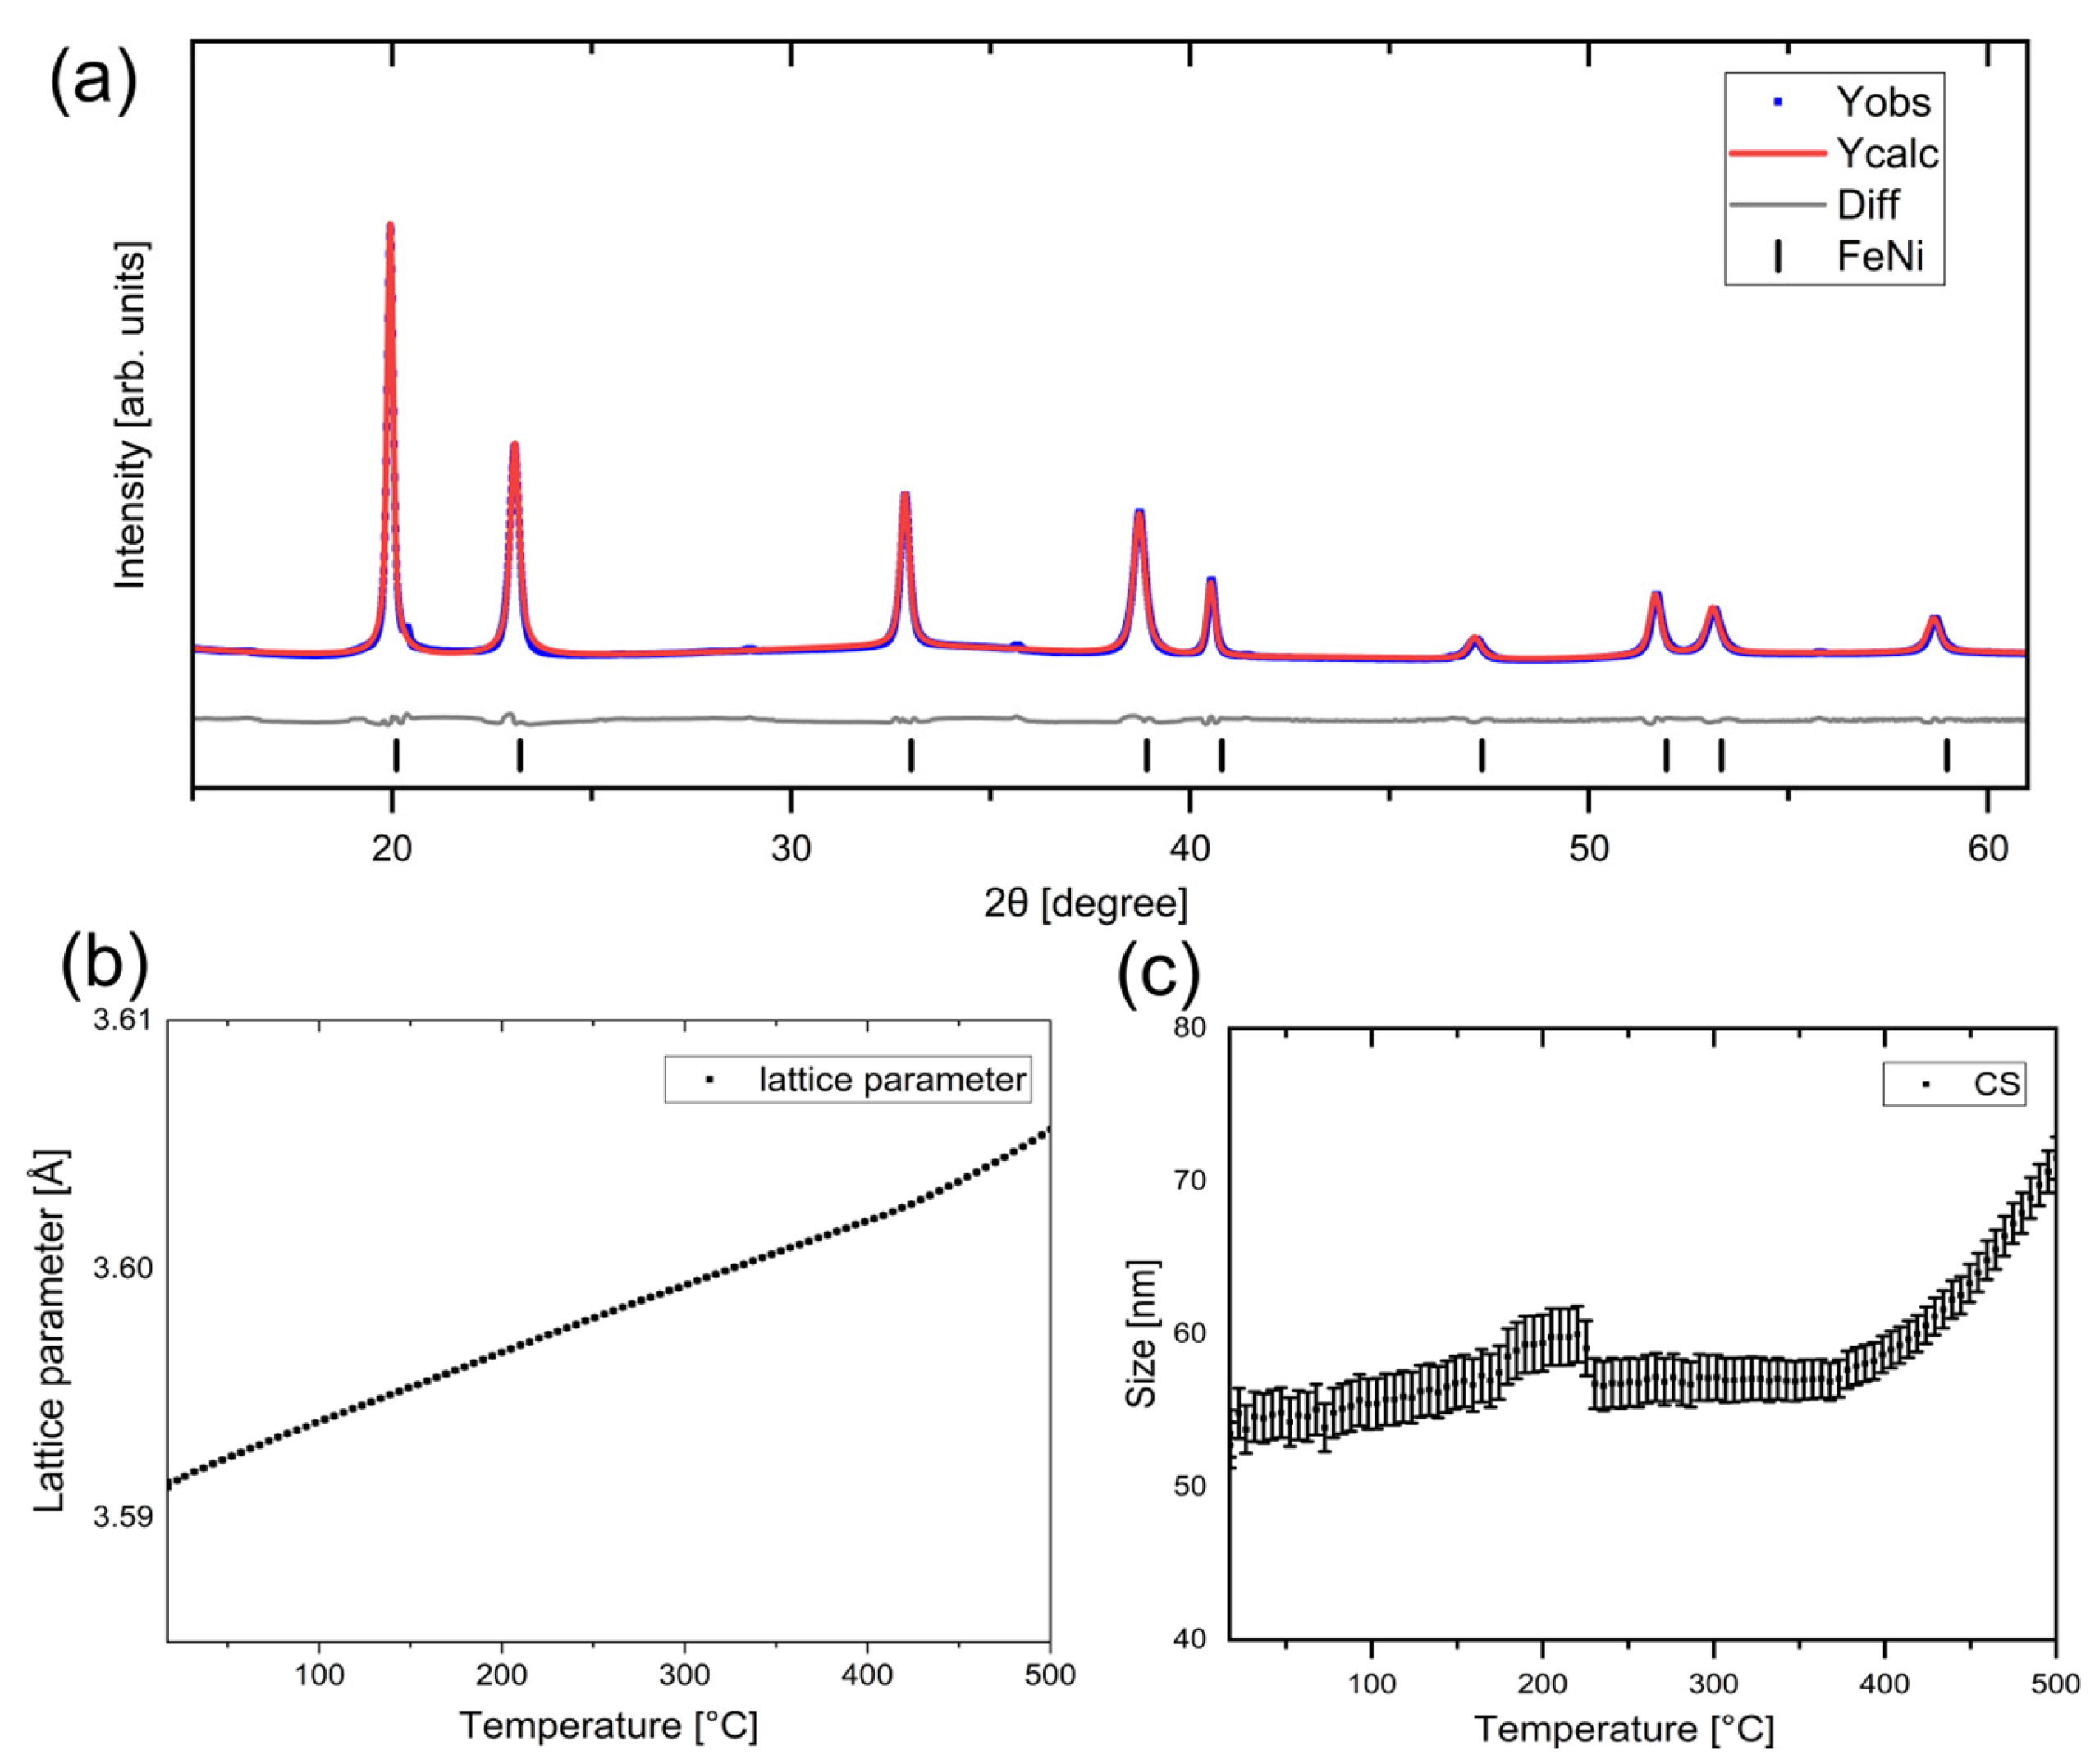
Figure 6a presents the Rietveld refinement of SR-PXD data for the (FeNi)
95Al
5 die-cast, cold-rolled, and annealed sample measured at 500 °C. For the refinement, only a disordered cubic FeNi phase was used.
Figure 6b,c show the evolution of the lattice parameter
a, and crystallite size (CS) during heating from RT to 500 °C as a function of temperature, respectively. The error bars indicate the calculated errors in the refinements. A linear thermal expansion, consistent with the cubic FeNi phase, was observed, confirming the absence of the ordered L1
0 phase. The crystallite size shows only a minor variation as a function of temperature.
To better understand the microstructural changes during heating, thin lamellae of the die-cast (FeNi)
95Al
5 alloy after cold rolling of the samples were heated in situ while acquiring the corresponding STEM data signals.
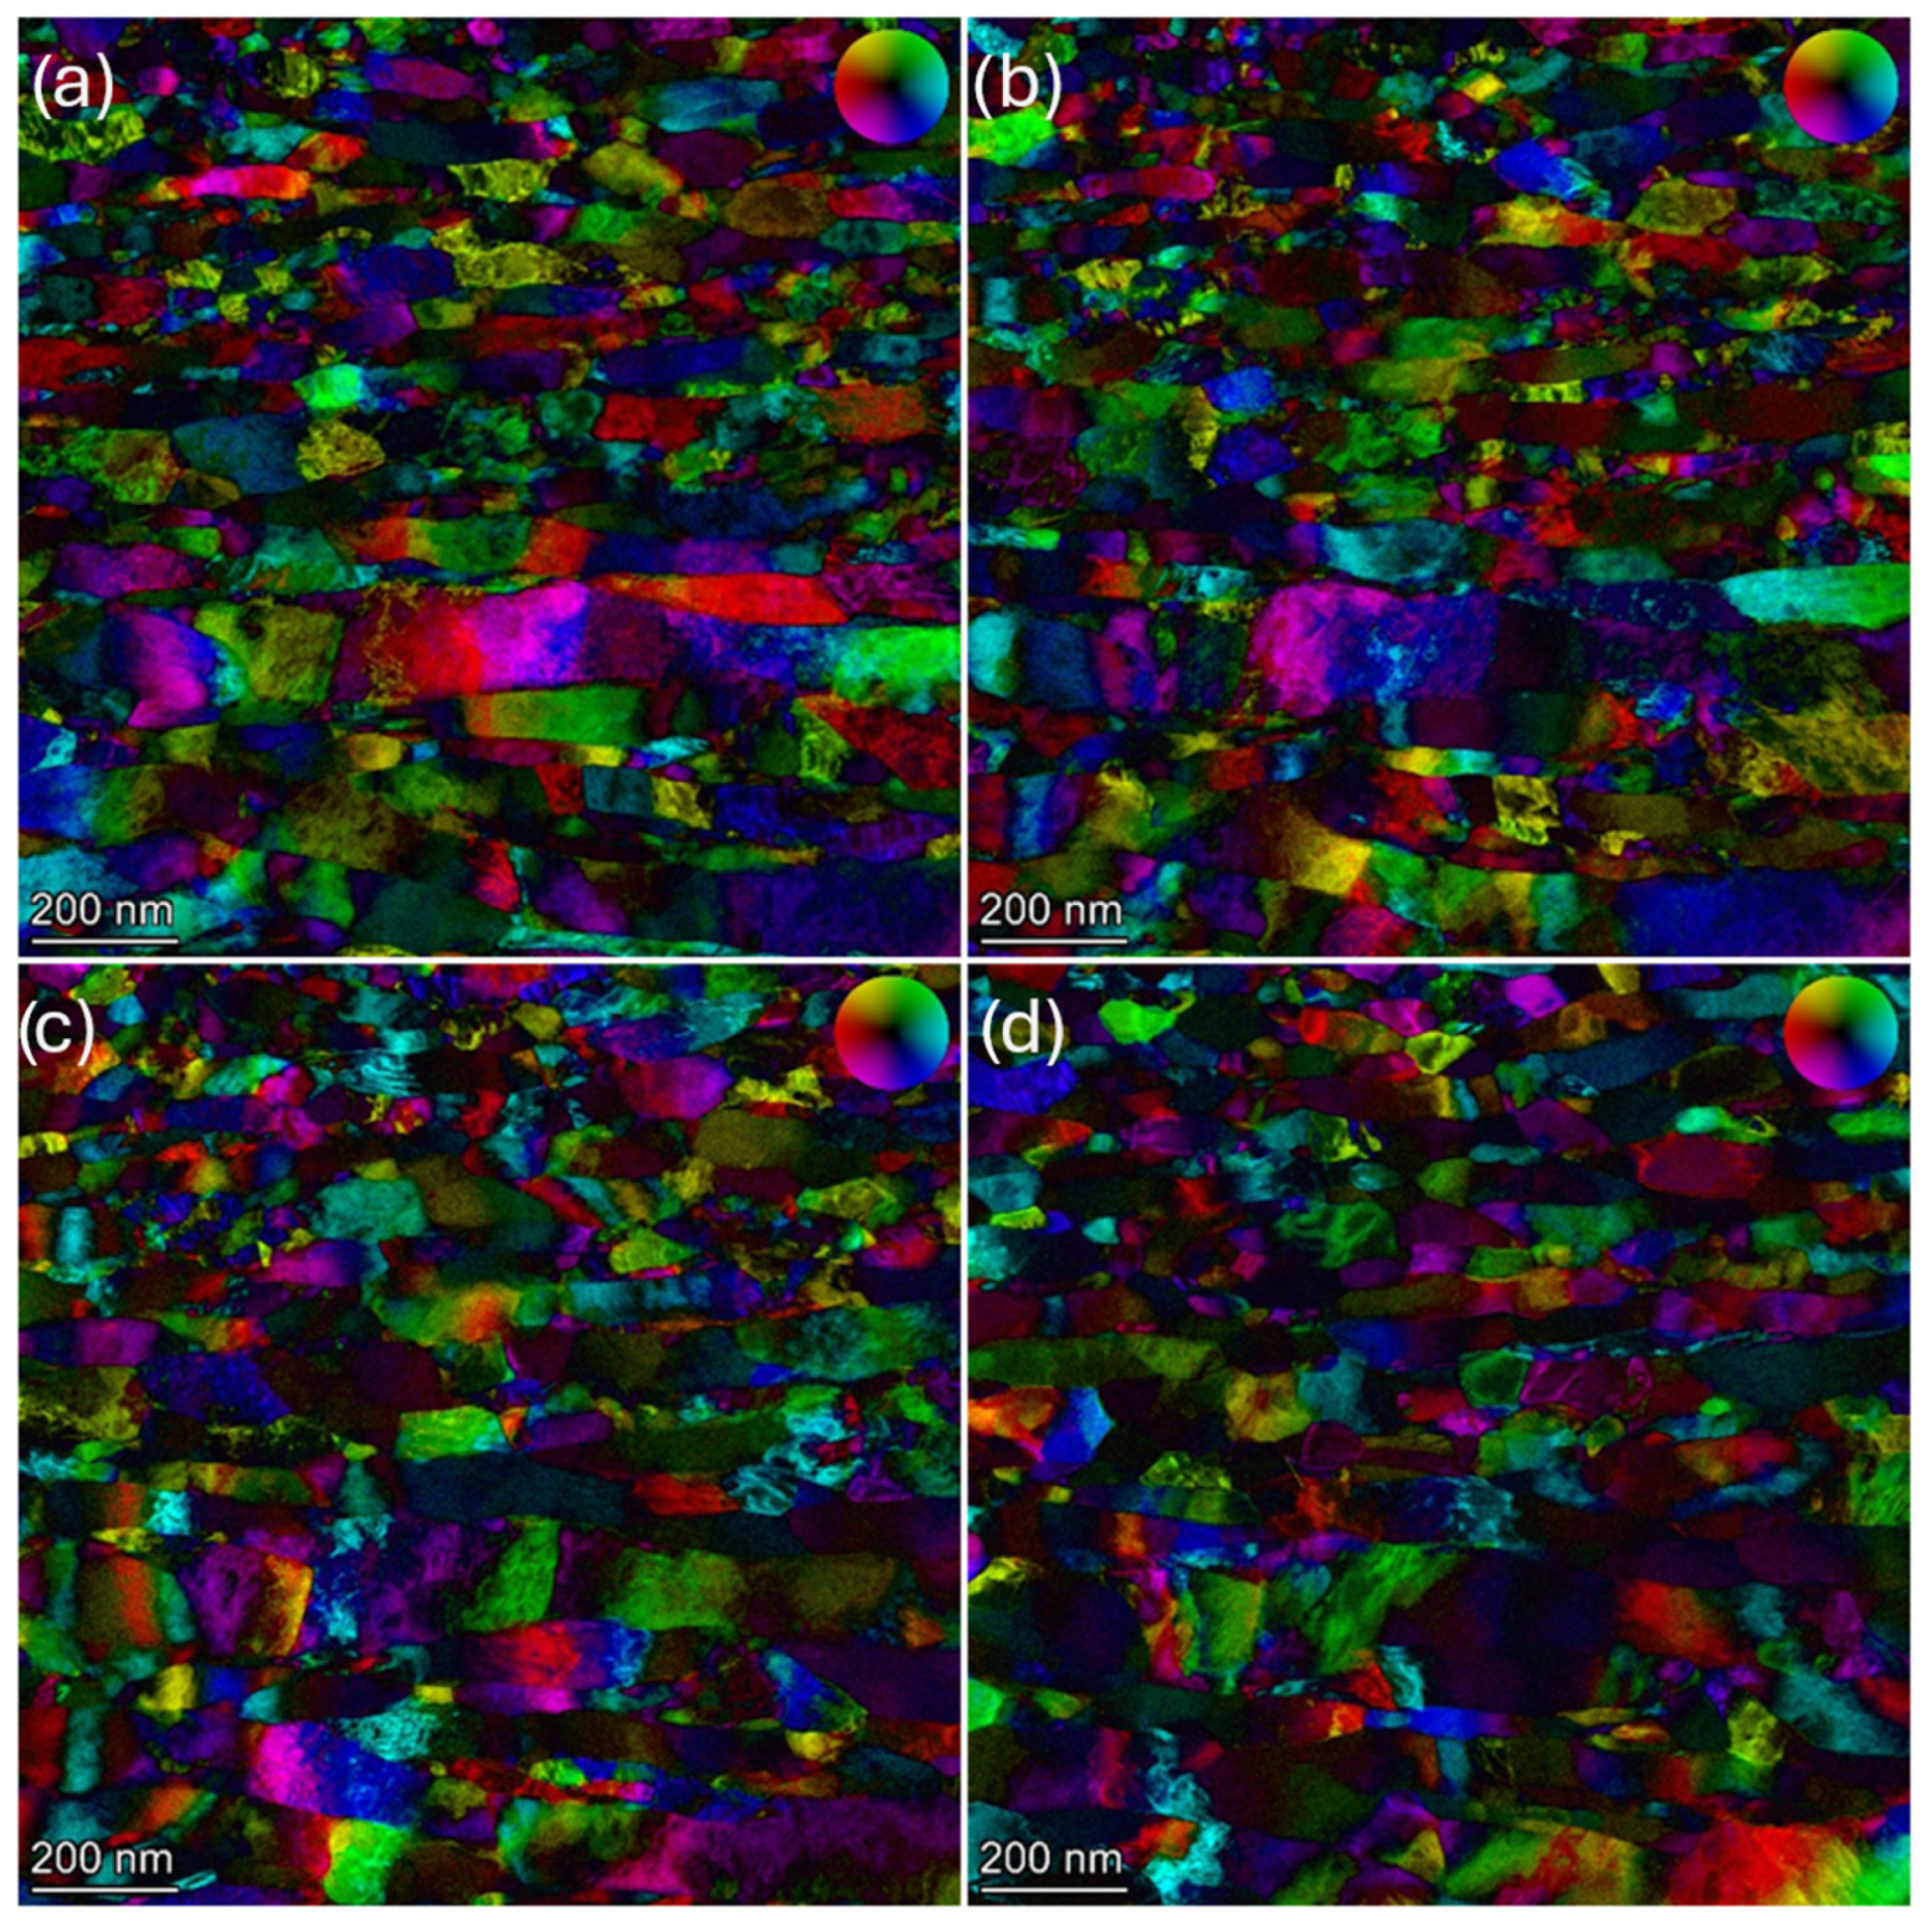
Figure 7 shows DPC micrographs during the heating cycle ranging from 100 to 700 °C. The data were acquired isothermally at (a) 100 °C, (b) 300 °C, (c) 500 °C, and (d) 700 °C. ADF micrographs of the corresponding region are shown in
Figure S6 in the Supporting Information. Grain growth or boundary movements were not observed during the entire heating process. However, small changes in the grain structure were observed with partial elimination of lattice distortions and defects. This is clearly visible in the DPC micrographs, which show the color variation within the crystals and indicate minute changes in the lattice orientation during the heating process, followed by a smearing out of the color variation as the intrinsic number of crystal defects decreases.
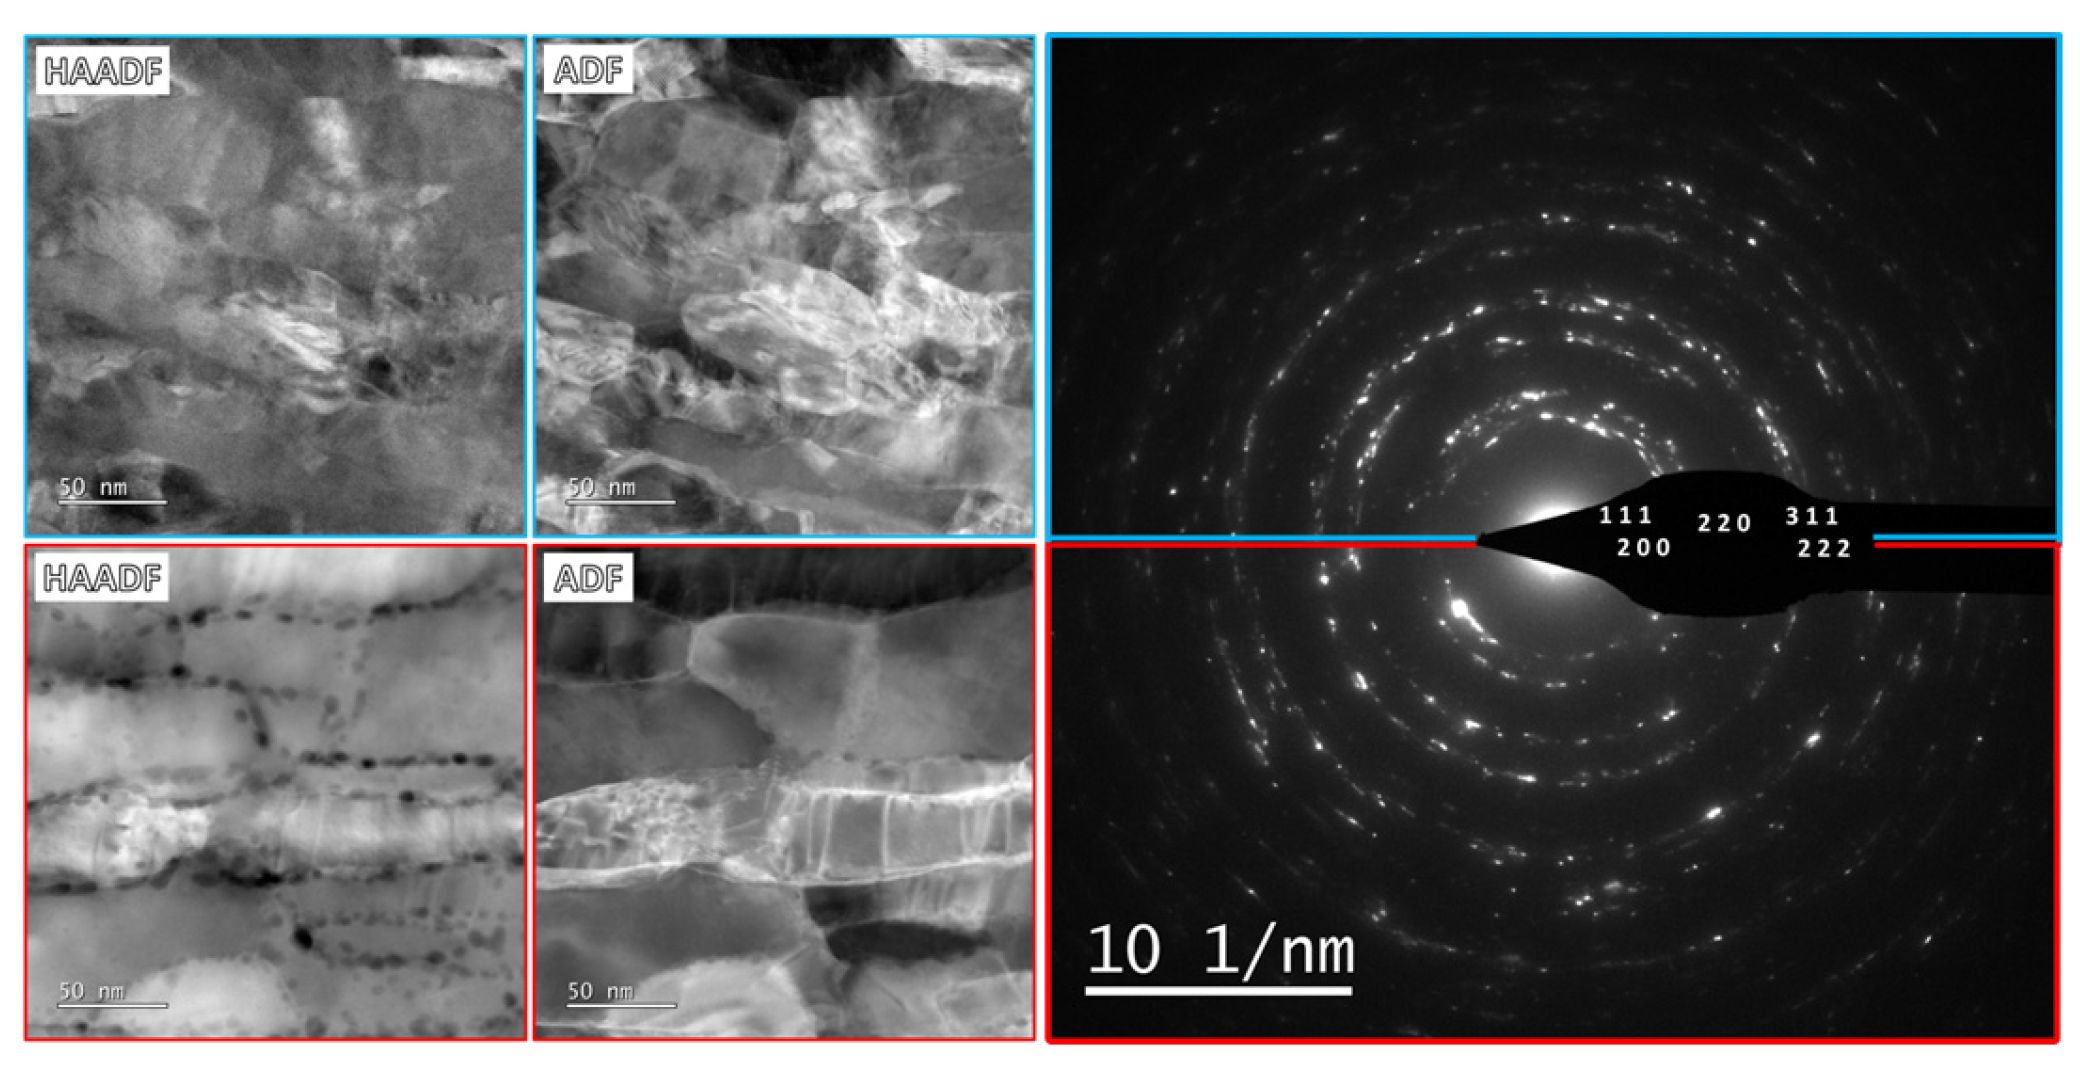
Figure 8 shows HAADF, ADF, and SAED results from the die-cast (FeNi)
95Al
5 sample after cold rolling before (blue top row) and after (red, bottom row) in situ annealing to 700 °C. Despite the microstructural changes caused by partial defect elimination, SAED indicated no phase transformation related to possible disordering of L1
0.
Figure 9 presents STEM-EDS mapping of die-cast (FeNi)
95Al
5 after cold rolling and in situ annealing. After annealing to 700 °C, partial segregation of aluminum was detected in the grain boundary regions.
Figure S7 in Supporting Information shows a larger area of STEM-EDS mapping for the same sample.
Magnetic properties were investigated by VSM through a full hysteresis loop at room temperature. Approximately 20 mg of each sample was measured in powder form.
Figure 10 shows the data for the die-cast, cold-rolled, and annealed samples. The coercivity was lower than 16 Oe for all samples, supporting the absence of the ordered L1
0 phase as already observed by PXD. The equiatomic die-cast, cold-rolled, and annealed FeNi alloy exhibited the highest M
S value, 140 emu/g. The Al-containing alloys resulted in a slightly smaller M
S = 132 emu/g, while the Mo-containing alloys showed an even smaller value of M
S = 120 emu/g.
Figure S8 in the Supporting Information shows the magnetic measurements for the melt-spun, cryomilled, and annealed samples, and
Figure S9 shows magnetic measurements for the melt-spun, cold-rolled, and annealed samples. All samples were measured after annealing and resulted in similar coercivity values, confirming that annealing did not promote ordering in the highly deformed alloys, regardless of composition.
4. Discussion
Die casting produced disordered single-phase fcc FeNi alloys in which Al and Mo were dissolved. SEM and PXD data did not detect any secondary phases. Melt spinning also produced fcc FeNi phase with Al and Mo dissolved in the disordered cubic phase, with small amounts of FeNi2O4 being observed by PXD. Since the pre-alloys used for die-casting and melt-spinning were produced following the same preparation route, it is likely that the oxides observed in the melt-spun ribbons were formed due to the higher surface area of the ribbons compared to the die-cast alloys.
The PXD data for the melt-spun alloys exhibited preferred orientation. This is typical for melt-spun ribbons, which undergo heterogeneous crystallization, resulting in the formation of texturized columnar grains by growth selection of favorably oriented crystallites [
37].
After cryomilling, the melt-spun ribbons were transformed into a powder with particle sizes ranging from 5 to 100 µm (see
Figure S10 in Supporting Information). The irregularly shaped, rounded particles are a consequence of the cryomilling process, as observed previously in our work on cryomilled FeNiC
x alloys [
36]. PXD data for the cryomilled powders (
Figure S5 in the Supporting Information) exhibit broader diffraction peaks when compared to the as-cast samples. In addition, small shifts in the Bragg peak positions were observed due to defects induced by the milling process.
Cold rolling promoted intra- and intergranular cracks in the melt-spun samples, as shown in
Figure S5 in the Supporting Information. Since the SEM micrographs were obtained from the surface of the ribbons perpendicular to the direction of rolling, no deformation of the crystallites was observed.
The SR-PXD data of the samples after annealing show that they all consist of a single disordered FeNi
95(Mo)
5 or FeNi
95(Al)
5 cubic phase with complete solubilization of Mo and Al in the fcc system. The structural parameters determined from Rietveld refinements did not show evidence of tetragonal distortion or lattice parameter variation with different compositions. Similar studies, i.e., reported by Maât and Montes-Arango indicated a clear
c/
a ratio difference induced by mechanical activation and subsequent annealing [
29,
30]. No evidence of the L1
0 phase was detected in any of the samples studied, regardless of the alloy’s composition. A small secondary FeNi
2O
4 phase could be observed in melt-spun samples. The (311) Bragg peak of FeNi
2O
4 overlaps with the (100) superlattice peak of the L1
0 phase, which could lead to misinterpretation of the occurrence of ordering in FeNi.
Rietveld refinement of SR-PXD data for samples heated in situ shows no indication of structural modification in the cubic system. The lattice parameter expands linearly with increasing temperature. Strain reduction occurs, mainly above 250 °C, which is in agreement with the in situ DPC STEM experiments. However, the grain structure changed with the partial elimination of lattice distortion. This data indicates that annealing does not promote long-range ordering on the FeNi alloys at the timescales investigated in this work. The annealing temperature was kept below the order-disorder temperature of the L1
0 phase, and extending the process duration by another order of magnitude could prove not feasible for practical applications. On the other hand, other variables not explored in this work, i.e., pressure or magnetic field, could promote faster ordering, as previously investigated by Maât et al. [
29].
The magnetic properties measured in a full-loop hysteresis curve at room temperature showed a soft magnetic behavior for all studied samples. The coercivity values obtained (below 16 Oe) were comparable to the disordered single-phase fcc FeNi alloys produced by ball milling (between 5 and 32 Oe) and reported by Guittoum et al. [
38]. These values lie far below the expected coercivity for the ordered L1
0 phase. As a comparison, H
C = 1.2 kOe for the NWA 6259 meteorite [
39]. Since no noticeable hardening was observed, we can conclude that under the conditions used in this work, the addition of small amounts of Mo or Al does not promote ordering of the FeNi phase.
