Abstract
CoCrFeNiMn high entropy alloy (HEA) fabricated via laser-based powder bed fusion (PBF-LB/M) exhibits exceptional mechanical properties, including high strength, better ductility than titanium alloy, and superior corrosion resistance. This study simulates the intergranular fracture behavior of PBF-LB/M CoCrFeNiMn HEA under tensile loading by embedding cohesive elements with damage mechanisms into polycrystalline representative volume elements based on the crystal plasticity finite element method. The simulation results show good agreement with reported experimental stress–strain curves, demonstrating that the crystal plastic constitutive model combined with the cohesive constitutive model can accurately describe both the macroscopic response behavior and fracture failure behavior of the CoCrFeNiMn HEA. Furthermore, this work investigates the mechanical properties of the HEA in different tensile directions, the improvement of anisotropy through columnar-to-equiaxed grain transition, and the effect of texture strength on crack initiation and propagation. The results show that the polycrystalline CoCrFeNiMn HEA exhibits anisotropic mechanical properties: simulated yield strengths (YSs) are 436.9 MPa (in the scanning direction) and 484.7 MPa (in the building direction), tensile strengths (TSs) reach 639 MPa and 702.5 MPa, and elongations (ELs) are 10.6% and 21.8%, respectively. After equiaxed grain formation, the EL in the scanning direction increased from 10.6% to 17.2%, while the EL in the building direction decreased from 21.8% to 20.3%. Concurrently, the anisotropy coefficients of YS, TS, and EL decreased by 1.8%, 2.2%, and 36.1%, respectively. The cracks initiate at stress concentrations and subsequently propagate along grain boundaries until final fracture. Variations in texture strength significantly influence the crack initiation location and propagation path in the CoCrFeNiMn HEA.
1. Introduction
The concept of high entropy alloys (HEAs) was first proposed by Yeh J. [1] in 2004. The CoCrFeNiMn HEA is widely used in aerospace applications, corrosion-resistant coatings, and mold manufacturing due to its excellent thermal stability, superior corrosion resistance, and high fatigue resistance [2,3,4]. The CoCrFeNiMn high entropy alloy (HEA), which possesses a single face-centered cubic (FCC) crystal structure, has attracted significant research attention and has been extensively investigated [5]. Laplanche et al. [6] conducted tensile experiments on the as-cast CoCrFeNiMn HEA at room temperature (293 K) to obtain its stress–strain curve. The results demonstrated that the yield strength and ultimate tensile strength of the alloy were 265 MPa and 600 MPa. The as-cast CoCrFeNiMn HEA often exhibits issues such as compositional segregation, pore defects, and inclusions. Among these, compositional segregation can significantly deteriorate the mechanical properties of HEAs [7]. Laser-based powder bed fusion (PBF-LB/M) can achieve high-precision forming of complex structures and is widely used in additive manufacturing. PBF-LB/M, as a standardized nomenclature, is also known as laser selective melting (SLM). Brif Y. et al. [8] reported the first use of SLM to fabricate HEA. The FeCoCrNi HEA produced via SLM exhibited no signs of segregation. Compared to as-cast FeCoCrNi HEA, the SLM-fabricated counterparts demonstrated significantly enhanced properties. Specifically, not only can SLM form complex structural parts, but SLM HEA has a yield strength of 600 MPa, which is more than three times higher than the 188 MPa yield strength of cast alloys. Kim et al. [9,10] investigated the effect of adding specific trace elements with varying concentrations on the microstructure evolution and mechanical properties of high-entropy alloys. The incorporation of 3 at% Mo and 5 at% Ti significantly altered the volume fraction and morphology of the AlCrFeNi alloy, resulting in an increase in yield strength from 1389 MPa to 1703 MPa.
Gu et al. [11] conducted an investigation into the anisotropy of the microstructure and mechanical properties of FeCoNiCr0.5 HEA prepared by SLM. In the XOY plane (perpendicular to the building direction), the grain size is mostly between 40 and 60 μm with equiaxial morphology; in the XOZ plane (parallel to the building direction), columnar grains have a length of 80–100 μm. This microstructural difference resulted in the anisotropic tensile behavior of the specimens. Kim et al. [12] employed SLM to fabricate CoCrFeMnNi HEA specimens, achieving yield strengths of 778.4 MPa and 703.5 MPa along the scanning direction and building direction. To mitigate anisotropy, researchers [13,14] have employed various post-processing techniques aimed at eliminating columnar grains along the deposition direction. Ng et al. [13] demonstrated that hot isostatic pressing (HIP) facilitated the transformation of the Ti-3Al-8V-6Cr-4Mo-4Zr alloy from a columnar to an equiaxed grain structure, while also achieving a substantial grain refinement of up to 72.5%. Furthermore, Dolzhenko et al. [14] reported that the texture strength increased significantly with rising temperature, thereby enhancing the mechanical properties of Cu-Ni-P alloys through heat treatment. Currently, the influence of additively manufactured columnar grain structures on mechanical properties and grain boundary fracture mechanisms remains unclear, while experimental verification entails high costs. This study employs numerical simulations to investigate the effects of columnar grain morphology (with varying aspect ratios) and texture strength on mechanical properties and fracture behavior.
With the ongoing advancement of numerical simulation techniques, an increasing number of researchers [15,16,17,18,19,20,21,22] have investigated the mechanical behavior of materials by developing material constitutive models and integrating them with numerical simulations. By employing the Crystal Plasticity Finite Element Method (CPFEM), this study aims to quantify the impact of individual elements and further investigate the deformation and fracture processes of materials at the mesoscopic scale. However, in traditional CPFEM studies, simulations only consider the stress–strain response within grains and ignore the influence of grain boundaries. Grain boundaries are typically the source of damage and microcrack initiation in polycrystalline materials. In this paper, the deformation behavior is simulated by combining the cohesive element with CPFEM, providing a method for simulating the crack propagation within grains. Based on the theory of crystal plasticity, Liu L.-Y. [23] established a novel two-dimensional microstructure model of graphene/polycrystalline metal composites. By combining the crystal plasticity finite element method (CPFEM) and the cohesive zone model (CZM), he revealed for the first time at the mesoscale the influence of graphene morphology and initial microcracks on the failure behavior and overall mechanical properties of graphene/Al. Shuyu Wang et al. [17] conducted crystal plasticity finite element (CPFE) simulations to investigate the tensile fracture behavior of CrMnFeCoNi HEA. Their results demonstrated that cracks initiate from stress concentrations and subsequently propagate along grain boundaries until final fracture. Moreover, random grain orientation was found to significantly influence both crack nucleation and propagation. Shuyu Wang et al. employed the crystal plasticity constitutive model and the cohesive constitutive model. These models are capable of accurately simulating the continuous variation in stress at grain boundaries, the occurrence of damage, and the initiation and propagation of cracks until the fracture of HEA under loading. Nevertheless, Shuyu Wang et al. did not conduct research on the tensile fracture of the columnar crystal model. As a result, they were unable to offer a viable crystal plasticity simulation study for the tensile fracture of PBF-LB/M CrMnFeCoNi HEA.
This study simulates the intergranular crack fracture behavior of PBF-LB/M CoCrFeNiMn HEA at the mesoscopic scale based on the crystal plastic finite element method (CPFEM) of dislocation slip mechanism, combined with the crystal plastic constitutive model and the cohesive force constitutive model. The crystal plasticity constitutive model describes the plastic and elastic deformation of the grains, while the cohesive constitutive model determines the damage and destruction of the grain boundaries by means of the bilinear traction separation law (TSL). This method enables the description of room temperature tensile fracture behavior of PBF-LB/M CoCrFeNiMn HEA, and the accuracy of the model is verified by comparing it with the tensile fracture stress–strain curve of Wang Fuchao [24]. This research further elucidates the influence of different columnar crystal morphologies on the mechanical properties and anisotropy of the CoCrFeNiMn HEA, as well as the influences of texture strength in crack initiation and propagation.
2. Modeling
2.1. Crystal Plastic Constitutive Model
The crystal deformation can be divided into two parts: elastic deformation and plastic deformation. The deformation gradient can be given by the following:
where represents the elastic deformation gradient, which is mainly caused by the small lattice deformation and the rigid body rotation under large deformation conditions. represents the plastic deformation gradient, which mainly depends on dislocation slip, twinning, and phase transition. The rate of the plastic deformation gradient is further related as follows:
where represents the shearing rate of the slip system, and and respectively represent the slip direction and the slip plane normal in the global coordinate.
The shear strain rate generated by the dislocation motion of each slip coefficient obeys an exponential relationship with the slip shear force:
where is a reference slip rate, n represents the strain rate sensitivity, represents the ability of slip system α to resist plastic deformation, and is the critical resolved shear stress of the slip system α. The slip resistance is associated with dislocations and can be expressed as:
where is the rate of change in slip resistance and is the hardening modulus between slip systems. When α = β, it indicates a self-hardening modulus; when α ≠ β, it indicates a latent hardening modulus. Pierce [25] proposed the specific hardening modulus to be expressed as follows:
where is the initial hardening modulus, is the cumulative shear strain over all slips, is the initial critical shear stress, is the saturated flow stress, and denotes the hardening parameter ratio, whose value is generally taken as 1~1.4.
2.2. Cohesive Constitutive Model
The cohesive model can effectively capture energy dissipation and stress state evolution during polycrystalline fracture. Additionally, it can be employed to represent grain boundaries between crystals, enabling the simulation of fracture processes in real polycrystalline materials. The cohesive constitutive model is defined through the bilinear traction separation law (TSL) to define it. The model can be divided into two distinct phases, as illustrated in Figure 1. The first phase corresponds to the linear elastic behavior of the cohesive element, where the curve slope is determined by the cohesive stiffness prior to material damage initiation. The second phase represents the linear softening behavior of the cohesive element following damage initiation, where the traction force reaches its peak value and the cohesive element begins to degrade.
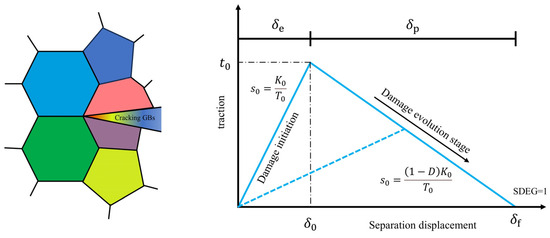
Figure 1.
The bilinear traction separation law of cohesive element.
The following relationship is satisfied between the separated displacements and strains of the cohesive elements:
where , , are the nodal displacements in the normal and orthogonal shear directions of the cohesive unit, respectively; , , are the strains in the normal and orthogonal shear directions of the cohesive unit, respectively; and is the initial thickness of the cohesive unit, which is generally taken to be 1.
Neglecting the coupling between tensile and shear deformation, the relationship between the traction force (t) applied to the cohesive element and its nominal strain (ε) can be described by an elastic stiffness matrix as follows:
where , , and are the traction forces in the n, s, and t directions, respectively. , , and are the initial stiffness in the three directions, respectively, and their relationship is defined as:
In the formula, E represents the elastic modulus; G is the shear modulus; and Tc is the initial geometric thickness of the cohesive element.
The initial slope of the traction separation law and the initial stiffness satisfy:
Figure 1 illustrates that the inflection point of the bilinear traction-separation response curve corresponds to the initial damage point of the cohesive element. In this study, the maximum strain damage criterion is employed to determine the initiation of damage in the cohesive element. The relationship can be expressed as follows:
where ‘< >’ is the Macaulay bracket and , , are the critical strains for damage initiation under pure tension and shear loading, respectively. Once the maximum strain damage criterion is satisfied, the cohesive element initiates damage evolution. During this process, the traction force gradually diminishes as the relative displacement of the cohesive element increases. Upon complete degradation (the traction force reaches zero), the cohesive element is eliminated from the simulation, corresponding microscopically to grain boundary fracture. The damage evolution of the cohesive element can be characterized by the following equation:
where represents the traction force of the cohesive unit prior to damage consideration, denotes the initial stiffness of the material, and is the cohesive element stiffness damage factor indicating the element softening degree with = 0 and = 1 representing the intact and fully failed, respectively. The expression for is given as follows:
where is the separation displacement at the initial damage of the cohesive unit and is the nodal displacement at the final fracture of the cohesive element.
2.3. HEA Finite Element Model
Research shows [26,27] that when the number of Voronoi polycrystalline grains exceeds 50, it no longer has a dependence on the number of grains. Li et al. [28] prepared three CoCrFeNiMn HEA samples via SLM. By adjusting SLM process parameters, including laser power, scanning speed, and layer thickness, they obtained samples with an average grain size of approximately 22 μm.
Based on the actual grain morphology and considering the computational accuracy and cost, representative volume elements (RVEs) of 80 Voronoi grains were generated in this study using the 2020 version of NNEPER software [29]. The RVE had a cubic spatial volume of 1 mm × 1 mm × 1 mm. Cohesive elements were employed to simulate the grain boundaries of the polycrystalline structure, as illustrated in Figure 2. The thickness of the cohesive unit is set at 0.001 mm. The grid cell types of the model grain boundaries and grains are C3D4 cells and COH3D6 cells, respectively.
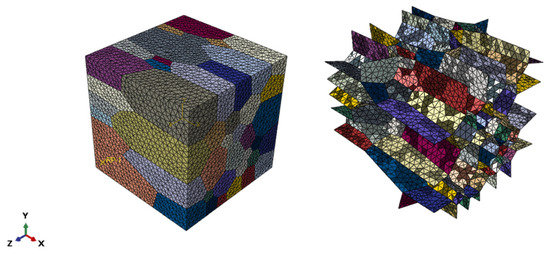
Figure 2.
CoCrFeNiMn HEA polycrystalline model grains and grain boundaries.
To avoid inaccurate simulation results caused by the rigid body displacement of the RVE model under loading during finite element analysis, appropriate constraints must be applied to the model. As shown in Figure 3, a coordinate system is established in the lower left corner, and the degrees of freedom in the X, Y, and Z directions are set to be U1, U2, and U3, respectively. Constraints are added to all nodes in the XOY plane: U3 = 0; to all nodes in the YOZ plane: U1 = 0; and to all nodes in the XOZ plane: U2 = 0. The reference point RP-1 is kinematically coupled to all nodes on its nearest XOY plane, and a tensile displacement load of U3 = 0.05 mm is applied at RP-1.
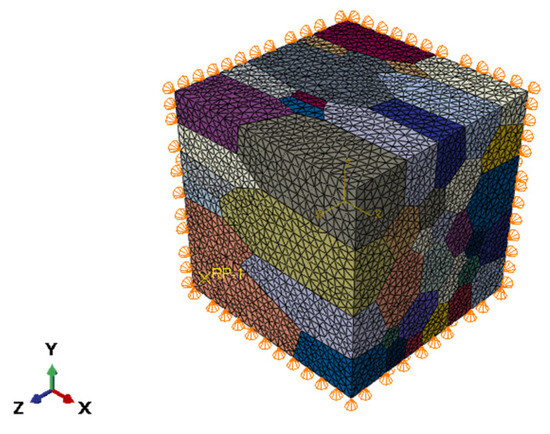
Figure 3.
HEA polycrystal model constraints and boundary conditions.
2.4. Determination of Parameters of HEA
According to the findings reported by Fang et al. [30], the three elastic constants of CoCrFeNiMn HEA polycrystals were determined as C11 = 264.6 GPa, C12 = 184.8 GPa, and C44 = 112.9 GPa. The material parameters required for the UMAT subroutine were obtained through finite element simulation of a CoCrFeNiMn HEA polycrystalline model, combined with stress–strain curve fitting based on tensile fracture experiments conducted by Wang et al. These parameters were automatically assigned to the corresponding elements via custom code. The key material properties include: elastic constants (C11, C12, C44), initial hardening modulus (H0), initial critical shear stress (τ0), saturated yield stress (τs), initial damage node displacement (δ0), failure node displacement (δf), and so on. Parameters all show varying degrees of influence on the mechanical properties of materials: H0 affects the slope of the plastic zone, τ0 can change the yield strength, γ0 and n affect the hardening process of the material, and the influence of τs is very small. The material parameters can be determined by the trial and error method in comparison with the experimentally obtained stress–strain curve fits, and the fitted material parameters are shown in Table 1.

Table 1.
CoCrFeNiMn HEA material parameters.
As shown in Figure 4, the stress–strain curves were obtained from the polycrystalline CoCrFeNiMn HEA model under tensile loading conditions. The green circular curve represents the experimental stress–strain curve from room-temperature tensile tests conducted by Wang et al. [24], while the red five-pointed star curve corresponds to the simulated curve. It can also be seen from Figure 4 that the stress–strain curve is divided into four stages. (1) The elastic stage. In Figure 4, the stress–strain in the simulated and experimental elastic stages shows a linear relationship. (2) The yielding stage. The critical stress at the beginning of the plastic yield stage was simulated to be approximately 398.4 MPa, while the stress obtained experimentally was 418.62 MPa. (3) Strain hardening stage. As the strain continues to increase, the model enters the hardening stage. TS obtained through simulation reached 639 MPa, and the EL was 16.7%. TS obtained through experiments was 641 MPa, and the EL was 16.8%. It indicates that the simulation results are accurate. (4) Fracture stage. The curve began to drop rapidly from its highest point, and the model broke. As shown in Figure 4, the experimental and simulation curves exhibit good agreement, confirming the validity of the constitutive model and material parameters presented in this study.
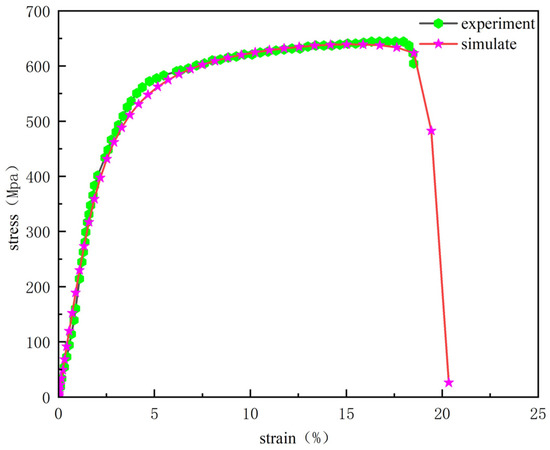
Figure 4.
Comparison of polycrystalline simulation results of CoCrFeNiMn HEA with experiments.
2.5. Polycrystalline Modeling of HEA with Different Grain Morphologies
The PBF-LB/M process characteristics will lead to columnar crystals along the building direction, and grain refinement can effectively improve the mechanical properties of the material. The CoCrFeNiMn HEA polycrystalline model with different columnar crystal morphology is generated by adjusting the average aspect ratio of the grains, and the average aspect ratios of the polycrystalline finite element model are (1, 0.2, 0.2), (1, 0.4, 0.4), and (1, 0.6, 0.6), as shown in Figure 5.

Figure 5.
RVE models for different grain morphologies: (a) (1, 0.2, 0.2); (b) (1, 0.4, 0.4); (c) (1, 0.6, 0.6).
2.6. Polycrystalline Modeling of HEA with Different Texture Strengths
The (1, 0.4, 0.4) polycrystalline model consisting of 80 grains is employed. Two sets of Euler angles with different texture strengths are generated by the 2019 version of MATLAB, and the polar plots of the initial states of the two texture configurations are plotted by MTEX 5.90 software, and the plotting results are shown in Figure 6. Following this, Python 3.12 code is utilized to assign the Euler angles of the two sets with different texture strengths to the representative volume cell and conduct the finite-element simulation of crystal plasticity.
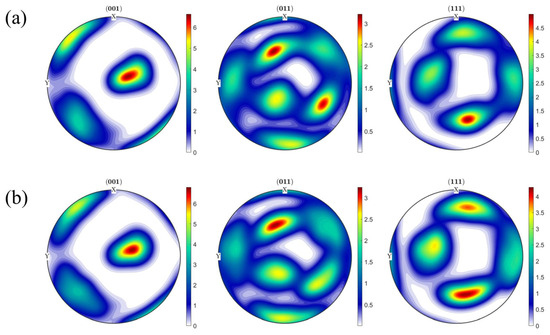
Figure 6.
Polar plots of the initial state of texture for two sets of polycrystalline models of HEA: (a) texture strength 1; (b) texture strength 2.
3. Results and Discussion
3.1. Tensile Simulation of Polycrystalline Models of HEA with Different Stretching Directions
The researchers observed that the PBF-LB/M-formed CoCrFeNiMn HEA exhibited distinct mechanical properties along the build and scanning directions. To investigate the underlying reasons for this anisotropy, single-tension simulations were conducted in different orientations. The grain boundary damage and grain stresses in different tensile directions were analyzed and simulated to obtain the stress cloud of the grains at 10% strain, as shown in Figure 7. The grain boundary region exhibits a more pronounced stress concentration phenomenon compared to the grain interior in the stress cloud diagram. This observation indicates that grain boundaries, serving as high-stress-bearing regions, can effectively accommodate deformation discrepancies between neighboring grains. In addition, different grain orientations and sizes, as well as coordinated deformation at grain boundaries, lead to significant differences in the distribution of grain stress states on both sides of the boundaries.
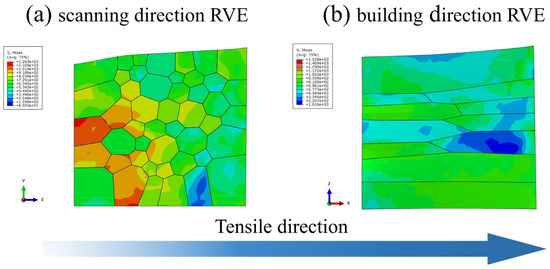
Figure 7.
Stress cloud at 10% strain: (a) scanning direction RVE; (b) building direction RVE.
The strain energy dissipation density (SDEG) criterion is employed to characterize grain boundary damage in the embedded cohesive elements. As illustrated in Figure 8, which depicts the SDEG values for grain boundary damage evolution under different tensile directions at 10% strain, it can be observed that only a small fraction of grain boundaries initiate damage at this stage, while the majority remain undamaged. At the same strain level, grain boundary damage along the scanning direction is significantly more severe than that along the building direction. In addition, grain boundary damage mostly occurs in the intersection region of multiple grain boundaries, which is due to the deformation and stress concentration in the region of multiple grain boundaries during the process of grain slip.
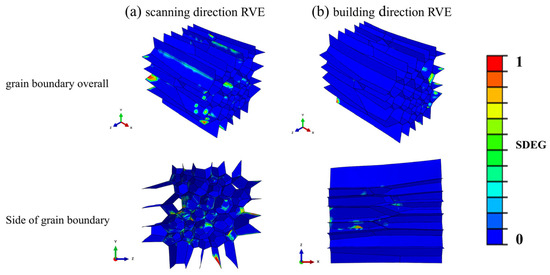
Figure 8.
Damage cloud at 10% strain at grain boundary: (a) scanning direction RVE; (b) building direction RVE.
Displacement loads were applied along both the scanning direction and the building direction of the CoCrFeNiMn HEA polycrystalline model (RVE-(1, 0.2, 0.2)) to obtain stress–strain curves under different tensile orientations, as illustrated in Figure 9a. As shown in Figure 9a, no significant difference is observed between the scanning direction and the building direction in the elastic phase. However, upon fracture, the building direction exhibits superior fracture strength and toughness. These findings align with the experimental results, confirming the validity of the polycrystalline model. The simulated polycrystalline model of the CoCrFeNiMn HEA exhibits significant anisotropy. As illustrated in Figure 9b, the YS are 436.9 MPa (scanning direction) and 484.7 MPa (building direction), while the TS reach 639 MPa and 702.5 MPa, respectively. The corresponding ELs are 10.6% and 21.8%. This difference in properties is mainly due to the ‘top-down’ heat transfer characteristic of PBF-LB/M, which leads to the generation of columnar crystals along the building direction, resulting in better mechanical properties in the deposition direction than in the scanning direction [31].
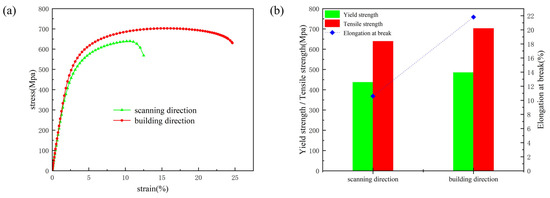
Figure 9.
CoCrFeNiMn HEA polycrystalline model building direction vs. scanning direction: (a) tensile stress–strain curve; (b) comparison of mechanical properties.
3.2. Tensile Simulation of Polycrystalline Models of HEA with Different Grain Morphologies
Load displacements were applied along the scanning and building directions of CoCrFeNiMn HEA polycrystalline models with average aspect ratios of (1, 0.2, 0.2), (1, 0.4, 0.4), and (1, 0.6, 0.6), respectively. This was conducted to obtain stress–strain curves for polycrystalline models with varying grain morphologies under different tensile orientations and to investigate the influence of columnar-to-equiaxed grain transition on the anisotropy of PBF-LB/M CoCrFeNiMn HEA. The stress–strain curves of all three polycrystalline models show significant anisotropy, which is consistent with the experimental results and proves that the simulation results are reliable. The results show that the YSs in the scanning direction and building direction of the polycrystalline model with an average aspect ratio (1, 0.4, 0.4) are 398.4 MPa and 433 MPa, the TSs are 639 MPa and 677.8 MPa, and the EL rates are 16.7% and 21.6%, respectively; the YSs in the scanning direction and building direction of the polycrystalline model with average aspect ratio (1, 0.6, 0.6) are 395 MPa and 430 MPa, and the TSs are 633.78 MPa and 684 MPa, with EL rates of 17.2% and 20.3%, respectively, as shown in Figure 10a.
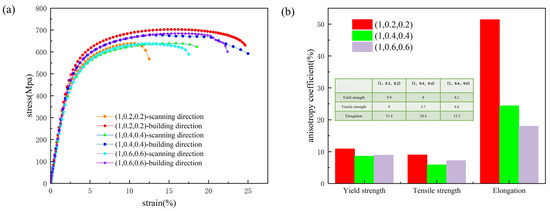
Figure 10.
Polycrystalline models of three different morphologies of HEA: (a) tensile stress–strain curves; (b) comparison of mechanical properties.
Moreover, the (1, 0.2, 0.2) polycrystalline model does not exhibit a significant strength enhancement compared to (1, 0.4, 0.4), indicating that aspect ratios have a diminishing influence on strength but a more pronounced effect on post-fracture elongation. This is due to the gradual equiaxialization of the grains; the random orientation of the equiaxial crystals and the uniform distribution of grain boundaries make the dislocations in the traverse orientation of different grains by the grain boundary obstruction and the formation of dislocation plugging to promote the effect of work hardening and effectively improve the plasticity of the material. It is also found that the (1, 0.6, 0.6) polycrystalline model is not very different compared to the (1, 0.4, 0.4) polycrystalline model, suggesting that the effect of column-crystal equiaxialization on the material diminishes after a certain point.
The anisotropy coefficients of YS, TS, and EL at break for the polycrystalline model with RVE-(1, 0.2, 0.2) are 9.9%, 9%, and 51.4%, respectively, while those for the model with RVE-(1, 0.6, 0.6) are 8.1%, 6.8%, and 15.3%, respectively. Compared to the (1, 0.2, 0.2) model, the anisotropy coefficients for yield strength, tensile strength, and elongation at break in the (1, 0.6, 0.6) model are reduced by 1.8%, 2.2%, and 36.1%, respectively, as shown in Figure 10b. This indicates that columnar crystal equiaxialization can effectively reduce the anisotropy of the CoCrFeNiMn HEA. However, comparing RVE-(1, 0.4, 0.4) with RVE-(1, 0.6, 0.6) reveals that there is not much difference in the anisotropy coefficients, suggesting that the effect of columnar crystal equiaxialization on the anisotropy is also weakened after reaching a certain level. This is because the grain growth rate in the x-direction of RVE-(1, 0.2, 0.2) is 5 times faster than that in the y and z directions, which is significantly higher than the 2.5 times of RVE-(1, 0.4, 0.4) and the 1.67 times of RVE-(1, 0.6, 0.6). Since the growth rates of RVE-(1, 0.4, 0.4) and RVE-(1, 0.6, 0.6) are similar, RVE-(1, 0.6, 0.6) does not significantly improve the material properties compared with RVE-(1, 0.4, 0.4).
3.3. Tensile Simulation of Polycrystalline Models of HEA with Different Texture Strengths
While keeping all other parameters of the CoCrFeNiMn HEA polycrystalline model constant, only the initial crystallographic texture was altered to investigate its influence on crack initiation and propagation during tensile fracture. Figure 11 shows the simulation results of tensile fracture for two different texture strengths. As can be seen from Figure 11, the two different texture strength polycrystalline models have different locations of crack initiation and extension, and there is a significant difference in the location of fracture; for example, the location of cracks in the polycrystalline model of texture strength 1 does not occur in the polycrystalline model of texture strength 2 fracture phenomenon.
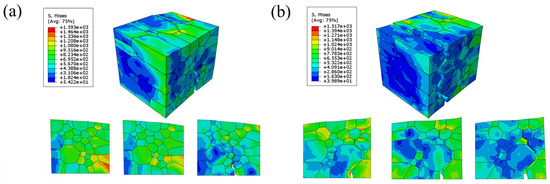
Figure 11.
Simulation results of tensile fracture: (a) texture strength 1; (b) texture strength 2.
It can be observed from Figure 11 that crack initiation first occurs at the stress concentration point. With further increase in strain, the stress at the crack tip becomes more concentrated compared to other regions. The crack subsequently propagates along the grain boundaries, ultimately resulting in fracture.
Further analysis of SDEG with varying texture strengths demonstrated that differences in texture strength influence the crack initiation sites and final fracture locations in polycrystalline models. Figure 12 shows the results of grain boundary damage. At different stages of the two texture strengths, the grain boundary unit is deleted to represent the fracture of the grain boundary, and the different fracture locations of the two polycrystalline models can be clearly observed in the figure. In the polycrystalline model at texture strength 1, the cohesive element at position 1 has been deleted and the grain boundaries here have undergone fracture behavior, but at the same position at texture strength 2, the grain boundaries have undergone little damage. In the polycrystalline model with texture strength 1, grain boundary damage is also observed at position 2; however, the damage variable D does not attain a value of 1, suggesting that fracture behavior does not occur at this boundary. In contrast, for the model with texture strength 2, the cohesive element at the same position is deleted, indicating that the damage variable D reaches 1 and fracture initiates. These results demonstrate that variations in texture strength influence the crack initiation site during tensile fracture in polycrystalline materials.
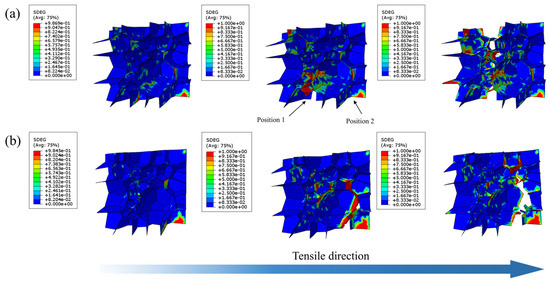
Figure 12.
SDEG simulation results for different stages of grain boundary: (a) texture strength 1; (b) texture strength 2.
Figure 13a shows the stress–strain curves for tensile fracture of two different texture polycrystalline models, and there is no significant difference between the two sets of curves in the elastic phase. The YS, TS, and EL of texture strength 1 are 447.6 Mpa, 688.7 Mpa, and 11.7%, respectively, and the YS, TS, and EL of texture strength 2 are 418.5 Mpa, 639 Mpa, and 16.7%, respectively, as shown in Figure 13b. It indicates that different texture strengths not only affect the crack initiation and extension at the grain boundaries but also affect the macroscopic mechanical response of polycrystals.
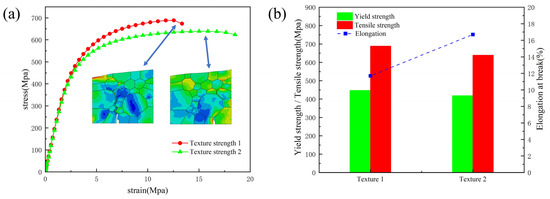
Figure 13.
Different texture polycrystalline models: (a) tensile stress–strain curves; (b) comparison of mechanical properties.
4. Conclusions
In this paper, the tensile fracture behavior of CoCrFeNiMn HEA is studied from the micro-scale by means of crystal plasticity finite element theory and cohesive unit, and the main conclusions are as follows:
- (1)
- The stress–strain response of CoCrFeNiMn HEA at tensile fracture was effectively simulated using a combined crystal plastic constitutive model and cohesive constitutive model.
- (2)
- Simulations along different tensile directions show that the grain boundary damage of the material is different in different tensile directions, and there is more grain boundary damage in the scanning direction than in the building direction, which shows the material anisotropy. In addition, the stress concentration occurs at grain boundaries first and builds up at the intersection of multiple grain boundaries, which leads to cracks sprouting and expanding at the intersection of multiple grain boundaries.
- (3)
- With the equiaxialization of the columnar crystals, the elongation of the polycrystalline model increases from 10.6% to 17.2% in the scanning direction, decreases from 21.8% to 20.3% in the building direction, and decreases the anisotropy coefficients of YS, TS, and EL by 1.8%, 2.2%, and 36.1%, respectively. In addition, the effect on anisotropy diminishes after a certain degree of equiaxialization of columnar crystals.
- (4)
- Different texture strengths significantly affect the crack initiation and extension of CoCrFeNiMn HEA, as well as the macroscopic mechanical response of the polycrystalline model.
This study presents a finite element model of crystal plasticity that can be used in additive manufacturing to investigate the influence of a single factor (such as tensile direction, crystal texture, grain morphology, etc.) on material properties. This method reduces the overall cost of conducting expensive experiments and provides a reliable approach.
Author Contributions
Conceptualization, L.W. and W.D.; methodology, L.W. and W.D.; software, S.Z. and X.Y.; validation, W.L., X.S. and Y.Z.; formal analysis, L.W. and W.D.; investigation, L.W.; resources, J.Z.; data curation, L.W. and W.D.; writing—original draft preparation, L.W.; writing—review and editing, W.D.; visualization, L.W., W.D. and J.Z.; supervision, S.Z., X.Y., W.L., X.S. and Y.Z.; project administration, W.D.; funding acquisition, W.D. All authors have read and agreed to the published version of the manuscript.
Funding
The authors acknowledge the funding supported by the National Natural Science Foundation of China (Wei Duan; Grant No. 52175359) and the China Postdoctoral Science Foundation (Wei Duan; Certificate Number: 2023M743281).
Data Availability Statement
The original contributions presented in this study are included in the article. Further inquiries can be directed to the corresponding author.
Conflicts of Interest
The authors declare no conflicts of interest.
References
- Yeh, J.W.; Chen, S.K.; Lin, S.J.; Gan, J.Y.; Chin, T.S.; Shun, T.T.; Tsau, C.H.; Chang, S.Y. Nanostructured high-entropy alloys with multiple principal elements: Novel alloy design concepts and outcomes. Adv. Eng. Mater. 2004, 6, 299–303. [Google Scholar] [CrossRef]
- Wang, P.; Huang, P.; Ng, F.L.; Sin, W.J.; Lu, S.; Nai, M.L.S.; Dong, Z.; Wei, J. Additively manufactured CoCrFeNiMn high-entropy alloy via pre-alloyed powder. Mater. Des. 2019, 168, 107576. [Google Scholar]
- Vaidya, M.; Pradeep, K.; Murty, B.; Wilde, G.; Divinski, S. Bulk tracer diffusion in CoCrFeNi and CoCrFeMnNi high entropy alloys. Acta Mater. 2018, 146, 211–224. [Google Scholar] [CrossRef]
- Butler, T.M.; Weaver, M.L. Oxidation behavior of arc melted AlCoCrFeNi multi-component high-entropy alloys. J. Alloys Compd. 2016, 674, 229–244. [Google Scholar] [CrossRef]
- Stepanov, N.; Tikhonovsky, M.; Yurchenko, N.; Zyabkin, D.; Klimova, M.; Zherebtsov, S.; Efimov, A.; Salishchev, G. Effect of cryo-deformation on structure and properties of CoCrFeNiMn high-entropy alloy. Intermetallics 2015, 59, 8–17. [Google Scholar] [CrossRef]
- Laplanche, G.; Kostka, A.; Horst, O.; Eggeler, G.; George, E. Microstructure evolution and critical stress for twinning in the CrMnFeCoNi high-entropy alloy. Acta Mater. 2016, 118, 152–163. [Google Scholar] [CrossRef]
- Zhou, Z.; Ji, C.; Hou, D.; Jiang, S.; Yang, Z.; Dong, F.; Liu, S. Study on Mechanical Properties of Nanopores in CoCrFeMnNi High-Entropy Alloy Used as Drug-Eluting Stent. Materials 2024, 17, 3314. [Google Scholar] [CrossRef]
- Brif, Y.; Thomas, M.; Todd, I. The use of high-entropy alloys in additive manufacturing. Scr. Mater. 2015, 99, 93–96. [Google Scholar] [CrossRef]
- Jumaev, E.; Abbas, M.A.; Mun, S.C.; Song, G.; Hong, S.-J.; Kim, K.B. Nano-scale structural evolution of quaternary AlCrFeNi based high entropy alloys by the addition of specific minor elements and its effect on mechanical characteristics. J. Alloys Compd. 2021, 868, 159217. [Google Scholar] [CrossRef]
- Dilshodbek, Y.; Hong, S.H.; Abbas, M.A.; Kang, G.C.; Park, H.J.; Jumaev, E.; Wang, W.-M.; Kim, K.B. Evolution of microstructure and mechanical characteristics of (CrFeNiCu) 100–x Ti x high-entropy alloys. Rare Met. 2023, 42, 3088–3098. [Google Scholar]
- Gu, X.H.; Lu, T.; Zhang, T.; Guo, W.; Pan, Y.; Dai, T. Anisotropy of microstructures and mechanical properties in FeCoNiCr0.5 high-entropy alloy prepared via selective laser melting. Rare Met. 2022, 41, 2047–2054. [Google Scholar] [CrossRef]
- Kim, Y.K.; Choe, J.; Lee, K.A. Selective laser melted equiatomic CoCrFeMnNi high-entropy alloy: Microstructure, anisotropic mechanical response, and multiple strengthening mechanism. J. Alloys Compd. 2019, 805, 680–691. [Google Scholar] [CrossRef]
- Ng, C.H.; Bermingham, M.J.; Dargusch, M.S. Controlling grain size, morphology and texture in additively manufactured β-titanium alloy with super transus hot isostatic pressing. Addit. Manuf. 2022, 59, 103176. [Google Scholar] [CrossRef]
- Dolzhenko, A.; Tikhonova, M.; Kaibyshev, R.; Belyakov, A. Microstructures and mechanical properties of steels and alloys subjected to large-strain cold-to-warm deformation. Metals 2022, 12, 454. [Google Scholar] [CrossRef]
- Cai, W.; Sun, C.; Wang, C.; Qian, L.; Li, Y.; Fu, M.W. Modelling of the intergranular fracture of TWIP steels working at high temperature by using CZM–CPFE method. Int. J. Plast. 2022, 156, 103366. [Google Scholar] [CrossRef]
- Yin, L.W.; Umezawa, O. Crystal plasticity analysis of temperature-sensitive dwell fatigue in Ti-6Al-4V titanium alloy for an aero-engine fan disc. Int. J. Fatigue 2022, 156, 106688. [Google Scholar] [CrossRef]
- Wang, S.Y.; Song, S.; Lu, X.C. Tensile Fracture Behavior of the CrMnFeCoNi High Entropy Alloy: A Crystal Plasticity Finite Element Simulation. J. Mech. Eng. 2021, 57, 43–51. (In Chinese) [Google Scholar]
- Tong, X.; Wang, Y.; Li, Y.; Fu, M. Grain size effect analysis of progressive meso-scaled forming aided by coupled Eulerian-Lagrangian approach and CPFEM. J. Manuf. Process. 2025, 152, 666–683. [Google Scholar] [CrossRef]
- Long, X.; Chong, K.; Su, Y.; Chang, C.; Zhao, L. Meso-scale low-cycle fatigue damage of polycrystalline nickel-based alloy by crystal plasticity finite element method. Int. J. Fatigue 2023, 175, 107778. [Google Scholar] [CrossRef]
- Zhang, X.; Lu, X.; Zhao, J.; Kan, Q.; Li, Z.; Kang, G. Temperature effect on tensile behavior of an interstitial high entropy alloy: Crystal plasticity modeling. Int. J. Plast. 2022, 150, 103201. [Google Scholar] [CrossRef]
- Lakshmanan, A.; Luo, J.; Javaheri, I.; Sundararaghavan, V. Three-dimensional crystal plasticity simulations using peridynamics theory and experimental comparison. Int. J. Plast. 2021, 142, 102991. [Google Scholar] [CrossRef]
- Liu, L.-Y.; Yang, Q.-S.; Liu, X.; Nian, X.-C. Crystal cracking of grain-gradient aluminum by a combined CPFEM-CZM method. Eng. Fract. Mech. 2021, 242, 107507. [Google Scholar] [CrossRef]
- Liu, L.Y.; Yang, Q.S.; Liu, X.; Shang, J.J. Modeling damage evolution of graphene/aluminum composites considering crystal cracking and interface failure. Compos. Struct. 2021, 267, 113863. [Google Scholar] [CrossRef]
- Wang, F.C. Optimization of Forming Process and Characterization of CoCrFeNiMn High Entropy Alloy Fabricated by Selective Laser Melting. Master’s Thesis, Huazhong University of Science and Technology, Wuhan, China, 2019. (In Chinese). [Google Scholar]
- Peirce, D.; Asaro, R.; Needleman, A. An analysis of nonuniform and localized deformation in ductile single crystals. Acta Metall. Sin. 1982, 30, 1087–1119. [Google Scholar] [CrossRef]
- Lu, X.; Zhao, J.; Yu, C.; Li, Z.; Kan, Q.; Kang, G.; Zhang, X. Cyclic plasticity of an interstitial high-entropy alloy: Experiments, crystal plasticity modeling, and simulations. J. Mech. Phys. Solids 2020, 142, 103971. [Google Scholar] [CrossRef]
- Lim, H.; Battaile, C.C.; Bishop, J.E.; Foulk, J.W., III. Investigating mesh sensitivity and polycrystalline RVEs in crystal plasticity finite element simulations. Int. J. Plast. 2019, 121, 101–115. [Google Scholar] [CrossRef]
- Li, W.; Huang, Y.Y.; Xie, Z.H.; Chen, H.; Li, W.; Liu, B.; Wang, B. Mechanical property and cellular structure of an additive manufactured FeCoNiCrMo0. 2 high-entropy alloy at high-velocity deformation. J. Mater. Sci. Technol. 2023, 139, 156–166. [Google Scholar] [CrossRef]
- Quey, R.; Dawson, P.R.; Barbe, F. Large-scale 3D random polycrystals for the finite element method: Generation, meshing and remeshing. Comput. Methods Appl. Mech. Eng. 2011, 200, 1729–1745. [Google Scholar] [CrossRef]
- Du Plessis, A.; Macdonald, E. Hot isostatic pressing in metal additive manufacturing: X-ray tomography reveals details of pore closure. Addit. Manuf. 2020, 34, 101191. [Google Scholar] [CrossRef]
- Xiong, Y.; Zhang, F.; Dai, T.; Shang, C.; Wan, Q. Crystal growth mechanism and mechanical properties of Ti-6Al-4 V alloy during selective laser melting. Mater. Charact. 2022, 194, 112455. [Google Scholar] [CrossRef]
Disclaimer/Publisher’s Note: The statements, opinions and data contained in all publications are solely those of the individual author(s) and contributor(s) and not of MDPI and/or the editor(s). MDPI and/or the editor(s) disclaim responsibility for any injury to people or property resulting from any ideas, methods, instructions or products referred to in the content. |
© 2025 by the authors. Licensee MDPI, Basel, Switzerland. This article is an open access article distributed under the terms and conditions of the Creative Commons Attribution (CC BY) license (https://creativecommons.org/licenses/by/4.0/).