Article

Development of a TaN-Ce Machine Learning Potential and Its Application to Solid–Liquid Interface Simulations

1
National Key Laboratory of Particle Transport and Separation Technology, Tianjin 300180, China
2
Research Institute of Physics and Chemistry Engineering of Nuclear Industry, Tianjin 300180, China
3
State Key Laboratory of Cemented Carbide, College of Materials Science and Engineering, Hunan University, Changsha 410082, China
*
Author to whom correspondence should be addressed.
Metals 2025, 15(9), 972; https://doi.org/10.3390/met15090972 (registering DOI)
Submission received: 26 July 2025 / Revised: 23 August 2025 / Accepted: 24 August 2025 / Published: 30 August 2025

Abstract

This study develops a machine learning potential (MLP) based on the Moment Tensor Potential (MTP) method for the TaN-Ce system. This potential is employed to investigate the interfacial structure and wetting behavior between liquid Ce and solid TaN. Molecular dynamics (MDs) simulations reveal that liquid Ce exhibits significant wetting on the TaN surface at high temperatures. The interfacial region undergoes pre-melting and component interdiffusion, forming an amorphous transition layer. Nitrogen atoms display high diffusivity, leading to surface mass loss, while tantalum atoms demonstrate excellent thermal stability and penetration resistance. These findings provide theoretical support for the design of interfacial materials and corrosion control in high-temperature metallurgy.

1. Introduction

Cerium (Ce), as one of the most abundant rare-earth elements, plays a vital role in high-temperature metallurgy and new material development. Its unique 4f electron behavior, exhibiting both localized and delocalized characteristics, endows it with a series of distinctive physicochemical properties under varying temperature and pressure conditions [1,2,3]. High-temperature purification processes, e.g., zone melting, are widely employed in the metallurgy of Ce [4]. However, liquid Ce undergoes significant interactions with crucible materials, severely impacting the purity of the melt and the service life of the crucible.
Transition metal carbides and nitrides, particularly those of Group IV and V elements, typically possess high melting points, high hardness, and good metallic properties. For instance, depositing uniform and dense carbide or nitride coatings onto substrate surfaces can effectively enhance their resistance to thermal shock and high-temperature corrosion [5,6,7]. Among numerous candidate materials, NaCl-type TaN, with its exceptionally high melting point (~3090 °C), outstanding thermal stability, and excellent thermal shock resistance, is considered a highly promising crucible material. Consequently, gaining a deep understanding of the interfacial interaction mechanisms between liquid Ce and TaN holds significant theoretical and practical importance. Previous studies have shown that the wetting behavior of liquid Ce can be modulated by controlling the microstructure of tantalum and its oxide surfaces. For example, Hu et al. demonstrated that laser-induced surface microstructures can significantly enhance the wettability of liquid Ce on Ta substrates [8]. Naidich et al. observed strong adhesion between liquid Ce and graphite, exhibiting a small contact angle [9]. Nevertheless, the wetting and corrosion behavior of liquid Ce on nitride ceramic surfaces, such as TaN, still lacks investigation.
Constrained by the limitations of high-temperature environments, traditional experimental methods face significant challenges in studying the microscopic behavior of solid–liquid interfaces. Molecular dynamics (MDs) simulation, as an effective tool for capturing material interface evolution processes at the atomic scale, has been widely applied to the study of high-temperature interfacial phenomena [10,11,12,13,14,15,16]. Sun et al. investigated the wettability of liquid lithium on different tungsten surfaces [17]. Chen et al. observed anisotropic wetting expansion behavior during precursor film formation on copper surfaces [15]. Yang et al. studied the solid–liquid interface structures of Al-Pb, Cu-Pb, and Ta-Cu systems, revealing ordered layered characteristics in the interfacial liquid phase [18,19,20]. Moreover, we developed machine learning potentials for the Ce-Ti and Ce-Ta binary systems and systematically studied the wetting and corrosion behavior of liquid Ce on Ti and Ta surfaces [21].
Hence, in the present work, we developed a machine learning potential suitable for the TaN-Ce solid–liquid interface. After that, we investigate the wetting behavior and interfacial evolution processes of liquid Ce on TaN surfaces, revealing the underlying atomic diffusion, structural reconstruction, and corrosion mechanisms.

2. Methodologies

2.1. MLP Model and Training Set Preparation

In this study, a Moment Tensor Potential (MTP) tailored for the TaN-Ce system was constructed within the MLIP-2 framework [22]. The total energy is expressed as a sum over atomic contributions:
E m t p c f g = i = 1 n V n i
where each atomic energy depends on the local atomic environment defined by the species of central atom and the positions and species of neighboring atoms within a 5.0 Å cutoff. The functional form is expanded as follows:
V n i = α ξ α B α n i
where ξ = ξ α represents the fitted coefficients and B α is a set of basis functions constructed from moment-tensor descriptors up to a level of 16, yielding 222 linear parameters that were optimized against a first-principles training set. The training objective is formulated as the following least-squares problem:
k = 1 K   w e E m t p c fg k ; θ E q m c f g k 2 + w f i = 1 N k   f i m t p c f g k ; θ f i q m c f g k 2 + w s σ m t p c f g k ; θ σ q m c f g k 2 m i n θ  
where w e = 1.0 eV−2, w f = 0.01 Å2 eV−2, and w s = 0.001 Å6 eV−2 are the weights for energy, force, and stress components, respectively, ensuring that energy and force accuracy are prioritized. The training workflow is illustrated in Figure 1.
To guarantee broad configurational coverage and robust extrapolation, the training set was assembled from five complementary sources as shown below, totaling 5667 structures.
[1]
Bulk distortions: Equilibrium and strained configurations of Ce (fcc, bcc, γ-Ce) and δ-TaN (NaCl type) were generated by isotropic scaling (0.78–1.20) combined with random strains up to 3% and random atomic displacements ≤ 0.03 Å.
[2]
High-temperature ab initio molecular dynamics (AIMD) sampling: AIMD trajectories for Ce and TaN were collected at 1000–1500 K. Frames were down-selected using SOAP (Smooth Overlap of Atomic Positions) descriptors and farthest-point sampling (FPS) to avoid redundancy.
[3]
Surface slabs: TaN(001), (110), and (111) slabs with both Ta- and N-terminations were relaxed and then perturbed as in step (1).
[4]
Solid–liquid interfaces: Slabs of TaN in contact with liquid Ce were equilibrated at 1400–1500 K via AIMD. Representative snapshots were again selected via SOAP + FPS.
[5]
Substitution configurations: Additional structures were included in which Ce substitutes Ta or N, and vice versa, to enhance coverage of off-stoichiometric and defective environments.
All datasets were computed with VASP code using the PBE-GGA functional [23,24,25]. A plane-wave cutoff of 520 eV was employed, and the total energy was converged to 10−5 eV. Γ-centered k-meshes were chosen to ensure convergence to <1 meV atom−1 with respect to k-point density. The relativistic effects and the associated spin-orbit coupling were not considered. All AIMD simulations in this work were performed using the VASP within the Born–Oppenheimer Molecular Dynamics (BOMDs) framework.

2.2. MD Settings

All MD simulations in this study were carried out using the LAMMPS software package (version: 2020 Mar3) [26]. The simulation time step was uniformly set to 1 fs. Temperature was controlled via the Nosé–Hoover thermostat with a relaxation time of 0.1 ps, and pressure was regulated using the Andersen barostat with a relaxation time of 1.0 ps. Periodic boundary conditions were applied in all three dimensions. The construction of the interface model between liquid Ce and solid TaN is illustrated in Figure 2, and the detailed modeling procedure is described as follows:
[1]
The initial TaN structure was first relaxed under the NPT ensemble at the target temperature for 500 ps, allowing the system to reach equilibrium lattice parameters and in-plane dimensions.
[2]
The liquid Ce phase was simulated under an NPzAT ensemble, enabling free expansion or compression along the z-axis while fixing the x- and y-dimensions to match the in-plane parameters obtained from the first step. This ensured geometric compatibility between the two phases at the interface.
[3]
The equilibrated TaN and Ce structures were then joined along the z-direction, leaving a vacuum gap of ~2.0 Å between them to prevent nonphysical initial contacts. The resulting interfacial model was further relaxed using the NPzAT ensemble for 3.0 ns to observe interfacial structural evolution and elemental interdiffusion.
Table 1 summarizes the structural parameters of two typical TaN(001)/Ce and TaN(111)/Ce interface models under 1400 K, in which the total numbers of Ta and Ce atoms were controlled to be of comparable magnitude to ensure mass balance and enable comparative analysis.
In the wetting simulations, initial TaN surface models were constructed and subsequently combined with a liquid Ce droplet. To eliminate artificial interactions under periodic boundary conditions, the lateral dimensions of the TaN substrate were designed to be significantly larger than the projected area of the Ce droplet, ensuring sufficient spacing during wetting and spreading. At 1400 K, the TaN substrate was equilibrated under the NPT ensemble for 40 ps. After thermal equilibration, the Ce droplet was positioned above the substrate along the z-axis, separated by a 2.0 Å vacuum layer to avoid unrealistic initial overlap. Moreover, the bottom two atomic layers of TaN were fixed to mimic a rigid substrate. Subsequently, the entire system was relaxed for 1 ns under the NVT ensemble.

3. Results and Discussions

3.1. Accuracy and Error Analysis

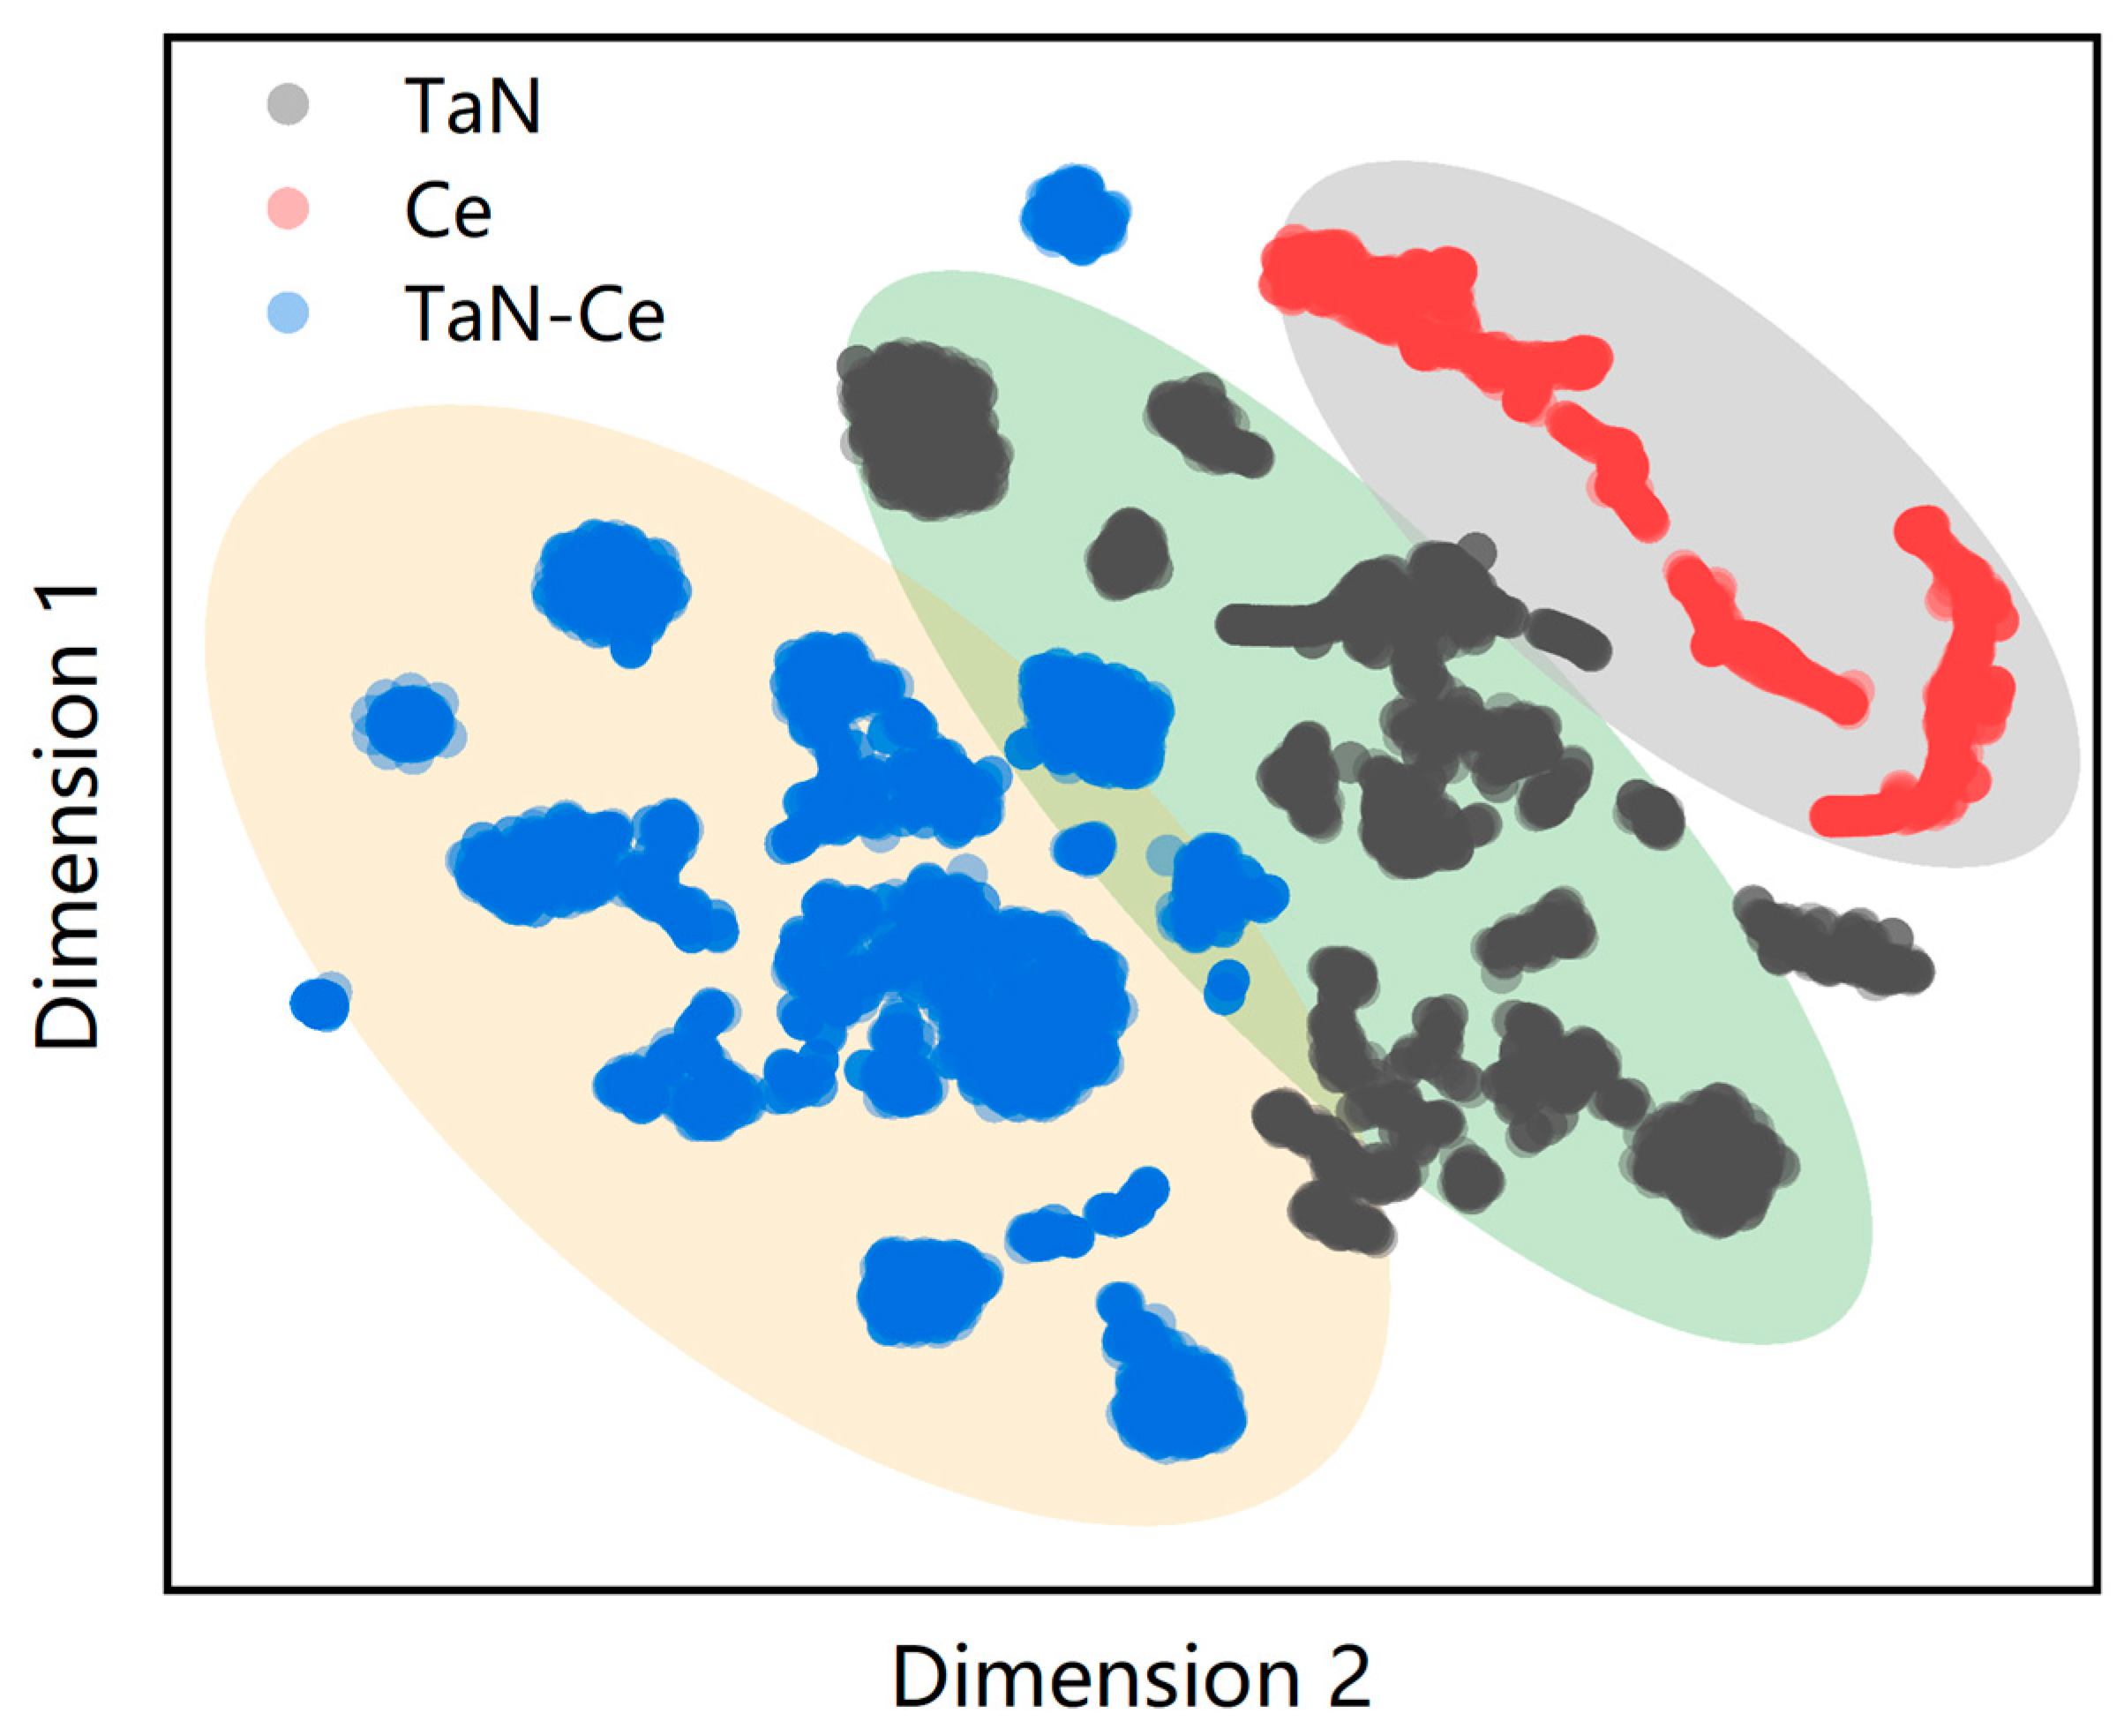
To comprehensively evaluate the structural diversity and connectivity of the constructed training set in feature space, the t-distributed stochastic neighbor embedding (t-SNE) technique was employed for dimensionality reduction and visualization. This widely used nonlinear dimensionality reduction method effectively preserves local structural relationships in high-dimensional data. Additionally, the similarity between local atomic environments was quantified using the SOAP kernel, and dimensionality reduction was performed via the ASAP software package v1.0 [27]. Each local atomic environment in the training set was projected into a two-dimensional space, where the distance between data points reflects structural dissimilarity in the original high-dimensional space. Due to the local structure-preserving nature of t-SNE, physically similar atomic environments remain spatially clustered after projection, thereby enabling insight into local structure similarities and their distribution patterns in crystalline materials.
As shown in Figure 3, all local atomic environments from the training set are mapped onto a two-dimensional space. The analysis reveals that configurations of pure TaN and pure liquid Ce are clustered, respectively, in the central green and upper-right regions, while solid–liquid interfacial configurations are primarily located in the lower-left yellow region, indicative of their transitional structural nature. Additionally, several chain-like clusters were observed, mainly corresponding to structural samples from volumetric scaling. These results demonstrate that the constructed dataset exhibits excellent structural coverage and continuity in feature space.
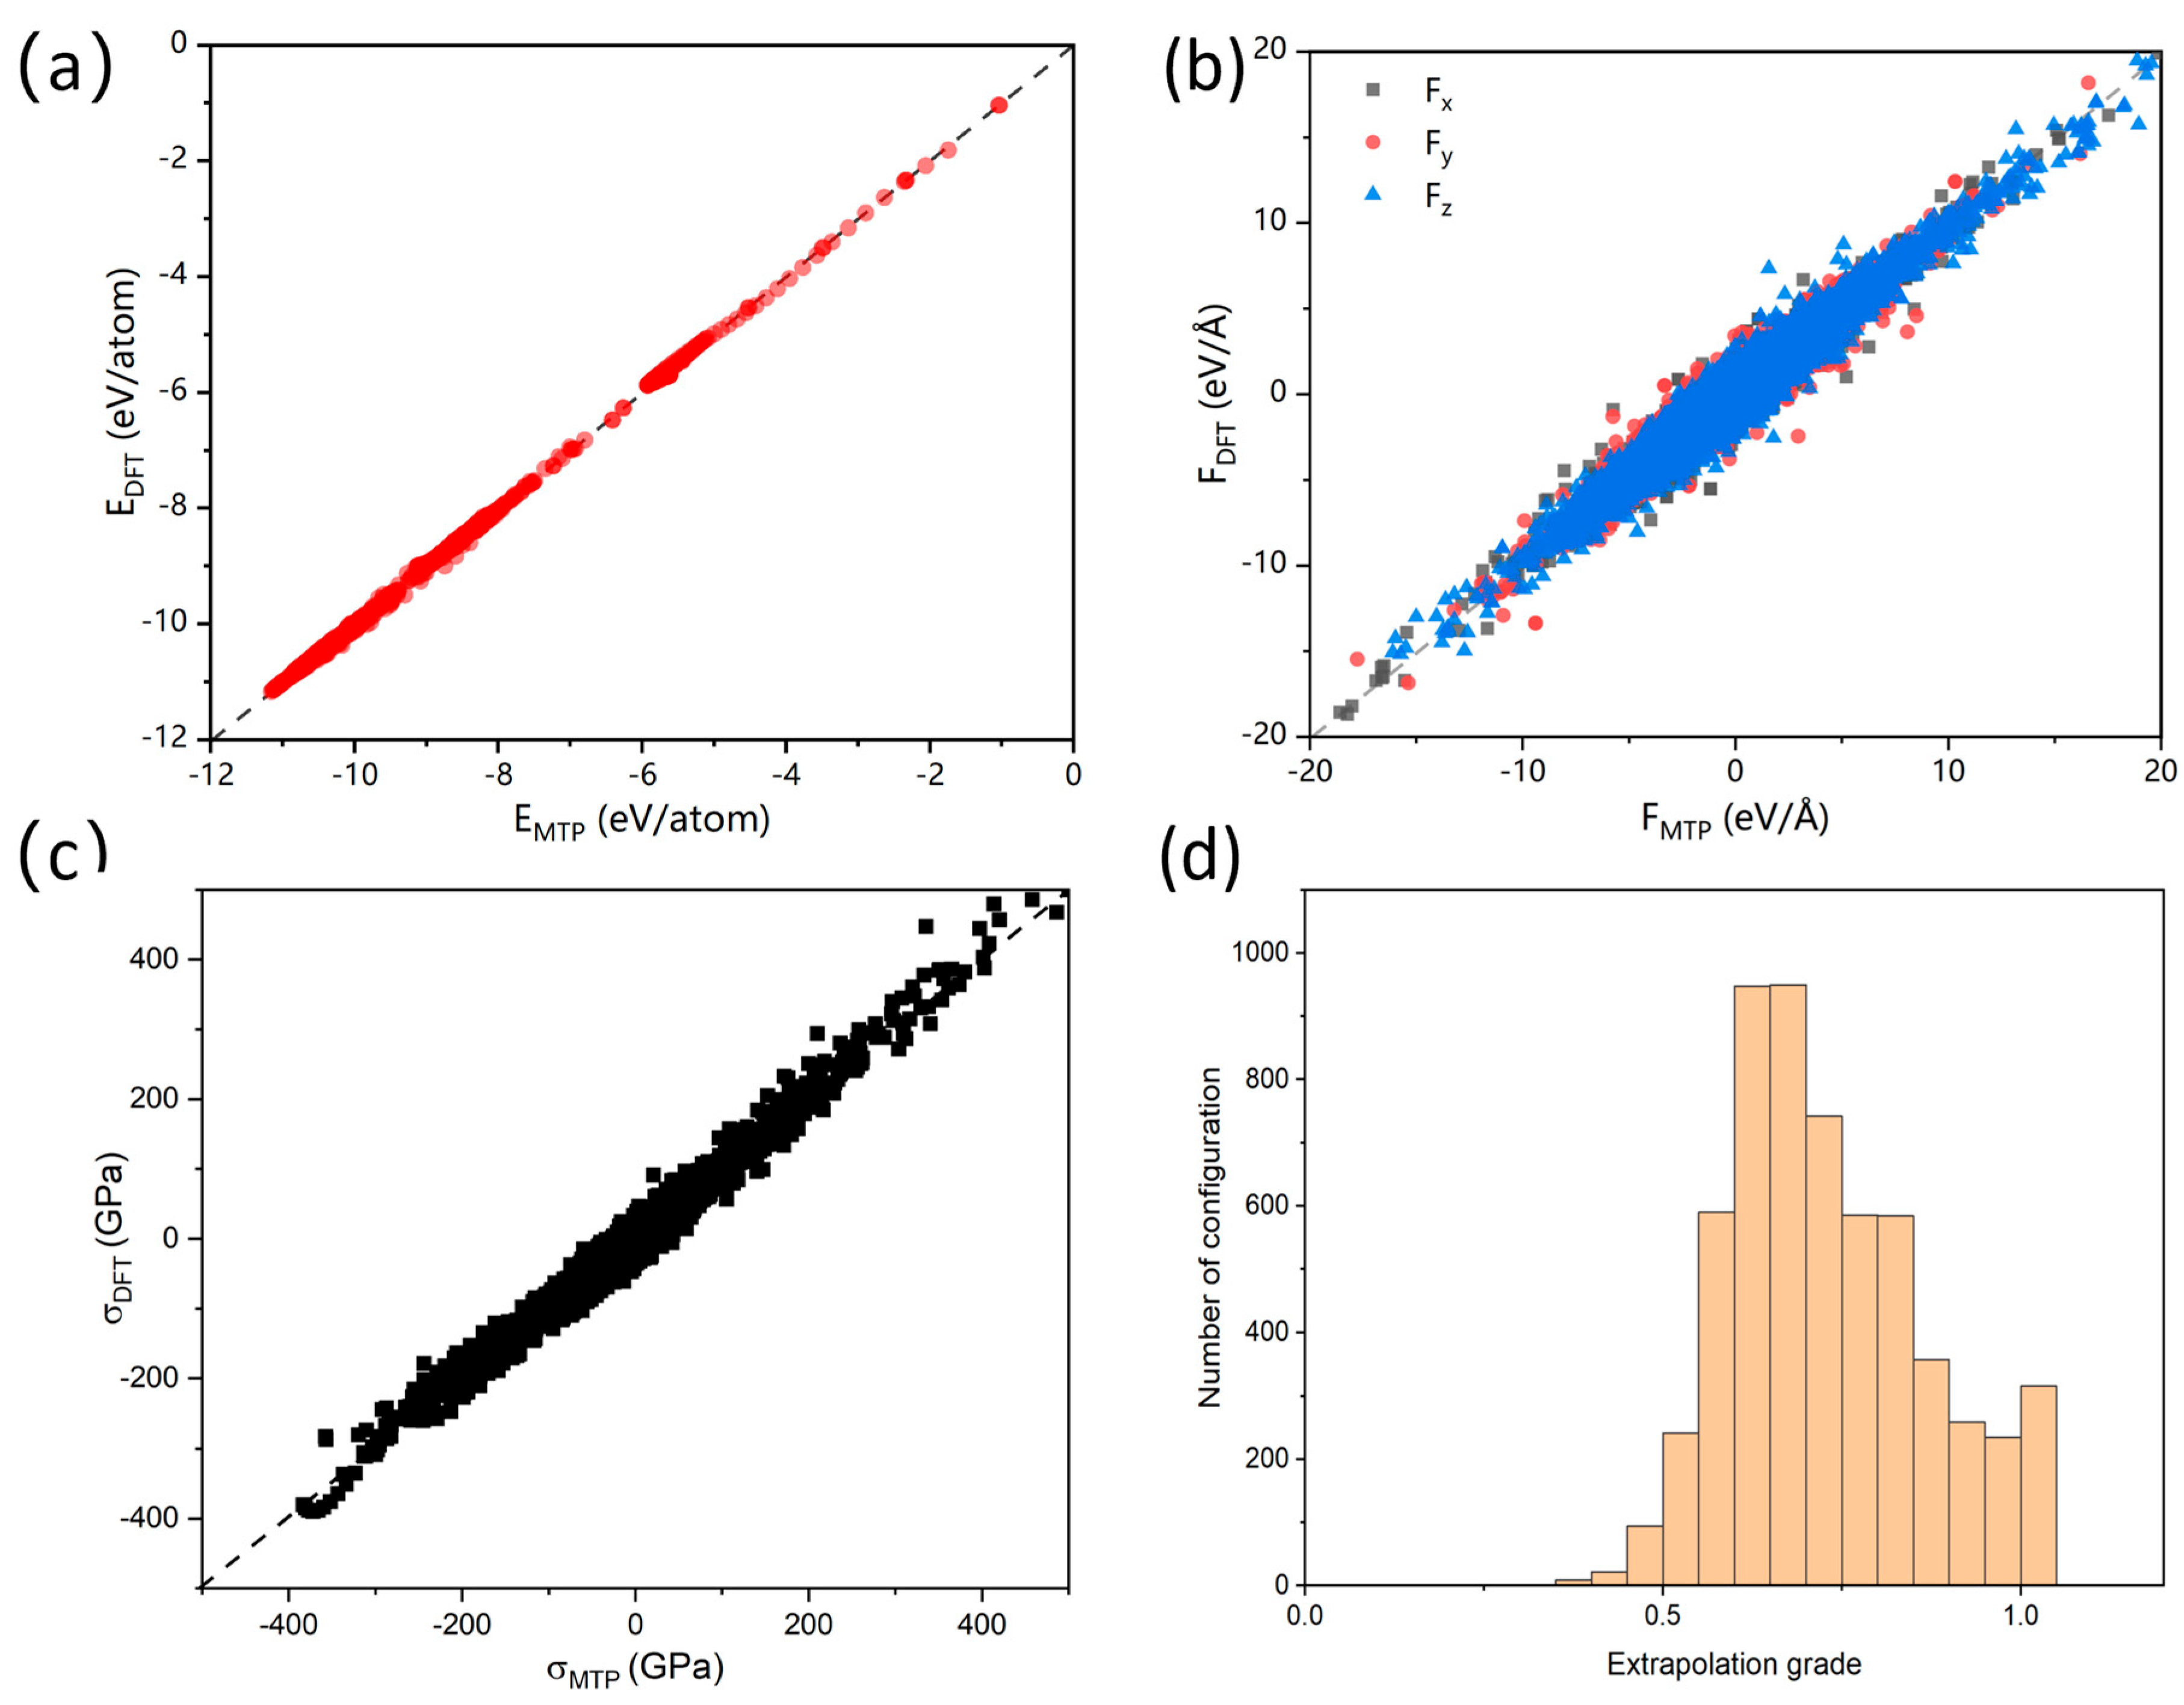
To quantitatively evaluate the fitting performance of the constructed MTP potential, predicted values of energy, atomic forces, and stress tensors were compared with reference values from DFT calculations across the entire training set. The results are presented in Figure 4. The root-mean-square errors (RMSEs) of the model were found to be 13.43 meV/atom for energy and 294 meV/Å for atomic forces, demonstrating high accuracy and consistency in representing the potential energy surface, force fields, and stress responses. The error distributions closely resemble Gaussian profiles with mean values near zero, indicating the absence of systematic bias and strong generalization performance across diverse structures and chemical environments. Our post-analysis shows that for the production MD trajectories in this work, most of the atomic environments have an extrapolation grade <2, which falls well within the interpolation regime defined in the MLIP-3 framework. No configurations exceeded the “strong extrapolation” threshold during any simulation reported here.
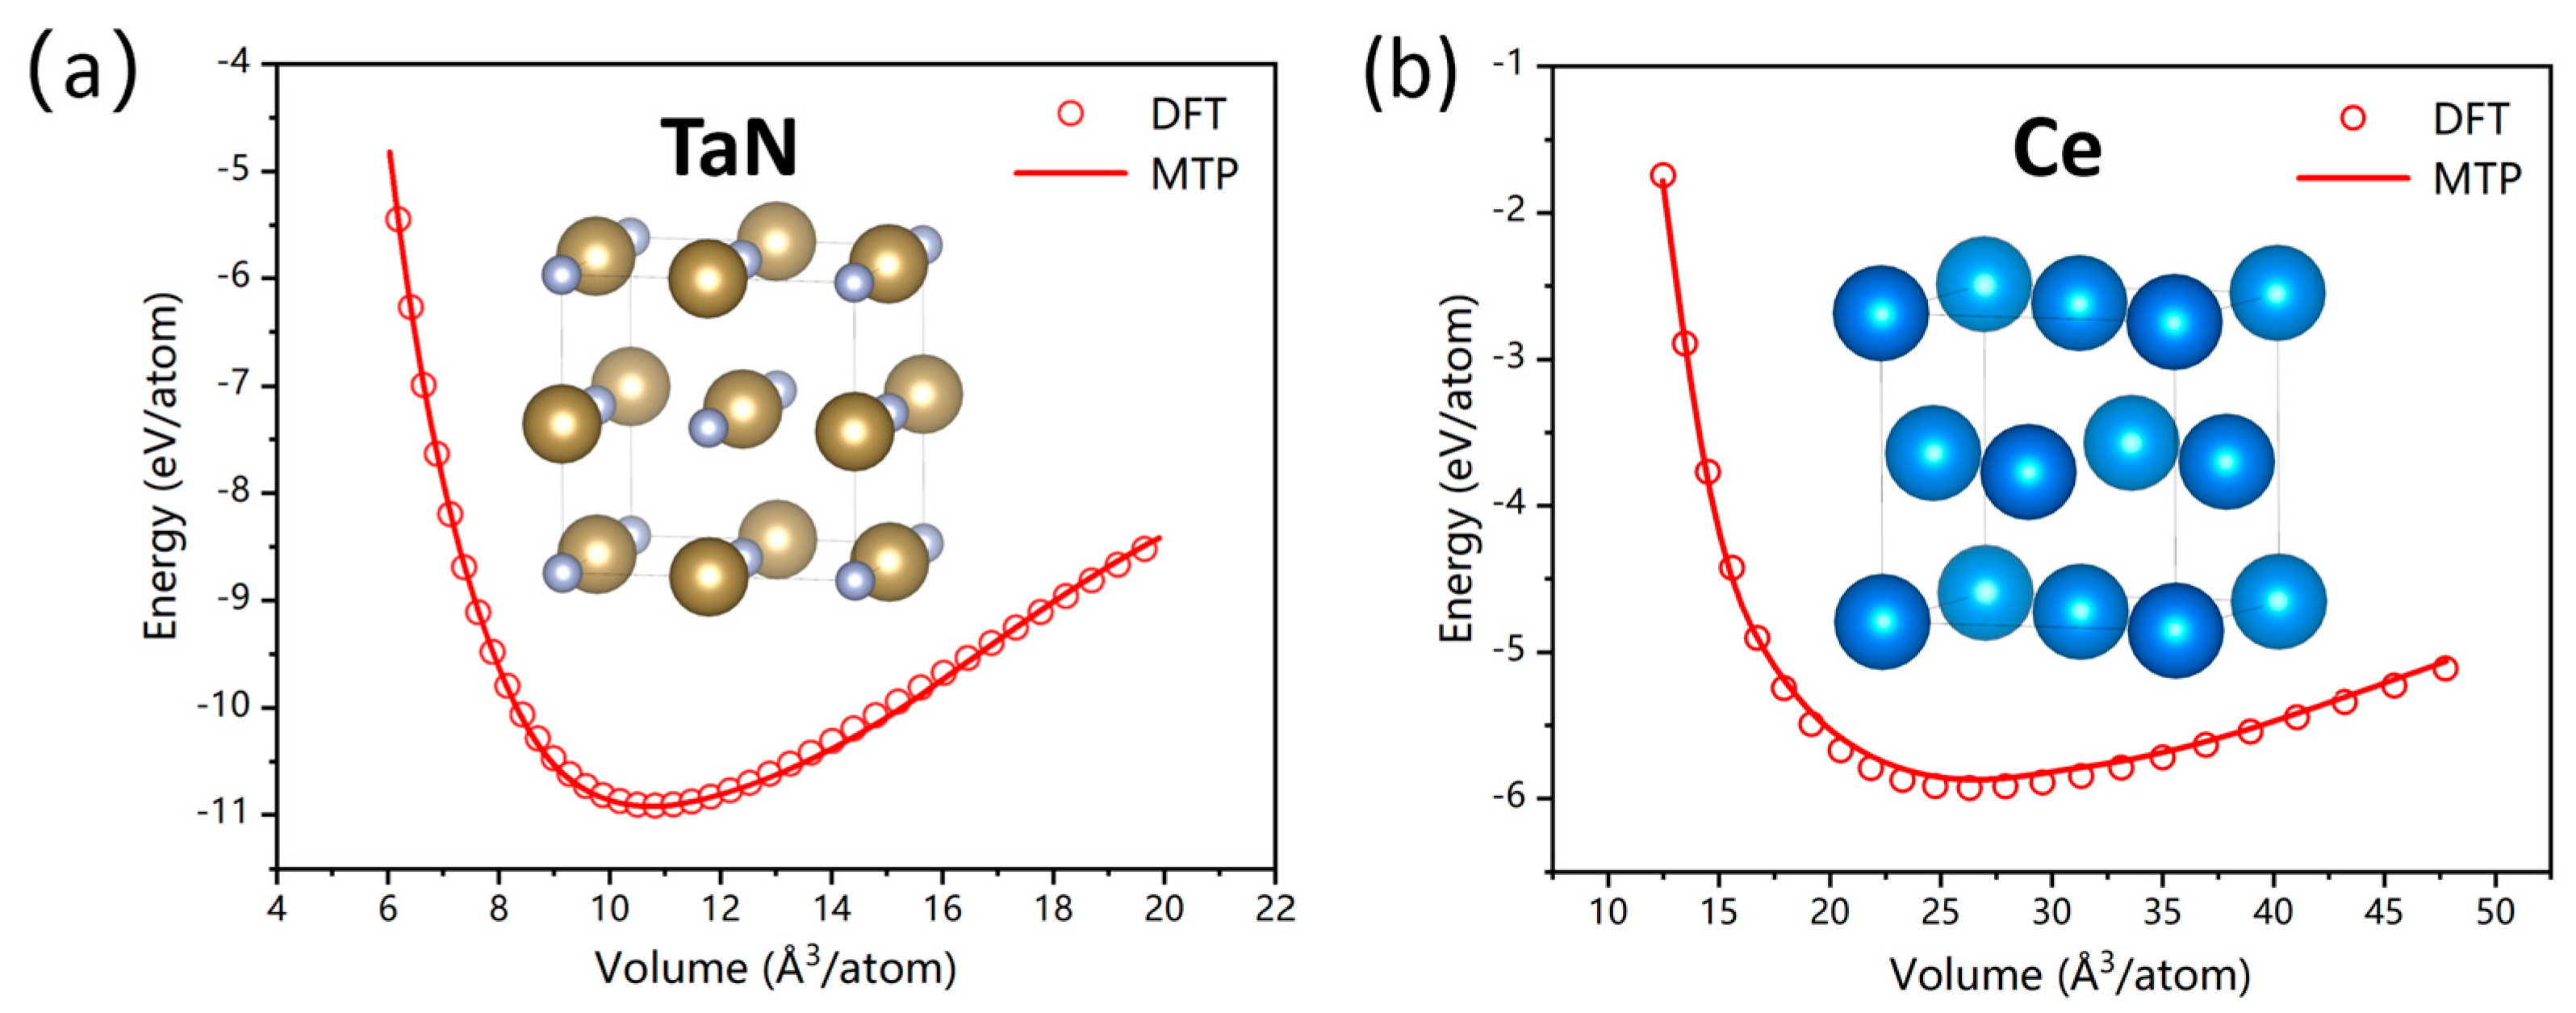
Furthermore, to validate the extrapolation capability of the MTP potential under nonequilibrium conditions, energy-volume (E-V) relations of δ-TaN and liquid Ce under various volumetric strains were computed and compared with DFT results (See Figure 5). The δ-TaN model used in this work adopts the NaCl-type structure, which is known for its high thermal stability. Within a volumetric scaling factor range of 0.78–1.22, the MTP predictions agree well with DFT data, with errors well below typical thermodynamic tolerances. Even in regions outside the training domain (i.e., extrapolated configurations), the MTP potential accurately captures the energy trends, demonstrating its excellent predictive capacity.

3.2. Validation of Basic Physical Properties

To systematically assess the predictive accuracy of the developed MTP potential, a series of key physical properties—such as crystal structure, elastic constants, melting point, and surface energy—were calculated and compared with DFT results and available experimental data. The results are summarized in Table 2.
In terms of lattice constants, the MTP potential accurately predicts the lattice parameter of NaCl-type δ-TaN to be 4.442 Å, which is in agreement with the DFT result, indicating a high level of precision in describing crystal geometry. For elastic constants, both the DFT and MTP stiffness matrix components were calculated using the finite displacement (finite strain) method at 0 K. The MTP prediction for C11 is slightly lower, while that for C12 is higher than DFT values. However, the bulk modulus B shows good agreement, likely due to the compensating effect among elastic components. It should be noted that elastic properties are not the primary focus of this study, and the associated deviations are expected to have limited influence on subsequent interfacial simulations.
The melting point of δ-TaN was estimated using the solid–liquid coexistence method. In this calculation, a simulation cell containing both solid and liquid slabs was constructed and equilibrated. Then, the system was run in the NPH ensemble for 5 ns, and the temperature at which the solid and liquid phases coexist without full melting or recrystallization was taken as the melting point. It yielded a value of 3193 K. This closely matches the experimental value of 3220 K, with a relative error of less than 1%, confirming its reliability in predicting high-temperature structural stability. Similarly, the predicted melting point of Ce was 1110 K, which shows a relative error of 3.9% compared to the experimental value of 1068 K. This is consistent with previous DFT-based calculations by Chen et al. [21], further validating the accuracy of MTP potential near thermodynamic critical points.
For surface properties, the MTP potential successfully reproduces the correct surface energy ordering for different TaN facets: γ(111)-N < γ(001) < γ(110) < γ(111)-Ta, which is fully consistent with DFT predictions. It is worth noting that in nonstoichiometric configurations, surfaces exposing metallic atoms generally exhibit higher surface energies, while N-terminated surfaces show significantly lower energies. This highlights the critical role of surface electronic structure in determining interfacial stability. Based on the surface energy analysis, the (001) surface with the lowest energy and the N-terminated (111) surface with representative polarity were selected as the basis for subsequent solid–liquid interfacial modeling and wetting behavior simulations. This selection not only aligns with energy minimization principles but also reflects experimentally observed preferential orientations, enhancing the realism and interpretability of simulation results.
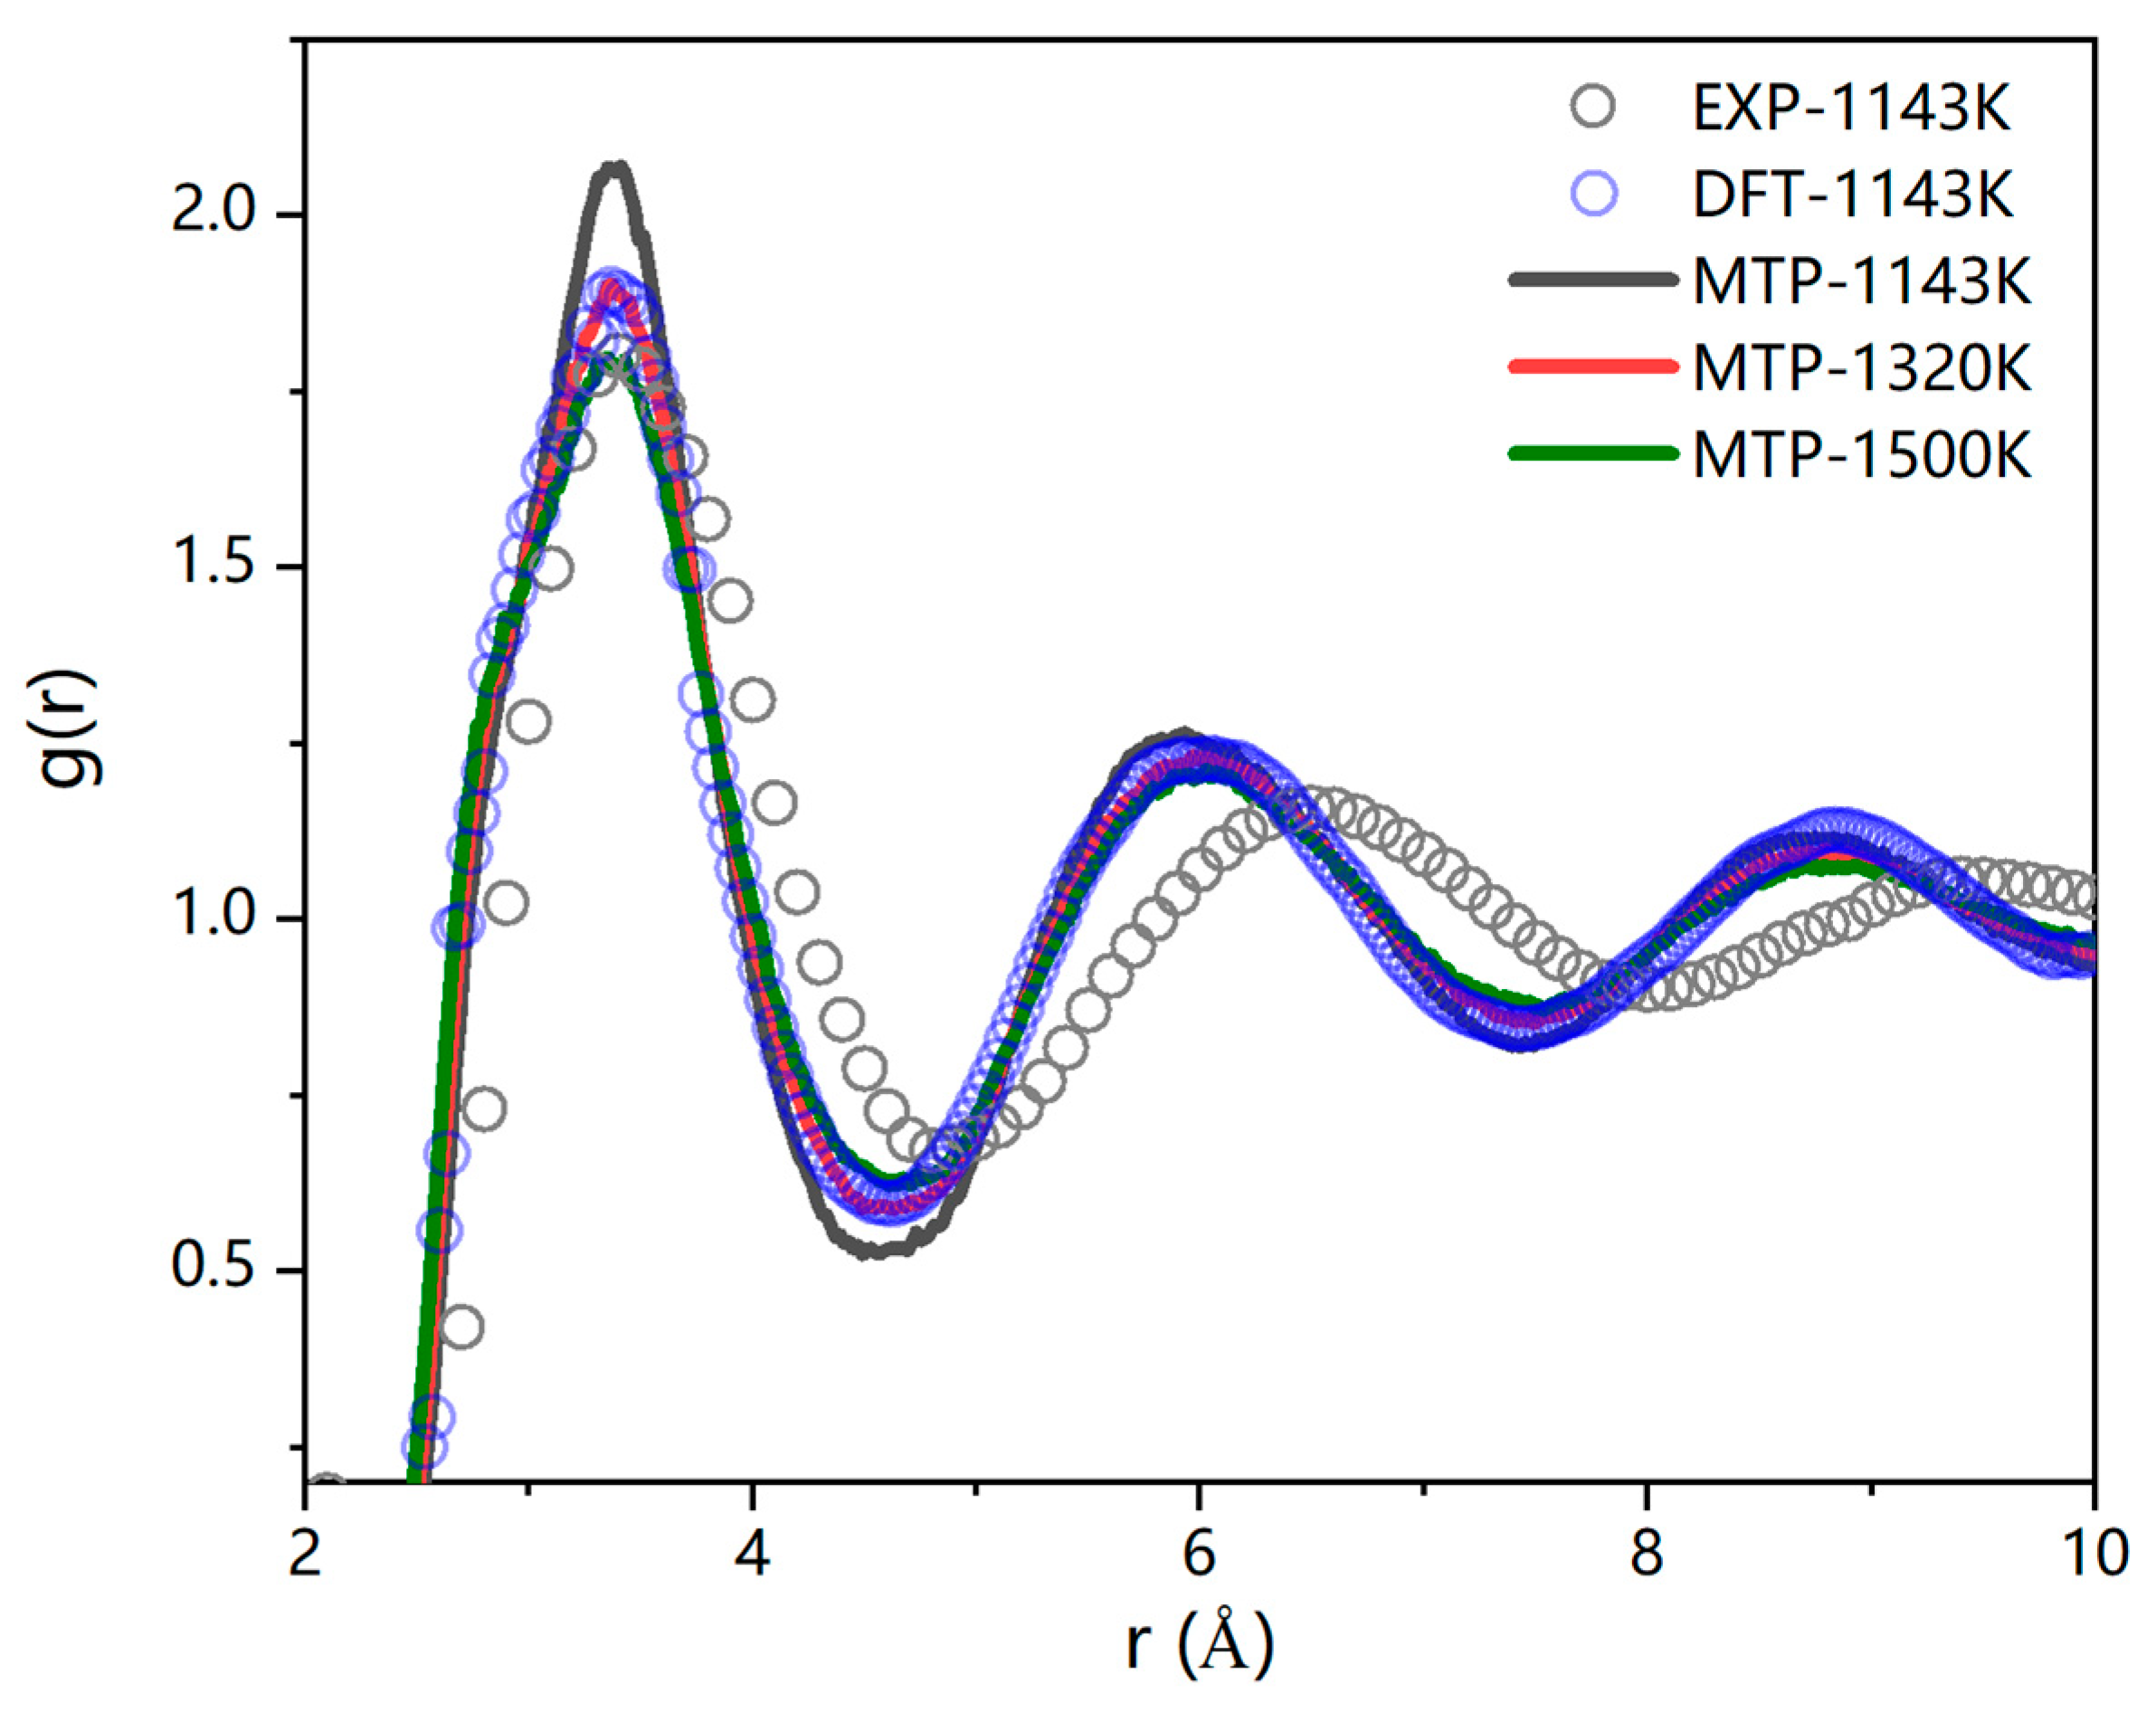
Figure 6 shows the radial distribution function (RDF) of liquid Ce at various temperatures. The results demonstrate that the model accurately reproduces the key microscopic features of liquid Ce, including the peak positions, heights, and widths of the RDF curves, in excellent agreement with DFT calculations. The prominent first-neighbor peak indicates short-range order, while the gradual decay of RDF beyond the first shell signifies long-range disorder, a typical liquid structure. This observation is also consistent with experimental findings reported by Siberchicot et al. [31], confirming that the MTP potential provides a reliable description of local coordination and density distribution in liquid Ce. Then, Ce melts were equilibrated at three representative temperatures: 1143 K, 1320 K, and 1500 K. As shown in Figure 6, increasing temperature leads to a gradual reduction in the height of the first RDF peak and a shallower valley between the first and second peaks, indicating a loss of local order and packing density. Nevertheless, the overall shape of the RDF remains largely unchanged, suggesting the coexistence of short-range order and long-range disorder persists throughout the examined temperature range.
Furthermore, the mean square displacement (MSD) of Ce atoms was calculated at different temperatures, and the corresponding self-diffusion coefficients were extracted using the Einstein relation (See Figure 7). Although the values predicted by the MTP model are slightly higher than experimental measurements, they are consistent in magnitude and temperature dependence, confirming the model’s reliability in capturing dynamic behaviors of liquid Ce.
To sum, the MTP potential developed in this study shows excellent agreement with DFT results for both static and dynamic properties. It accurately captures the structural stability, thermodynamic behavior, and temperature-dependent diffusivity of Ce, providing a solid foundation for simulating complex interfacial and diffusion phenomena in TaN-Ce systems.

3.3. Simulation of the TaN-Ce Solid–Liquid Interface

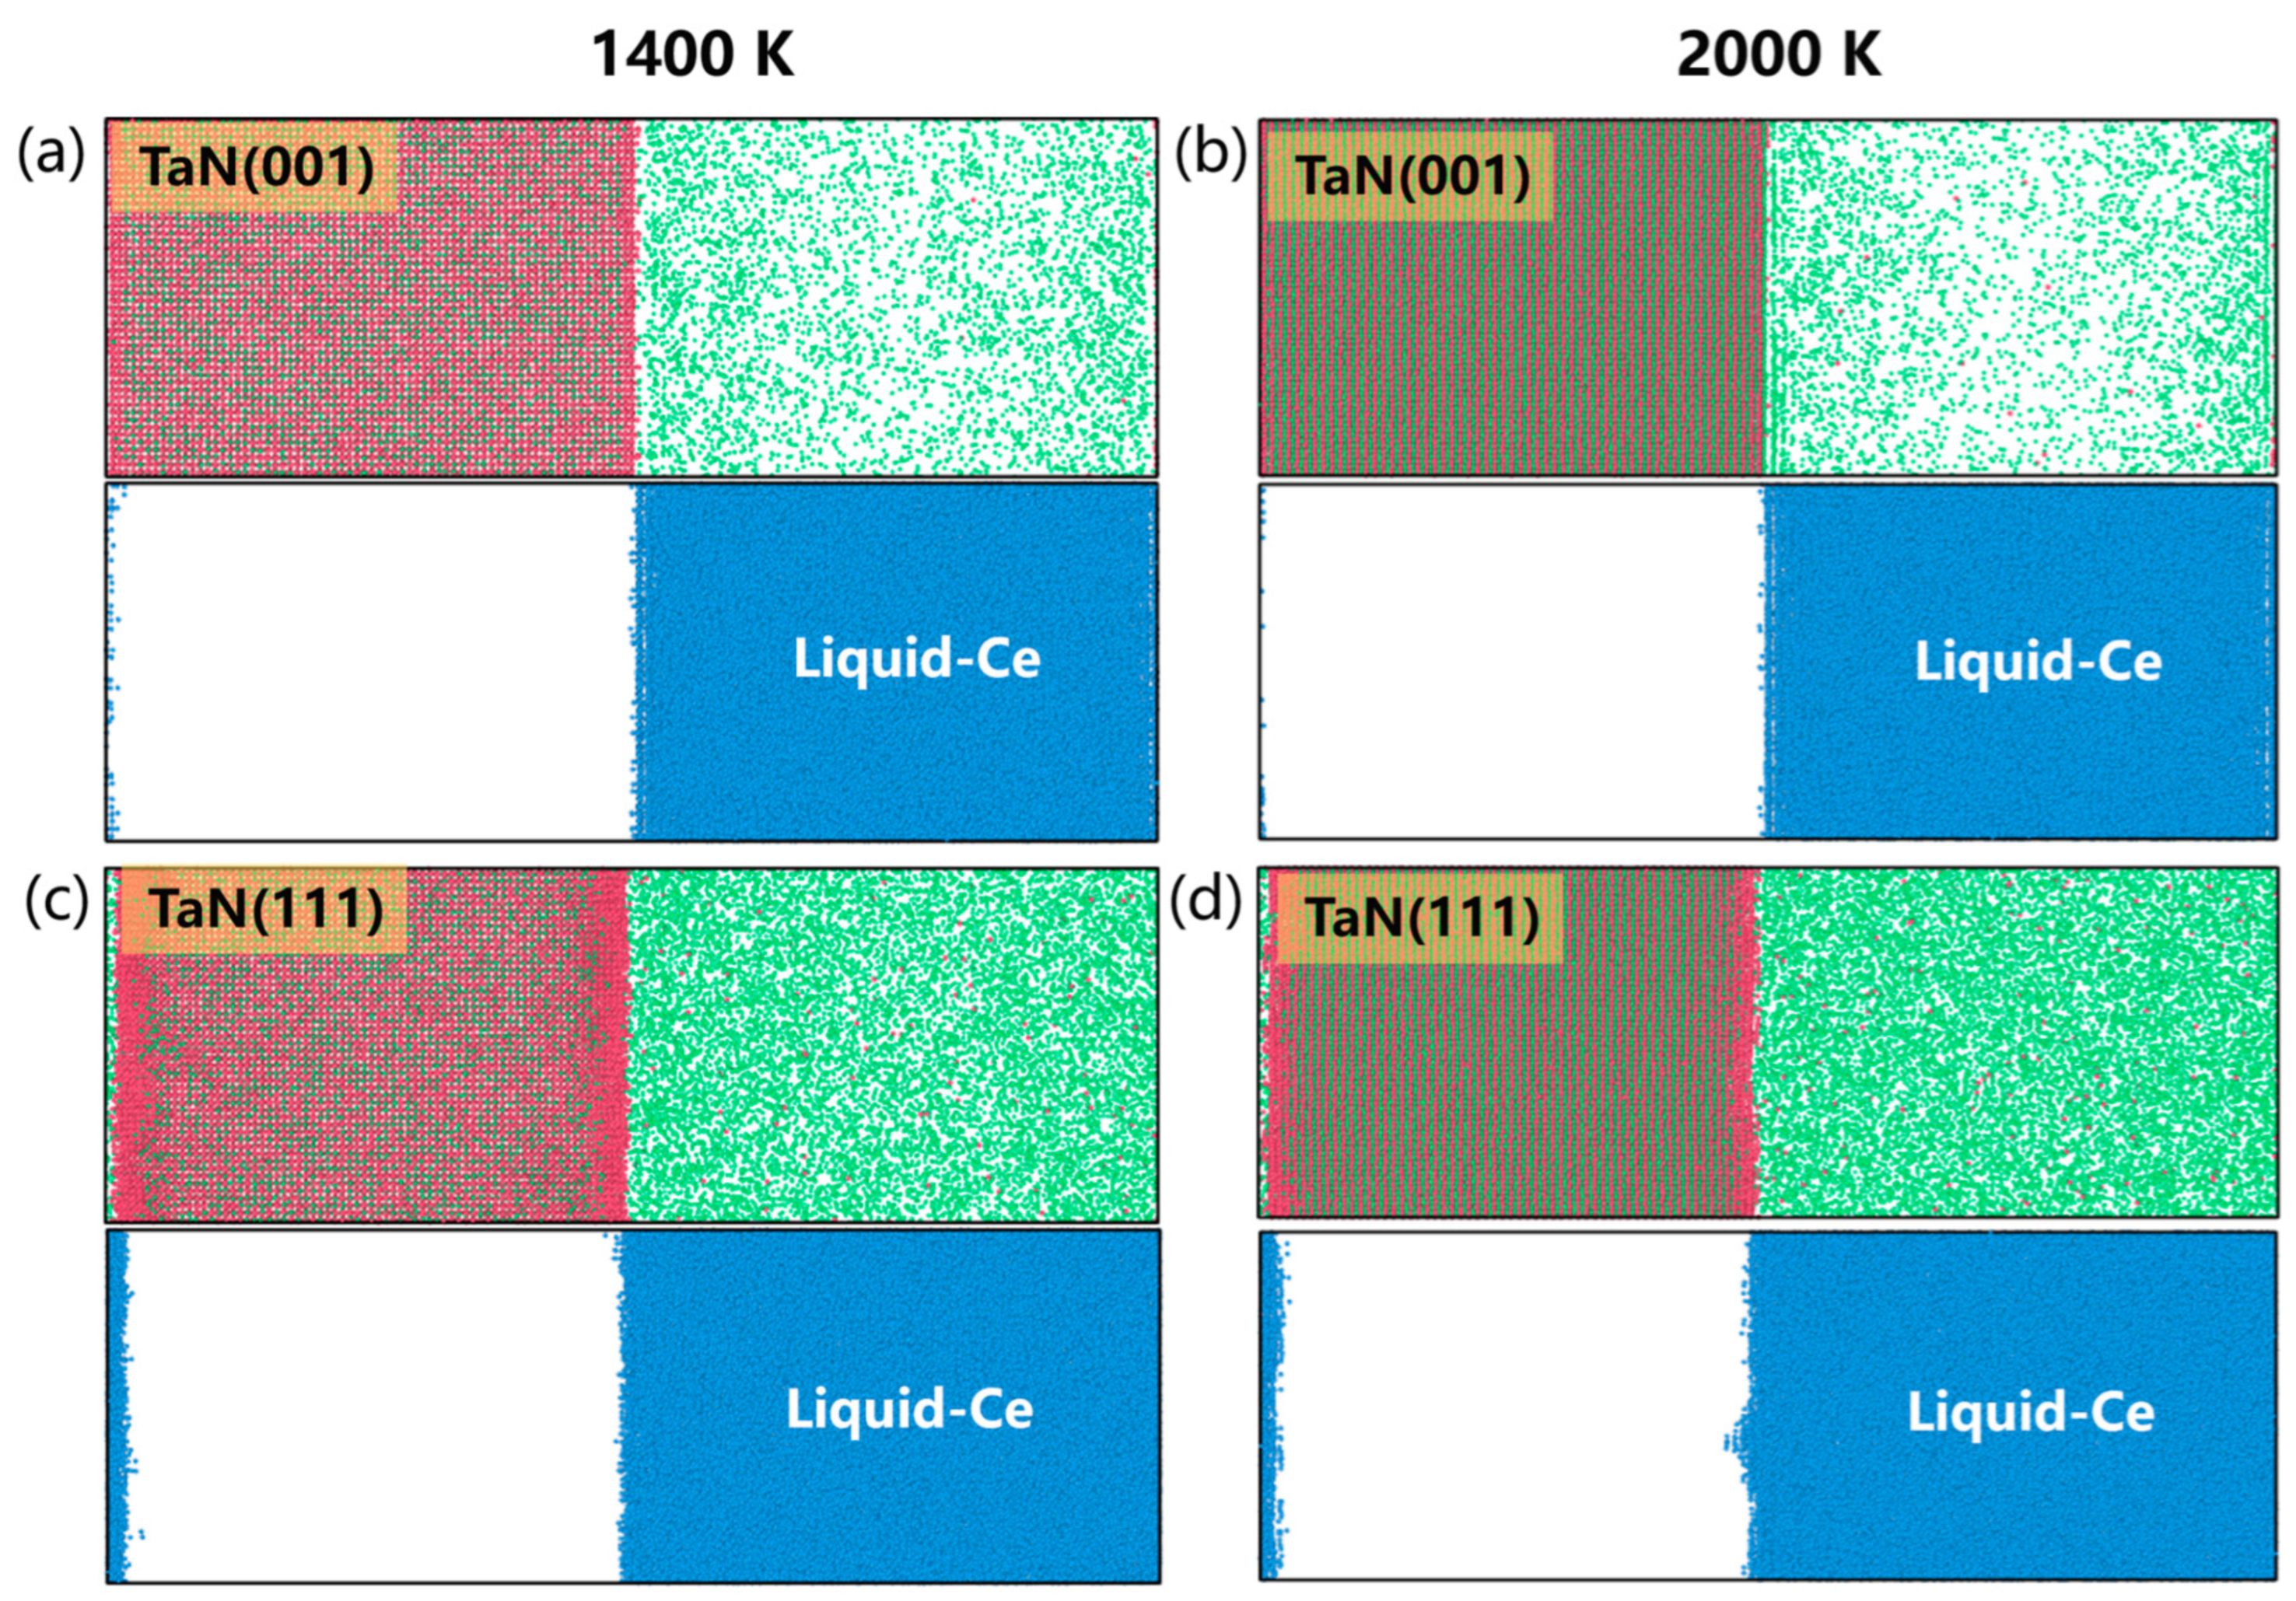
Figure 8 presents atomic snapshots of the TaN(001)/Ce and TaN(111)/Ce solid–liquid interfaces after 3 ns of MD simulation at 1400 K. Red, green, and blue spheres denote Ta, N, and Ce atoms, respectively. The results reveal that TaN exhibits significantly stronger thermal vibrations at high temperature compared to pure Ta [21], with pronounced structural relaxation and thermal disturbance observed on both (001) and (111) surfaces. A prominent “pre-melting” phenomenon appears on both facets, where partial structural disorder occurs on the solid surface even below the bulk melting point. The interfacial region exhibits evident interpenetration between TaN and Ce. N atoms near surface diffuse into the liquid Ce phase, forming an amorphous-like diffusion layer and blurring the original solid–liquid boundary. Although Ce atoms have high diffusivity, their large atomic radius limits deep penetration into the TaN lattice. At elevated temperatures (2000 K), a large number of N atoms migrate into the liquid phase, leaving behind a residual Ta-based network that remains relatively stable throughout the simulation.
By tracking mass loss over time, it was observed that TaN undergoes substantial mass depletion during interfacial reactions, particularly during the initial stage (t < 0.5 ns), where a sharp increase in mass loss indicates rapid escape of surface N atoms. After this point, the rate of loss slows considerably (t > 0.5 ns), marking a transition to a quasi-steady-state diffusion regime. This reflects typical evolution characteristics of the interface, from initial reaction activation to subsequent diffusion stabilization.
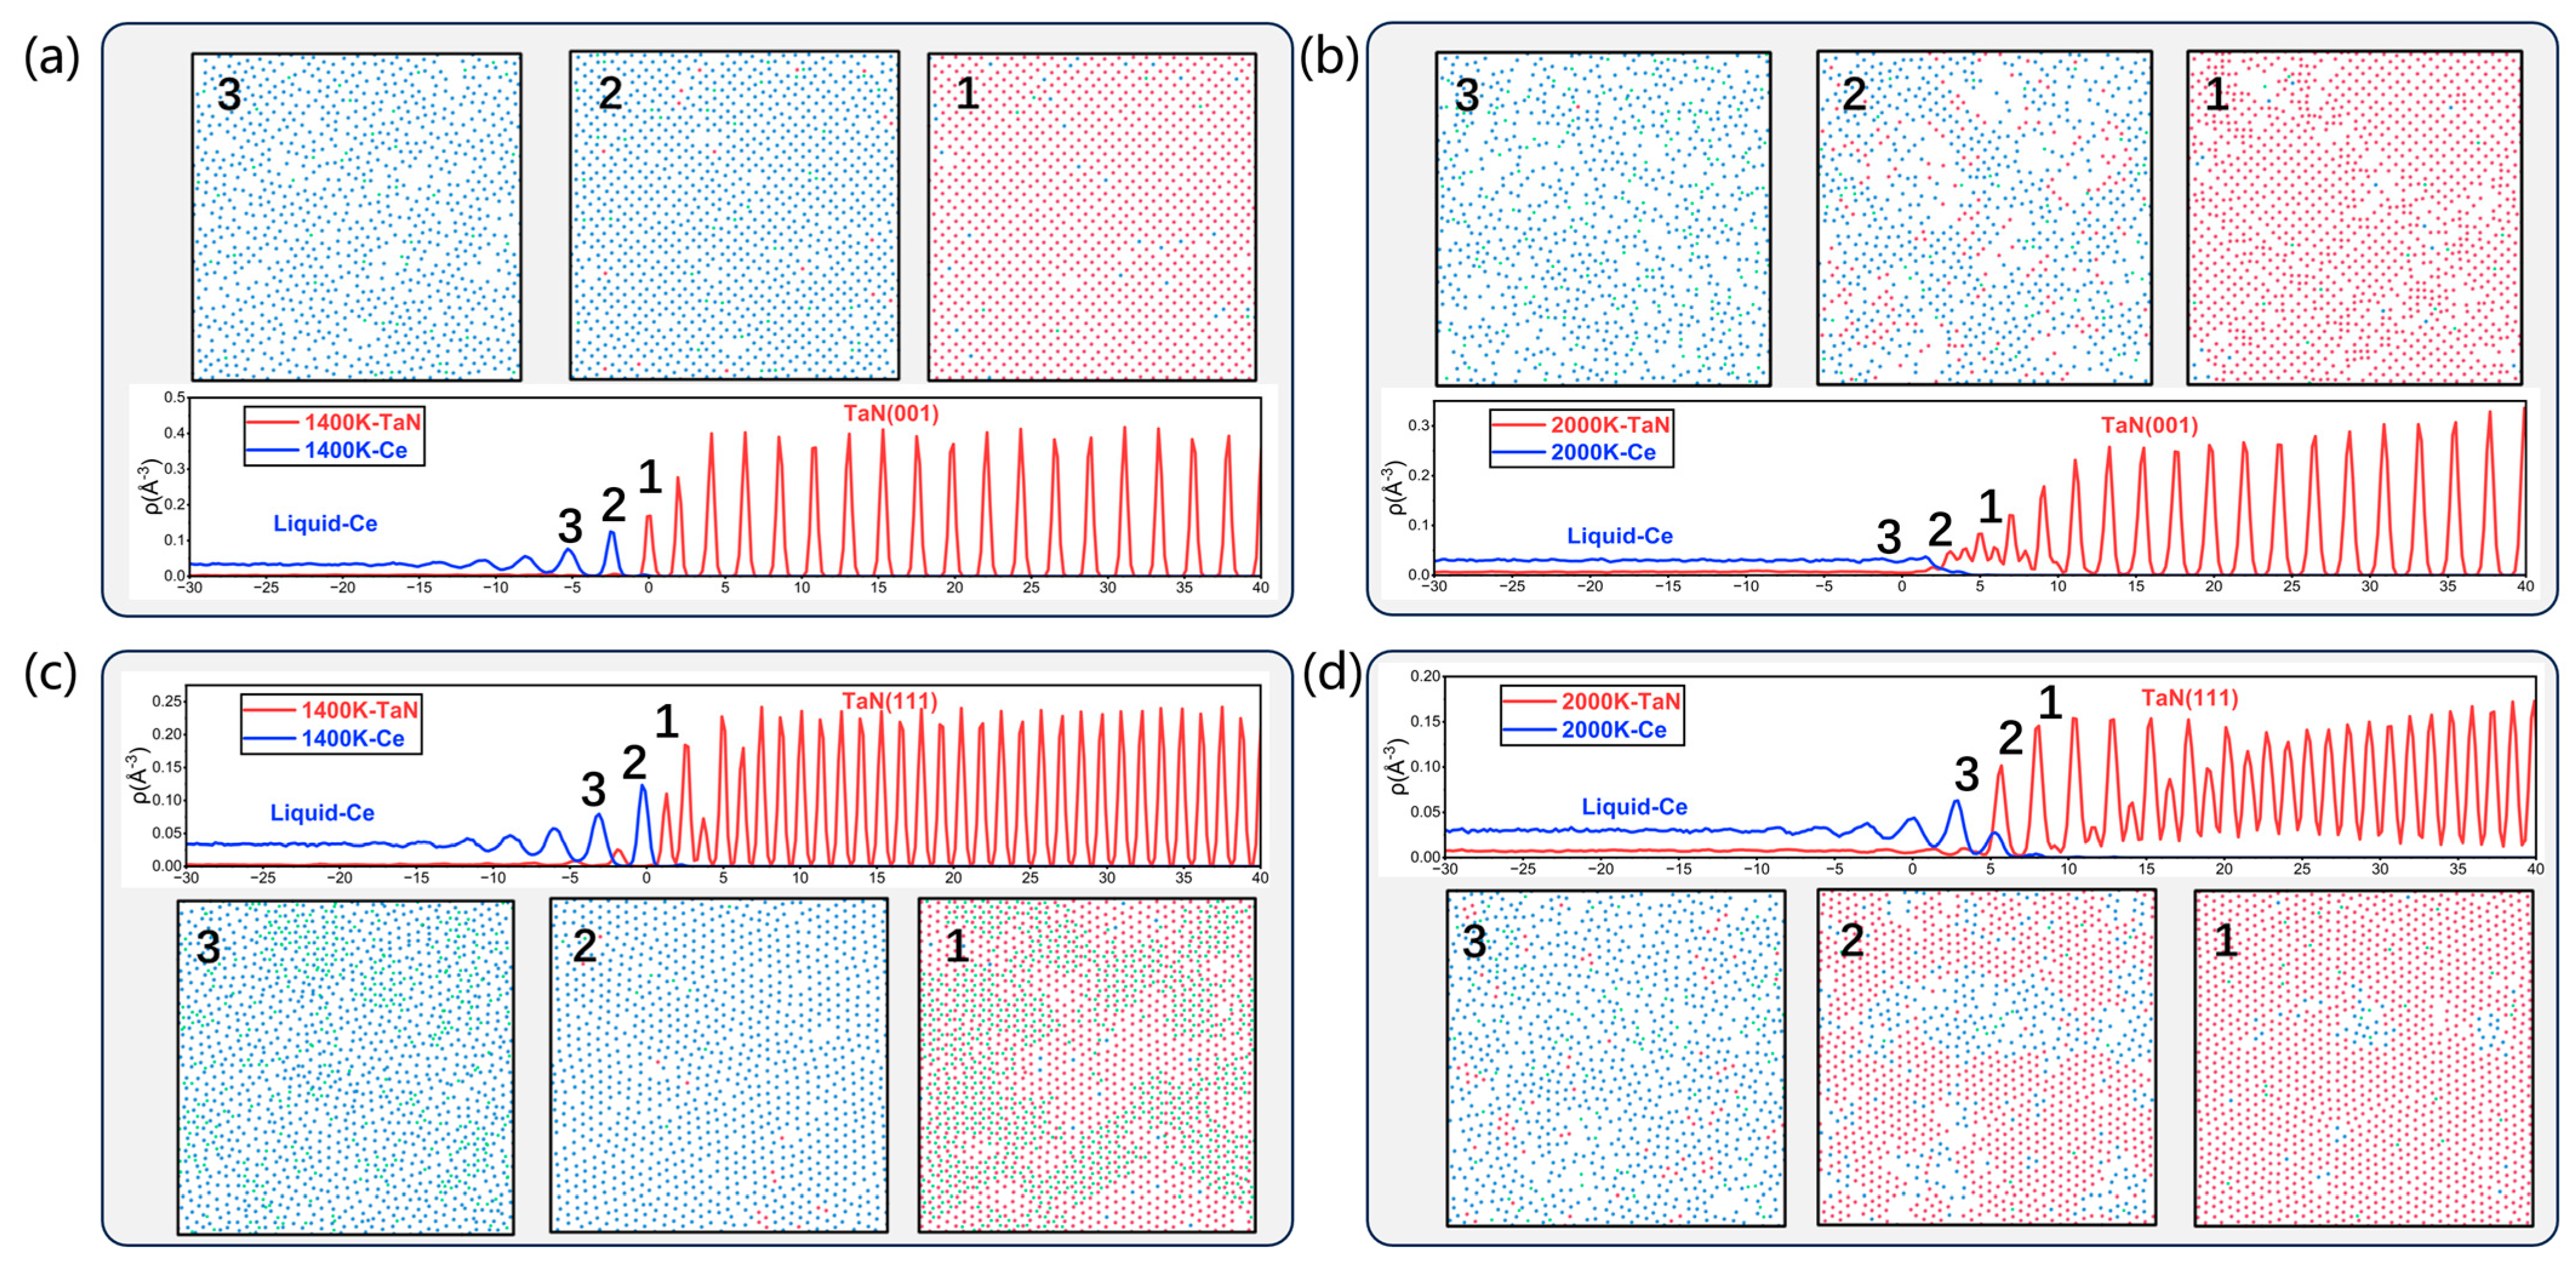
Figure 9 shows the one-dimensional (1D) and two-dimensional (2D) particle number density profiles across the interface. The interface position is defined at z = 0, with z > 0 corresponding to the solid region and z < 0 to the liquid region. The solid side exhibits distinct periodic peaks, indicative of its crystalline layering, while the liquid side shows a smoother, isotropic density distribution, typical of disordered structures.
Near the interface, the density peaks of solid TaN broaden and attenuate, especially for N atoms in the first atomic layer, whose density is significantly reduced and overlaps with the Ce atom distribution. This indicates partial intrusion of Ce atoms into the TaN surface and outward diffusion of N atoms into the liquid, forming a typical amorphous-like interfacial transition layer. Moreover, near the interface, Ce atoms exhibit pre-freezing behavior, with local ordering resembling crystalline symmetry. This suggests that Ce atoms are structurally templated by the TaN surface, leading to interfacial restructuring. Such behavior is widely observed in metal–ceramic systems and has important implications for wetting and interfacial tension. The 2D density maps further reveal the microstructural evolution at the interface. On the TaN(001) surface, most surface N atoms are lost, indicating rapid thermal desorption. On the TaN(111) surface, some N atoms remain in the surface layer, but with reduced peak intensity, suggesting outward diffusion from sub-surface layers and active surface reconstruction. At 2000 K, the interface shows severe disturbance. Ce atoms infiltrate the TaN slab, while Ta and N atoms diffuse into the liquid phase, resulting in extensive interfacial reconstruction and mutual diffusion.
To further quantify the atomic mobility of each component at the TaN-Ce interface, we systematically analyzed the self-diffusion behavior in the interfacial region. In the TaN(001)/Ce and TaN(111)/Ce interface models, the self-diffusion coefficient of Ta atoms was calculated to be approximately 0.001 Å2/ps, which is close to the value observed in pure Ta crystals. This indicates that Ta atoms mainly undergo localized thermal vibrations during the entire simulation, demonstrating excellent thermal stability and resistance to interfacial penetration.
In contrast, the diffusion of N atoms at the interface is significantly enhanced. At 1400 K, the self-diffusion coefficients of N atoms in the TaN(001)/Ce and TaN(111)/Ce systems were 0.087 Å2/ps and 0.109 Å2/ps, respectively—substantially higher than that of Ta atoms, and even exceeding the diffusion coefficient of Ti atoms (~0.05 Å2/ps) in the previously studied Ti/Ce interface system [21]. This highlights the highly mobile nature of nitrogen near the interface, making it a dominant factor in structural reconstruction and chemical evolution at the solid–liquid boundary.
To further accelerate the reaction process at the interface, simulations at 2000 K were also conducted. Despite the intensified thermal agitation, Ta atoms still maintained extremely low diffusivity, comparable to or even lower than the self-diffusion coefficient in bulk Ta (approximately 0.014 Å2/ps). This again confirms the outstanding corrosion resistance and diffusion stability of Ta atoms, making them promising candidates for high-temperature interface applications. In contrast, the diffusion activity of N atoms increased further at 2000 K, showing more frequent interlayer migration. This was particularly pronounced on the (111) surface, where the local lattice experienced noticeable disordering.
These results collectively demonstrate the strong anisotropy and element selectivity of interfacial atomic diffusion in the TaN-Ce system. While Ta atoms exhibit robust resistance to diffusion and corrosion, the high mobility of nitrogen plays a critical role in interfacial degradation, making it the key species driving the structural and chemical evolution of TaN under contact with liquid Ce.

3.4. Wetting Simulation of Liquid Ce Droplets on Ti and Ta Surfaces

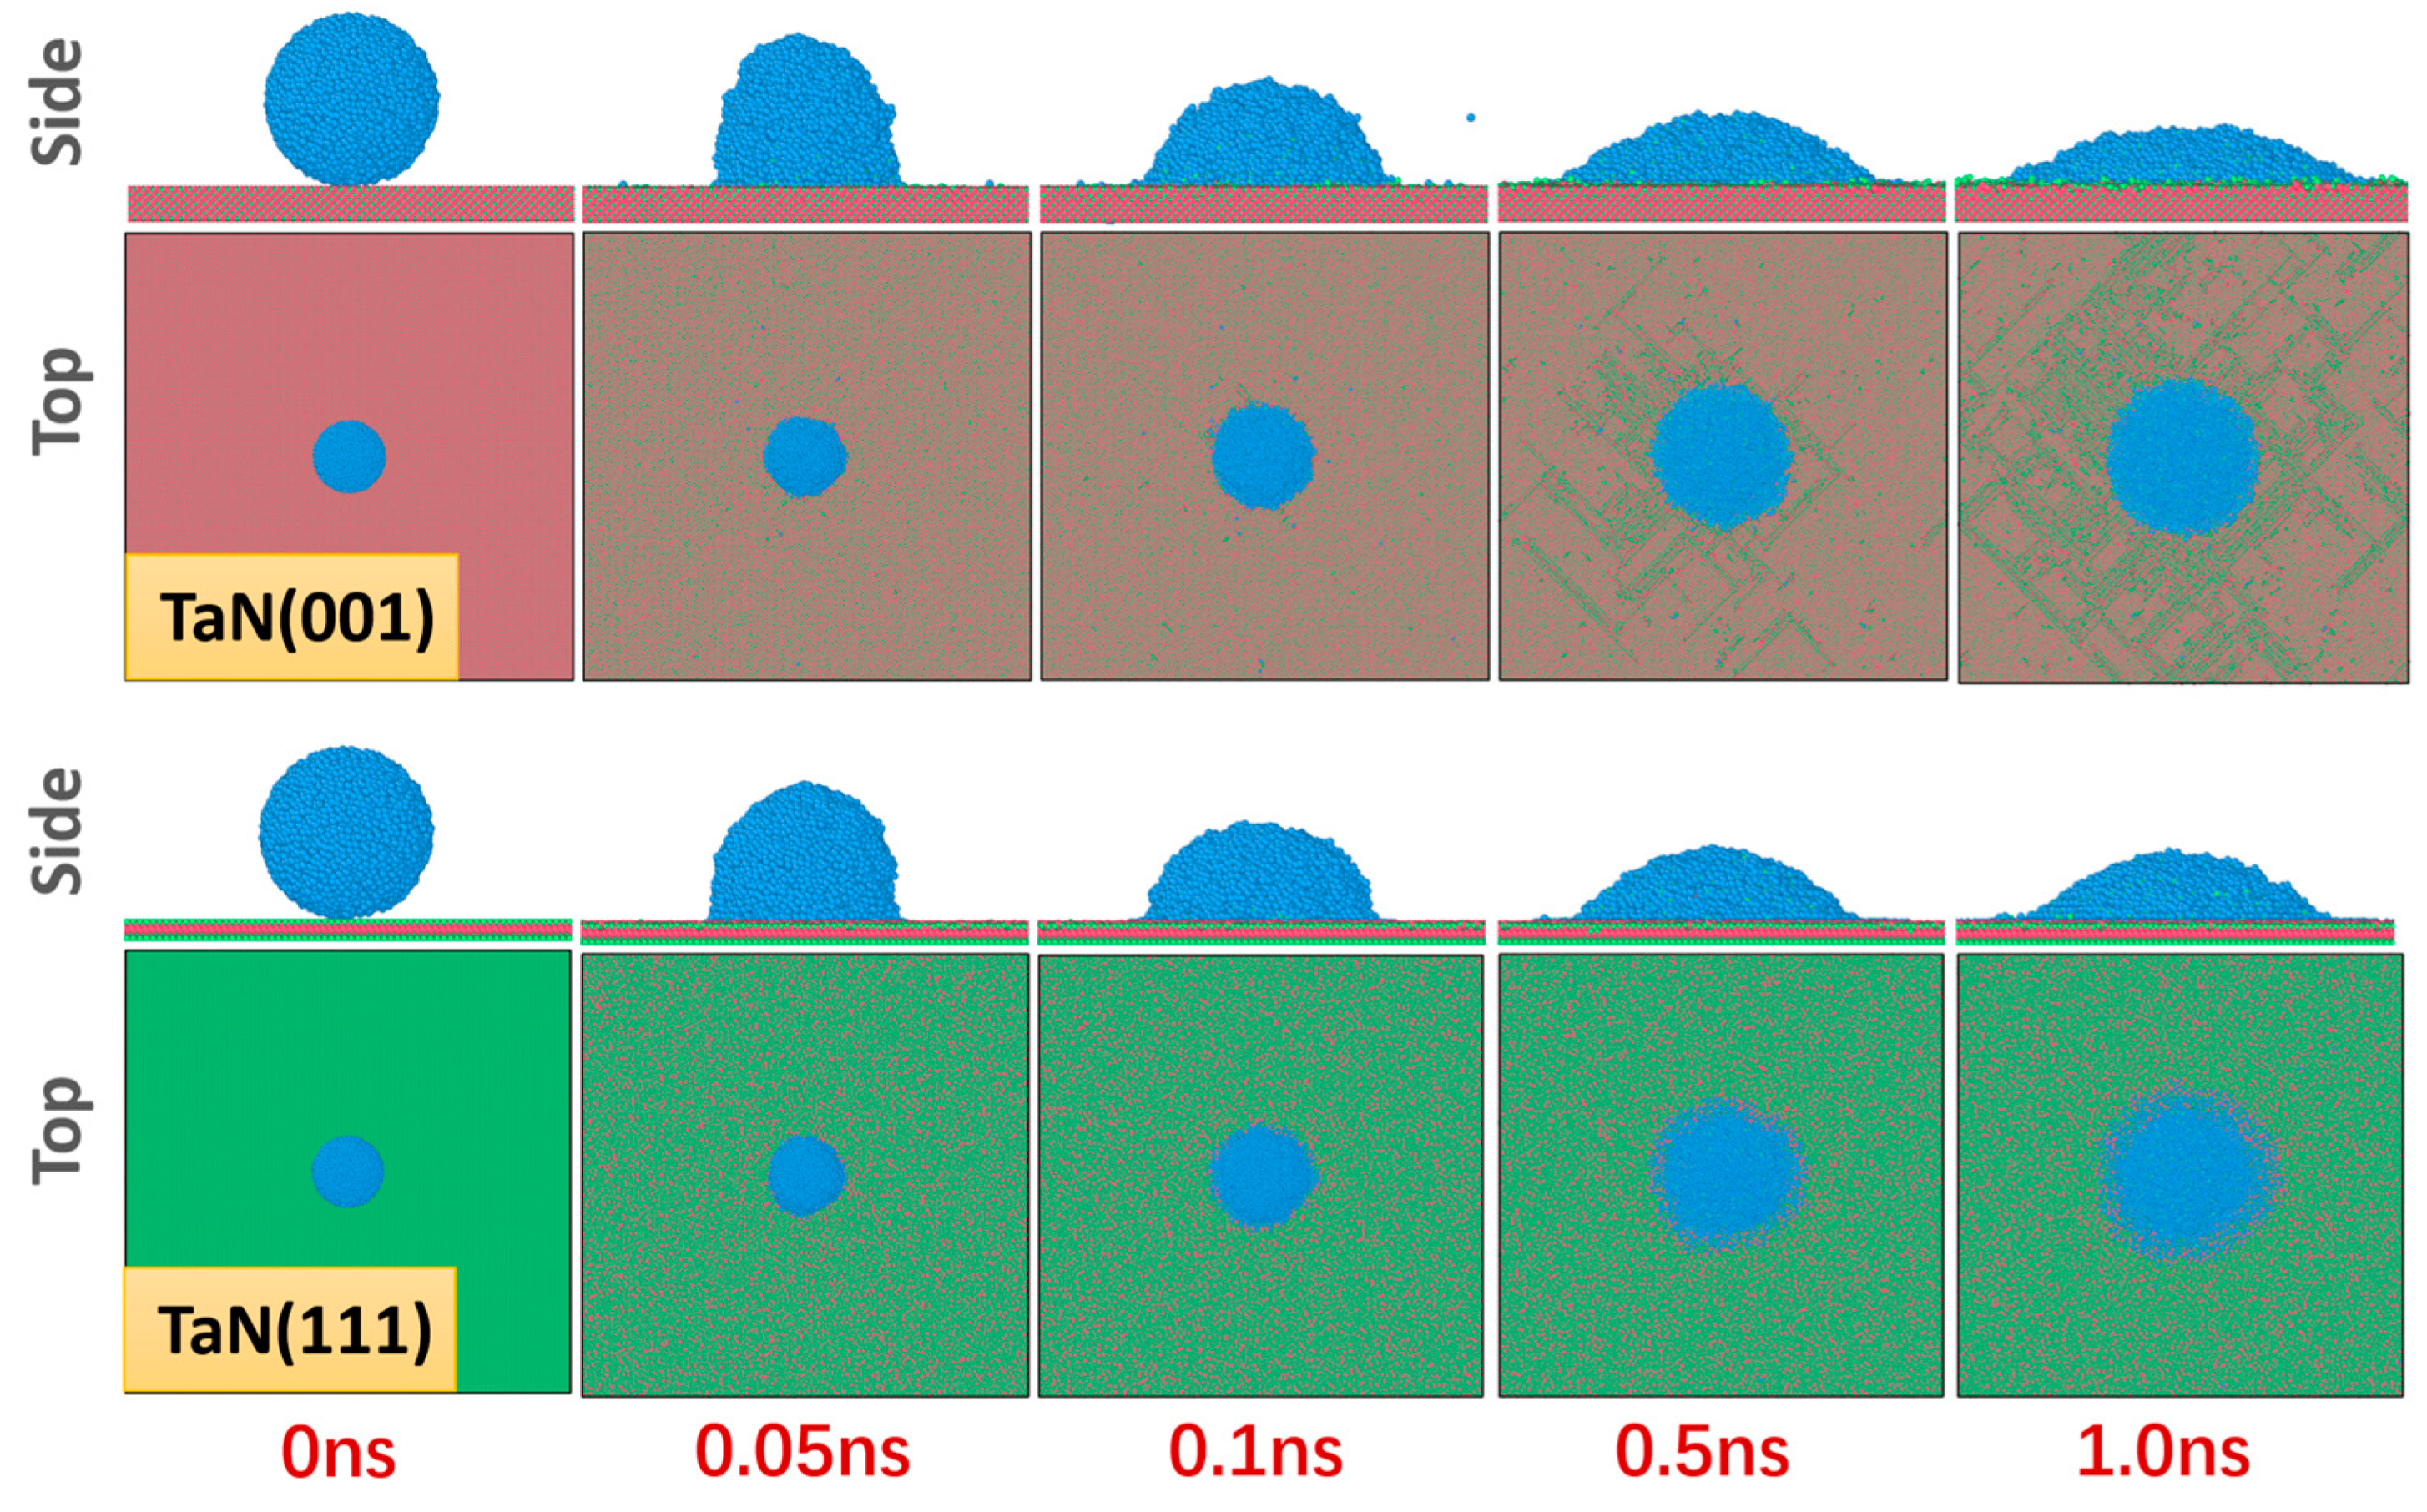
Figure 10 illustrates the wetting process of liquid Ce droplets on TaN(001) and TaN(111) surfaces at 1400 K. Both top and side views of atomic snapshots reveal the spatial distribution and dynamic evolution of the wetting behavior. The simulation results show that, in the early stages of wetting, Ce atoms form a uniformly distributed ultrathin precursor film on the TaN surface. This film rapidly spreads across the interface, typically at a rate faster than the bulk spreading of the droplet itself, which reflects a characteristic interface-driven diffusion mechanism.
As the droplet gradually contacts the TaN surface, a mixed interfacial reaction layer composed of Ce atoms and TaN surface atoms forms. This layer exhibits clear signs of mutual diffusion and chemical interaction. The dynamic evolution is accompanied by localized pre-melting phenomena and the emergence of microscale “corrosion pits” where Ce atoms invade the TaN lattice. These findings indicate that the wetting process involves not only physical adsorption but also chemical reactions and atomic rearrangements at the interface, exemplifying a coupled wetting–corrosion mechanism.
To quantitatively assess the wetting behavior of Ce droplets on TaN surfaces, the classical “θ/2 method” was employed to measure contact angles. In this approach, the droplet profile is approximated as a circular arc, and the contact angle θ is calculated based on the droplet height (h) and the base radius (r) of the triple-phase contact line using the following equation:
θ = 2 arctan h r 180 / π ,
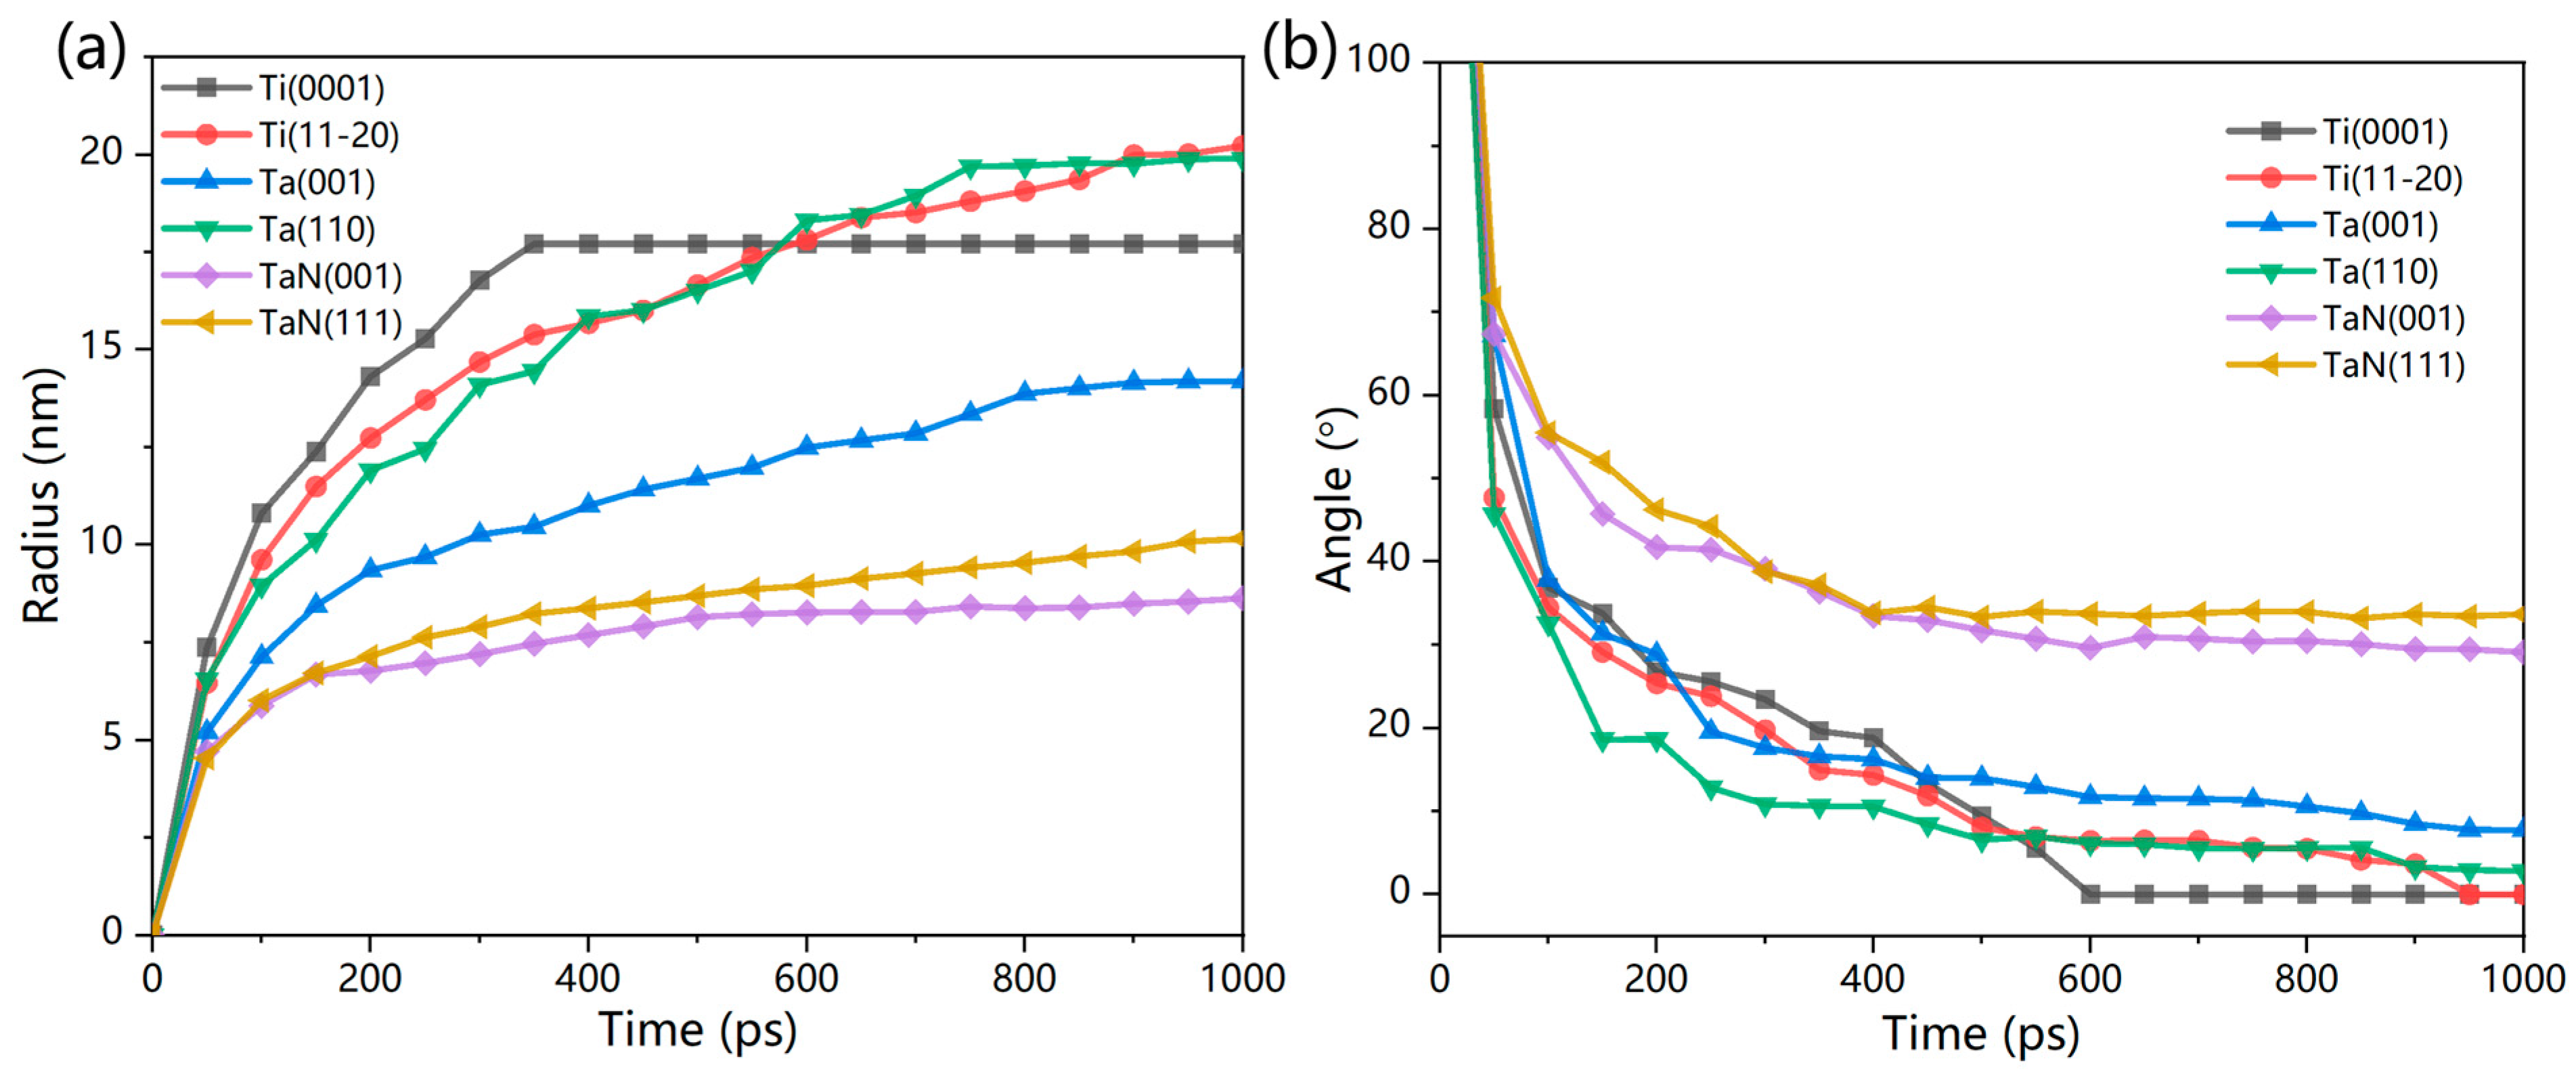
Based on this method, the evolution of the contact angle over time was evaluated for Ce droplets on both surface orientations. The droplet boundaries were reconstructed and fitted using the Quickhull algorithm to ensure geometric accuracy. Figure 11 presents the time-dependent variation in contact angle and spreading radius. The results indicate that Ce exhibits partial wetting behavior on both TaN(001) and TaN(111) surfaces, with nearly isotropic spreading in the lateral directions. At 1 ns, the contact angles on the (001) and (111) surfaces were 29.11° and 33.69°, respectively, suggesting that Ce possesses strong wetting capability toward TaN. Further observation reveals that Ce atoms form multilayer adsorption structures at the interface. One layer of Ce atoms penetrates directly into the TaN surface lattice, while another forms a quasi-crystalline arrangement, creating a well-defined solid–liquid transition zone. This layered structure not only enhances geometric conformity at the interface but also reveals template-induced pre-freezing behavior of Ce atoms on the TaN surface.
The adsorption behavior of Ce atoms on solid surfaces is critical for understanding their corrosive effects. After 1 ns of wetting simulation, Ce atoms preferentially occupy different adsorption sites on the two TaN surfaces. On the (001) surface, Ce atoms tend to occupy the top sites of surface Ta atoms, whereas on the (111) surface, they prefer hollow and bridge sites. This demonstrates site-selective adsorption behavior that reflects the local atomic packing and electronic structure of different crystallographic surfaces. Thus, various representative adsorption configurations were constructed, and the corresponding adsorption energies were calculated using first-principles methods. The results indicate that on the TaN(001) surface, the adsorption energies follow the order: Top > Bridge > Hollow. On the (111) surface, Ce atoms predominantly concentrate near bridge sites, exhibiting stronger directional adsorption preferences. These simulation results are in strong agreement with the DFT calculations, confirming the reliability of the model in predicting adsorption behavior.
However, it is worth noting that during high-temperature wetting, N atoms tend to escape from the TaN surface-especially on the (001) plane-resulting in local lattice distortion and the destruction of stable adsorption sites. Consequently, some Ce atoms are unable to remain at energetically favorable sites, which compromises the overall stability of the wetting process. This reconstruction of adsorption sites further illustrates the decisive role of thermally activated surface atom behavior in determining interfacial structure evolution and wetting dynamics in high-temperature liquid metal–ceramic systems.

4. Conclusions

In this study, a high-accuracy MLP for the TaN-Ce system was developed, which demonstrates excellent performance in predicting structural, thermodynamic, and kinetic properties. Using this potential, molecular dynamics simulations were performed to systematically investigate the structural evolution and wetting behavior at the liquid Ce-TaN interface. At elevated temperatures, the interface undergoes pronounced pre-melting and elemental interdiffusion. Nitrogen atoms exhibit extremely high mobility and play a dominant role in driving interfacial reconstruction and corrosion, whereas Ta atoms demonstrate excellent thermal stability and resistance to penetration. Wetting simulations show that Ce droplets exhibit strong wetting behavior on TaN surfaces, accompanied by the formation of precursor films and site-selective adsorption. These findings offer valuable theoretical insights for the selection and design of crucible materials and the control of wetting behavior in high-temperature metallurgical processes.

Author Contributions

Conceptualization, B.H.; software, J.C. and H.C.; validation, J.C. and H.C.; investigation, Y.Z., J.C., H.C. and X.L.; writing—original draft, Y.Z.; writing—review and editing, X.L. and B.H.; supervision, B.H.; funding acquisition, X.L. All authors have read and agreed to the published version of the manuscript.

Funding

This work was financially supported by the National Key R&D Program of China (2023YFB3003000). Numerical computations were performed at the Hefei advanced computing center and National Supercomputing Center in Changsha.

Data Availability Statement

The original contributions presented in this study are included in the article. Further inquiries can be directed to the corresponding author.

Conflicts of Interest

The authors declare no conflict of interest.

References

  1. Boring, A.M.; Huang, C.Y.; Gschneidner, K.A., Jr.; McGervey, J.D.; Panigrahi, M.; Usmar, S.G. Study of positron lifetimes in α, β and γ cerium at high pressures. J. Magn. Magn. Mater. 1983, 37, L7–L10. [Google Scholar] [CrossRef]
  2. Gschneidner, K.A., Jr.; Pecharsky, V.K. The standard state of cerium. J. Phase Equilibria 1999, 20, 612–614. [Google Scholar] [CrossRef]
  3. Johansson, B.; Luo, W.; Li, S.; Ahuja, R. Cerium: Crystal structure and position in the periodic table. Sci. Rep. 2014, 4, 6398. [Google Scholar] [CrossRef]
  4. Mimura, K.; Sato, T.; Isshiki, M. Purification of lanthanum and cerium by plasma arc zone melting. J. Mater. Sci. 2008, 43, 2721–2730. [Google Scholar] [CrossRef]
  5. Balani, K.; Gonzalez, G.; Agarwal, A.; Hickman, R.; O’Dell, J.S.; Seal, S. Synthesis, microstructural characterization, and mechanical property evaluation of vacuum plasma sprayed tantalum carbide. J. Am. Ceram. Soc. 2006, 89, 1419–1425. [Google Scholar] [CrossRef]
  6. Wang, Y.; Yang, K.; Lyu, X.; Dang, B.; Wei, D.; Zhang, P. Thermal Shock Resistance of Double-glow Plasma Ta/TaC Coating on Graphite Surface. Mater. Rep. 2024, 38, 23080013-9. [Google Scholar]
  7. Nakamura, D.; Suzumura, A.; Shigetoh, K. Sintered tantalum carbide coatings on graphite substrates: Highly reliable protective coatings for bulk and epitaxial growth. Appl. Appl. Appl. Physics Letters 2015, 106, 082108. [Google Scholar] [CrossRef]
  8. Hu, X.; Jiang, G.; Fan, P.; Hu, G.; Xu, G.; Wang, W.; Wang, L.; Zhang, H.; Zhong, M. 1000 °C High-Temperature Wetting Behaviors of Molten Metals on Laser-Microstructured Metal Surfaces. Langmuir 2023, 39, 17538–17550. [Google Scholar] [CrossRef] [PubMed]
  9. Naidich, J.V. The wettability of solids by liquid metals. In Progress in Surface and Membrane Science; Elsevier: Amsterdam, The Netherlands, 1981; Volume 14, pp. 353–484. [Google Scholar]
  10. Gan, X.; Xiao, S.; Deng, H.; Sun, X.; Li, X.; Hu, W. Atomistic simulations of the Fe (001)–Li solid–liquid interface. Fusion Eng. Des. 2014, 89, 2894–2901. [Google Scholar] [CrossRef]
  11. Gan, X.; Xiao, S.; Deng, H.; Wang, B.; Sun, X.; Li, X.; Hu, W. Thermodynamic properties of Li, Pb and Li17Pb83 with molecular dynamics simulations. Fusion Eng. Des. 2014, 89, 2946–2952. [Google Scholar] [CrossRef]
  12. Xu, C.; Meng, X.; Sun, X.; Gan, X.; Li, P.; Xiao, S.; Deng, H.; Li, X.; Hu, W. Atomic scale analysis of the corrosion characteristics of Cu-Li solid-liquid interfaces. J. Alloys Compd. 2018, 763, 1–10. [Google Scholar] [CrossRef]
  13. Lei, Y.; Zhang, J.; Zhang, Y.; Li, X.; Xu, Y.; Wu, X.; Sun, M.; Liu, C.; Wang, Z. An embedded-atom method potential for studying the properties of Fe-Pb solid-liquid interface. J. Nucl. Mater. 2022, 572, 154041. [Google Scholar] [CrossRef]
  14. Xu, S.; Fan, X.; Gu, C.; Shi, Y.; Singh, D.J.; Zheng, W. First principles and molecular dynamics study of Li wetting and diffusion on W surfaces. J. Nucl. Mater. 2020, 539, 152345. [Google Scholar] [CrossRef]
  15. Chen, X.; Sun, X.; Deng, H.; Xiao, S.; Gan, X.; Li, X.; Hu, W. The wetting properties of Li droplet on Cu surfaces: A molecular dynamics study. Comput. Mater. Sci. 2016, 119, 114–119. [Google Scholar] [CrossRef]
  16. Hashibon, A.; Lozovoi, A.Y.; Mishin, Y.; Elsässer, C.; Gumbsch, P. Interatomic potential for the Cu-Ta system and its application to surface wetting and dewetting. Phys. Rev. B—Condens. Matter Mater. Phys. 2008, 77, 094131. [Google Scholar] [CrossRef]
  17. Sun, X.; Xiao, S.; Deng, H.; Hu, W. Molecular dynamics simulation of wetting behaviors of Li on W surfaces. Fusion Eng. Des. 2017, 117, 188–193. [Google Scholar] [CrossRef]
  18. Palafox-Hernandez, J.P.; Laird, B.B.; Asta, M. Atomistic characterization of the Cu–Pb solid–liquid interface. Acta Mater. 2011, 59, 3137–3144. [Google Scholar] [CrossRef]
  19. Yang, Y.; Olmsted, D.L.; Asta, M.; Laird, B.B. Atomistic characterization of the chemically heterogeneous Al–Pb solid–liquid interface. Acta Mater. 2012, 60, 4960–4971. [Google Scholar] [CrossRef]
  20. Yang, G.Q.; Li, J.F.; Shi, Q.W.; Kong, L.T. Structural and dynamical properties of heterogeneous solid–liquid Ta–Cu interfaces: A molecular dynamics study. Comput. Mater. Sci. 2014, 86, 64–72. [Google Scholar] [CrossRef]
  21. Chen, H.; Cai, J.; Zhang, Y.; Lv, X.; Hu, W.; Huang, B. Development of Machine Learning Potentials for Ce-Ti and Ce-Ta Binary Systems and Studies of the Liquid-Solid Interfaces. Corros. Sci. 2025, 246, 112766. [Google Scholar] [CrossRef]
  22. Novikov, I.S.; Gubaev, K.; Podryabinkin, E.V.; Shapeev, A.V. The MLIP package: Moment tensor potentials with MPI and active learning. Mach. Learn. Sci. Technol. 2020, 2, 025002. [Google Scholar] [CrossRef]
  23. Kresse, G.; Furthmüller, J. Efficient iterative schemes for ab initio total-energy calculations using a plane-wave basis set. Phys. Rev. B 1996, 54, 11169. [Google Scholar] [CrossRef]
  24. Kresse, G.; Furthmüller, J. Efficiency of ab-initio total energy calculations for metals and semiconductors using a plane-wave basis set. Comput. Mater. Sci. 1996, 6, 15–50. [Google Scholar] [CrossRef]
  25. Perdew, J.P.; Burke, K.; Ernzerhof, M. Generalized gradient approximation made simple. Phys. Rev. Lett. 1996, 77, 3865. [Google Scholar] [CrossRef] [PubMed]
  26. Plimpton, S. Fast parallel algorithms for short-range molecular dynamics. J. Comput. Phys. 1995, 117, 1–19. [Google Scholar] [CrossRef]
  27. Cheng, B.; Griffiths, R.R.; Wengert, S.; Kunkel, C.; Stenczel, T.; Zhu, B.; Deringer, V.L.; Bernstein, N.; Margraf, J.T.; Reuter, K.; et al. Mapping materials and molecules. Acc. Chem. Res. 2020, 53, 1981–1991. [Google Scholar] [CrossRef] [PubMed]
  28. Mashimo, T.; Tashiro, S.; Toya, T.; Nishida, M.; Yamazaki, H.; Yamaya, S.; Oh-Ishi, K.; Syono, Y. Synthesis of the B1-type tantalum nitride by shock compression. J. Mater. Sci. 1993, 28, 3439–3443. [Google Scholar] [CrossRef]
  29. Ren, F.; Wang, Y. Pressure-induced phase transition of tantalum mononitride. Thin Solid Films 2011, 519, 3954–3958. [Google Scholar] [CrossRef]
  30. Liu, C.; Jin, N.; Li, Z.; Liu, X. First-principles calculations on the electronic structure and bonding nature of TaN (111)/TiN (111) interface. J. Alloys Compd. 2017, 717, 326–332. [Google Scholar] [CrossRef]
  31. Siberchicot, B.; Clerouin, J. Properties of hot liquid cerium by LDA+Umolecular dynamics. J. Phys. Condens. Matter 2012, 24, 455603. [Google Scholar] [CrossRef]
  32. Dariel, M.P.; Dayan, D.; Languille, A. Self-Diffusion in fcc γ-and bcc δ-Cerium. Phys. Rev. B 1971, 4, 4348. [Google Scholar] [CrossRef]
Figure 1. Schematic workflow of machine learning potential training.
Metals 15 00972 g001
Figure 2. Schematic illustrations of model construction: (a) TaN-Ce solid–liquid interface model and (b) wetting model with liquid Ce droplet on TaN surface.
Metals 15 00972 g002
Figure 3. t-SNE clustering analysis of the training dataset used for machine learning potential development.
Metals 15 00972 g003
Figure 4. Comparison of the MTP potential and DFT results: (a) energy, (b) force, (c) stress, (d) the extrapolation grade of the training datasets.
Metals 15 00972 g004
Figure 5. Energy–Volume curve for (a) TaN and (b) fcc-Ce.
Metals 15 00972 g005
Figure 6. Radial distribution functions of liquid Ce at different temperatures. Adapted from Ref. [31].
Metals 15 00972 g006
Figure 7. The calculated and experimental (Adapted from Ref. [32]) self-diffusion coefficients with the relation of temperature.
Metals 15 00972 g007
Figure 8. Snapshots of TaN-Ce solid–liquid interfaces after 3.0 ns of simulation at various temperatures. (Red: Ta. Green: N. Blue: Ce. For clarity, Ce atoms (top) and TaN atoms (bottom) are hidden). (a) TaN(001)-Ce at 1400 K, (b) TaN(001)-Ce at 2000 K, (c) TaN(111)-Ce at 1400 K, and (d) TaN(111)-Ce at 2000 K.
Metals 15 00972 g008
Figure 9. One-dimensional and two-dimensional particle number density maps of the TaN-Ce interface. (a) TaN(001)-Ce at1400 K, (b) TaN(001)-Ce at 2000 K, (c) TaN(111)-Ce at 1400 K, and (d) TaN(111)-Ce at 2000 K.
Metals 15 00972 g009
Figure 10. Snapshots of the TaN-Ce wetting model at different simulation times.
Metals 15 00972 g010
Figure 11. (a) Time evolution of the spreading radius and (b) contact angle of Ce droplets on Ti, Ta, and TaN surfaces. Data for Ti and Ta adapted from Ref. [21].
Metals 15 00972 g011
Table 1. Geometrical parameters of TaN/Ce solid–liquid interface models.
InterfaceNumber of Ta and N AtomsNumber of Ce AtomsLx (Å)Ly (Å)Lz (Å)
TaN(001)-Ce163,58461,952107.842107.842319.640
TaN(111)-Ce161,84061,952109.189108.177315.519
Lx, Ly and Lz are the lengths of the simulation box along three directions, respectively.
Table 2. Comparison of fundamental physical properties predicted by the potential.
PropertiesNaCl-Type TaN
ReferenceDFTMTP
a (Å)4.336 [28]4.4424.442
C11 (GPa)772 [29]753.0646.4
C12 (GPa)132 [29]120.2185.8
C44 (GPa)65 [29]56.537.7
B (GPa)345 [29]331.1339.3
Melting point (K)3220 3193
γ s (001) (J/m2) 1.5801.583
γ s (110) (J/m2) 2.2132.302
γ s (111)Ta (J/m2) 2.4222.525
γ s (111)N (J/m2)1.25 [30]1.1941.334
Disclaimer/Publisher’s Note: The statements, opinions and data contained in all publications are solely those of the individual author(s) and contributor(s) and not of MDPI and/or the editor(s). MDPI and/or the editor(s) disclaim responsibility for any injury to people or property resulting from any ideas, methods, instructions or products referred to in the content.